Analysis of Non-Genetic Factors Affecting Wood’s Model of Daily Milk Fat Percentage of Holstein Cattle
Abstract
1. Introduction
2. Materials and Methods
2.1. Farm and Animal Information
2.2. Data Source
2.3. Statistical Analysis
3. Results
3.1. Effects of Different Factors on Milk Fat Percentage of Holstein Cattle
3.2. Effects of Different Factors on Lactation Curve and Fitting Parameters of Daily Milk Fat Percentage
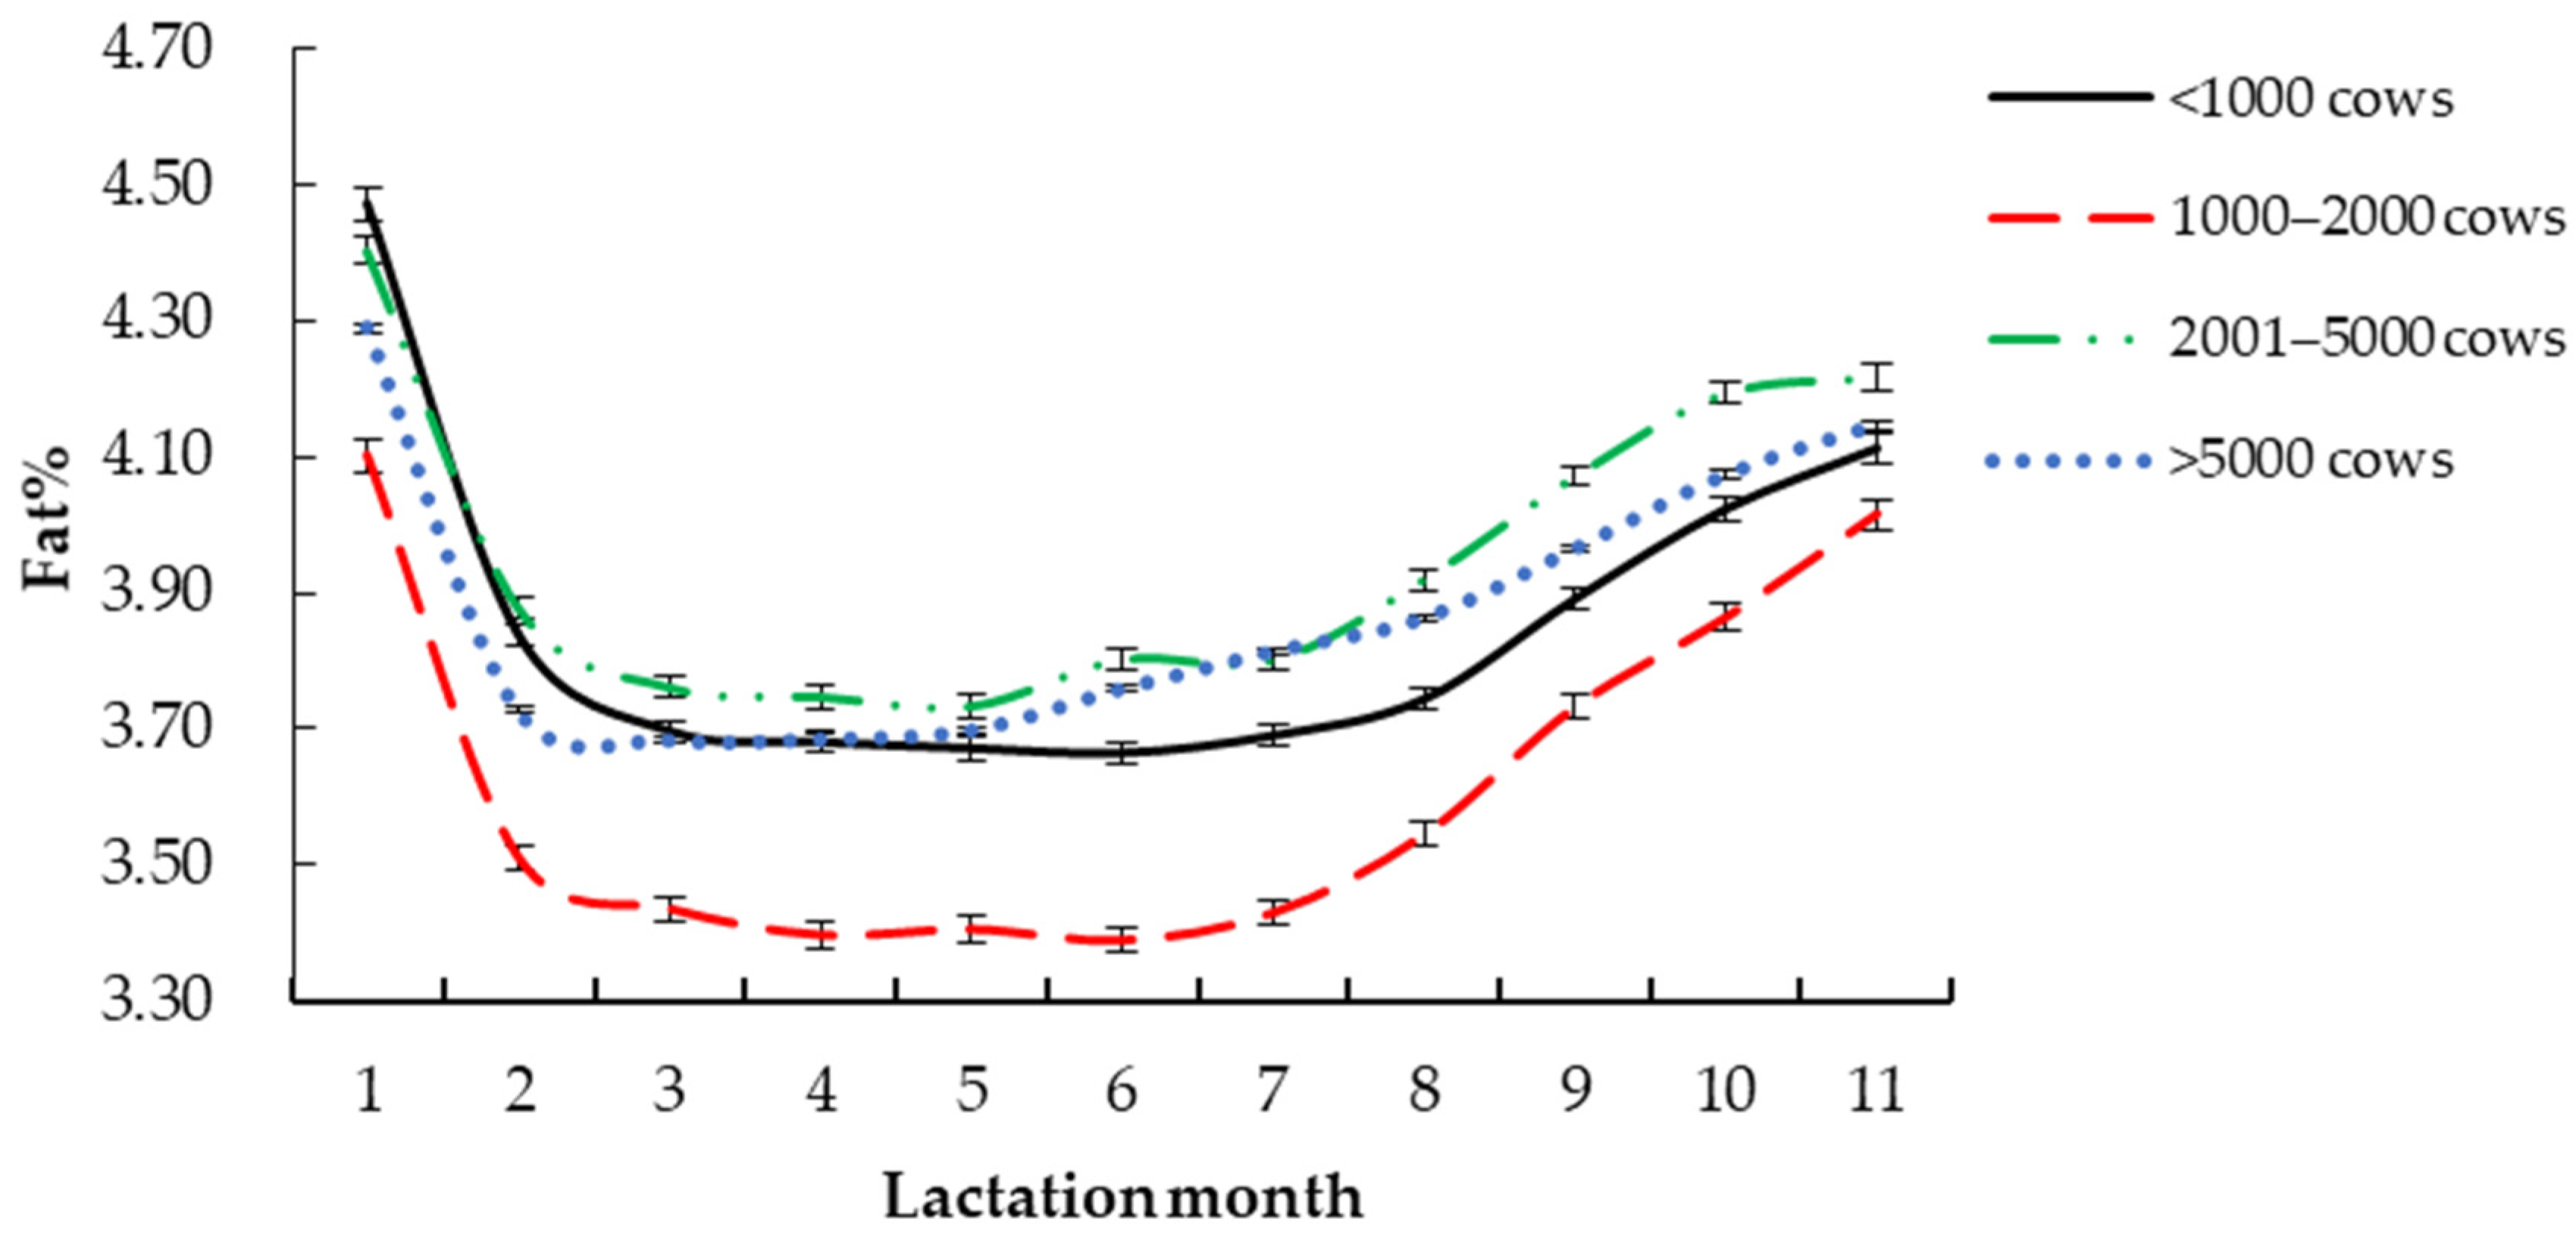
3.2.1. Dairy Farm Size
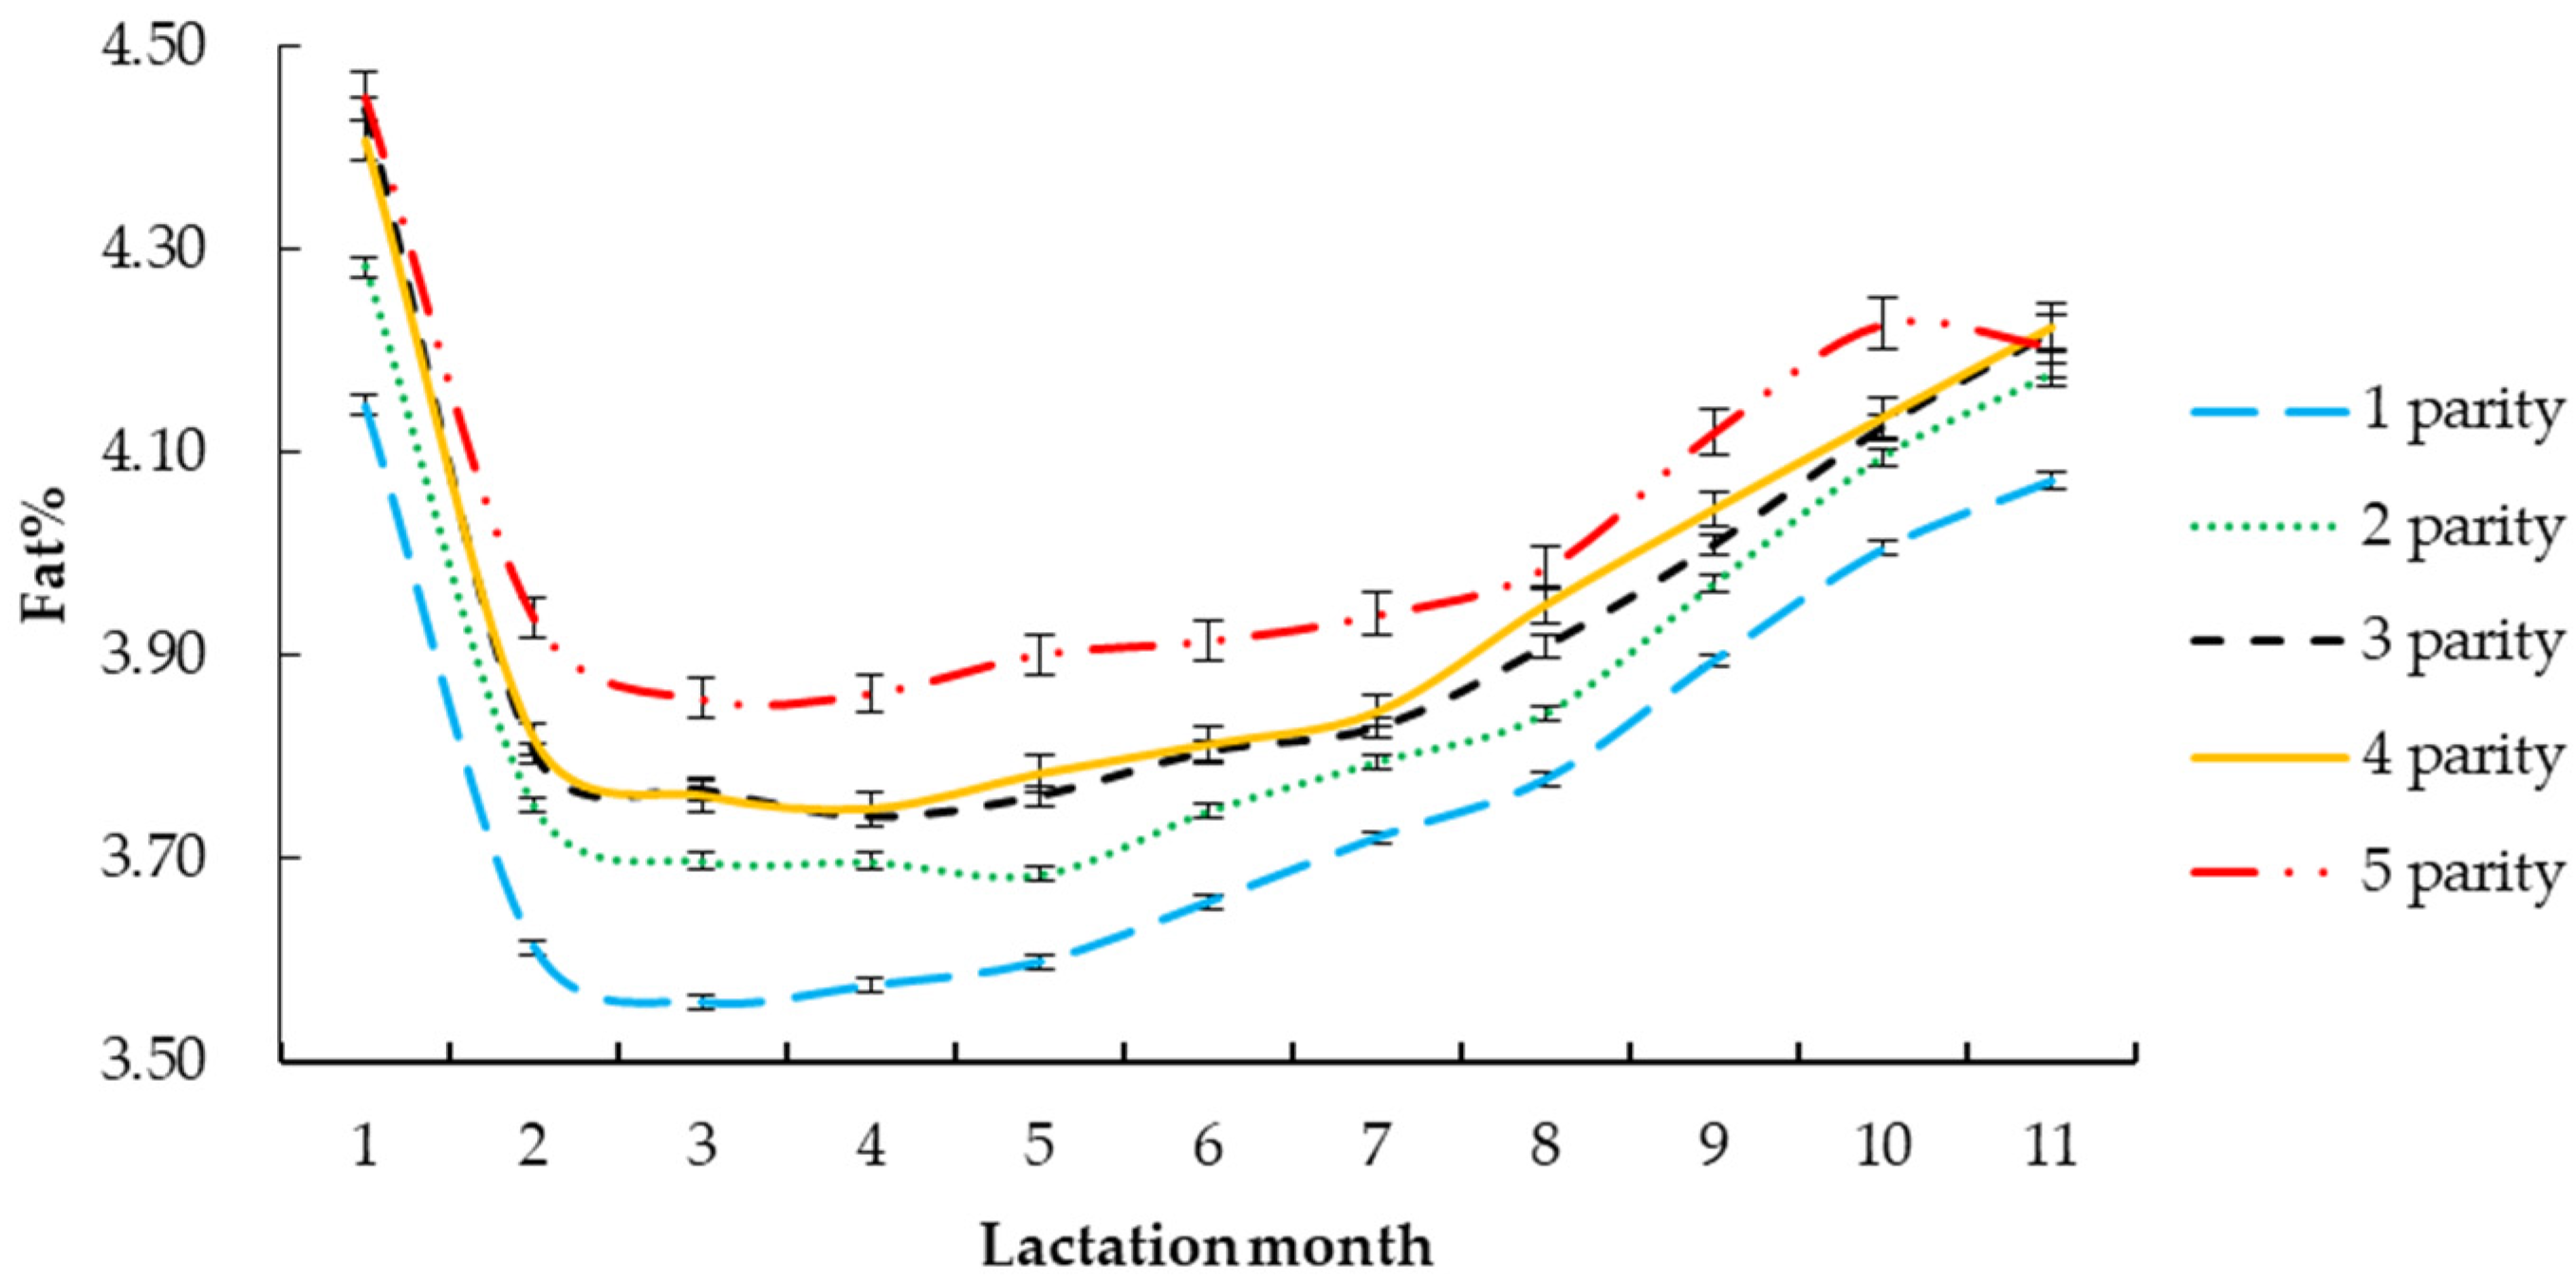
3.2.2. Parity
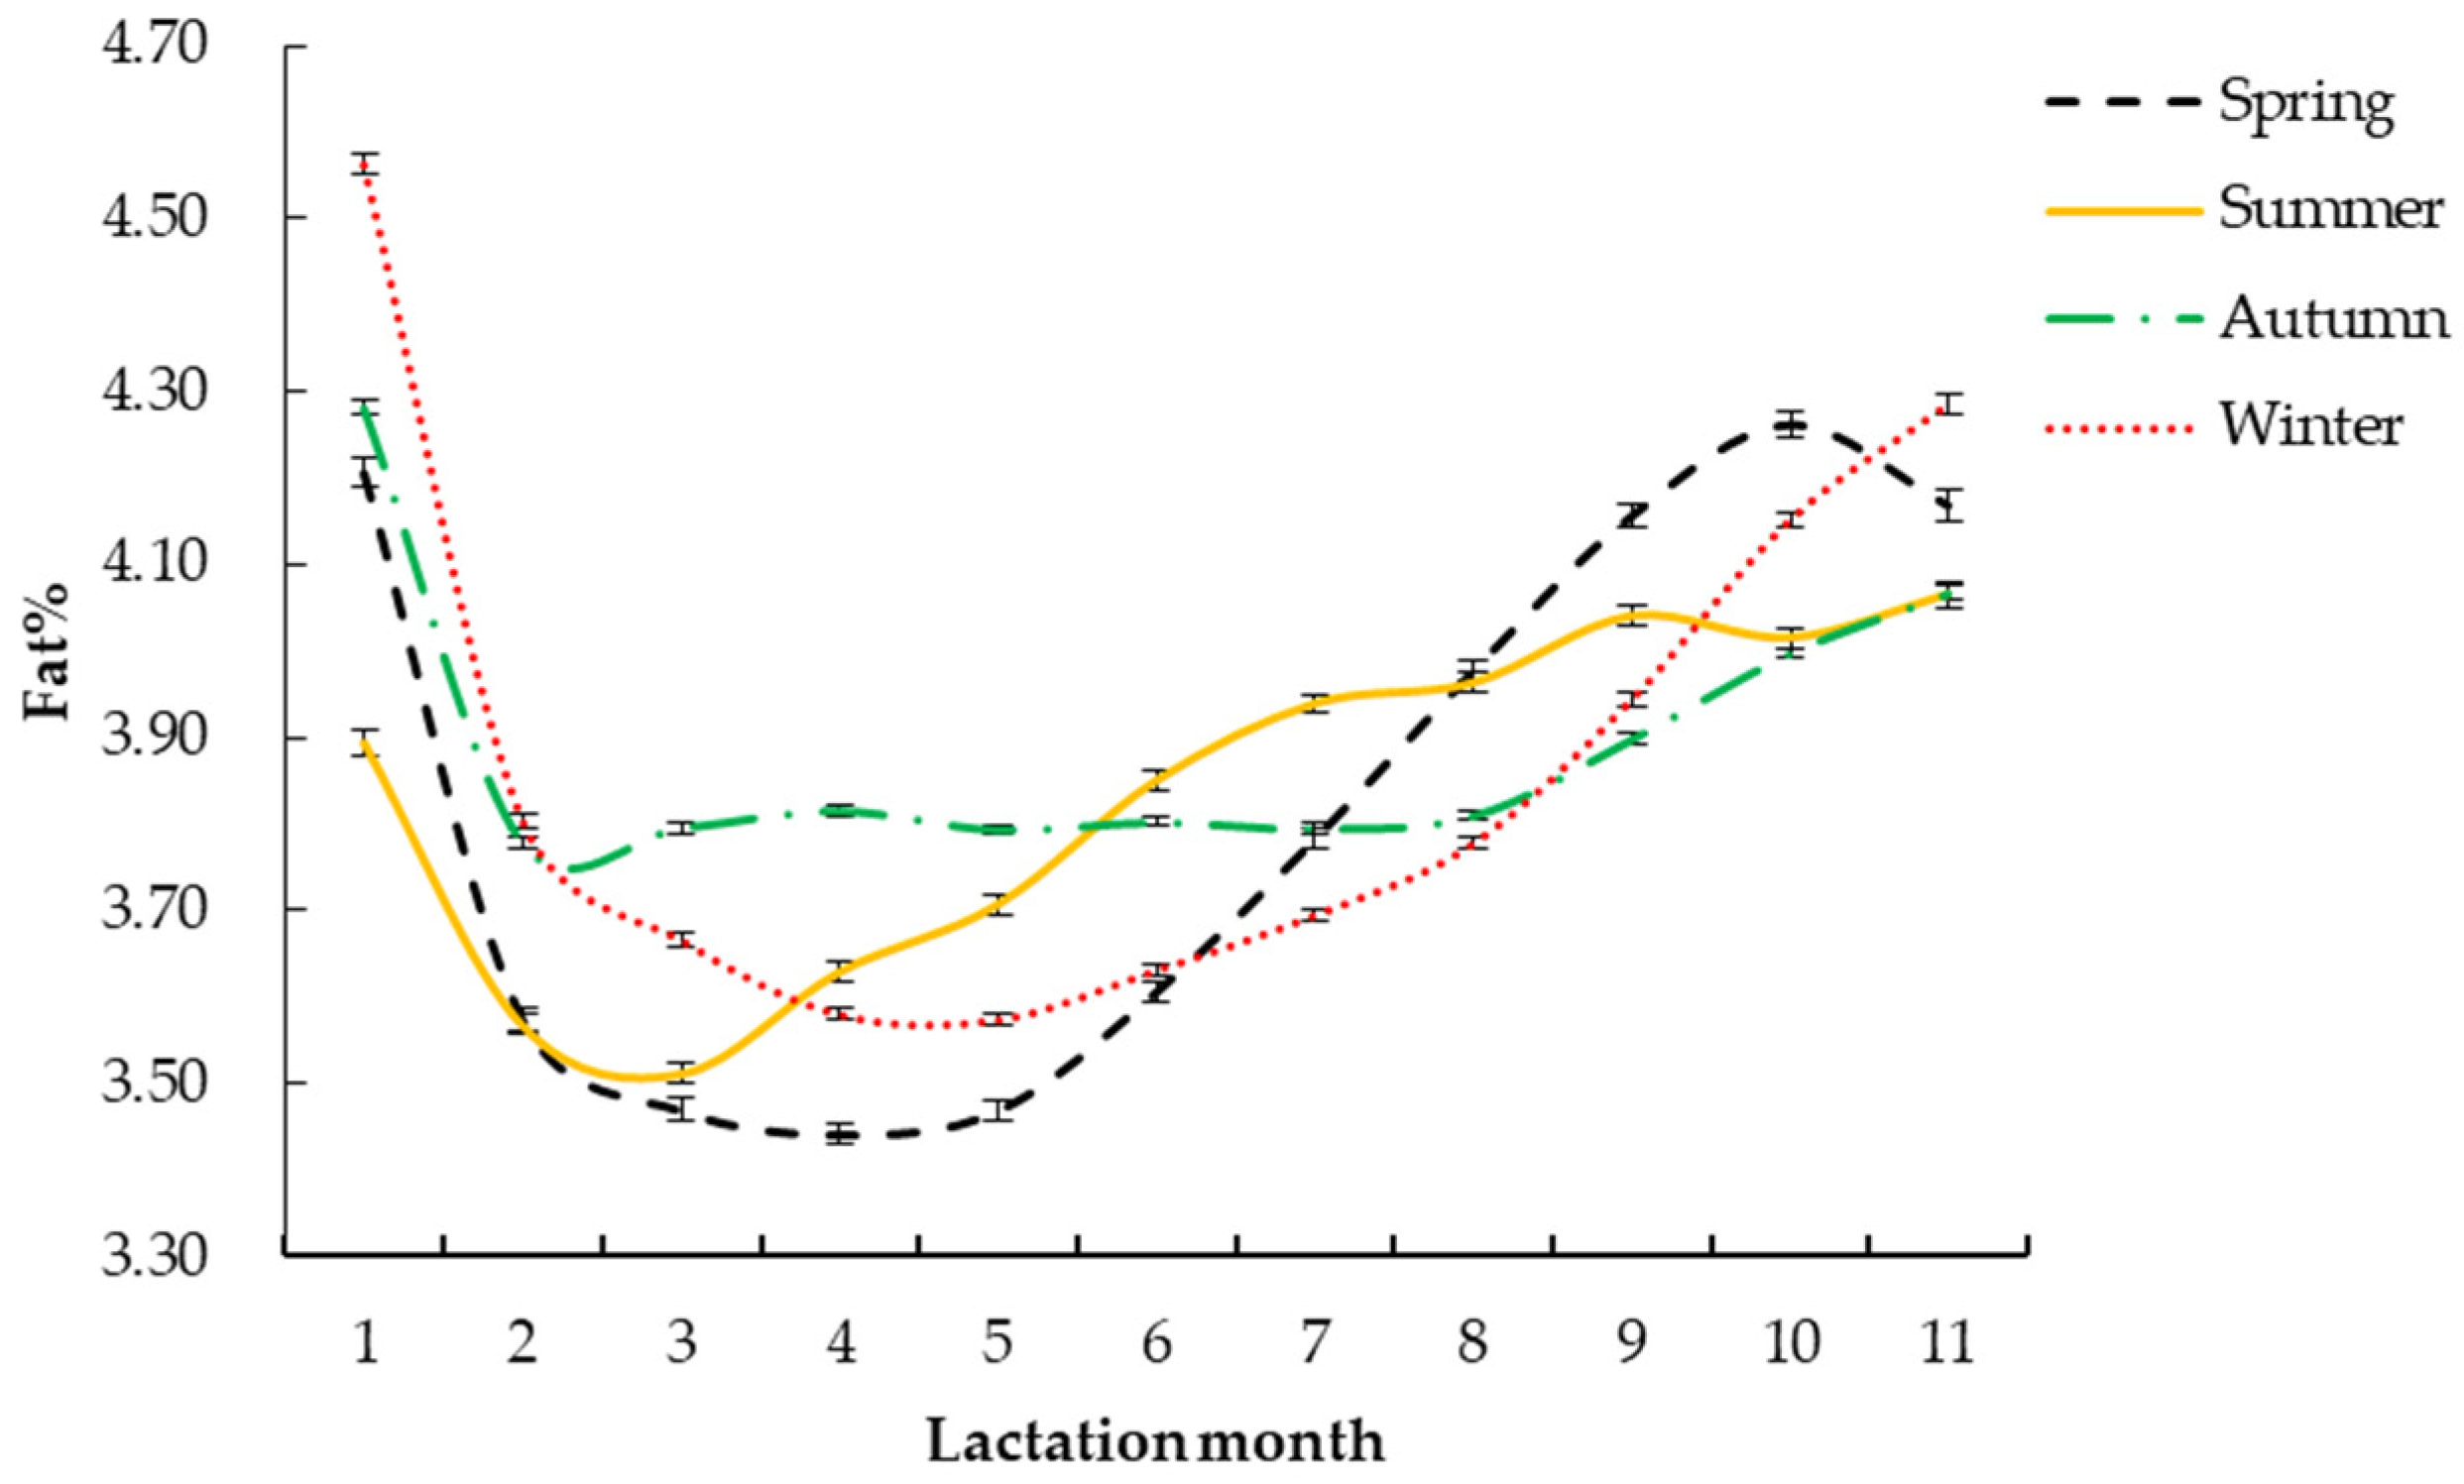
3.2.3. Calving Season
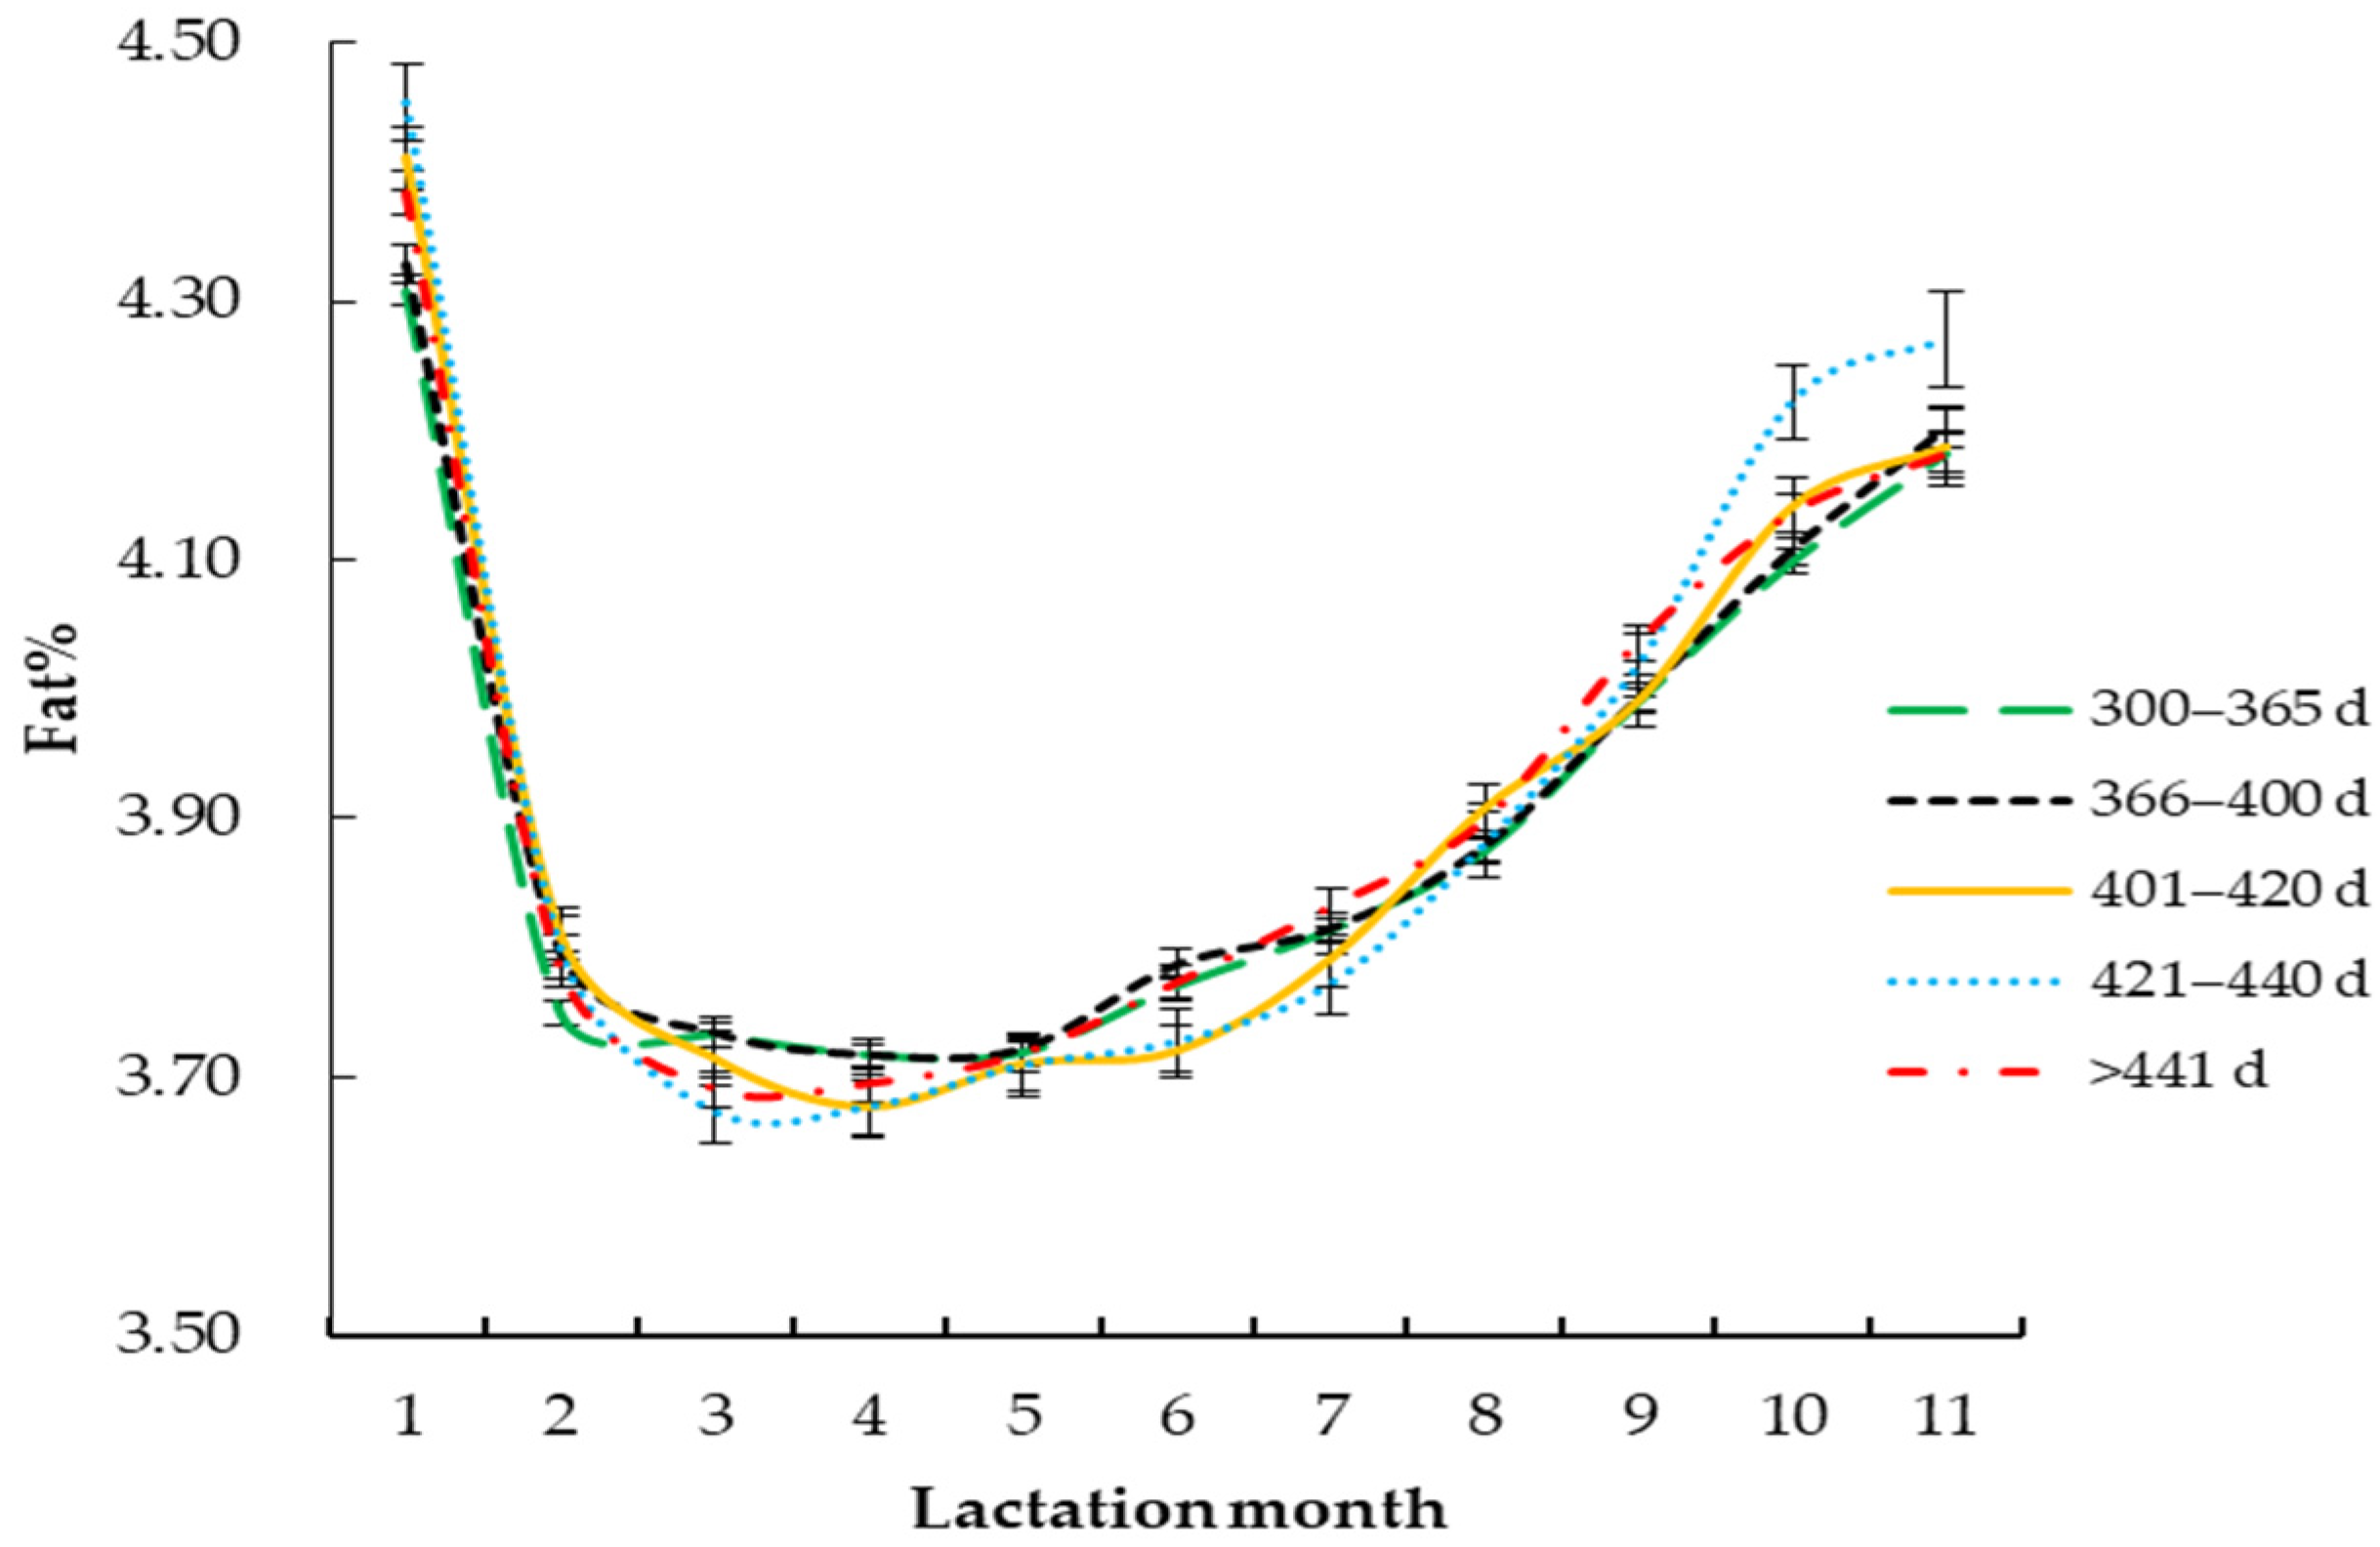
3.2.4. Calving Interval
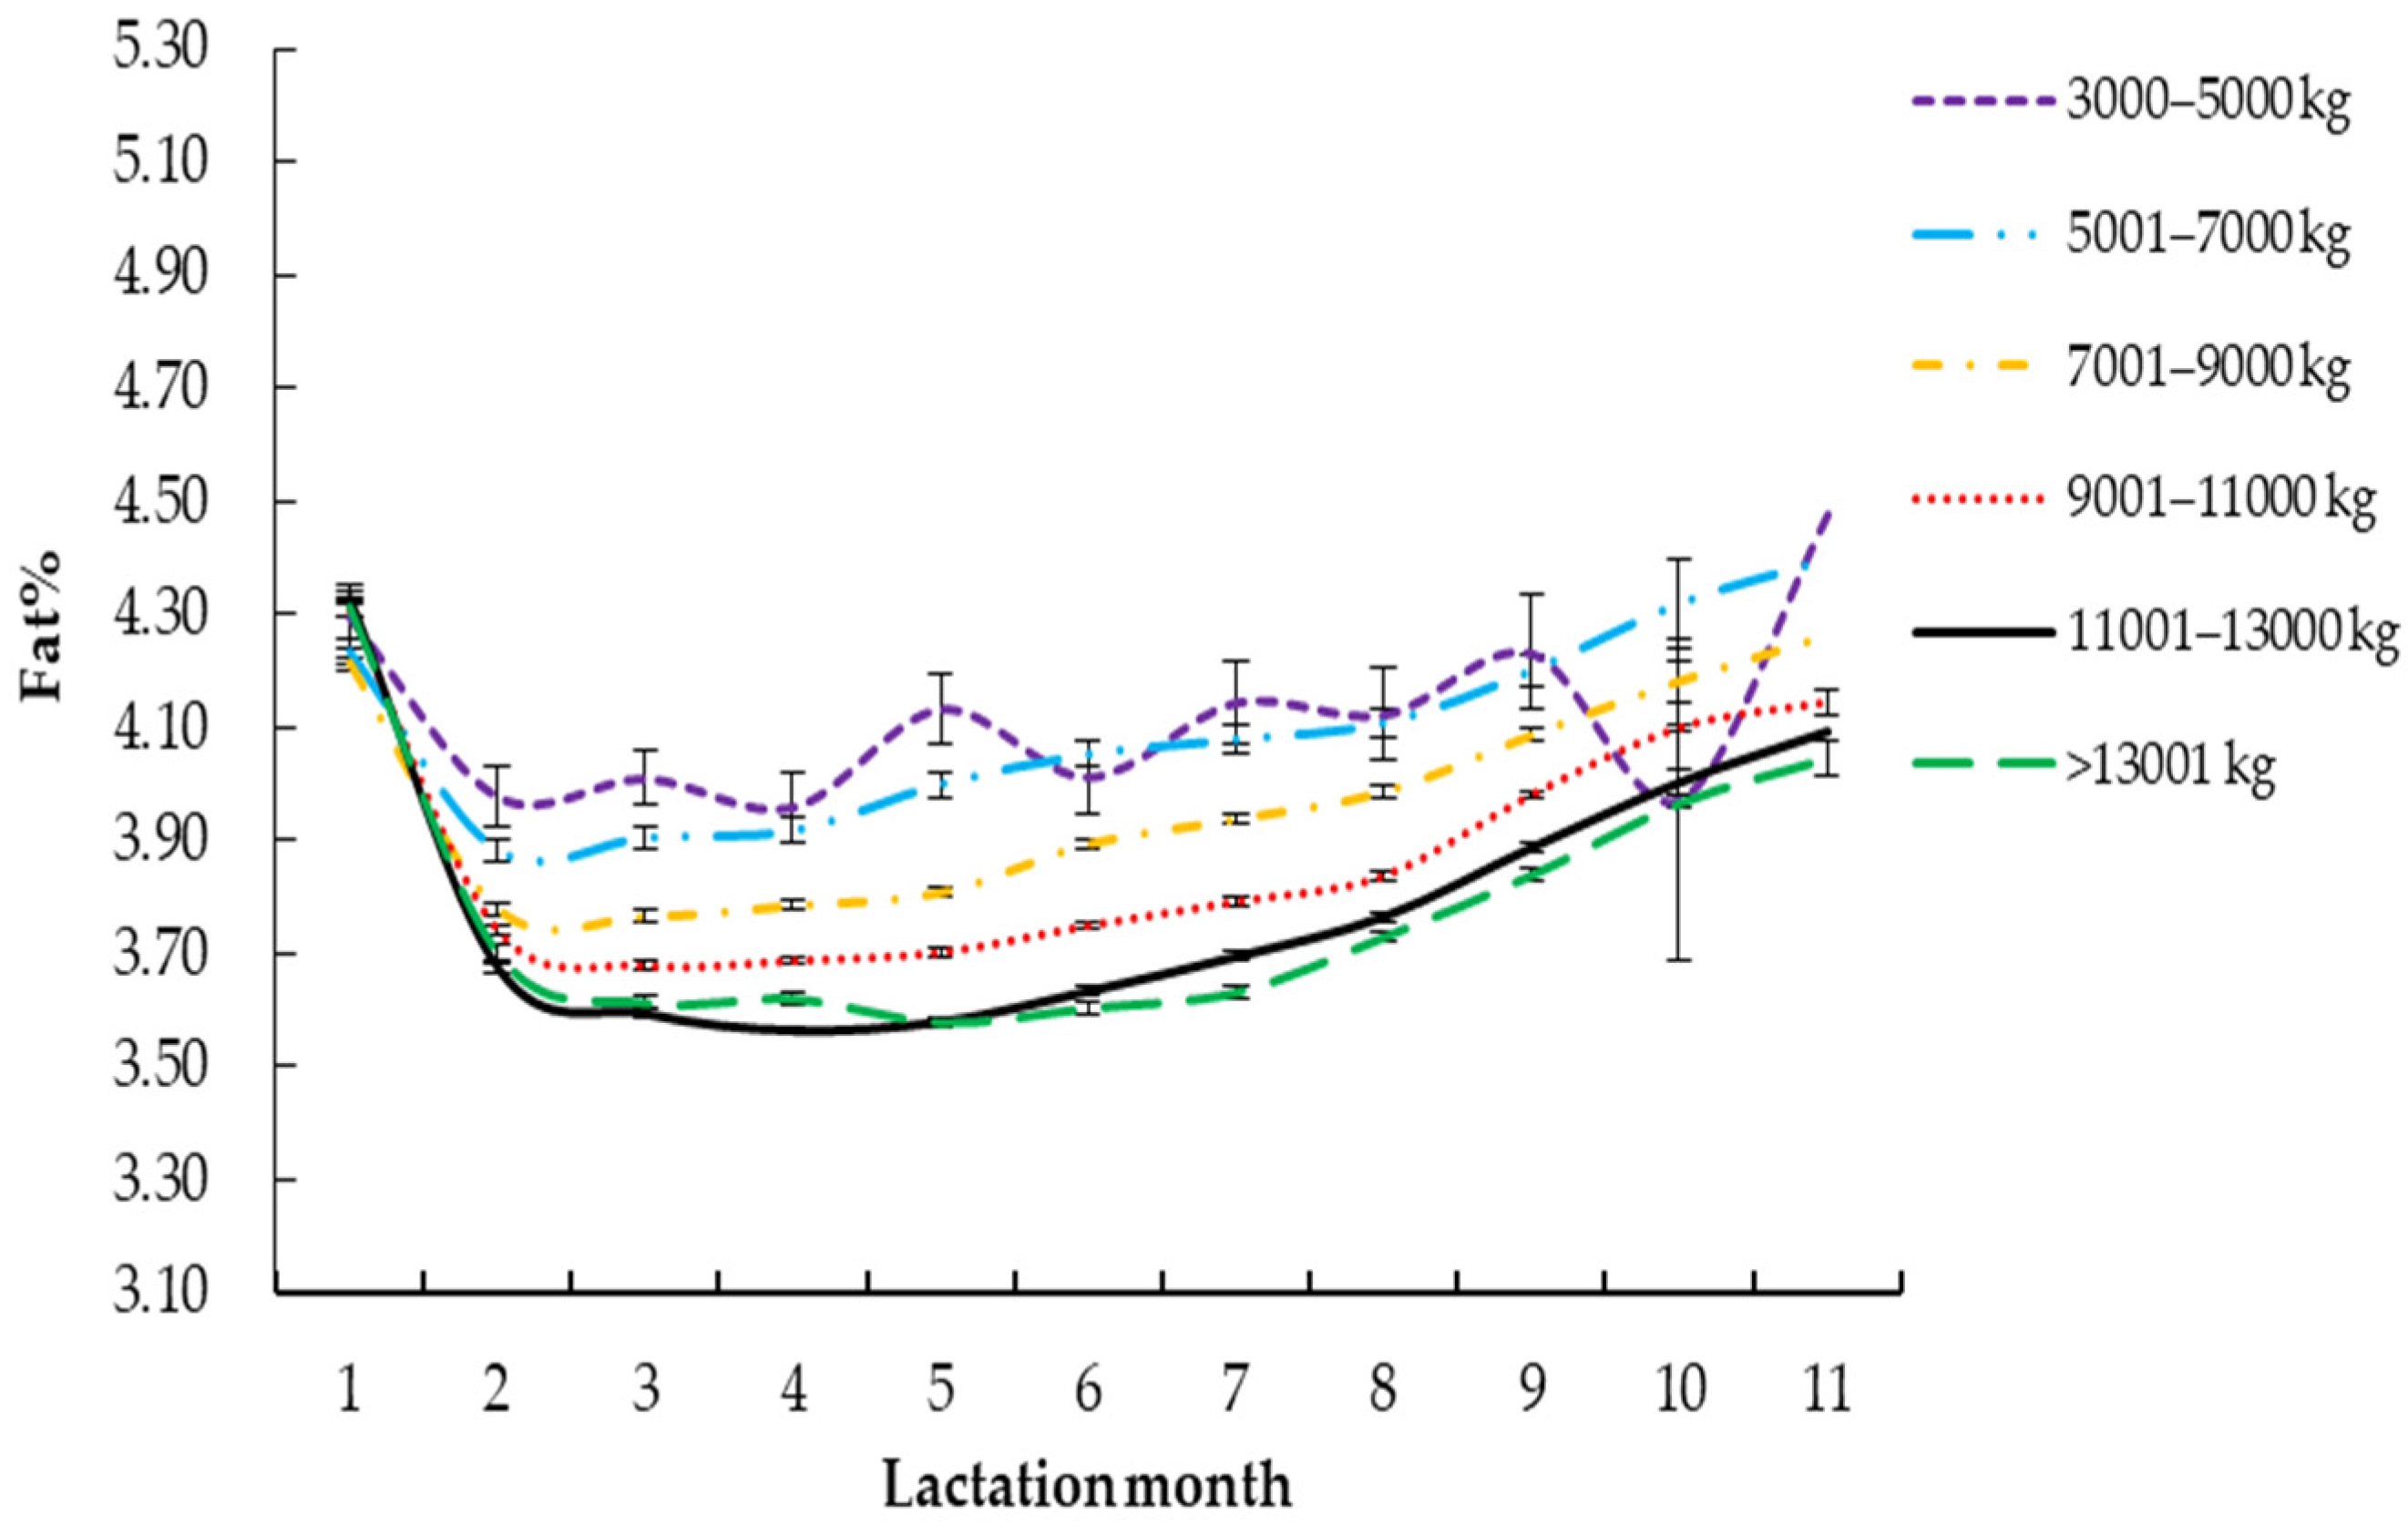
3.2.5. 305-Day Milk Yield
4. Discussion
5. Conclusions
Author Contributions
Funding
Institutional Review Board Statement
Informed Consent Statement
Conflicts of Interest
References
- Salfer, I.; Dechow, C.D.; Harvatine, K.J. Annual rhythms of milk and milk fat and protein production in dairy cattle in the United States. J. Dairy Sci. 2019, 102, 742–753. [Google Scholar] [CrossRef]
- García, S.; Holmes, C. Lactation curves of autumn- and spring-calved cows in pasture-based dairy systems. Livest. Prod. Sci. 2001, 68, 189–203. [Google Scholar] [CrossRef]
- Macciotta, N.; Vicario, D.; Cappio-Borlino, A. Detection of Different Shapes of Lactation Curve for Milk Yield in Dairy Cattle by Empirical Mathematical Models. J. Dairy Sci. 2005, 88, 1178–1191. [Google Scholar] [CrossRef]
- Rekik, B.; Ben Gara, A.; Ben Hamouda, M.; Hammami, H. Fitting lactation curves of dairy cattle in different types of herds in Tunisia. Livest. Prod. Sci. 2003, 83, 309–315. [Google Scholar] [CrossRef]
- Gantner, V.; Potočnik, K.; Kuterovac, K.; Gantner, R.; Antunović, B. Methods for early prediction of lactation flow in Holstein heifers. Mljekarstvo 2010, 60, 260–265. [Google Scholar]
- Gradiz, L.; Alvarado, L.; Kahi, A.; Hirooka, H. Fit of Wood’s function to daily milk records and estimation of environmental and additive and non-additive genetic effects on lactation curve and lactation parameters of crossbred dual purpose cattle. Livest. Sci. 2009, 124, 321–329. [Google Scholar] [CrossRef]
- Stachurska, A.; Bartyzel, K. Judging dressage competitions in the view of improving horse performance assessment. Acta Agric. Scand. Sect. A Anim. Sci. 2011, 61, 92–102. [Google Scholar] [CrossRef]
- Marek, J.; Rajmon, R.; Haloun, T. Critical Evaluation of Seven Lactation Curve Estimation Models; Springer Science and Business Media LLC: New York, NY, USA, 2015; pp. 73–84. [Google Scholar]
- Mao, Y.J.; Zhang, M.R.; Xu, Z.J.; Liu, S.; Zhang, Y.Q.; Chen, D.; Wang, X.L.; Yang, Z.P. Lactation curve fittings of Wood‘s non-linear model for milk yield, milk fat, milk protein and somatic cell score for Chinese Holstein in southern China. Chin. J. Anim. Vet. Sci. 2012, 43, 1904–1909. [Google Scholar]
- Cunha, D.D.N.F.V.D.; Pereira, J.C.; E Silva, F.F.; De Campos, O.F.; Braga, J.L.; Martuscello, J.A. Selection of models of lactation curves to use in milk production simulation systems. Rev. Bras. Zootec. 2010, 39, 891–902. [Google Scholar] [CrossRef]
- Silvestre, A.; Petim-Batista, F.; Colaço, J. The Accuracy of Seven Mathematical Functions in Modeling Dairy Cattle Lactation Curves Based on Test-Day Records from Varying Sample Schemes. J. Dairy Sci. 2006, 89, 1813–1821. [Google Scholar] [CrossRef]
- Wood, P.D.P. Algebraic Model of the Lactation Curve in Cattle. Nature 1967, 216, 164–165. [Google Scholar] [CrossRef]
- Sun, X.Z.; An, P.P.; Guo, M.; Sun, Y.; Jin, T.; Liu, G. Fitting of changing curves of milk yield and milk composition of Chi-nese Holstein dairy cows in Yangtze river delta using Wood’s model. Chin. J. Anim. Nutr. 2018, 30, 2136–2142. [Google Scholar]
- Mao, Y.J.; Zhang, Y.Q.; Xu, Z.J.; Liu, S.; Zhang, M.R.; Chang, L.L.; Yang, Z.P. Fitting of lactation curves for Chinese Holstein. Chin. J. Anim. Vet. Sci. 2011, 42, 1239–1248. [Google Scholar]
- Wang, R.J.; Zhang, Z.G.; Wu, H.J.; Wang, D.S.; Wu, E.Q.; Su, R.; Zhang, Y.J.; Wang, Y.C.; Li, J.Q. Study of non-genetic factors affecting on lactation curve traits of inner Mongolia Sanhe cattle. China Anim. Husb. Vet. Med. 2010, 37, 99–102. [Google Scholar]
- Togashi, K.; Lin, C. Genetic Improvement of Total Milk Yield and Total Lactation Persistency of the First Three Lactations in Dairy Cattle. J. Dairy Sci. 2008, 91, 2836–2843. [Google Scholar] [CrossRef]
- Pozveh, S.T.; Shadparvar, A.A.; Shahrbabak, M.M.; Taromsari, M.D. Genetic analysis of reproduction traits and their relationship with conformation traits in Holstein cows. Livest. Sci. 2009, 125, 84–87. [Google Scholar] [CrossRef]
- Xu, S.Z.; Chen, Y.C.; Zhang, Z.S. Studies on estimating milk yield of dairy cows by using gamma procedureIIpath analysis of the gamma lactation curve estimates of 305 days milk yield and other lactation characteristics. Chin. J. Anim. Vet. Sci. 1988, 19, 85–90. [Google Scholar]
- Silvestre, A.; Martins, A.; Santos, V.; Ginja, M.; Colaço, J. Lactation curves for milk, fat and protein in dairy cows: A full approach. Livest. Sci. 2009, 122, 308–313. [Google Scholar] [CrossRef]
- Olori, V.; Brotherstone, S.; Hill, W.; McGuirk, B. Fit of standard models of the lactation curve to weekly records of milk production of cows in a single herd. Livest. Prod. Sci. 1999, 58, 55–63. [Google Scholar] [CrossRef]
- Zhang, J.L.; Ru, C.X.; Zhao, W.H. The lactation curves fitting and parameters analysis in different dairy cattle farms. Hubei Agric. Sci. 2012, 12, 140–142. [Google Scholar] [CrossRef]
- Kucevic, D.; Trivunovic, S.; Radinovic, M.; Plavsic, M.; Skalicki, Z.; Perisic, P. The effect of the farm size on milk traits of cows. Biotehnol. Anim. Husb. 2011, 27, 951–958. [Google Scholar] [CrossRef][Green Version]
- Ma, X.Y.; Gao, Z.L.; Gao, Y.X.; Gu, Q.S.; Li, J.G.; Ma, W.Q. Milk production, nitrogen balance and utilization efficiency of lactating cows in dairy operations with different sizes. J. Hebei Agric. Univ. 2014, 37, 88–93. [Google Scholar] [CrossRef]
- Wu, H.C.; Fan, X.Z.; Xu, K.Y.; Dong, J.H.; Sun, Z.G.; Wang, J.M.; Tan, J.H. Study on Devopment and Applion of Computer Assisted Breeding System in Modern Cattle Farm. J. Domest. Anim. Ecol. 2006, 6, 19–22. [Google Scholar] [CrossRef]
- Roberto, S.; Aldo, C.B.; Macciotta, N.P.P. Modelling extended lactation curves for milk production traits in Italian Holsteins. Ital. J. Anim. Sci. 2009, 8, 165–167. [Google Scholar] [CrossRef]
- Rao, M.K.; Sundaresan, D. Influence of environment and heredity on the shape of lactation curves in Sahiwal cows. J. Agric. Sci. 1979, 92, 393–401. [Google Scholar] [CrossRef]
- Capuco, A.V.; Wood, D.L.; Baldwin, R.; Mcleod, K.; Paape, M.J. Mammary cell number, proliferation, and apoptosis during a bovine lactation: Relation to milk production and effect of bST. J. Dairy Sci. 2001, 84, 2177–2187. [Google Scholar] [CrossRef]
- Val-Arreola, D.; Kebreab, E.; Dijkstra, J.; France, J. Study of the Lactation Curve in Dairy Cattle on Farms in Central Mexico. J. Dairy Sci. 2004, 87, 3789–3799. [Google Scholar] [CrossRef]
- Knaus, W. Dairy cows trapped between performance demands and adaptability. J. Sci. Food Agric. 2009, 89, 1107–1114. [Google Scholar] [CrossRef]
- Werner, C.; Wecke, C.; Liebert, F.; Wicke, M. Increasing the incubation temperature between embryonic day 7 and 10 has no influence on the growth and slaughter characteristics as well as meat quality of broilers. Animal 2010, 4, 810–816. [Google Scholar] [CrossRef]
- Yan, X.Y.; Liu, A.X.; Dong, G.H.; Guo, G.; Wang, X.Y.; Liu, L.; Zhang, S.L.; Wang, Y.C. Analysis of longevity and its influenc-ing factors in Chinese Holstein population in Beijing. Chin. J. Anim. Sci. 2016, 52, 1–5. [Google Scholar]
- Qi, J.G.; Yang, Z.C.; Li, X.; Yan, X.Y.; Dong, G.H.; Li, X.Z.; Huang, X.X.; Wang, Y.C. Effects of calving season on the parame-ters of Wood lactation curve of Holstein dairy cow in Beijing area. China Anim. Husb. Vet. Med. 2018, 45, 197–205. [Google Scholar] [CrossRef]
- Tekerli, M.; Akinci, Z.; Dogan, I.; Akcan, A. Factors Affecting the Shape of Lactation Curves of Holstein Cows from the Balikesir Province of Turkey. J. Dairy Sci. 2000, 83, 1381–1386. [Google Scholar] [CrossRef]
- Keown, J.; Everett, R.; Empet, N.; Wadell, L. Lactation Curves. J. Dairy Sci. 1986, 69, 769–781. [Google Scholar] [CrossRef]
- Schneeberger, M. Inheritance of Lactation Curve in Swiss Brown Cattle. J. Dairy Sci. 1981, 64, 475–483. [Google Scholar] [CrossRef]
- García, S.C.; Cayzer, F.J.; Holmes, C.W.; MacDonald, A. The effect of calving season on milk production A system study. Proc. N. Z. Soc. Anim. Prod. 1998, 58, 61–63. [Google Scholar]
- Gorniak, T.; Meyer, U.; Südekum, K.-H.; Dänicke, S. Impact of mild heat stress on dry matter intake, milk yield and milk composition in mid-lactation Holstein dairy cows in a temperate climate. Arch. Anim. Nutr. 2014, 68, 358–369. [Google Scholar] [CrossRef]
- Baumgard, L.H.; Rhoads, R.P. Ruminant nutrition symposium: Ruminant Production and Metabolic Responses to Heat Stress. J. Anim. Sci. 2012, 90, 1855–1865. [Google Scholar] [CrossRef]
- Wheelock, J.B.; Rhoads, R.P.; VanBaale, M.J.; Sanders, S.R.; Baumgard, L.H. Effects of heat stress on energetic metabolism in lactating Holstein cows. J. Dairy Sci. 2010, 93, 644–655. [Google Scholar] [CrossRef]
- Xie, G.H. Metabolic and Endocrine Adaptations to Heat Stress in Lactating Dairy Cows; The Virginia Polytechnic Institute and State University: Blacksburg, VA, USA, 2015. [Google Scholar]
- Holmann, F.J.; Shumway, C.R.; Blake, R.W.; Schwart, R.B.; Sudweeks, E.M. Economic Value of Days Open for Holstein Cows of Alternative Milk Yields with Varying Calving Intervals. J. Dairy Sci. 1984, 67, 636–643. [Google Scholar] [CrossRef]
- Schmidt, G. Effect of Length of Calving Intervals on Income over Feed and Variable Costs. J. Dairy Sci. 1989, 72, 1605–1611. [Google Scholar] [CrossRef]
- Lehmann, J.; Fadel, J.; Mogensen, L.; Kristensen, T.; Gaillard, C.; Kebreab, E. Effect of calving interval and parity on milk yield per feeding day in Danish commercial dairy herds. J. Dairy Sci. 2016, 99, 621–633. [Google Scholar] [CrossRef] [PubMed]
- Lv, W.L. Correct interpretation of DHI report. Today Anim. Husb. Vet. Med. 2014, 8, 53–55. [Google Scholar]
- Meikle, A.; Kulcsar, M.; Chilliard, Y.; Febel, H.; Delavaud, C.; Cavestany, D.; Chilibroste, P. Effects of parity and body condition at parturition on endocrine and reproductive parameters of the cow. Reproduction 2004, 127, 727–737. [Google Scholar] [CrossRef] [PubMed]
- Baiyila, T. Analysis of 305d Milk Yield and Lactation Curve of Dairy Cows Born in Different Seasons; Inner Mongolia Agricultural University: Hohhot, China, 2018. [Google Scholar]
- Umphrey, J.; Moss, B.; Wilcox, C.; Van Horn, H. Interrelationships in Lactating Holsteins of Rectal and Skin Temperatures, Milk Yield and Composition, Dry Matter Intake, Body Weight, and Feed Efficiency in Summer in Alabama. J. Dairy Sci. 2001, 84, 2680–2685. [Google Scholar] [CrossRef]
- Liang, Y.; Zhang, Q.; Tang, C.; Guo, J.G.; Wang, M.Q.; Zhang, H.M.; Li, M.X.; Yang, Z.P.; Mao, Y.J. Analysis of factors af-fecting 305-days milking traits of Holstein cows. Chin. J. Anim. Sci. 2020, 56, 56–59. [Google Scholar] [CrossRef]
- Fang, Y.; Li, S.J.; Yu, W.L.; Zhong, R.Z. Management measures and nutrition regulation of high-yield dairy cows. Heilongjiang Anim. Sci. Vet. Med. 2006, 2, 9–11. [Google Scholar] [CrossRef]
- Wu, F.X.; Tong, J.J.; Zhang, H.; Fang, L.Y.; Xiong, B.H.; Jiang, L.S. Behavioral differences of different milk yield dairy cows and its correlation with lactation performance. Chin. J. Anim. Nutr. 2019, 31, 3156–3163. [Google Scholar] [CrossRef]
| Item | Percentage |
|---|---|
| Ingredient, % of DM | |
| Alfalfa hay | 25.41 |
| Corn silage | 28.40 |
| Oat hay | 6.16 |
| Ground corn | 17.48 |
| Soybean meal | 5.26 |
| Cottonseed meal | 4.06 |
| Distillers dried grains with solubles | 5.31 |
| Barely | 5.17 |
| Limestone | 0.32 |
| NaHCO3 | 0.36 |
| NaCl | 0.31 |
| CaHPO4 | 0.56 |
| Premix | 1.20 |
| Composition, % of DM | |
| Crude protein | 15.02 |
| Ether extract | 3.96 |
| Neutral detergent fiber | 41.11 |
| Acid detergent fiber | 22.04 |
| Calcium | 0.82 |
| Phosphorus | 0.42 |
| NEL, 1 Mcal/kg | 6.29 |
| Parity | Number | Mean | Standard Deviation | Minimum | Maximum |
|---|---|---|---|---|---|
| 1 | 157,483 | 3.76 | 0.37 | 1.02 | 6.93 |
| 2 | 123,340 | 3.85 | 0.39 | 1.11 | 6.99 |
| 3 | 69,022 | 3.92 | 0.40 | 1.04 | 6.94 |
| 4 | 28,315 | 3.94 | 0.39 | 1.13 | 6.83 |
| 5 | 20,289 | 4.01 | 0.39 | 1.03 | 6.72 |
| Total | 398,449 | 3.90 | 0.39 | 1.01 | 6.98 |
| Factor | Number | Milk Fat Percentage | |
|---|---|---|---|
| Dairy farm size | <1000 | 19,189 | 3.84 ± 0.01 B |
| 1000~2000 | 30,020 | 3.59 ± 0.01 C | |
| 2001~5000 | 45,853 | 3.93 ± 0.01 A | |
| >5000 | 303,387 | 3.85 ± 0.00 B | |
| F value | 436.331 ** | ||
| Parity | 1 | 157,483 | 3.76 ± 0.00 D |
| 2 | 123,340 | 3.85 ± 0.00 C | |
| 3 | 69,022 | 3.92 ± 0.00 B | |
| 4 | 28,315 | 3.94 ± 0.01 B | |
| 5 | 20,289 | 4.01 ± 0.01 A | |
| F value | 195.399 ** | ||
| Calving season | Spring | 46,297 | 3.77 ± 0.00 D |
| Summer | 53,302 | 3.81 ± 0.00 C | |
| Autumn | 178,639 | 3.88 ± 0.00 A | |
| Winter | 120,211 | 3.83 ± 0.00 B | |
| F value | 59.986 ** | ||
| Calving interval (Days) | 300~365 | 89,259 | 3.88 ± 0.00 B |
| 366~400 | 57,789 | 3.89 ± 0.00 AB | |
| 401~420 | 18,525 | 3.89 ± 0.01 AB | |
| 421~440 | 12,561 | 3.89 ± 0.01 AB | |
| >441 | 40,154 | 3.90 ± 0.01 A | |
| F value | 129.525 ** | ||
| 305-days milk yield (kg) | 3000~5000 | 2180 | 4.07 ± 0.02 A |
| 5001~7000 | 13,276 | 4.04 ± 0.01 B | |
| 7001~9000 | 59,589 | 3.93 ± 0.00 C | |
| 9001~11,000 | 125,981 | 3.84 ± 0.00 D | |
| 11,001~13,000 | 102,605 | 3.75 ± 0.00 E | |
| 13,001~15,000 | 54,960 | 3.74 ± 0.00 E | |
| F value | 382.315 ** | ||
| Factor | a | b | c | Tmin (month) | Tmin (day) | Ymin (%) | Per. | R2 | Residual Mean Squares | |
|---|---|---|---|---|---|---|---|---|---|---|
| Dairy farm size | <1000 | 4.10 ± 0.02 | 0.26 ± 0.01 | 0.06 ± 0.00 | 4.71 | 142 | 3.56 | 3.65 | 0.9798 | 0.036 |
| 1000–2000 | 3.65 ± 0.02 | 0.30 ± 0.01 | 0.07 ± 0.00 | 4.21 | 127 | 3.21 | 3.44 | 0.9483 | 0.084 | |
| 2001–5000 | 3.96 ± 0.01 | 0.26 ± 0.01 | 0.06 ± 0.00 | 4.18 | 126 | 3.55 | 3.51 | 0.9560 | 0.082 | |
| >5000 | 3.89 ± 0.01 | 0.21 ± 0.00 | 0.05 ± 0.00 | 4.08 | 123 | 3.58 | 3.59 | 0.9737 | 0.047 | |
| Parity | 1 | 3.74 ± 0.01 | 0.21 ± 0.00 | 0.05 ± 0.00 | 3.89 | 117 | 3.47 | 3.54 | 0.9710 | 0.050 |
| 2 | 3.89 ± 0.01 | 0.22 ± 0.00 | 0.05 ± 0.00 | 4.13 | 124 | 3.55 | 3.58 | 0.9696 | 0.055 | |
| 3 | 4.02 ± 0.01 | 0.24 ± 0.00 | 0.06 ± 0.00 | 4.29 | 129 | 3.61 | 3.58 | 0.9701 | 0.055 | |
| 4 | 3.99 ± 0.01 | 0.23 ± 0.01 | 0.06 ± 0.00 | 4.16 | 125 | 3.62 | 3.56 | 0.9685 | 0.059 | |
| 5 | 4.07 ± 0.02 | 0.19 ± 0.01 | 0.05 ± 0.00 | 4.22 | 127 | 3.74 | 3.68 | 0.9695 | 0.058 | |
| Calving season | Spring | 3.68 ± 0.01 | 0.31 ± 0.01 | 0.08 ± 0.00 | 3.65 | 110 | 3.36 | 3.24 | 0.9674 | 0.057 |
| Summer | 3.54 ± 0.01 | 0.11 ± 0.00 | 0.04 ± 0.00 | 2.86 | 86 | 3.52 | 3.65 | 0.9716 | 0.050 | |
| Autumn | 3.95 ± 0.01 | 0.16 ± 0.00 | 0.03 ± 0.01 | 4.56 | 137 | 3.65 | 3.91 | 0.9720 | 0.051 | |
| Winter | 4.07 ± 0.01 | 0.35 ± 0.00 | 0.08 ± 0.00 | 4.37 | 132 | 3.46 | 3.41 | 0.9685 | 0.056 | |
| Calving interval (Days) | 300–365 | 3.91 ± 0.01 | 0.22 ± 0.00 | 0.05 ± 0.00 | 4.15 | 125 | 3.57 | 3.60 | 0.9691 | 0.056 |
| 366–400 | 3.94 ± 0.01 | 0.22 ± 0.00 | 0.05 ± 0.00 | 4.13 | 124 | 3.59 | 3.58 | 0.9704 | 0.054 | |
| 401–420 | 3.99 ± 0.02 | 0.26 ± 0.01 | 0.06 ± 0.00 | 4.26 | 128 | 3.55 | 3.52 | 0.9688 | 0.057 | |
| 421–440 | 4.00 ± 0.02 | 0.28 ± 0.01 | 0.07 ± 0.00 | 4.16 | 125 | 3.54 | 3.45 | 0.9691 | 0.057 | |
| >441 | 3.95 ± 0.01 | 0.24 ± 0.01 | 0.06 ± 0.00 | 4.16 | 125 | 3.56 | 3.53 | 0.9685 | 0.058 | |
| 305-day milk yield (kg) | 3000–5000 | 3.62 ± 0.17 | 0.00 ± 0.07 | 0.02 ± 0.01 | 0.27 | 9 | 3.65 | 4.22 | 0.9714 | 0.055 |
| 5001–7000 | 3.60 ± 0.06 | 0.05 ± 0.02 | 0.03 ± 0.00 | 1.81 | 55 | 3.67 | 3.82 | 0.9734 | 0.050 | |
| 7001–9000 | 3.57 ± 0.03 | 0.09 ± 0.01 | 0.03 ± 0.00 | 2.62 | 79 | 3.58 | 3.68 | 0.9728 | 0.050 | |
| 9001–11,000 | 3.74 ± 0.03 | 0.17 ± 0.10 | 0.05 ± 0.00 | 3.78 | 114 | 3.53 | 3.63 | 0.9713 | 0.051 | |
| 11,001–13,000 | 3.62 ± 0.04 | 0.18 ± 0.01 | 0.05 ± 0.00 | 3.66 | 110 | 3.43 | 3.54 | 0.9707 | 0.051 | |
| >13,000 | 4.14 ± 0.07 | 0.34 ± 0.02 | 0.07 ± 0.00 | 4.79 | 144 | 3.43 | 3.55 | 0.9699 | 0.051 | |
| Total | 3.89 ± 0.00 | 0.22 ± 0.00 | 0.05 ± 0.00 | 4.17 | 126 | 3.54 | 3.59 | 0.9699 | 0.054 | |
Publisher’s Note: MDPI stays neutral with regard to jurisdictional claims in published maps and institutional affiliations. |
© 2022 by the authors. Licensee MDPI, Basel, Switzerland. This article is an open access article distributed under the terms and conditions of the Creative Commons Attribution (CC BY) license (https://creativecommons.org/licenses/by/4.0/).
Share and Cite
Zhou, F.; Liang, Y.; Arbab, A.A.I.; Li, M.; Yang, Z.; Karrow, N.A.; Mao, Y. Analysis of Non-Genetic Factors Affecting Wood’s Model of Daily Milk Fat Percentage of Holstein Cattle. Vet. Sci. 2022, 9, 188. https://doi.org/10.3390/vetsci9040188
Zhou F, Liang Y, Arbab AAI, Li M, Yang Z, Karrow NA, Mao Y. Analysis of Non-Genetic Factors Affecting Wood’s Model of Daily Milk Fat Percentage of Holstein Cattle. Veterinary Sciences. 2022; 9(4):188. https://doi.org/10.3390/vetsci9040188
Chicago/Turabian StyleZhou, Fuzhen, Yan Liang, Abdelaziz Adam Idriss Arbab, Mingxun Li, Zhangping Yang, Niel A. Karrow, and Yongjiang Mao. 2022. "Analysis of Non-Genetic Factors Affecting Wood’s Model of Daily Milk Fat Percentage of Holstein Cattle" Veterinary Sciences 9, no. 4: 188. https://doi.org/10.3390/vetsci9040188
APA StyleZhou, F., Liang, Y., Arbab, A. A. I., Li, M., Yang, Z., Karrow, N. A., & Mao, Y. (2022). Analysis of Non-Genetic Factors Affecting Wood’s Model of Daily Milk Fat Percentage of Holstein Cattle. Veterinary Sciences, 9(4), 188. https://doi.org/10.3390/vetsci9040188


