Article

The Role of Galectin-3 in 1α,25(OH)2D3-Regulated Osteoclast Formation from White Leghorn Chickens In Vitro

1
College of Veterinary Medicine, Yangzhou University, Yangzhou 225009, China
2
Jiangsu Co-Innovation Center for Prevention and Control of Important Animal Infectious Diseases and Zoonoses, Yangzhou 225009, China
3
Jiangsu Key Laboratory of Zoonosis, Yangzhou 225009, China
4
Institutes of Agricultural Science and Technology Development (Joint International Research Laboratory of Agriculture and Agri-Product Safety of the Ministry of Education of China), Yangzhou University, Yangzhou 225009, China
*
Authors to whom correspondence should be addressed.
Jianhong Gu and Wenyan Min equally contributed to this work.
Vet. Sci. 2021, 8(10), 234; https://doi.org/10.3390/vetsci8100234
Submission received: 3 September 2021 / Revised: 1 October 2021 / Accepted: 12 October 2021 / Published: 14 October 2021

Abstract

:
Bones play an important role in maintaining the level of calcium in blood. They provide support for soft tissues and hematopoiesis and undergo continuous renewal throughout life. In addition, vitamin D is involved in regulating bone and calcium homeostasis. Galectin-3 (Gal-3) is a β-galactoside-binding protein that can regulate bone cell differentiation and function. Here, we aimed to study the regulatory effects of Gal-3 on vitamin-D-regulated osteoclastogenesis and bone resorption in chicken. Gal-3 expression in bone marrow stromal cells (BMSCs) from 18-day-old chicken embryos was inhibited or overexpressed. BMSCs were then co-cultured with bone marrow monocytes/macrophages (BMMs) with or without addition of 1α,25(OH)2D3. The results showed that 1α,25(OH)2D3 upregulated the expression of Gal-3 mRNA and receptor activator of nuclear-factor κB ligand (RANKL) expression in BMSCs and promoted osteoclastogenesis, as shown by the upregulated expression of osteoclast (OC) markers (CtsK, CAII, MMP-9, and TRAP) and increased bone resorption, a method for measuring the bone resorption area in vitro. Knockdown of Gal-3 by small-interfering RNA (siRNA) in BMSCs downregulated the expression of RANKL mRNA and attenuated the effects of 1α,25(OH)2D3 on osteoclastogenesis and bone resorption. Conversely, overexpression of Gal-3 in BMSCs enhanced the effects of osteoclastogenesis and bone resorption by increasing the expression of RANKL mRNA. These results demonstrated that Gal-3 mediates the differentiation and bone resorption of osteoclasts regulated by 1α,25(OH)2D3.

1. Introduction

Bone homeostasis is achieved by osteogenesis and bone resorption, which are regulated by osteoblasts (OBs) and osteoclasts (OCs), respectively [1,2]. OCs are specifically responsible for physiological and pathological bone resorption. Excessive increase or decrease in their quantity and activity is detrimental to bone and calcium (Ca) homeostasis [3,4]. Vitamin D is a sterol derivative and has long been considered to promote osteogenesis by promoting the intestinal transport of Ca and osteolysis, ensuring the stability of serum calcium homeostasis. Previous studies have shown that 1α,25-dihydroxyvitamin D3 (1α,25[OH]2D3) can upregulate receptor activator of nuclear-factor κB ligand (RANKL) expression in OBs and bone marrow stromal cells (BMSCs) in mammalians, indirectly inducing bone marrow monocytes/macrophages (BMMs) to differentiate into OCs for bone resorption [5,6,7].
Galectin-3 (Gal-3) is a member of the β-galectin family and presents in the nucleus. Gal-3 can regulate cell migration, adhesion, apoptosis, and gene expression [8,9]. Studies have shown that Gal-3 is expressed in chondrocytes, OBs, BMSCs, and OCs and regulates osteocyte differentiation and function [10,11]. In Gal-3 (Gal-3−/−) knockout mice, OB and OC differentiation and bone resorption were impaired [12]. It has also been confirmed that Gal-3 could overlap with the transcription factor Runx2, which regulates OB differentiation [13]. Furthermore, Gal-3 can regulate bone marrow mesenchymal stem cell migration through RhoA-GTP signaling and may be a potential target for treating bone reconstruction-related diseases [14]. Aubin et al. found that 1α,25(OH)2D3 promoted Gal-3 expression in a rat OB-derived sarcoma cell line, ROS 17/2.8 [15]. Simon et al. reported that knockout Gal-3 in OBs displayed higher osteoclastogenesis, independently of the RANKL signaling pathway [16]. However, the role of Gal-3 in 1α,25(OH)2D3-regulated osteoclastogenesis and bone resorption and whether it affects vitamin D regulation of osteoclastogenesis in poultry (chicken) is unclear.
Chicken bones have been used in bone development and bone injury studies for a long time as they are similar to those of humans and other vertebrates, and vitamin D has been found to regulate bone development in chickens [17,18,19]. Our previous study showed that 1α,25(OH)2D3 promoted osteoclastogenesis in a chicken BMSC–BMM co-culture system in a dose-dependent manner, with 10−8 mol/L having the most significant effect [20]. In addition, 10−8 mol/L 1α,25(OH)2D3 was used in the current study to further examine the effects of vitamin D on Gal-3 expression in BMSCs, BMMs, and BMSC–BMM co-culture. Small-interfering RNA (siRNA) and gene overexpression were used to knockdown or overexpress Gal-3 to observe the effects of 1α,25(OH)2D3 on osteoclastogenesis, bone resorption, and RANKL signaling and to examine whether Gal-3 affects 1α,25(OH)2D3 regulation of osteoclastogenesis through RANKL signaling. These results will provide a foundation for studies on vitamin D regulation of bone and calcium homeostasis in poultry.

2. Materials and Methods

2.1. Animals

The white leghorn chicken embryos used here were fertilized SPF-grade eggs from Single Comb White Leghorn (Yigida Biotechnology, Jining, China). The SPF-grade eggs were incubated at 37 °C and 60% humidity until they were 18 days old. The animal use was approved by the Animal Care and Use Committee of Yangzhou University (SYXK [Su] 2016-0020).

2.2. Isolation of BMSCs and BMMs

Tibias and femurs were separated, and bone marrow cells were filtered with a 200-mesh sieve and then centrifuged at 1200 r/min for 5 min. The cells were subsequently resuspended in α-MEM (Thermo Fisher Scientific, Waltham, MA, USA) supplemented with 10% FBS (EallBio, Beijing, China) and then incubated in an incubator (5% CO2, 37 °C). After 2 days, the BMSCs were adherent and the BMMs were non-adherent.

2.3. Transfection

The sequence of Gal-3 siRNA was designed as 5′-AGAGAACAGCTCCTAGATT-3′, and the sequences of negative control (NC) siRNA were designed as 5′-GGCTCTAGAAAAGCCTATGC-3′ (RiboBio, Guangzhou, China).
BMSCs were seeded in cell cultural plates (Corning, New York, NY, USA) or bone resorption cultural plates (Sigma-Aldrich, St. Louis, MO, USA). After 12 h, the BMSCs were transfected with siRNAs. Transfection was performed using LipofectamineTM 3000 (Thermo Fisher Scientific, Waltham, MA, USA) according to the manufacturer’s instructions, as previously reported [21].

2.4. Overexpression of Gal-3 Plasmids

Gal-3 homologous recombination was performed with PEXP-RB-MAM-EGFP transient vector (RiboBio, Guangzhou, China). The gene EGFP-Gal-3 was used for cell transfection, and the empty carrier control was named EGFP. Transfection was performed using LipofectamineTM 3000 (Thermo Fisher Scientific, Waltham, MA, USA) according to the manufacturer’s instructions, as previously reported [21].

2.5. Co-Culture of BMSCs and BMMs

BMSCs were seeded into cell cultural plates or bone resorption cultural plates at a ratio of 1:100 (BMSCs:BMMs). Cells were then treated with 10−8 mol/L 1α,25(OH)2D3 (Sigma-Aldrich, USA) for 5 d (control group without 1α,25(OH)2D3). The medium was changed every 2 days. At the end of the incubation period, the medium was decanted from the cell cultures. BMSCs were transfected with NC siRNA and Gal-3 siRNA for 10 h. BMMs were seeded into these transfected BMSC cultures at a ratio of 1:100 (BMSCs:BMMs).
At the end of the incubation period, the medium was decanted from the cell cultures. BMSCs were transfected with EGFP plasmid and EGFP-Gal-3 for 10 h. BMMs were transferred into BMSCs at a ratio of 100:1 (BMMs:BMSCs). Then, the medium was changed to α-MEM (containing 10% FBS) for 5 d. The medium was changed every 2 days.

2.6. Identification of Osteoclastogenesis

At the end of the incubation period, the medium was decanted from the cell cultures. Cells were fixed with 4% paraformaldehyde for 10 min (New Cell & Molecular Biotech Co., Ltd., Hangzhou, China). Tartrate-resistant Acid Phosphatase (TRAP) staining solution was added according to the manufacturer’s instructions (Sigma-Aldrich, St. Louis, MO, USA), as previously described [22].

2.7. Identification of Bone Resorption

At the end of the incubation period, the medium was decanted from the cell cultures. PBS was used to repeatedly wash the plates, and photographs were subsequently taken under an inverted microscope. Image-Pro Plus software was used for calculation of the area of the bone resorption pits.

2.8. qRT-PCR

RNA was extracted using Trizol (Thermo Fisher Scientific, Waltham, MA, USA) and qRT-PCR following the manufacturer’s instructions, as previously described [23]. The expression of the targeting genes cathepsin K (CtsK), TRAP, matrix metalloproteinase-9 (MMP-9), carbonic anhydrase II (CAII), RANKL, osteoprotegrin (OPG), and Gal-3 mRNA was measured. GAPDH was used as an internal reference. All primers used are shown in Table 1.

2.9. ELISA

The supernatants of cells were collected, and the levels of CtsK, MMP-9, RANKL, and OPG were measured using chicken ELISA kits (Shanghai Enzyme-linked Biotechnology Co., Ltd., Shanghai, China) according to the manufacturer’s instructions. The OD value was measured at 450 nm within 15 min. Protein content was calculated based on the OD.

2.10. Statistical Analysis

Results are expressed as the mean ± SD from at least three independent experiments. Significance was calculated by one-way analysis of variance (ANOVA) using SPSS 19.0 software. p-values lower than 0.05 were considered statistically significant.

3. Results

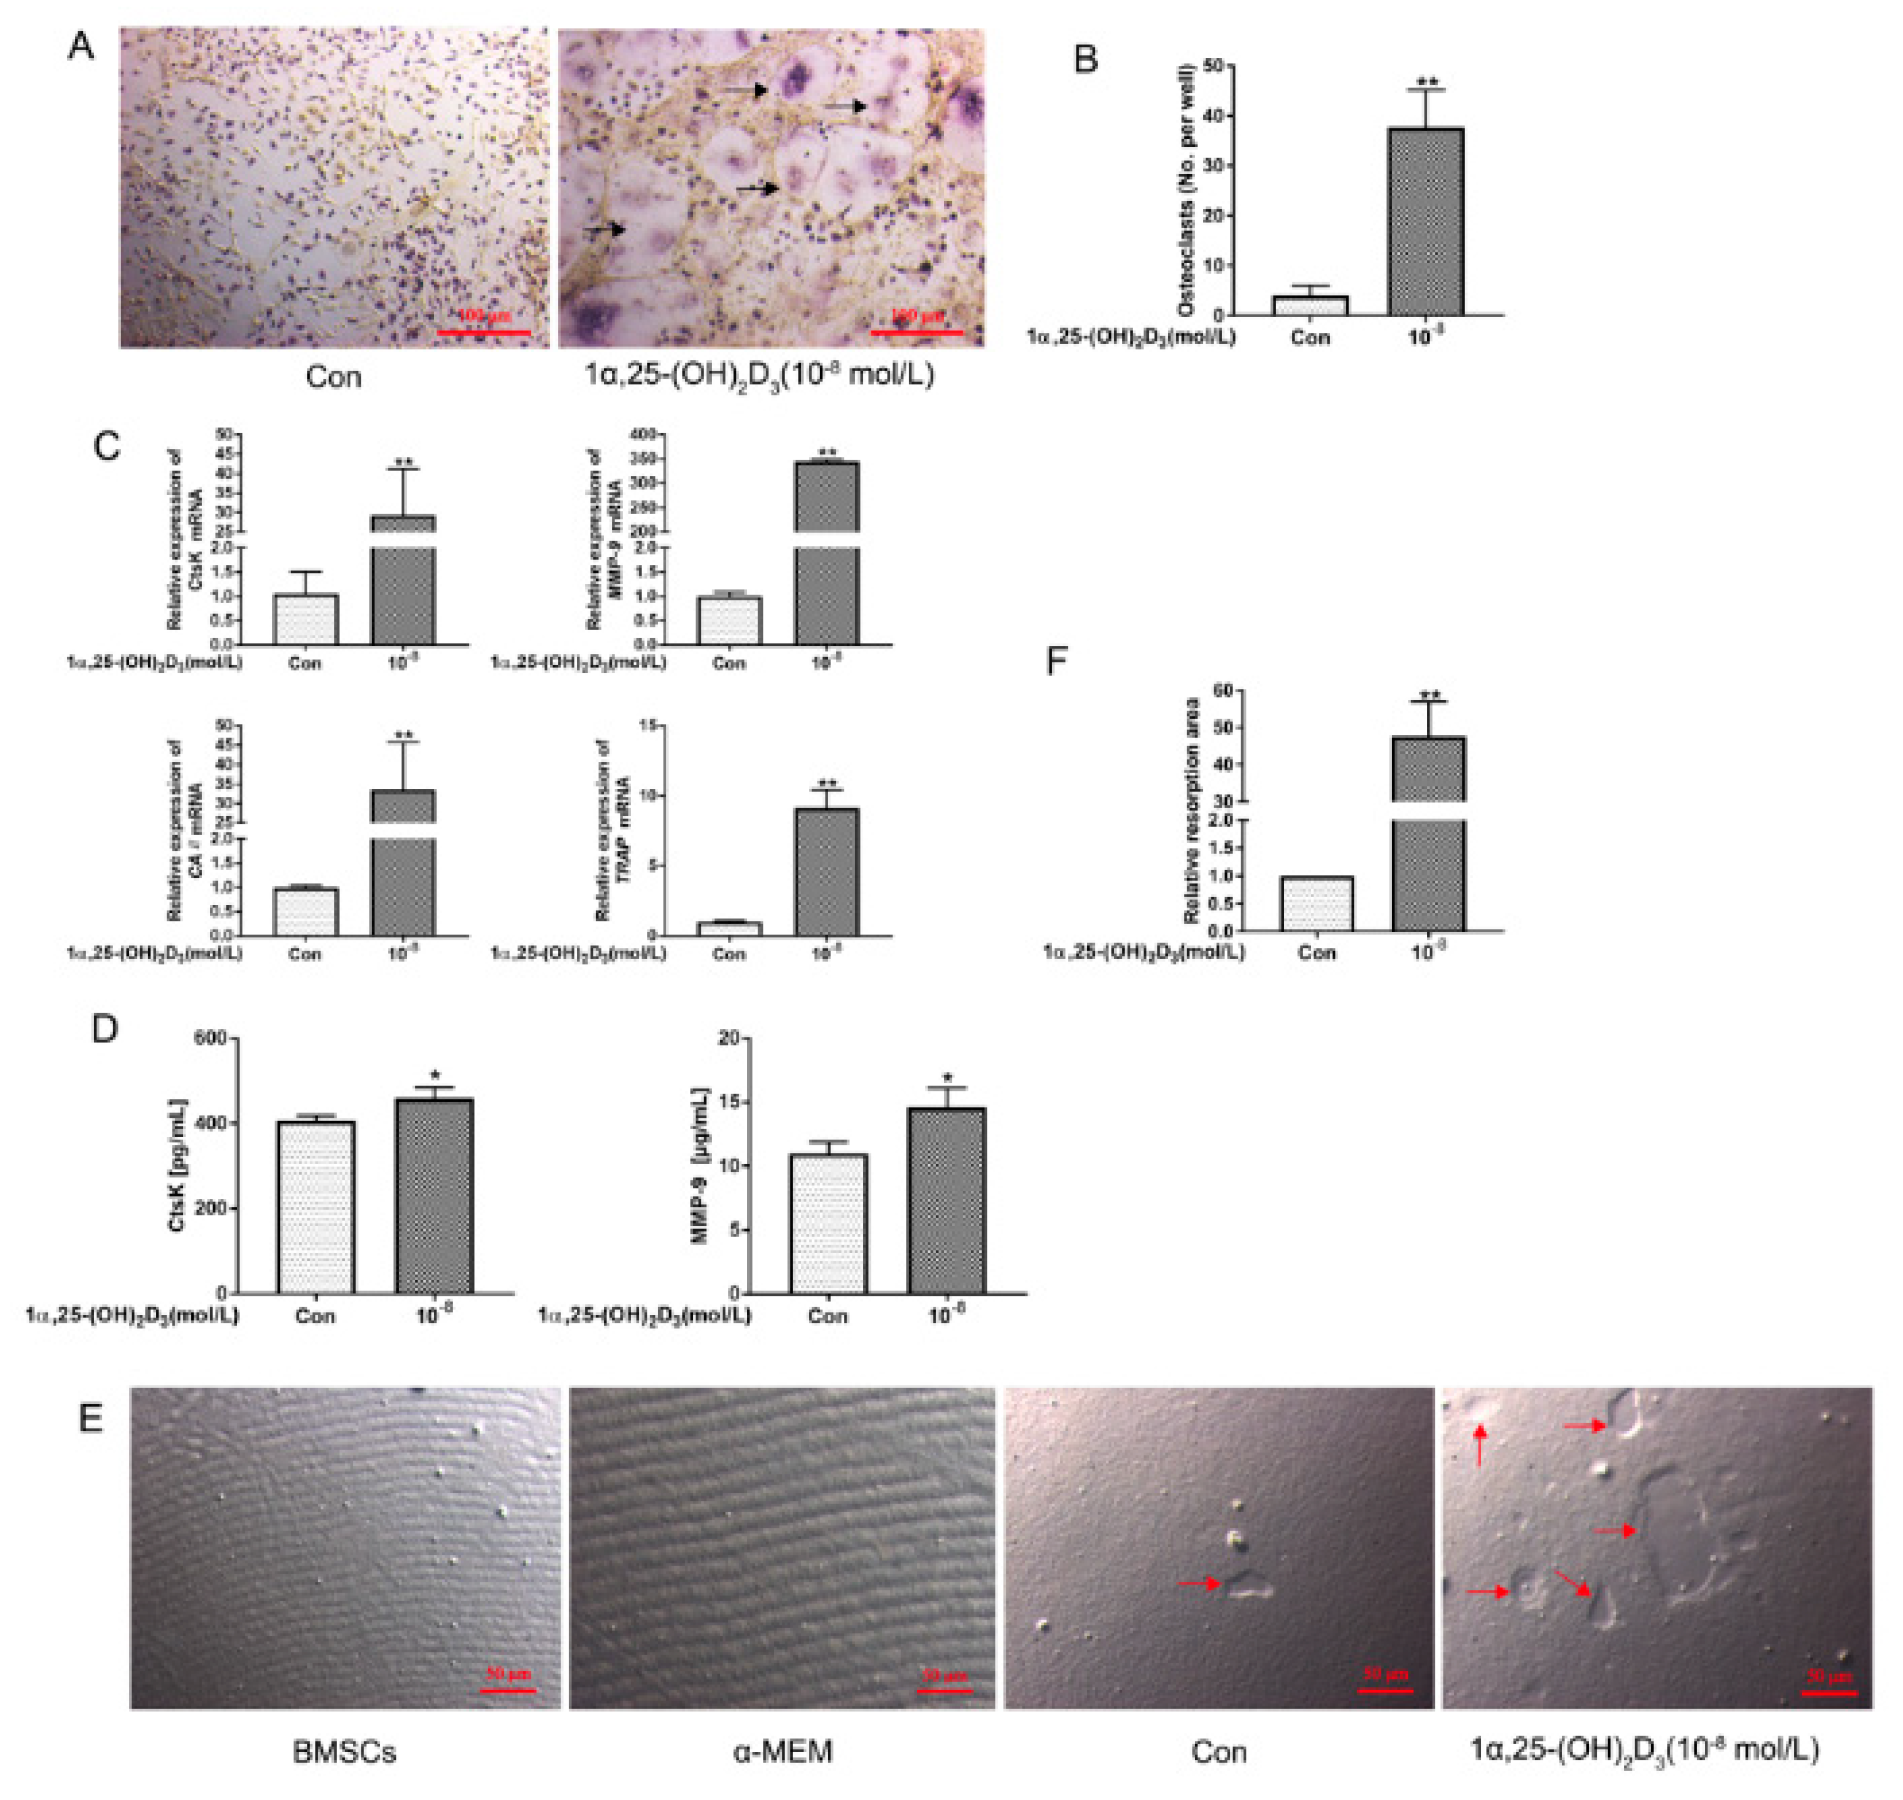
3.1. 1α,25(OH)2D3 Promoted Osteoclastogenesis and Bone Resorption

BMSCs were co-cultured with BMMs for 5 d with or without the addition of 10−8 mol/L 1α,25(OH)2D3. As shown in Figure 1A,B, 10−8 mol/L 1α,25(OH)2D3 significantly (p < 0.01) promoted osteoclastogenesis, characterized by multinucleation and the wine-colored cytoplasm. Similarly, 10−8 mol/L 1α,25(OH)2D3 significantly (p < 0.01) upregulated the expression of CtsK, TRAP, MMP-9, and CAII mRNA (Figure 1C) and significantly (p < 0.05) increased the protein levels of CtsK and MMP-9 in the medium supernatant (Figure 1D).
In addition, the area of bone resorption pits was significantly (p < 0.01) increased in the 10−8 mol/L 1α,25(OH)2D3 group (Figure 1E,F). These results show that 10−8 mol/L 1α,25(OH)2D3 promotes osteoclastogenesis and bone resorption in the chicken BMSC–BMM co-culture system.

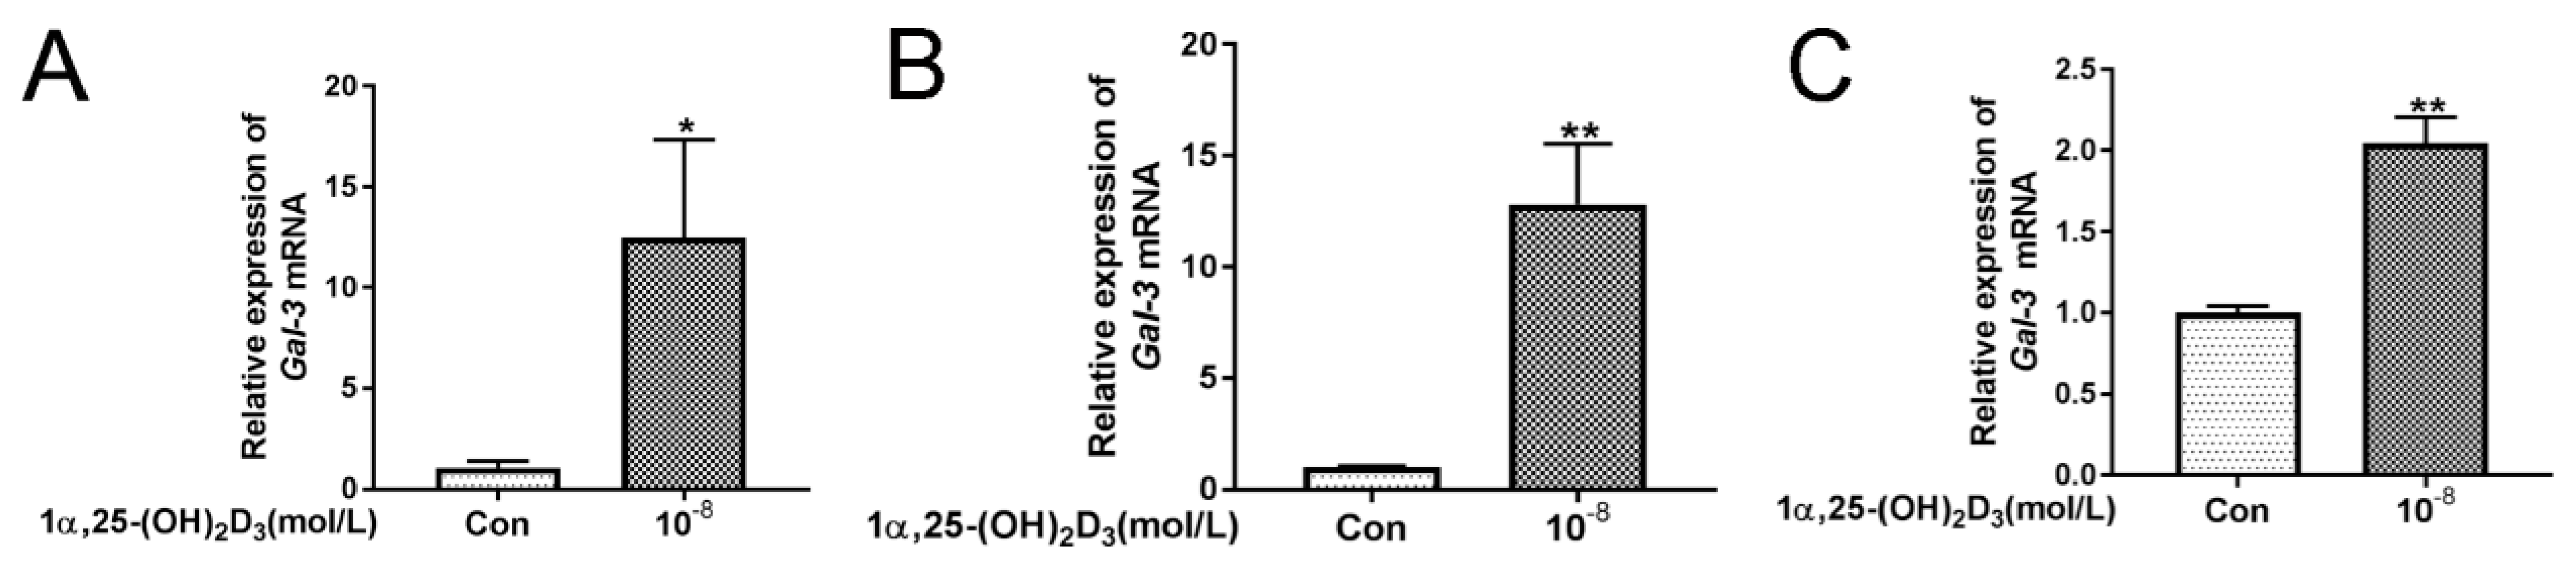
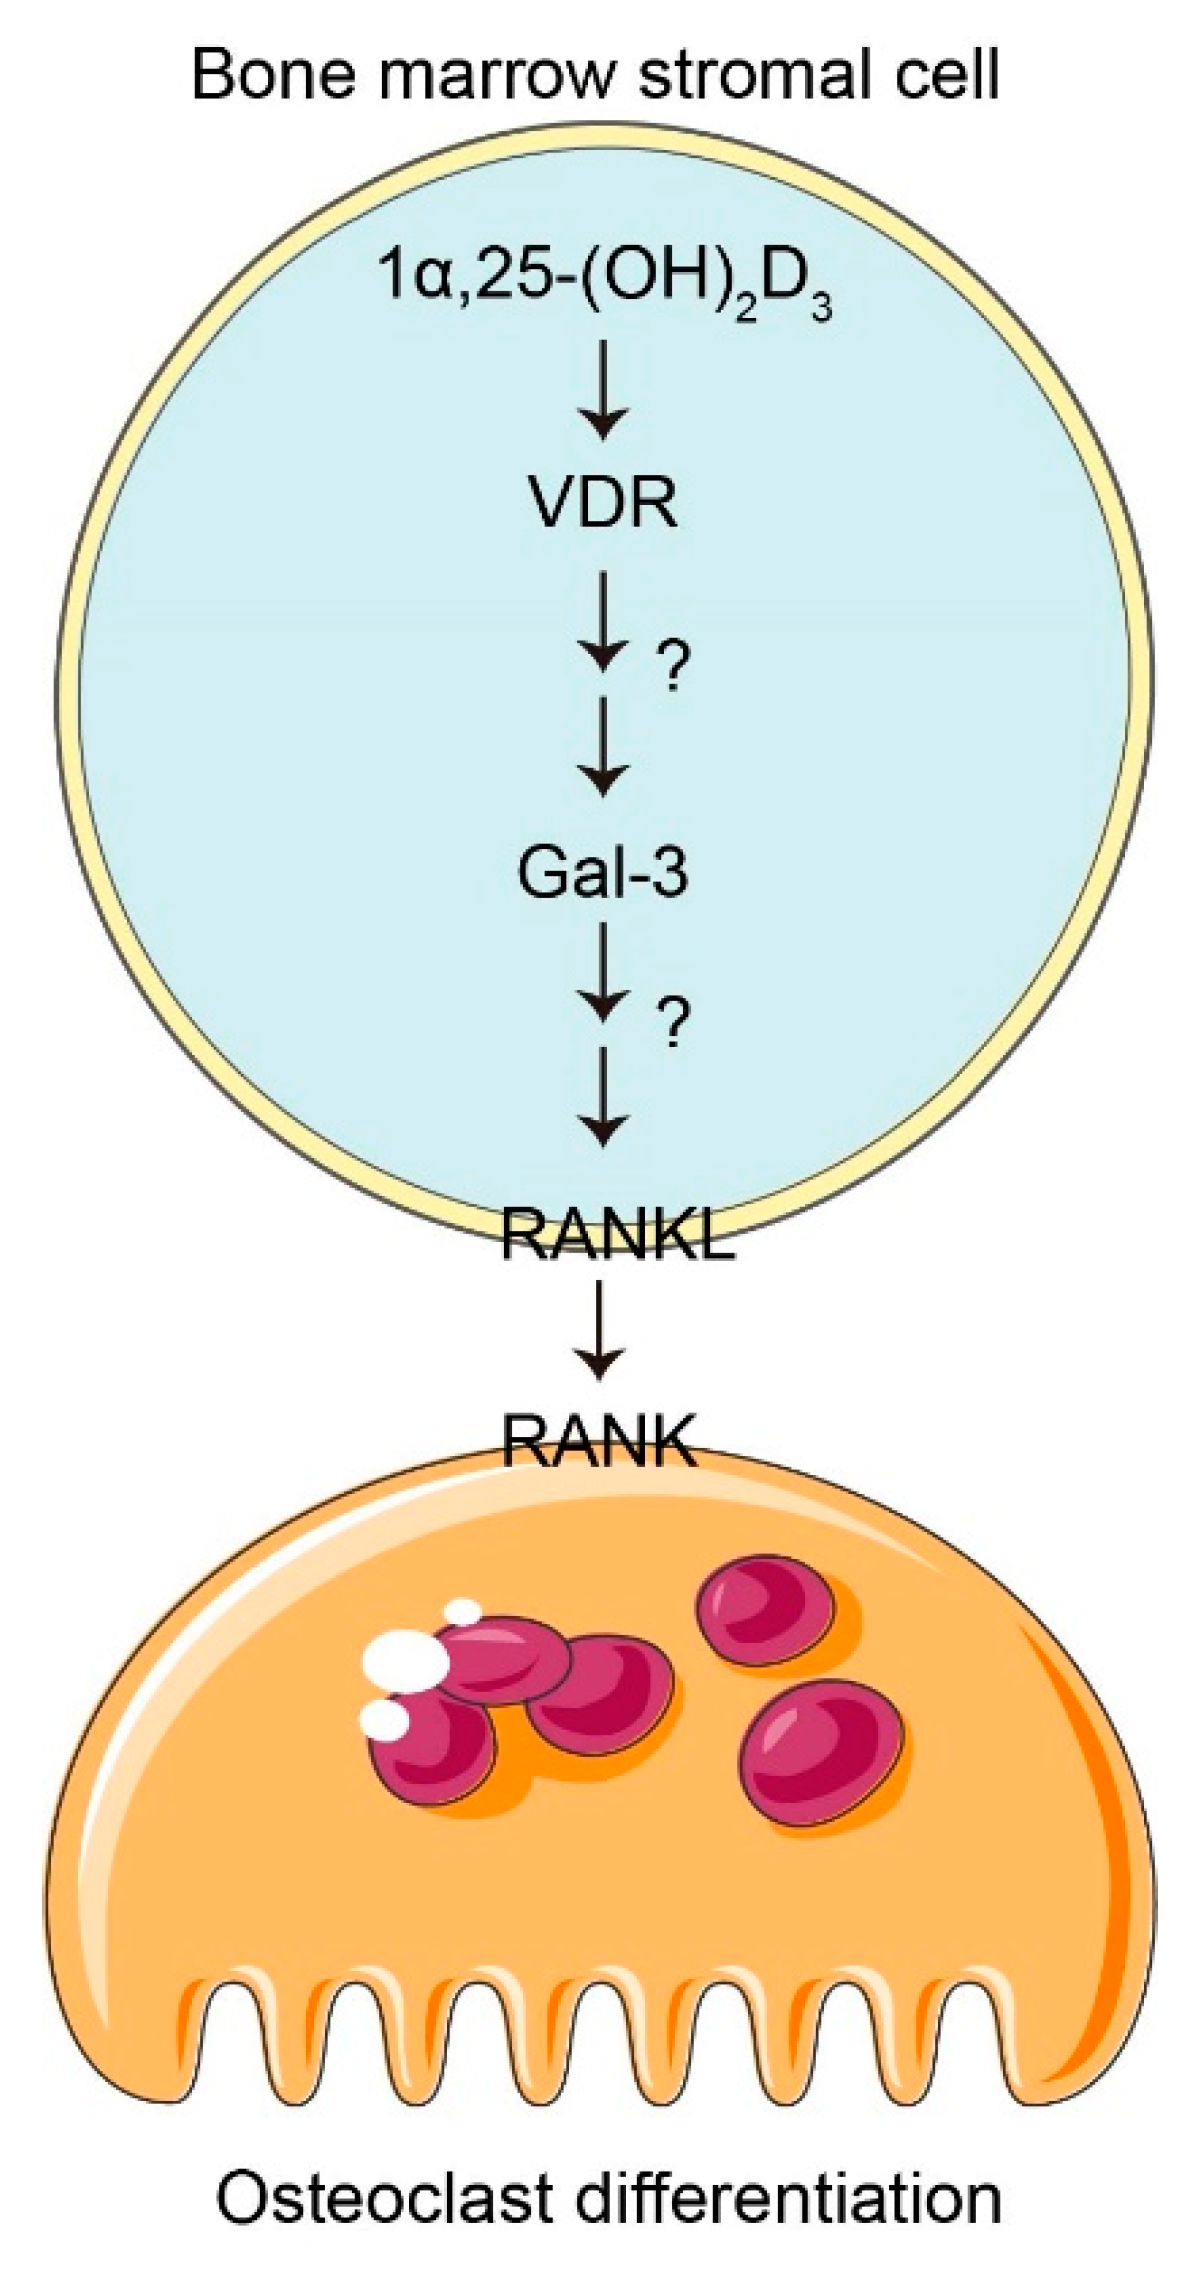
3.2. 1α,25(OH)2D3 Promoted the Expression of Gal-3

Application of 10−8 mol/L 1α,25(OH)2D3 significantly (p < 0.05 or p < 0.01) upregulated the expression of Gal-3 mRNA in the BMSC–BMM co-culture system, BMSCs, and BMMs (Figure 2A–C). These results indicated that 10−8 mol/L 1α,25(OH)2D3 increased the Gal-3 expression.

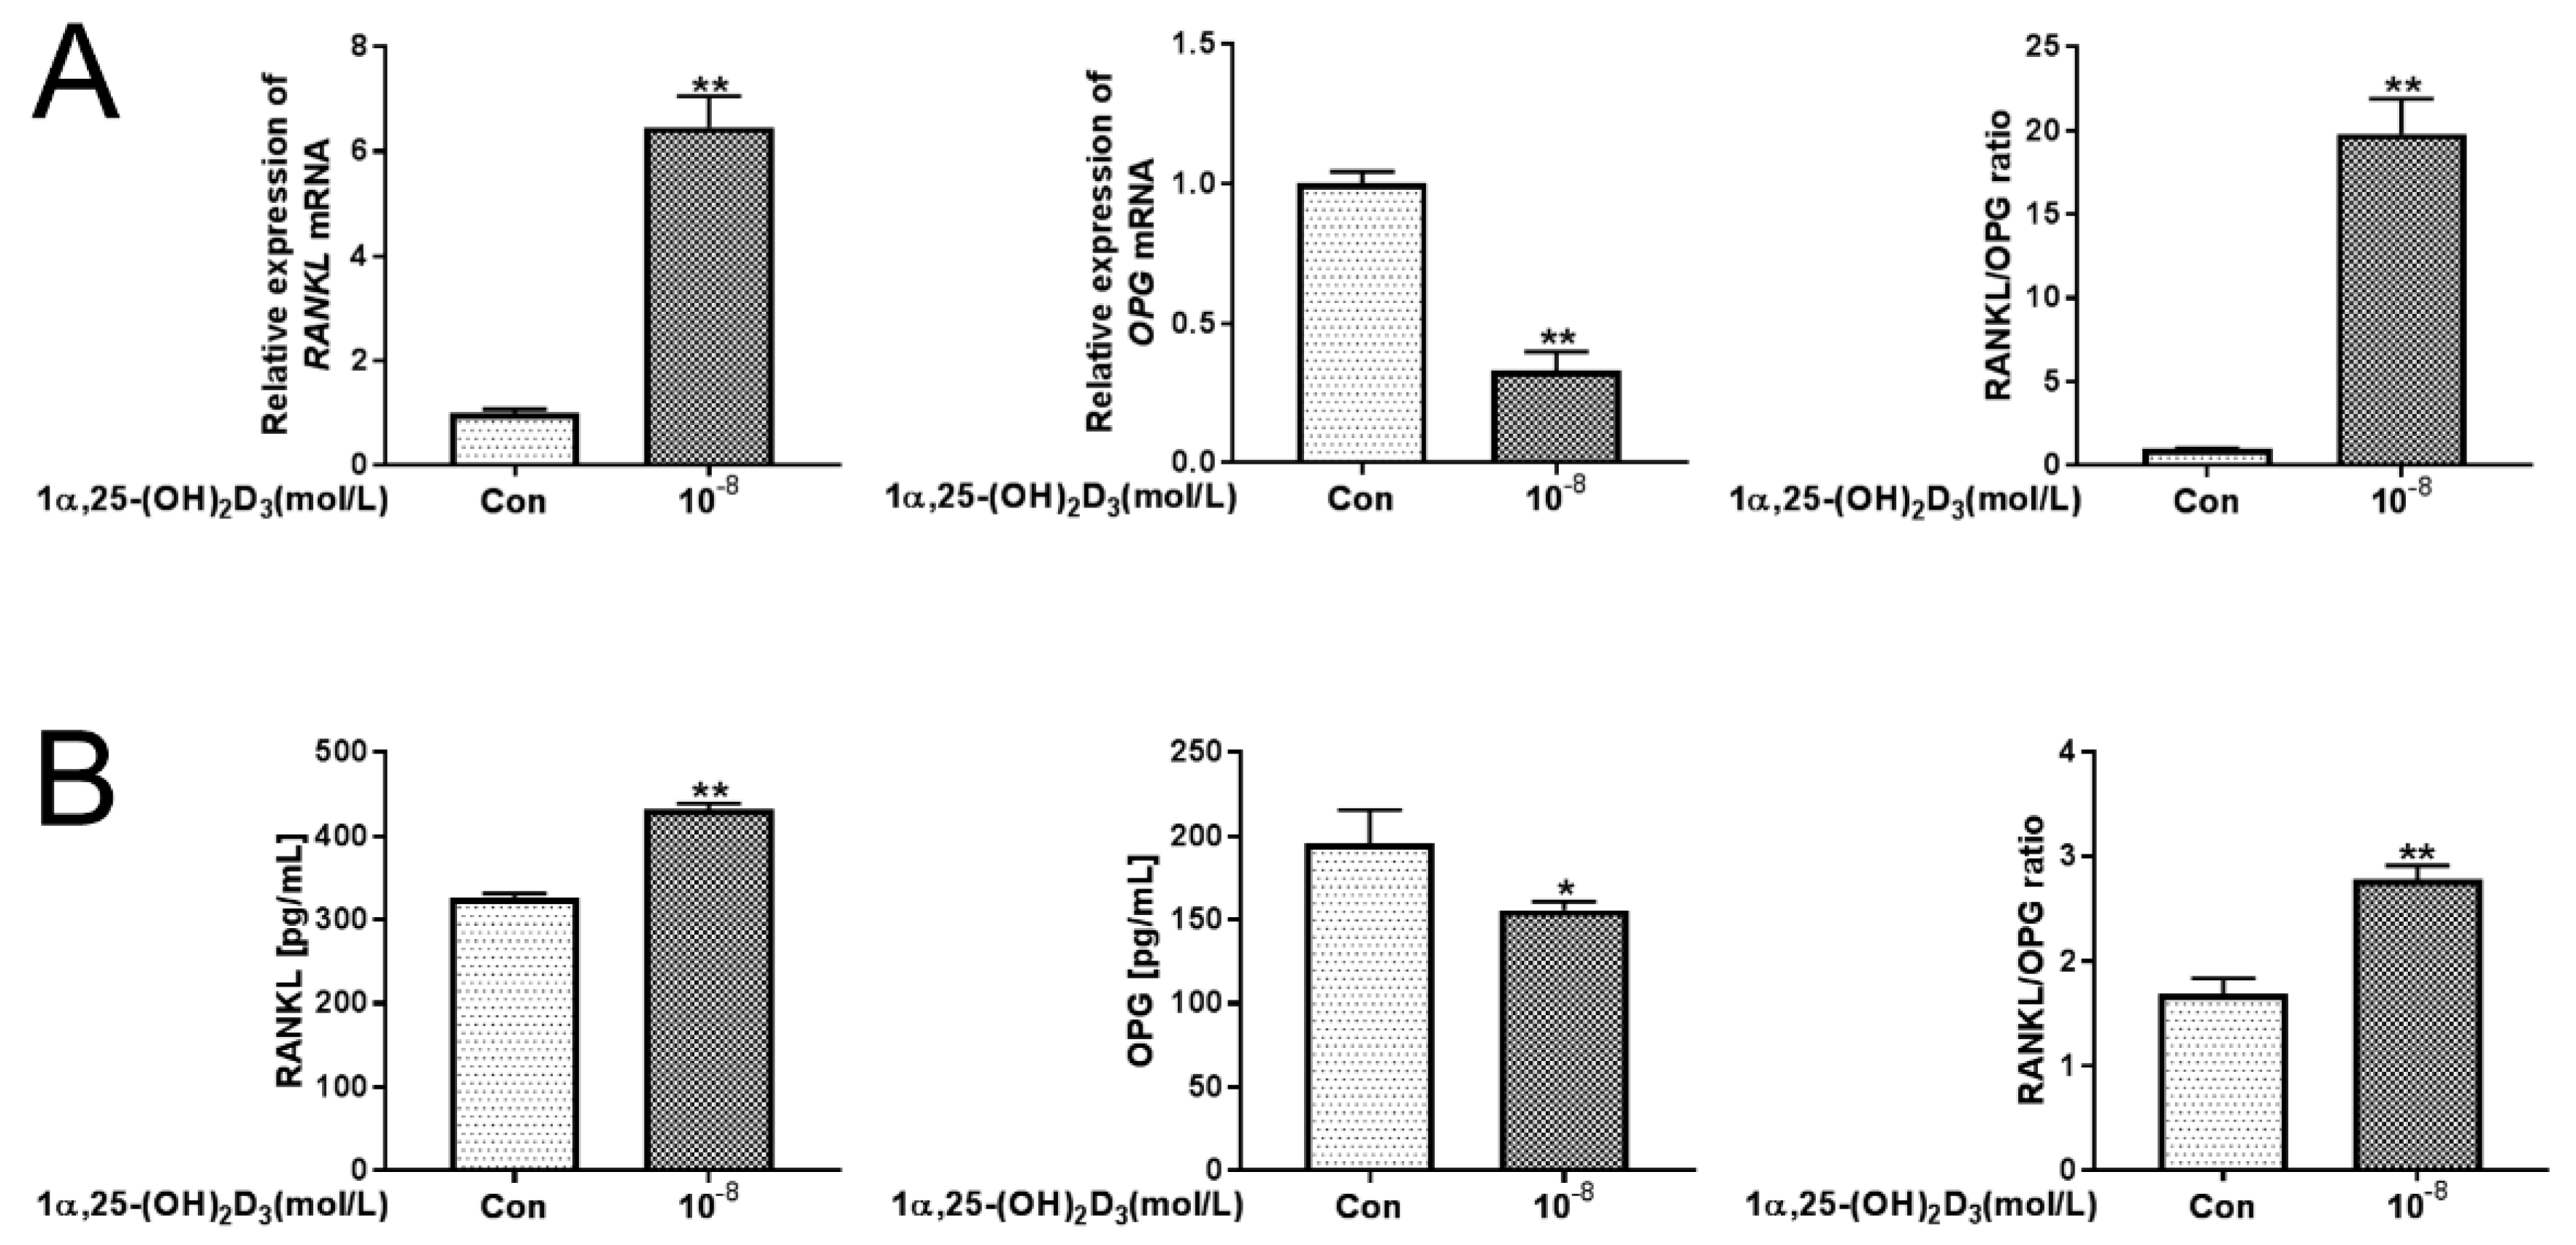
3.3. 1α,25(OH)2D3 Promoted RANKL Expression and Inhibited OPG Expression

Application of 10−8 mol/L 1α,25(OH)2D3 significantly (p < 0.01) inhibited the expression of OPG mRNA in BMSCs, but the expression of RANKL mRNA and the ratio of RANKL/OPG mRNA were significantly (p < 0.01) increased compared with the control group (Figure 3A). Similarly, 10−8 mol/L 1α,25(OH)2D3 significantly (p < 0.01) upregulated the protein levels of RANKL protein and the ratio of RANKL/OPG protein in the medium supernatant but downregulated the protein levels of OPG protein (Figure 3B). This shows that 10−8 mol/L 1α,25(OH)2D3 increased the RANKL/OPG ratio in BMSCs.

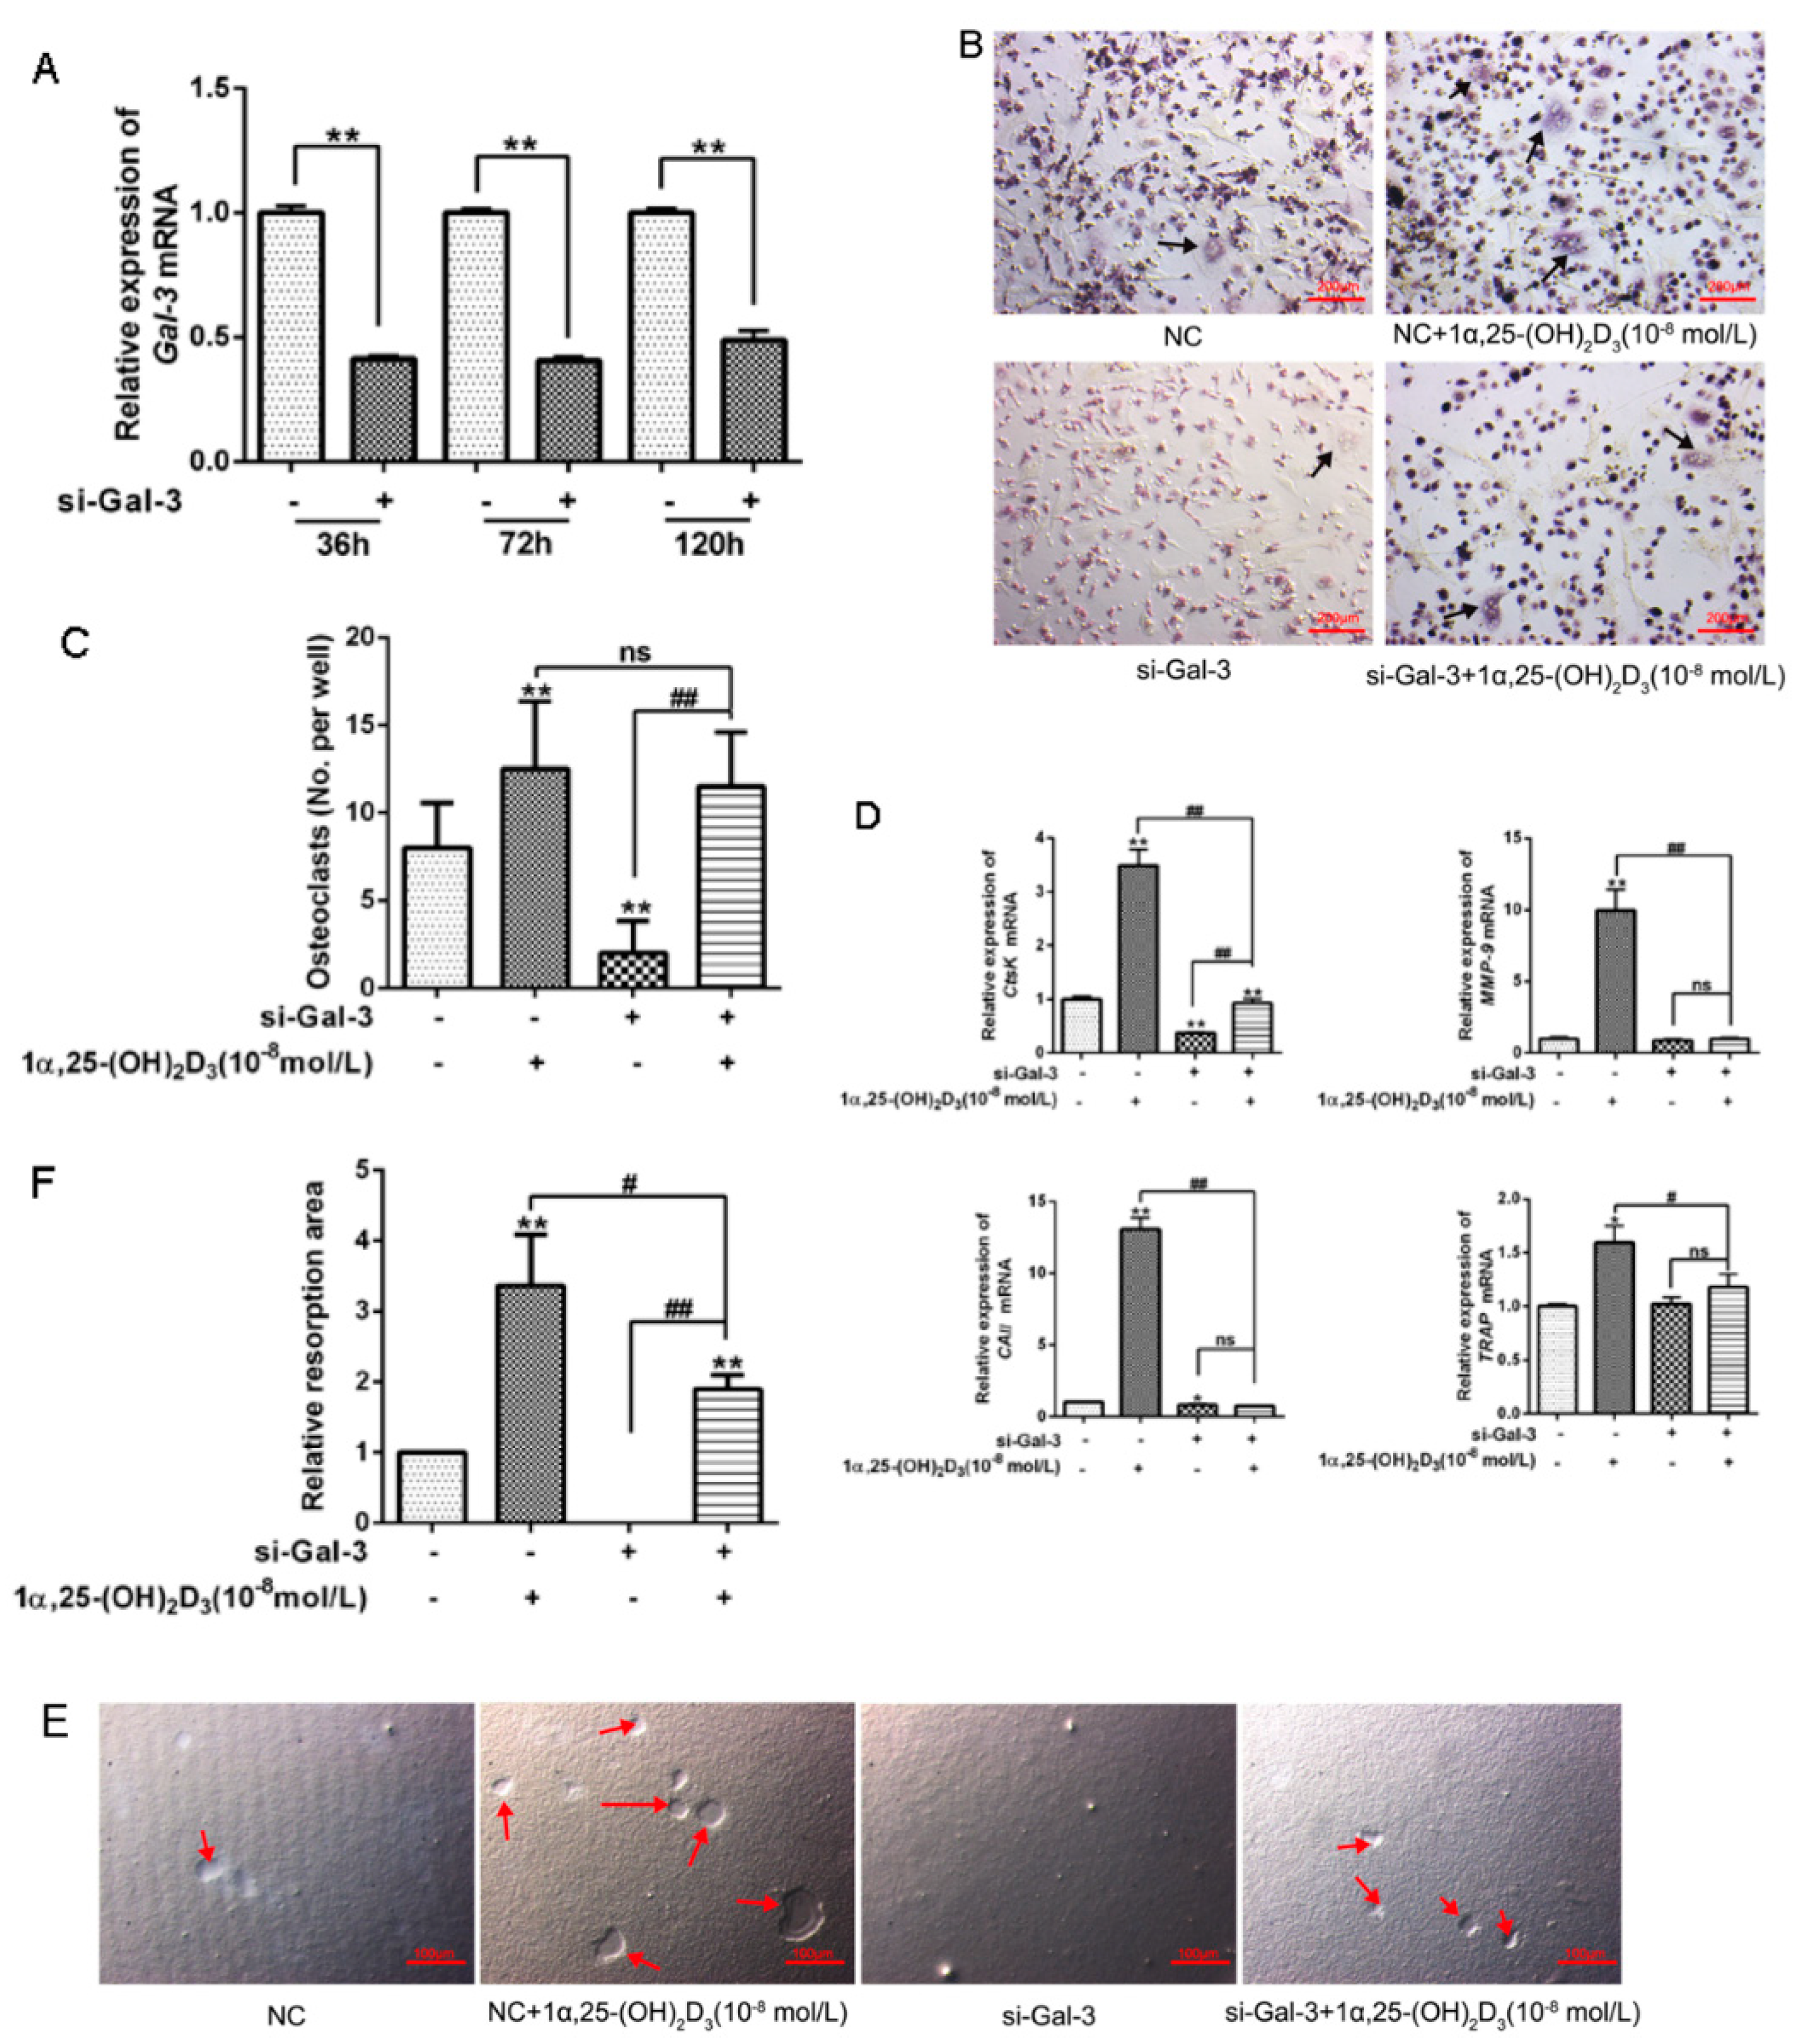
3.4. Knockdown of Gal-3 Inhibited Osteoclastogenesis

BMSCs were transfected with targeting of Gal-3 siRNA for 36, 72, and 120 h, and the expression of Gal-3 mRNA was significantly (p < 0.01) decreased in the si-Gal-3 group at each time point (Figure 4A).
As shown in Figure 4B–F, 10−8 mol/L 1α,25(OH)2D3 significantly (p < 0.01 or p < 0.05) promoted osteoclastogenesis compared with the NC group; upregulated the expression of CtsK, TRAP, MMP-9, and CAII mRNA; and enhanced the activity of bone resorption. However, knockdown of Gal-3 suppressed the expression of OC markers mRNA and the activity of bone resorption under treatment with 10−8 mol/L 1α,25(OH)2D3. These results show that 10−8 mol/L1α,25(OH)2D3 regulates osteoclastogenesis and bone resorption in BMSCs through the regulation of Gal-3.

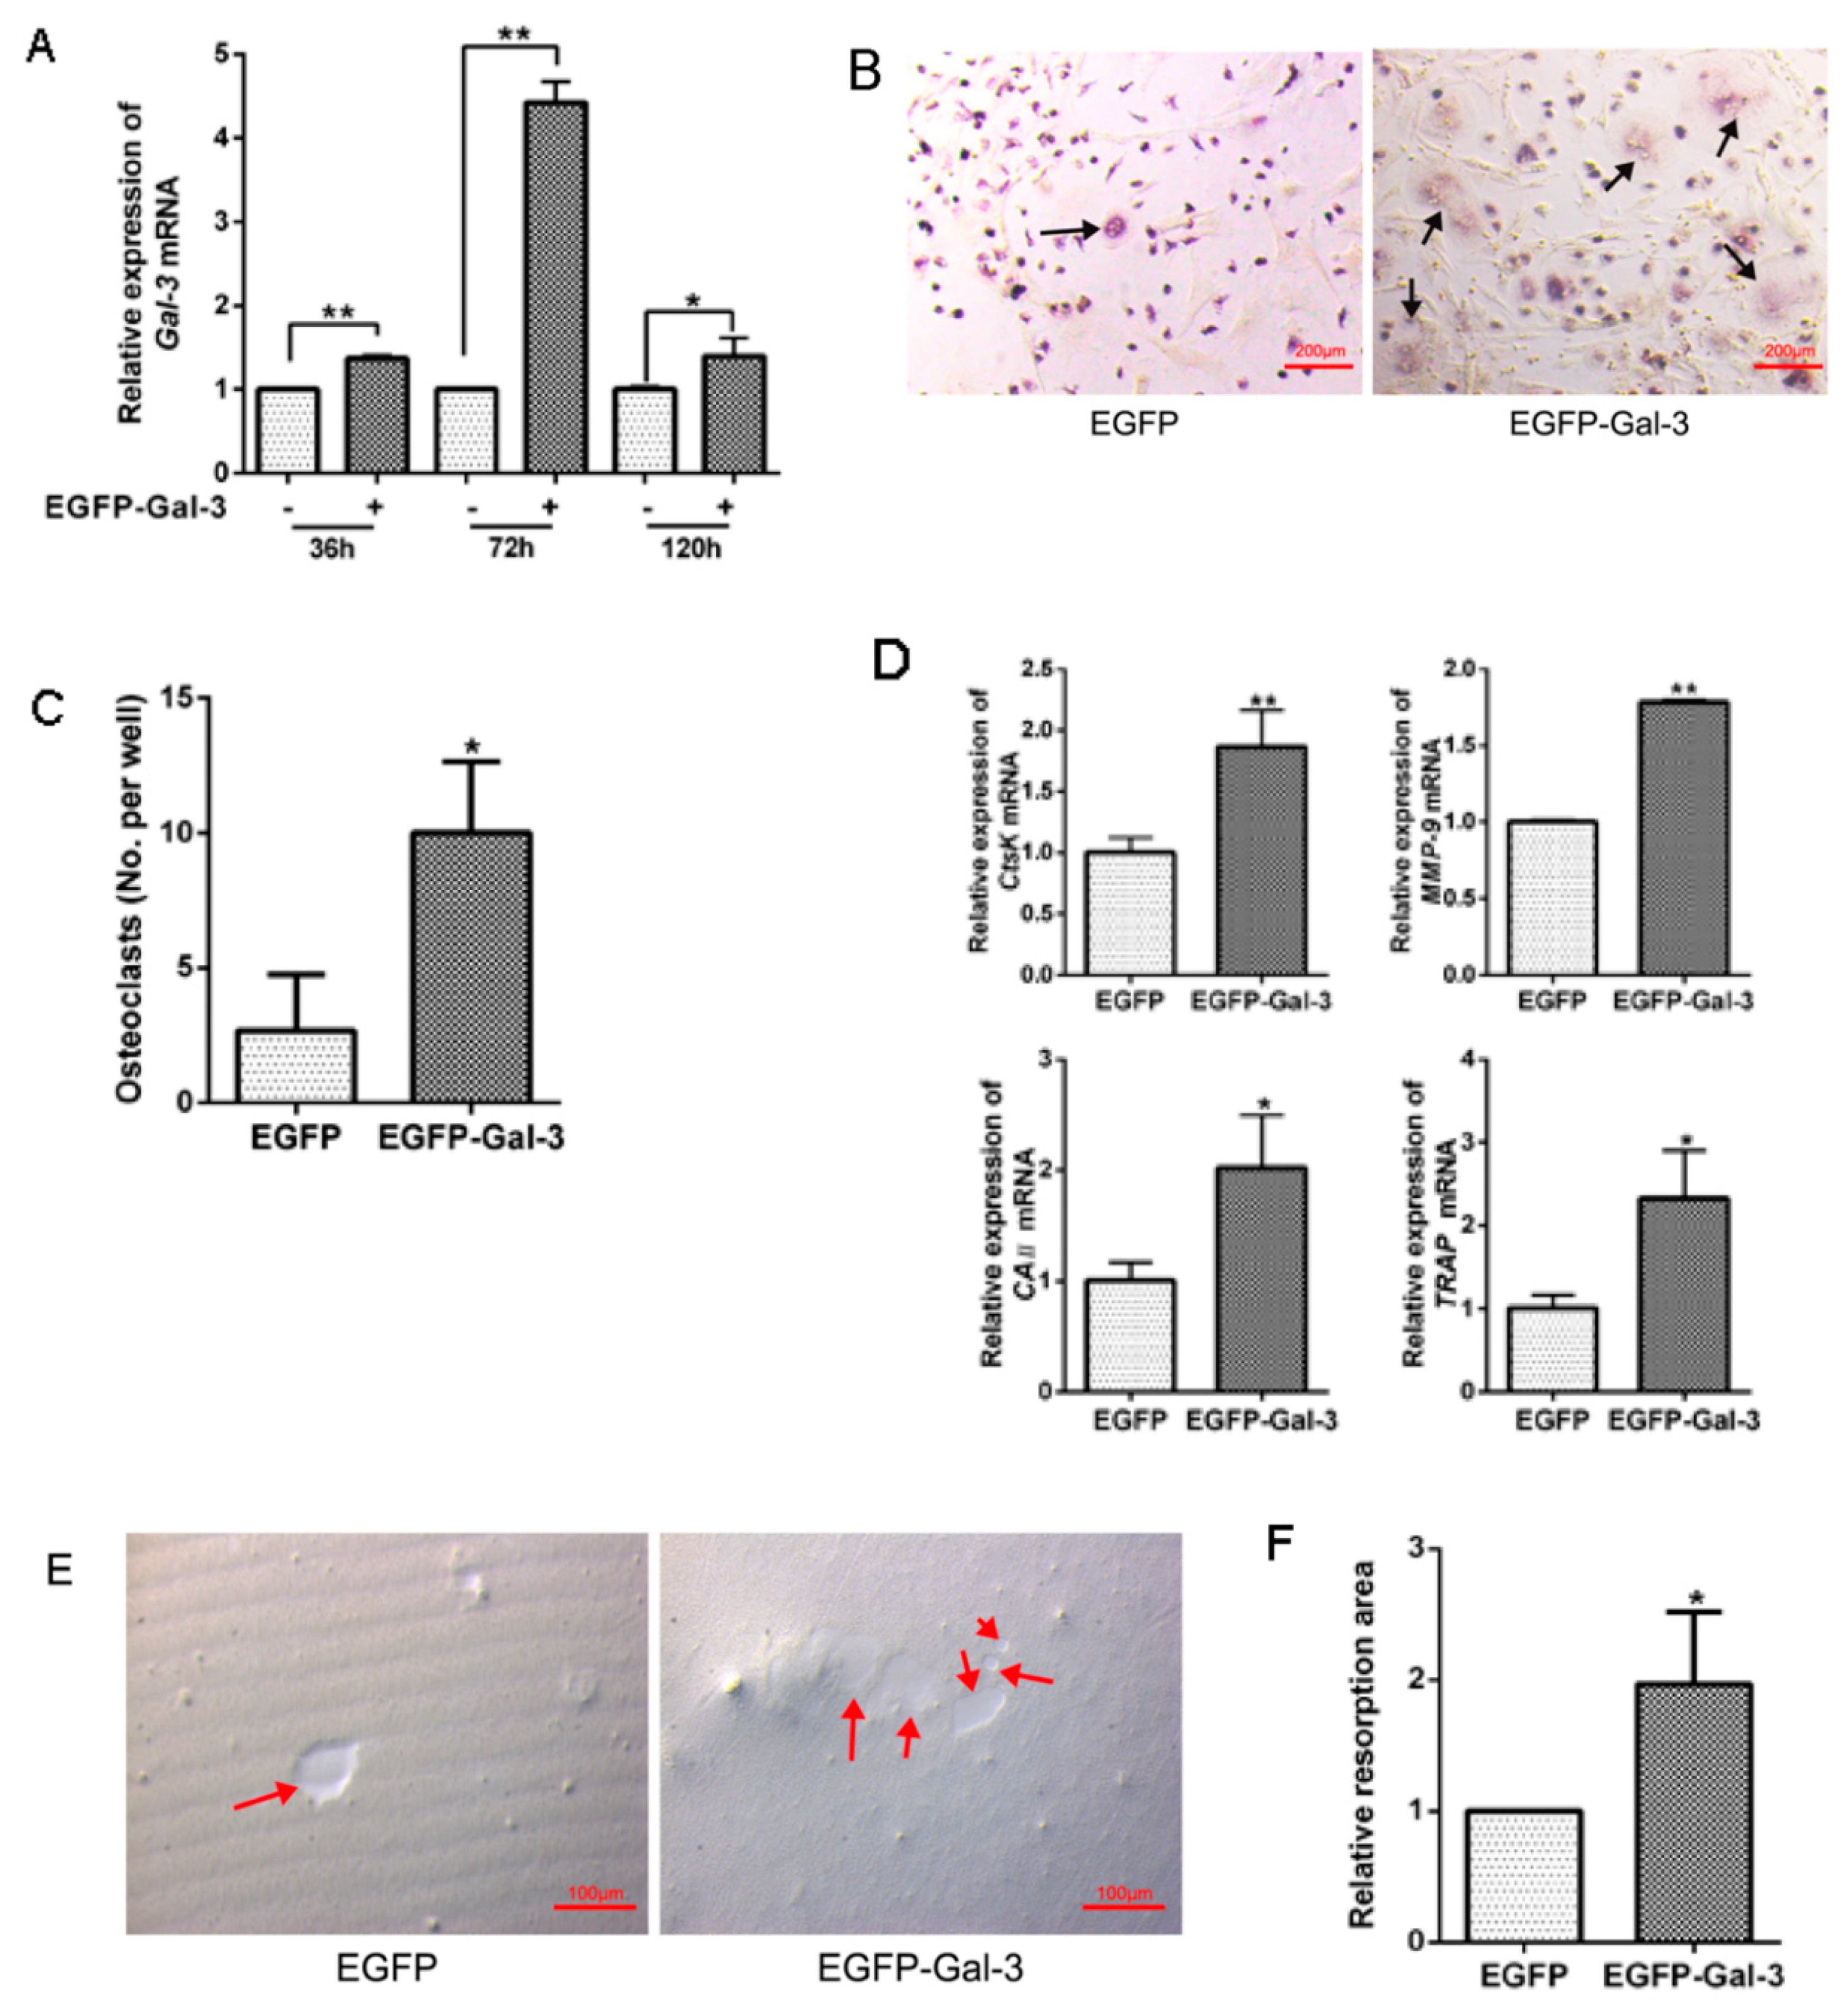
3.5. EGFP-Gal-3 Promoted OC Differentiation

BMSCs were transfected with EGFP-Gal-3 or EGFP for 36, 72, and 120 h. Compared with the EGFP group, the expression of Gal-3 mRNA significantly (p < 0.01) increased following treatment with EGFP-Gal-3 (Figure 5A). In addition, the amount of TRAP; the expression of CtsK, TRAP, MMP-9, and CAII mRNA; and the area of bone resorption were significantly (p < 0.01 or p < 0.05) increased in the EGFP-Gal-3 group (Figure 5B–F). These results indicate that overexpression of Gal-3 in BMSCs could upregulate osteoclastogenesis and bone resorption.

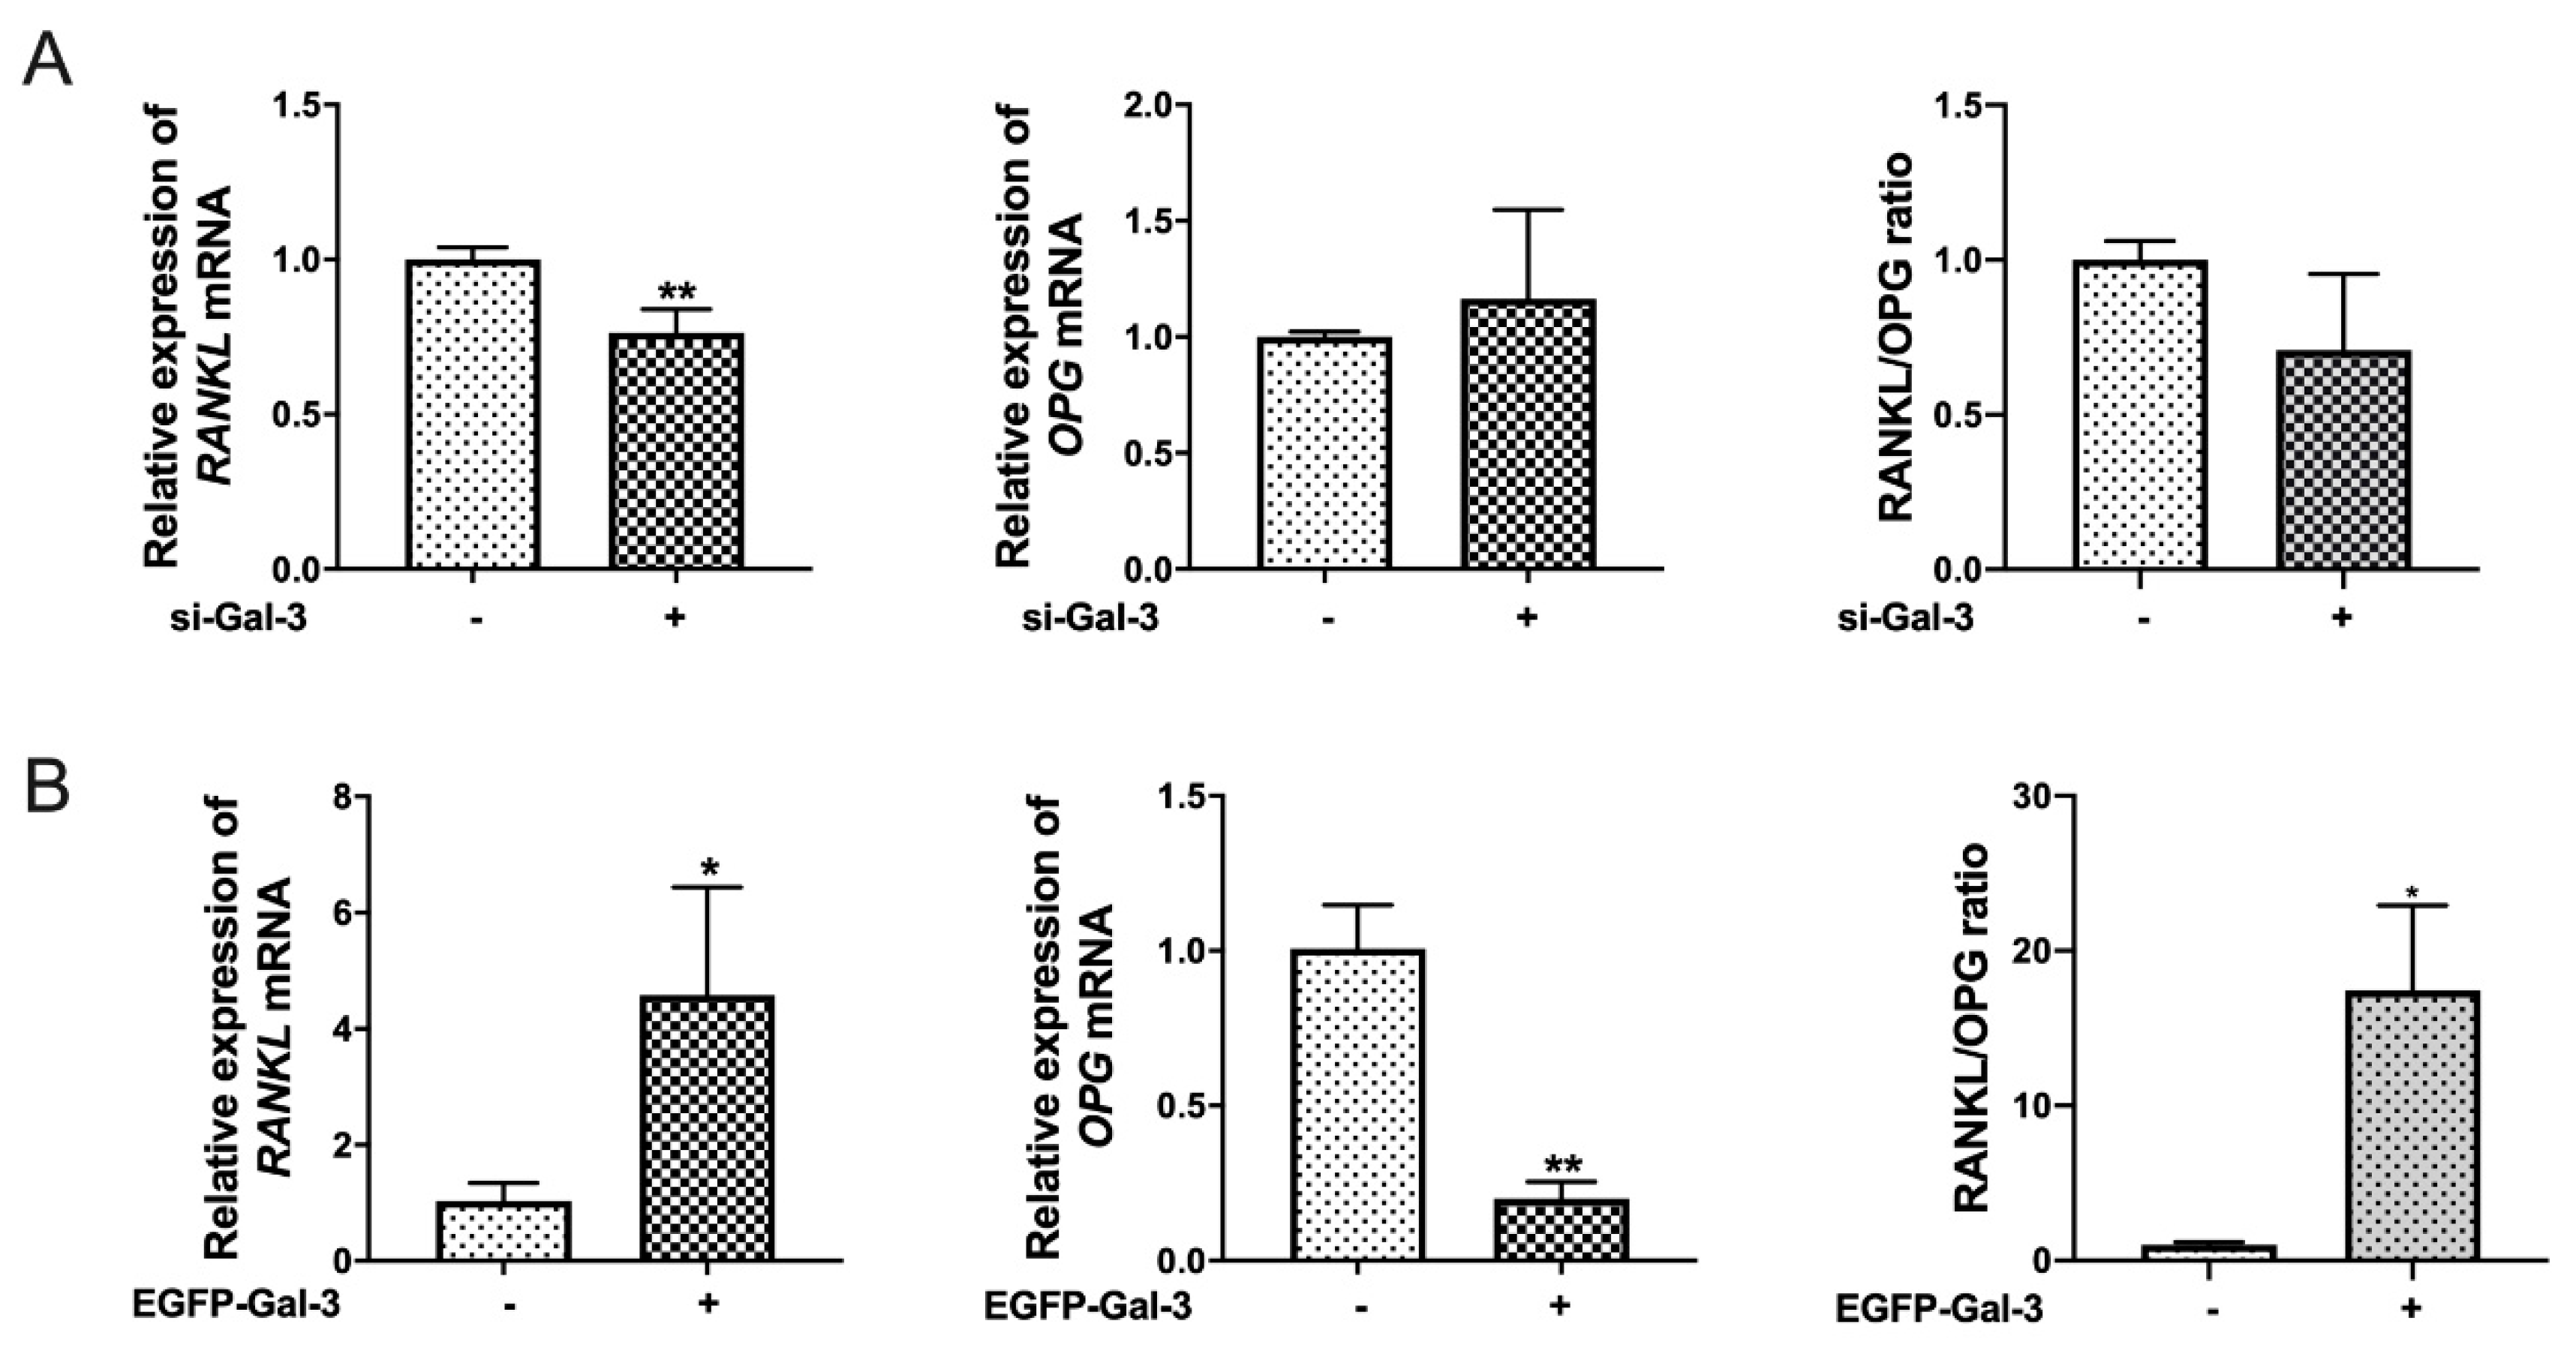
3.6. Effects of Si-Gal-3 and EGFP-Gal-3 on RANKL Expression in BMSCs

As shown in Figure 6, si-Gal-3 significantly (p < 0.01) inhibited the expression of RANKL mRNA, but there was no significant (p > 0.05) difference in the expression of OPG mRNA and the ratio of RANKL/OPG. Conversely, overexpression of Gal-3 significantly (p < 0.05) upregulated the expression of RANKL mRNA and the ratio of RANKL/OPG but significantly inhibited OPG expression (p < 0.01) (Figure 6B). These results show that Gal-3 could regulate RANKL expression in BMSCs.

4. Discussion

Bone homeostasis depends on bone resorption in mammals and poultry; otherwise, it will lead to bone metabolism disorders. BMSCs are the progenitors of various cells (e.g., chondrocytes, adipocytes, and osteoblasts) which are recruited for microenvironmental stimulation of the bone surface, regulating osteoclastogenesis directly or indirectly [2,24]. BMSCs can secrete cytokines (e.g., RANKL and OPG) to regulate osteoclastogenesis [25,26,27]. In addition, activation of vitamin D promotes RANKL expression in BMSCs and OBs in vitro, regulating osteoclastogenesis [6,7,28]. In this study, treatment with 10−8 mol/L 1α,25(OH)2D3 promoted the expression of RANKL and osteoclastogenesis.
Gal-3 is expressed at different locations in cells, including the nucleus, extracellularly, and in the cell membrane. Ortega et al. showed that Gal-3, an in vitro substrate of MMP-9, accumulates in late hypertrophic chondrocytes and the expanded hypertrophic cartilage zone. Furthermore, treatment with full-length Gal-3, but not that cleaved by MMP-9, led to expansion of the hypertrophic zone and inhibited osteoclast recruitment [29]. However, Nakajima et al. showed that Gal-3 cleavage in the bone tumor microenvironment (TME) of breast and prostate cancers delays osteoclastogenesis by targeting the carbohydrate recognition domain (CRD) of Gal-3 [30]. Next, we aimed to observe the role of Gal-3 in osteoclastogenesis in BMSCs and BMM co-culture system treated by 1α,25(OH)2D3. We found that application of 10−8 mol/L 1α,25(OH)2D3 enhanced the expression of Gal-3 in BMSCs. A previous study reported that 1α,25(OH)2D3 upregulated the expression of Gal-3 in OBs [15]. In addition, knockout of Gal-3 in OBs and/or BMMs in mice caused osteoclastogenesis, indicating that Gal-3 is involved in the differentiation of osteoclasts [16]. Our research found that knockdown of Gal-3 in BMSCs co-cultured with BMMs could suppress osteoclastogenesis and bone resorption. However, overexpression of Gal-3 could reverse it. In this study, we did not investigate the role of Gal-3 in regulating RANK in monocyte/macrophage since: (1) our study focused on the role of Gal-3 in regulating RANKL expression and osteoclastogenesis; (2) RANKL is expressed at very low levels in BMM; (3) 1α,25(OH)2D3 increased Gal-3 expression only weakly in BMM (2-fold) but dramatically in BMSC (>10-fold). In addition, the transfection efficiency is extremely low in macrophages, and it is technically challenging to conduct experiments in macrophages.
Next, the regulatory role of Gal-3 in the expression of RANKL was demonstrated in BMSCs. The results confirmed that the expression of RANKL mRNA was downregulated by knockdown of Gal-3, and the expression of RANKL mRNA and the ratio of RANKL/OPG were upregulated by overexpression of Gal-3. The current results are different from those of Simon et al., who reported that inhibition of osteoclastogenesis was regulated by Gal-3 in mice independently of the RANKL/OPG axis. This might be related to differences in species variation or the different degrees of knockdown or overexpression of Gal-3 used.
Our present study shows that 1α,25-(OH)2D3 increased the levels of Gal-3 and RNAKL mRNA and promoted osteoclast differentiation and activation. Gal-3 knockdown led to decreased RANKL mRNA expression and blocked the effect of 1α,25-(OH)2D3 on osteoclast differentiation. Gal-3 overexpression increased RANKL mRNA levels. It is well documented that Gal-3 present in the nucleus and can bind several transcription factors and enhance their DNA-binding activity [31]. We propose that 1α,25(OH)2D3-induced Gal-3 expression affects osteoclast differentitation through RANKL signaling in chicken BMSC (Figure 7). However, the mechanisms by which 1α,25-(OH)2D3 regulates Gal-3 expression and Gal-3 regulates RANKL expression need to be further investigated in detail.

Author Contributions

Conceptualization, J.G., W.M. and Z.L.; data curation, W.M., Y.Z. and X.Z.; formal analysis, J.G. and W.M.; funding acquisition, J.G. and Z.L.; supervision, X.T. and Z.L.; visualization, Y.Y. and X.L.; writing—original draft preparation, J.G., J.B. and X.T.; writing—review and editing, X.T. and Z.L. All authors have read and agreed to the published version of the manuscript.

Funding

This research was supported by the National Natural Science Foundation of China (31872534, 31872533 and 32102732) and the Jiangsu Provincial Natural Science Foundation of China (BK20181452, BK20180917 and BK20210806), and the project was funded by the Priority Academic Program Development of Jiangsu Higher Education Institutions (PAPD).

Institutional Review Board Statement

The study was conducted according to the regulations of the Laboratory Animal Center of Yangzhou University and approved by the Animal Care and Use Committee of Yangzhou University.

Informed Consent Statement

Not applicable.

Data Availability Statement

The raw data supporting the conclusions of this article will be made available by the authors.

Acknowledgments

We thank the Testing Center of Yangzhou University for providing technical support.

Conflicts of Interest

The authors declare that they have no conflict of interest.

References

  1. Sims, N.A.; Gooi, J.H. Bone remodeling: Multiple cellular interactions required for coupling of bone formation and resorption. Semin. Cell Dev. Biol. 2008, 19, 444–451. [Google Scholar] [CrossRef] [PubMed]
  2. Harada, S.-I.; Rodan, G.A. Control of osteoblast function and regulation of bone mass. Nat. Cell Biol. 2003, 423, 349–355. [Google Scholar] [CrossRef]
  3. Blair, H.C.; Athanasou, N.A. Recent advances in osteoclast biology and pathological bone resorption. Histol. Histopathol. 2004, 19, 189–199. [Google Scholar]
  4. Boyle, W.J.; Simonet, W.S.; Lacey, D.L. Osteoclast differentiation and activation. Nat. Cell Biol. 2003, 423, 337–342. [Google Scholar] [CrossRef] [PubMed]
  5. Reid, I.R.; Bolland, M.J. Controversies in medicine: the role of calcium and vitamin D supplements in adults. Med. J. Aust. 2019, 211, 468–473. [Google Scholar] [CrossRef]
  6. Kitazawa, S.; Kajimoto, K.; Kondo, T.; Kitazawa, R. Vitamin D3 supports osteoclastogenesis via functional vitamin D response element of human RANKL gene promoter. J. Cell. Biochem. 2003, 89, 771–777. [Google Scholar] [CrossRef]
  7. Rubin, J.; Murphy, T.C.; Fan, X.; Goldschmidt, M.; Taylor, W.R. Activation of Extracellular Signal-Regulated Kinase Is Involved in Mechanical Strain Inhibition of RANKL Expression in Bone Stromal Cells. J. Bone Miner. Res. 2002, 17, 1452–1460. [Google Scholar] [CrossRef]
  8. Yang, R.-Y.; Rabinovich, G.A.; Liu, F.-T. Galectins: structure, function and therapeutic potential. Expert Rev. Mol. Med. 2008, 10, e17. [Google Scholar] [CrossRef] [PubMed]
  9. Inohara, H.; Akahani, S.; Raz, A. Galectin-3 Stimulates Cell Proliferation. Exp. Cell Res. 1998, 245, 294–302. [Google Scholar] [CrossRef] [PubMed]
  10. Iacobini, C.; Fantauzzi, C.B.; Pugliese, G.; Menini, S. Role of Galectin-3 in Bone Cell Differentiation, Bone Pathophysiology and Vascular Osteogenesis. Int. J. Mol. Sci. 2017, 18, 2481. [Google Scholar] [CrossRef] [Green Version]
  11. Guevremont, M.; Martel-Pelletier, J.; Boileau, C.; Liu, F.-T.; Richard, M.; Fernandes, J.-C.; Reboul, P. Galectin-3 surface expression on human adult chondrocytes: a potential substrate for collagenase-3. Ann. Rheum. Dis. 2004, 63, 636–643. [Google Scholar] [CrossRef] [PubMed]
  12. Iacobini, C.; Fantauzzi, C.B.; Bedini, R.; Pecci, R.; Bartolazzi, A.; Amadio, B.; Pesce, C.; Pugliese, G.; Menini, S. Galectin-3 is essential for proper bone cell differentiation and activity, bone remodeling and biomechanical competence in mice. Metabolism 2018, 83, 149–158. [Google Scholar] [CrossRef]
  13. Stock, M.; Schäfer, H.; Stricker, S.; Gross, G.; Mundlos, S.; Otto, F. Expression of Galectin-3 in Skeletal Tissues Is Controlled by Runx2. J. Biol. Chem. 2003, 278, 17360–17367. [Google Scholar] [CrossRef] [PubMed] [Green Version]
  14. Gao, Q.; Xia, Y.; Liu, L.; Huang, L.; Liu, Y.; Zhang, X.; Xu, K.; Wei, J.; Hu, Y.; Mu, Y.; et al. Galectin-3 Enhances Migration of Minature Pig Bone Marrow Mesenchymal Stem Cells Through Inhibition of RhoA-GTP Activity. Sci. Rep. 2016, 6, 26577. [Google Scholar] [CrossRef] [PubMed]
  15. Aubin, J.E.; Gupta, A.K.; Bhargava, U.; Turksen, K. Expression and regulation of galectin 3 in rat osteoblastic cells. J. Cell. Physiol. 1996, 169, 468–480. [Google Scholar] [CrossRef]
  16. Simon, D.; Derer, A.; Andes, F.T.; Lezuo, P.; Bozec, A.; Schett, G.; Herrmann, M.; Harre, U. Galectin-3 as a novel regulator of osteoblast-osteoclast interaction and bone homeostasis. Bone 2017, 105, 35–41. [Google Scholar] [CrossRef] [PubMed]
  17. Aota, Y.; Terayama, H.; Saito, T.; Itoh, M. Pinealectomy in a broiler chicken model impairs endochondral ossification and induces rapid cancellous bone loss. Spine J. 2013, 13, 1607–1616. [Google Scholar] [CrossRef] [PubMed]
  18. Narbaitz, R.; Tsang, C.P.W. Vitamin D deficiency in the chick embryo: Effects on prehatching motility and on the growth and differentiation of bones, muscles, and parathyroid glands. Calcif. Tissue Int. 1989, 44, 348–355. [Google Scholar] [CrossRef]
  19. Hancox, N.M. The survival of transplanted embryo bone grafted to chorioallantoic membrane, and subsequent osteogenesis. J. Physiol. 1947, 106, 279–285. [Google Scholar] [CrossRef]
  20. Gu, J.; Min, W.; Zhou, J.; Zhao, Y.; Bian, J.; Liu, X.; Yuan, Y.; Liu, Z. . Vitamin D Regulates OC Formation in the Co-culture System of Chicken BMSCs and BMMs. Acta Vet. Zootech. Sin. 2019, 50, 1509–1517. [Google Scholar] [CrossRef]
  21. Tong, X.; Gu, J.; Chen, M.; Wang, T.; Zou, H.; Song, R.; Zhao, H.; Bian, J.; Liu, Z. p53 positively regulates osteoprotegerin-mediated inhibition of osteoclastogenesis by downregulating TSC2-induced autophagy in vitro. Differentiation 2020, 114, 58–66. [Google Scholar] [CrossRef]
  22. Tong, X.; Zhang, C.; Wang, D.; Song, R.; Ma, Y.; Cao, Y.; Zhao, H.; Bian, J.; Gu, J.; Liu, Z. Suppression of AMP-activated protein kinase reverses osteoprotegerin-induced inhibition of osteoclast differentiation by reducing autophagy. Cell Prolif. 2020, 53, e12714. [Google Scholar] [CrossRef] [PubMed] [Green Version]
  23. Gu, J.; Li, S.; Wang, G.; Zhang, X.; Yuan, Y.; Liu, X.; Bian, J.; Tong, X.; Liu, Z. Cadmium Toxicity on Chondrocytes and the Palliative Effects of 1α, 25-Dihydroxy Vitamin D3 in White Leghorns Chicken’s Embryo. Front. Veter-Sci. 2021, 8, 637369. [Google Scholar] [CrossRef]
  24. Pittenger, M.F.; Mackay, A.M.; Beck, S.C.; Jaiswal, R.K.; Douglas, R.; Mosca, J.D.; Moorman, M.A.; Simonetti, D.W.; Craig, S.; Marshak, D.R. Multilineage Potential of Adult Human Mesenchymal Stem Cells. Science 1999, 284, 143–147. [Google Scholar] [CrossRef] [Green Version]
  25. Yamamoto, Y.; Yoshizawa, T.; Fukuda, T.; Shirode-Fukuda, Y.; Yu, T.; Sekine, K.; Sato, T.; Kawano, H.; Aihara, K.-I.; Nakamichi, Y.; et al. Vitamin D Receptor in Osteoblasts Is a Negative Regulator of Bone Mass Control. Endocrinology 2013, 154, 1008–1020. [Google Scholar] [CrossRef] [PubMed] [Green Version]
  26. Xu, G.; Liu, K.; Anderson, J.; Patrene, K.; Lentzsch, S.; Roodman, G.D.; Ouyang, H. Expression of XBP1s in bone marrow stromal cells is critical for myeloma cell growth and osteoclast formation. Blood 2012, 119, 4205–4214. [Google Scholar] [CrossRef] [PubMed]
  27. Lacey, D.L.; Boyle, W.J.; Simonet, W.S.; Kostenuik, P.J.; Dougall, W.C.; Sullivan, J.K.; Martin, J.S.; Dansey, R. Bench to bedside: elucidation of the OPG–RANK–RANKL pathway and the development of denosumab. Nat. Rev. Drug Discov. 2012, 11, 401–419. [Google Scholar] [CrossRef]
  28. Kitazawa, R.; Mori, K.; Yamaguchi, A.; Kondo, T.; Kitazawa, S. Modulation of mouse RANKL gene expression by Runx2 and vitamin D3. J. Cell. Biochem. 2008, 105, 1289–1297. [Google Scholar] [CrossRef] [PubMed]
  29. Ortega, N.; Behonick, D.; Colnot, C.; Cooper, D.N.; Werb, Z. Galectin-3 Is a Downstream Regulator of Matrix Metalloproteinase-9 Function during Endochondral Bone Formation. Mol. Biol. Cell 2005, 16, 3028–3039. [Google Scholar] [CrossRef]
  30. Nakajima, K.; Kho, D.H.; Yanagawa, T.; Harazono, Y.; Hogan, V.; Chen, W.; Ali-Fehmi, R.; Mehra, R.; Raz, A. Galectin-3 Cleavage Alters Bone Remodeling: Different Outcomes in Breast and Prostate Cancer Skeletal Metastasis. Cancer Res. 2016, 76, 1391–1402. [Google Scholar] [CrossRef] [Green Version]
  31. Dumic, J.; Dabelic, S.; Flögel, M. Galectin-3: An open-ended story. Biochim. Biophys. Acta (BBA)-Gen. Subj. 2006, 1760, 616–635. [Google Scholar] [CrossRef] [PubMed]
Figure 1. Culture with 10−8 mol/L 1α,25(OH)2D3 promotes osteoclastogenesis and bone resorption in the chicken BMSC–BMM co-culture system. (A,B) BMSCs and BMMs were co-cultured on 6-well plates with or without (Con) addition of 10−8 mol/L 1α,25(OH)2D3. Cells were treated for 5 d, and 10 fields were randomly selected. The number of TRAP-positive multinucleated OCs (black arrows) was counted. Bar = 100 μm. (C,D) BMSCs and BMMs were co-cultured on 6-well plates with or without (Con) addition of 10−8 mol/L 1α,25(OH)2D3. Cells were treated for 5 d, and qRT-PCR was used to quantitate the mRNA expression of OC marker genes (CtsK, TRAP, MMP-9, and CAII). Chicken ELISA kits were used to measure CtsK and MMP-9 protein levels in the cell culture supernatant (n = 3 per group). (E,F) BMSCs alone, no cells, and BMSC–BMM were added to a 96-well bone resorption culture plate. After that, 10−8 mol/L 1α,25(OH)2D3 was added or not added (Con) to BMSC–BMM co-culture wells for 5 d. An inverted microscope was used to observe 10 randomly selected fields. Image-Pro Plus 6.0 software was used to analyze the area of bone resorption pits (red arrows). Bar = 50 μm. (Graph bars show mean ± SD. * p < 0.05 and ** p < 0.01 show significant difference compared with the control group).
Vetsci 08 00234 g001
Figure 2. Application of 10−8 mol/L 1α,25(OH)2D3 upregulates the expression of Gal-3 mRNA in the BMSC–BMM co-culture system and monocultures. (A) BMSCs and BMMs were co-cultured in 6-well plates with or without (Con) 1α,25(OH)2D3. Quantitative RT-PCR was used to quantitate the expression of Gal-3 mRNA. (B) BMSCs were seeded in 6-well plates with or without (Con) 1α,25(OH)2D3, and qRT-PCR was used to quantitate the expression of Gal-3 mRNA. (C) BMMs were seeded in 6-well plates with or without (Con) 1α,25(OH)2D3, and qRT-PCR was used to quantitate the expression of Gal-3 mRNA. (Graph bars show mean ± SD. * p < 0.05 and ** p < 0.01 show significant difference compared with the control group; n = 3 per group).
Vetsci 08 00234 g002
Figure 3. Application of 10−8 mol/L 1α,25(OH)2D3 upregulates the RANKL/OPG ratio in BMSCs. (A) BMSCs were seeded in 6-well plates with or without (Con) 1α,25(OH)2D3. After 5 d, qRT-PCR was used to quantitate the expression of RANKL and OPG mRNA, and the RANKL/OPG ratio was calculated. (B) BMSCs were seeded in 6-well plates with or without (Con) 1α,25(OH)2D3. After 5 d, the cell supernatant was collected, and ELISA kits were used to measure RANKL and OPG protein levels. (Graph bars show mean ± SD. * p < 0.05 and ** p < 0.01 show significant difference compared with the control group; n = 3 per group.).
Vetsci 08 00234 g003
Figure 4. Gal-3 knockdown in BMSCs decreases the promoting effects of 10−8 mol/L 1α,25(OH)2D3 on osteoclastogenesis and bone resorption. (A) BMSCs were transfected with si-Gal-3 or NC siRNA for 10 h before being cultured in α-MEM for 36, 72, or 120 h. Quantitative RT-PCR was used to quantitate the expression of Gal-3 mRNA (n = 3 per group). (B,C) After Gal-3 knockdown in BMSCs, BMSCs and BMMs were co-cultured on 6-well plates with or without addition of 1α,25(OH)2D3. Cells were cultured for 5 days. NC was the blank control. Ten fields were randomly selected. The number of TRAP-positive multinucleated OCs (black arrows) was counted. Bar = 200 μm. (D) After Gal-3 knockdown, BMSCs were co-cultured with BMMs with or without addition of 1α,25(OH)2D3. Cells were cultured for 5 d. NC was the blank control. Quantitative RT-PCR was used to quantitate the mRNA expression of OC marker genes (CtsK, CAII, MMP-9, and TRAP) (n = 3 per group). (E,F) After BMSCs were seeded in 96-well bone resorption culture plates and Gal-3 was knocked down, BMSCs and BMMs were co-cultured with or without addition of 1α,25(OH)2D3. Cells were cultured for 5 days. NC was the blank control. An inverted microscope was used for observation of 10 randomly selected fields. Image-Pro Plus 6.0 software was used to analyze the area of bone resorption pits (red arrows). Bar = 100 μm. (Graph bars show mean ± SD. * p < 0.05 and ** p < 0.01 show significant difference compared with the NC control group. # p < 0.05 and ## p < 0.01 show significant difference compared with the 1α,25(OH)2D3-treated si-Gal-3 group).
Vetsci 08 00234 g004
Figure 5. Gal-3 overexpression in BMSCs promotes osteoclastogenesis and bone resorption. (A) BMSCs were seeded for 12 h before transfection with EGFP-Gal-3 or EGFP empty plasmid for 10 h before being cultured in normal α-MEM for 36, 72, or 120 h. Quantitative RT-PCR was used to quantitate the expression of Gal-3 mRNA (n = 3 per group). (B,C) After Gal-3 was overexpressed in BMSCs, BMSCs and BMMs were co-cultured for 5 d. An EGFP empty control was set up. Ten fields were randomly selected. The number of TRAP-positive multinucleated OCs (black arrows) was determined. Bar = 200 μm. (D) After Gal-3 was overexpressed in BMSCs, BMSCs were co-cultured with BMMs. Quantitative RT-PCR was used to quantitate the mRNA expression of OC marker genes (CtsK, CAII, MMP-9, and TRAP) (n = 3 per group). (E,F) After BMSCs were seeded in 96-well bone resorption culture plates and Gal-3 was overexpressed, BMSCs and BMMs were co-cultured for 5 days. An inverted microscope was used for observation of 10 randomly selected fields. Image-Pro Plus 6.0 software was used to analyze the area of bone resorption pits (red arrows). Bar = 100 μm. (Graph bars show mean ± SD. * p < 0.05 and ** p < 0.01 show significant difference compared with the control group).
Vetsci 08 00234 g005
Figure 6. Gal-3 can regulate RANKL signals. (A) BMSCs were transfected with si-Gal-3 or NC siRNA for 10 h before being cultured in normal α-MEM for 120 h. Quantitative RT-PCR was used to measure RANKL and OPG mRNA levels to analyze the RANKL/OPG ratio (n = 3 per group). (B) BMSCs were transfected with EGFP-Gal-3 or EGFP empty plasmid for 10 h before being cultured in normal α-MEM for 120 h. Quantitative RT-PCR was used to measure RANKL and OPG mRNA levels to analyze the RANKL/OPG ratio (n = 3 per group). (Graph bars show mean ± SD. * p < 0.05 and ** p < 0.01 show significant difference compared with the control group).
Vetsci 08 00234 g006
Figure 7. Schematic diagram showing the mechanism of Gal-3 in 1α,25(OH)2D3-regulated differentiation of chicken osteoclasts. Application of 10−8 mol/L 1α,25(OH)2D3 upregulates Gal-3 expression in BMSC and regulates osteoclast differentiation in the chicken through RANKL signaling.
Vetsci 08 00234 g007
Table 1. Sequences of target genes.
NameGene NumberLength (bp)Forward Primer (5′ to 3′)Reverse Primer (5′ to 3′)
CtsK
(chicken)
en)
395818161CATCATTGACGGAGCGATGCTTTCGTCCTCCTTGCCGTTG
TRAP
(chicken)
107057619110CCGCTTCTTCTATGGGGCTGGTACAGAACTCTCCCGTTGG
MMP-9
(chicken)
395387182CTTCTGCCCAGACAGAGGTTAGCCACGACCATAGAGGTACT
CAII
(chicken)
396257188GGCGTGAAGTACGATGCAGAGCTTGTTTCCCCTTGGTTTGAA
RANKL
(chicken)
428067116GCCCACTTCTTGGAAACAGCTACAACGTGGCCCTGTGAAG
OPG
(chicken)
37880390CTGCACGCTTGTGCTCTTGGGATGTCCCCGGGTCGTAATG
Galectin-3
(chicken)
373917112GCCATATCCTGGAGGACCAACGGTTATGAGCAGTCGAGGCA
GAPDH
(chicken)
374193137GCCCAGAACATCATCCCAGCGGCAGGTCAGGTCAACA
Publisher’s Note: MDPI stays neutral with regard to jurisdictional claims in published maps and institutional affiliations.

