1. Introduction
Oak barrels have been long used in the wine industry for storage of wine and are closely associated with production of premium wines [
1]. During storage in oak barrels, wine undergoes several compositional changes of primary relevance to perceived sensory quality. Seasoned oak is rich in a number of potent odoriferous compounds that can migrate in the wine, contributing to woody, vanilla, spicy and caramel odor notes [
2]. The practice of toasting, commonly used in the cooperage industry, significantly increases the concentration of these compounds, and different degrees of toasting are commonly offered in commercial barrels [
2]. In addition, oak can also release non-volatile phenolic compounds that have a major impact on wine mouthfeel and resistance to oxidation, in particular ellagitannins such as vescalagin and castalagin; phenolic acids such as gallic, caffeic and ellagic acid; as well as flavan-3-ols [
3,
4,
5]. Oak barrels are also permeable to oxygen, so that during barrel storage a moderate degree of oxidation takes place, with major consequences for wine composition, color and phenolic stability, and sensory properties [
6]
Because of the high cost of oak barrels purchase and maintenance and the complexities associated with correct management of wine aging in barrel, the use of oak alternatives (OAs) such as chips, staves, or other formats has largely increased in recent years [
7,
8]. They can enrich the wine with the same substances that are released during oak barrel aging, in particular aroma compounds, but also ellagitannins and other non-volatile phenolics [
7,
8]. The latter point is of great importance as ellagitannins play a central role in wine aging chemistry, affecting wine antioxidant capacity [
9,
10], ability to consume oxygen [
7,
11], and SO
2 consumption by oxidation reactions [
11], and they deeply influence wine mouthfeel [
5,
8]. However, phenolic content of oak varies largely depending on geographical and biological origin of the wood, its age, and its anatomy [
3], as well as by cooperage, in particular toasting. Therefore, the outcomes of commercial OAs use in terms of wine mouthfeel and aging behavior can be rather unpredictable. While this has been long known also for conventional barrels, their relatively small size (e.g., 225–228 L) implies that one wine batch is typically split across a number of different barrels, allowing to even out differences in oak composition. Conversely, in the case of OAs, where one single batch of product can be used to treat much larger batches of wine, there is a greater need for classifying OAs characteristics, both at production level and in the winery.
Preparation of extracts combined with different analytical techniques such as UV-Vis spectroscopy, HPLC, and LM-MS [
3], is commonly used to measure phenolic content of oak, but these approaches require investments in equipment and trained staff so they remain restricted to larger laboratories. A non-destructive approach based on NIR spectroscopy has been developed and can be used to assess the phenolic content of staves in cooperage installations [
12]. However, there is still a need for more rapid, economic and user-friendly methods that can assist in addressing the variability in phenolic content of OAs, especially at the winery level.
Electrochemical methods are particularly well adapted to the analysis of phenolic compounds in wine [
13,
14]. Different procedures are well described in the literature, in particular based on the use of cyclic voltammetry associated with glassy carbon electrodes, in some cases functionalized to improve their sensitivity towards specific components and/or to reduce their response towards compounds that can interfere with detection of the target analyte(s) [
14]. Although these studies have demonstrated the great potential for electrochemical techniques in the context of wine analyses, development of electrochemical applications for the wine industry remains limited, presumably due to the complexities associated with the use of glassy carbon electrodes. However, in recent years, approaches based on the use of disposable carbon paste screen-printed sensors have recently gained attention for the development of rapid fingerprinting and classification procedures for the wine industry [
15,
16], especially in combination with portable, low-cost potentiostat units capable of remote connectivity. In these applications, linear sweep voltammetry, the most simple form of voltammetric analysis, has been successfully used.
In the present study, the potential of linear sweep voltammetry using disposable carbo paste electrodes, alone or in combination with conventional signal treatment strategies, has been investigated as a tool for rapid analysis of OAs extracts.
2. Materials and Methods
Chemicals, OAs, and sample preparation procedures. Folin Ciocalteau reagent, sodium carbonate, methyl cellulose, ammonium sulfate, tartaric acid, sodium hydroxide, gallic acid, and catechin were obtained from Sigma. Samples of commercial chips (Pronektar, Jonzac, France) were used in the study, consisting of French and American oak chips, each one with medium (M) or medium+ (M+) toasting (180 °C for either 4 or 6 h). For each extraction, 300 mg of the product were put in a 65 mL glass bottle fitted with a Teflon-lined cap and were left in infusion at 22 ± 2 °C for 21 days in a model wine solution containing 15% ethanol, 5 g/L of tartaric acid, and pH adjusted to 3.2 by means of NaOH. The glass bottles were entirely filled, so that no headspace was present. In order to ensure further protection against oxidation, each bottle was sealed under vacuum in an oxygen barrier bag. For the study on staves, sections (47 mm × 7 mm × 10 mm) were cut out of commercial staves (Pronektar, Jonzac, France) and were used. Staves toasting was carried out by means of radiant heat, with a temperature of 160 °C and the time on the flame defining the degree of toasting (medium (M) or Medium+ (m+)). French and American oak were used, and two types of wood grain were tested for each wood origin. Extraction conditions were similar to those described for chips, except for the duration of the infusion period, which was of 49 days. Extraction conditions (weight of OAs and model wine volumes) were based on manufactured recommendations concerning the use of the different OAs. All extractions were performed in triplicate. At the end of the extraction period, samples were directly submitted to analyses.
Chemical and electrochemical analyses. Total phenolic index (TPI) and methyl cellulose precipitable tannins (MCPT) were determined as previously described [
11]. Briefly, at the end of the extraction period, OAs extracts were centrifuged, and TPI was determined spectrophotometrically using the Folin-Ciocalteau reagent, with results being expressed as mg/L eq. of galliic acid. MCPT determined was carried out directly on by means of the addition of methyl cellulose and saturated ammonium sulfate solutions directly to OA extracts, in order to precipitate the tannins present. After centrifugation, measurements of absorbance at 280 nm of this solution in comparison to a sample not added with methyl cellulose was used to quantify precipitated tannins. Results were expressed as mg/L equivalent of tannic acid.
Voltammetric analyses (Linear sweep voltammetry) were performed with a commercial Nomasense Polyscan electrochemical analyzer (Nomacorc, Belgium) using disposable screen-printed sensors in a three-electrode arrangement (Nomacorc, Thimister, Belgium). The working electrode (WE) was a screen-printed carbon paste electrode operating in conjunction with a screen-printed carbon paste counter electrode and a silver/silver-chloride (Ag/AgCl) as pseudo-reference electrode. For the analysis, a drop of sample at 22 °C with no preliminary sample dilution was loaded onto a sensor, and linear sweep voltammograms were acquired between 0 and 1000 mV at a scan rate of 100 mV/s, with a 10 mV interval occurring between two consecutive measurement points.
After each scan, the sensor was discarded and a new sensor was used. All measurements were carried out in duplicate. All potentials are reported against Ag/AgCl reference electrode. Derivative voltammograms were obtained with The Unscrambler (Camo, Norway), applying a 10 points Savitzky–Golay smoothing.
Statistical analysis. Analysis of variance was carried out on all data, and means were compared by Tukey’s test. Analyses were performed using XLSTAT (version 2013.6.04; Addinsoft, Paris, France).
4. Discussion
In agreement with previous reports [
3,
7,
17], toasting was found to decrease ellagitannin content of different OAs (
Table 1). The extent of such decrease was influenced by wood grain, with smaller decreases in tight grain samples compared to large grain ones. Wood grain was also found to influence the content of extractable phenolics and tannins, in agreement with the fact that large grain oak is expected to be richer in ellagitannins [
18], as well as to have more fiber and parenchyma material being in contact with the model wine [
19].
In consideration of the variability in phenolic content of different OAs, the suitability of the electrochemical approach proposed for a rapid assessment of OAs phenolic content was investigated. Correlations between phenolic and electrochemical parameters were explored. Due to the presence of large unresolved anodic waves, raw voltammograms could not be treated based on specific peak, and therefore, signal intensity data were obtained as areas under the curve (AUC) in the range 0–1200 mV, accounting for the total current passed during the analysis.
Strong and highly significant correlations were found for both total phenolics and total tannins when total AUC of linear sweep votammograms was considered (
Figure 2), with regression equations of
y = 0.0002
x − 183.58 for total phenolics and
y = 0.0001
x − 155.52 for total tannins respectively. Previous studies have indicated that AUC of either total raw voltammograms or subsections thereof are well correlated with wine values for total phenolics [
20] as well as with total phenolics or total tannins values of commercial tannin powders [
11,
21]. Other studies have shown that the phenolic content of oak extracts is highly representative of their antioxidant capacity [
17] as well as of their ability to consume oxygen during wine storage [
7,
11]. Therefore, the observation of a high correlation between electrochemical signal and total phenolics or total tannin data of different OA extracts, reported here for the first time, indicate great potential for electrochemical techniques in the area of oak analysis for wine applications, in particular for small and medium wineries where access to more sophisticated analytical equipment can be limited. To this point, it is worth mentioning that, although in this study the concentrations of tannins measured were relatively low compared to, for example, red wines, our data indicate that the method proposed shows a linear response for addition of phenolic (pure catechin) up to 2 g/L, so it can be adapted to different scenarios including the analysis of red wine samples treated with oak alternatives.
Voltammetric analyses of the different OAs extracts reflected the complex phenolic composition of OAs. However, although some differences could be observed between linear sweep voltammograms of chips compared to staves, the spectra were rather convoluted and extraction of specific characteristic features was difficult. Raw votammograms were indeed characterized by a highly convoluted signal consisting of two largely unresolved anodic waves. Considering that oak phenolic fraction contains in large part ellagitannins such as vescalalgin and castalagin, as well as gallic, ellagic, protocatechuic and caffeic acids [
3,
7,
17], the first wave, occurring in the region around 450 mV, can be ascribed to the oxidation of the ortho-diphenols and triphenols moieties that are characteristic of these compounds [
13]. Commercial ellagitannin preparations have been shown to give intense electrochemical signal in this region using glassy carbon [
21] or screen-printed [
11] electrodes. The second anodic wave, at potentials comprised between 910 mV and 930 mV, is associated with less readily oxidizable compounds, although the precise nature of the substances involved remains to be clarified. Toasting is known to increase oak content of phenolic aldehydes and non-favanol hydroxycinnamic acids [
17], so the second anodic wave could be associated with the oxidation of vanillin, siringaldehyde, coniferyl aldehyde, as well as ferulic and vanillic acids. Oxidation potentials of these compounds at the surface of glassy carbon electrodes has been shown to be much higher than those of ortho-diphenols [
20].
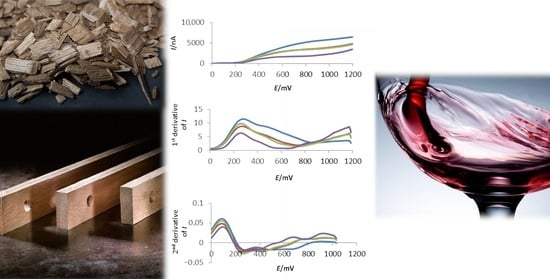
In order to increase the capabilities of the proposed electrochemical method, derivative voltammograms were therefore for each OA extract, in the attempt to extract from raw voltammograms ‘hidden’ features that could be relevant to the characterization of different matrices (
Figure 3 and
Figure 4). Derivative voltammogram represents the rate of change of measured current
I with respect to electrode potential
E (d
I/d
E). This approach eliminates charging current and allows resolution of overlapping peaks or waves, allowing more precise location of the potential at which key electrode processes are occurring.
First derivative voltammograms (
Figure 3) allowed to highlight the presence of several different electrode processes associated with the two major anodic waves characteristic of raw voltammograms, indicating the presence of multiple oxidizable substrates. This type of behavior is rather common when derivatization is applied, due to the expected increase in resolution. In addition, the peaks observed in derivative voltammogram are located close to the foot of the original anodic wave. So for example, the first peak observed in first derivative voltammogram corresponds to the onset on the electrode process, resulting in the wave observed at approximately 400 mV in the raw voltamogram. In the case of chips, a clear peak could be observed at 270 mV, with a shoulder at approximately 450 mV.
Interestingly, the second wave, corresponding to a peak located between 795–815 mV in the first derivative voltammograms, was increased and slightly shifted with toasting. This can be clearly visible in the region located between 795–805 mV of the first derivative voltammograms of chips M+ samples. The major peak at approximately 270 mV was also observed in the first derivative voltammograms of staves extracts, which, however, did not exhibit the characteristic peak observed for chips in the 795–805 mV region.
Also for staves, first derivative voltammograms showed a first peak at approximately 270 mV, with a shoulder located around 400 mV, although the potential was rather variable according to both oak origin and tasting. In the case of French oak samples, this second peak occurred in the 450–475 mV range (first derivative voltammogram), with second derivative plots locating the beginning of this signal between 336 and 365 mV. Conversely, in the case of American oak samples, much greater variations in the characteristics of this second peak were observed, and wood grain appeared to have an influence too. Indeed, while in the case of thigh grain, the peak occurred at approximately 450 mV (first derivative plots), beginning at 336 mV (2nd der plots); for large grain samples, it was very delayed, its beginning being located at 425 mV (2nd der). Additional peaks were also observed in first derivate voltammograms at 573 mV, 635 mV, and 793 mV, indicating additional electrode processes. As in the case of chips, the process at 793 mV was mostly observed in M+ samples, confirming an association with compounds formed during toasting, most likely phenolic aldehydes. Altogether, these observations indicate that a number of qualitative information can be obtained from raw voltammograms by applying derivatization techniques, highlighting in particular the possibility to extract features that could be specific of wood origin and type. Moreover, a recent study on tannins of different botanical source, including oak, indicate that the potential of first peak of the derivative voltammogram was well correlated with the oxygen consumption capacity of different tannins, with different tannins exhibiting potentials comprised in the 190–250 mV range [
11]. The data of the present study indicate that the potential range in which this peak occurred for oak tannins was generally located in a much narrower range (10–15 mV), so that it could be suggested that the different oak products tested did not differ in oxygen consumption capacities.


