Article

Comparison and Study on Flavor and Quality Characteristics of Different Grades of Tianshanhong (TSH)

1
College of Bioscience and Engineering, Ningde Normal University, Ningde 352000, China
2
College of Tea Science, Ningde Vocational and Technical College, Fu’an 355000, China
3
Fujian Hongjun Agricultural Development Co., Ltd., Ningde 352000, China
4
Key Laboratory of Tea Science in Fujian Province, College of Horticulture, Fujian Agriculture and Forestry University, Fuzhou 350002, China
5
Fujian Haiwu Tea Industry Development Co., Ltd., Zhouning 355400, China
*
Author to whom correspondence should be addressed.
These authors contributed equally to this work.
Beverages 2025, 11(4), 111; https://doi.org/10.3390/beverages11040111
Submission received: 30 April 2025 / Revised: 14 June 2025 / Accepted: 17 July 2025 / Published: 4 August 2025
(This article belongs to the Section Tea, Coffee, Water, and Other Non-Alcoholic Beverages)

Abstract

Tianshanhong (TSH), black tea products originating from the Ningde Tianshan Mountain, has gained significant recognition in the market. However, the chemical characteristics contributing to the flavor of TSH have not yet been reported. To systematically investigate the non-volatile and volatile compounds in TSH, four grades of TSH were evaluated using national standard sensory methods, revealing that overall quality improved with higher grades. Based on the detection of ultra-performance liquid chromatography–mass spectrometry (UPLC-MS), the content of ester-type catechins was relatively high and decreased with lower grades. A total of 19 amino acids (AAs) were clustered, among them, three amino acids, L-Theanine (L-Thea), Arg, and GABA, showed highly significant correlations with the refreshing taste of TSH. Notably, the content of Arg had the highest correlation with TSH grade, with a coefficient of 0.976 (p < 0.01). According to gas chromatography mass spectrometry (GC-MS) analysis, a total of 861 kinds of volatile compounds were detected, with 282 identified and aroma-active compounds across grades selected using the PLS model. Methyl salicylate and geraniol were particularly notable, showing strong correlations with TSH grades at 0.975 and 0.987 (p < 0.01), respectively. Our findings show that non-volatile and volatile compounds can rationally grade TSH and help understand its flavor quality.

1. Introduction

As the most traded tea category globally, black tea has captivated consumers worldwide with its rich aroma and sweet, mellow flavor [1]. China is the origin and primary production region of black tea. Congou black tea, the mainstream product in China’s black tea market, is made from freshly picked tea leaves at optimal maturity and processed through withering, rolling, fermentation, drying, sifting, sorting, and re-firing [2,3,4]. In recent years, with the growing consumer demand for high-quality black tea, research on the production techniques and quality characteristics of Congou black tea has gained increasing attention [5]. Located in Jiaocheng District, Ningde City, in the northeastern part of Fujian Province, is the home of the historically renowned Tianshan Tea. Jiaocheng District, with its superior geographical and climatic conditions [6], diverse tea varieties [7], and advanced processing techniques [8], has a century-long history of producing Congou black tea. As a prominent variety of Tianshan Tea, the TSH produced here, renowned for its rich, lingering aroma and sweet, refreshing, and mellow taste, has gained significant market acclaim in recent years.
The flavor quality of black tea directly determines its value. In recent years, with advancements in metabolomics detection techniques, the flavor profiles of an increasing number of Congou black tea products have been uncovered. Ouyang et al. (2025) discovered a unique minty-like aroma in Rucheng Baimaocha black tea (RCBT) and identified four key odorants—methyl salicylate, (E,Z)-2,6-nonadienal, methyl geranate, and (E)-2-nonenal—as significant contributors to this characteristic minty fragrance [9]. Yan et al. (2024) identified and quantified 61 volatile compounds in southern Shaanxi congou black tea from different altitudes. They found 1-pentanol and cyclohexanone as key aroma markers for mid-altitude tea (400–800 m), and sotolone and furfuryl for high-altitude tea (800–1000 m) [10]. Peng et al. (2024) identified characteristic volatile compound markers in Gongou black tea from Sichuan, Zhejiang, Jiangxi, and Fujian. They found distinct flavors among teas from different regions, with unique metabolites enriched in eight metabolic pathways, indicating regional variations in volatile compounds [11]. Long et al. (2024) found that Yunnan Congou black tea from ancient trees (over 1000 years old) exhibits superior quality. They identified 84 marker metabolites, linking trans-4-O-p-coumaroylquinic acid and quercetin 3-O-rutinoside to the tea’s taste profile [12]. International black teas exhibit distinct flavor profiles compared to Chinese varieties. Wang et al. (2016) found Sri Lankan teas have 58 aroma compounds, with esters (49.8%) and alcohols (26.2%) dominant and methyl salicylate as a characteristic marker [13]. Wang et al. (2022) analyzed 112 black teas and found Indian Assam teas rich in alcohols (34.96%) with malty notes from linalool and hexanoic acid, while Sri Lankan teas have floral/wintergreen aromas from 1-methyl-naphthalene and β-ionone [14]. Chinese black teas like TSH feature phenylethyl alcohol and these regional differences help study TSH’s grade-related flavor metabolites.
Additionally, the following four studies provide representative analyses of the flavor profiles of Congou black tea products: Yue et al. [15] found significant differences in nine taste attributes among six Congou black teas (Ninghong, Chuanhong, Xinyang, Huhong, Dianhong, and Yinghong Congou black tea), with sweetness being dominant. They identified 135 differential metabolites, clustering into two groups, and clarified key quality components and their associations. Niu et al. [16] identified 20 important aroma compounds (OAVs ≥ 1) and 8 key aroma compounds (OAVs ≥ 10) in Keemun black tea (KBT). They found that water with a deuterium concentration of 40 ppm enhanced aroma release, while other concentrations inhibited it. Yue et al. [17] demonstrated that the aroma of Jiangxi Congou black tea is characterized by 11 descriptors with interactions, such as negative correlations between floral, fruity, and green, and roasted aroma influences the olfactory perception of off-odor and smoke. They identified 74 volatile compounds, including 29 key components that significantly impact six aroma attributes. Yue et al. [18] analyzed various types of Hehong tea using multiple techniques, identifying 42 volatile compounds. They clarified compositional differences, aroma sub-attribute characteristics, and their associations, and screened 18 key compounds for differentiation.
The grading of black tea primarily relies on traditional sensory evaluation and analysis, which is highly subjective. Combining grade samples with indicator components for auxiliary classification may serve as an effective approach for future tea grading. Flavor chemistry studies on standard samples of different grades have been frequently reported. Zhou et al. [19] compared sensory and metabolomic differences among various grades of innovative Congou black tea. They found that MKH (the full name of MKH is Minkehong, an innovative black tea from the Ningde region) grades were highly correlated with Thr (Threonine), Ile (Isoleucine), and Pro (Proline), and identified characteristic key aroma components and their features from premium to third-grade MKH, integrating sensory analysis results. Gao et al. [20] analyzed the flavor chemistry components of different grades of traditional Tanyang Congou tea. They found that epigallocatechin (EGC), catechin (C), and gallic acid (GA) were closely associated with its sweet and mellow aftertaste. Additionally, they identified volatiles such as 1-pentanol, propyl hexanoate, and linalool, which are linked to sweet and floral aromas. Furthermore, researchers have conducted comprehensive and objective metabolomic studies using standard samples of premium teas (e.g., Wuyi rock tea, Anxi Tieguanyin, Longjing green tea, Fuding white tea, and Pu’er tea) of different grades [21,22,23,24,25,26]. These studies not only established relationships between grade, flavor, and chemical components but also provided indicative metabolic markers for tea grading.
However, as a renowned tea-producing region in China, research on Ningde Tianshan tea remains limited, with only preliminary studies by Zheng et al. [8], Zhang [27], and others reporting on its processing techniques and quality characteristics. In 2021, the group standard “T/NDJCCX 003-2021 Tianshanhong Congou Black Tea” was issued by the Jiaocheng District Tea Industry Association of Ningde City. The implementation of this standard provided an official reference for the production and grading of TSH-related products. However, the differences in intrinsic compounds among different grades of TSH, as well as the relationships between sensory quality, chemical components, and flavor, remain to be further explored.
In this research, different grades of TSH samples, obtained from the Tea Association of Jiaocheng District, Ningde, produced by Fujian Hongjun Agricultural Development Co., Ltd. (Ningde City, Fujian Province, China), were utilized as research materials. Sensory evaluation and basic biochemistry indicators were conducted as the preliminary step. UPLC-MS and GC-MS were utilized to identify the non-volatile components (including five catechins, 19 amino acids, etc.) and volatile compounds in TSH. Furthermore, we identified the key differential compounds among different grades of TSH using stoichiometry combined with multivariate statistical analysis. This study aimed to provide molecular evaluation results for approving the classification of different grades of TSH, as well as act as a reference for standardized production methods.

2. Materials and Methods

2.1. Chemicals

(-)-catechin (C), (-)-epicatechin (EC), (-)-epigallocatachin (EGC), (-)-Epigallocatechin gallate (EGCG), (-)-epicatechin gallate (ECG), caffeine, L-Theanine (L-Thea), Arginine (Arg), Aspartic acid (Asp), γ-aminobutyric acid (γ-GABA), Glutamine (Gln), Isoleucine (Ile), Proline (Pro), Serine (Ser), Threonine (Thr), Valine (Val), Alanine (Ala), Leucine (Leu), Asparagine (Asn), Phenylalanine (Phe), Methionine (Met), Glutamine (Glu), Tyrosine (Tyr), Histidine (His), and Tryptophan (Trp) were all from Solarbio Science & Technology Co., Ltd. (Beijing, China).
Pure water was from Huarun Yibao Beverage Co., Ltd. (Shenzhen, China). Acetonitrile (HPLC grade) and methanol (HPLC grade) were from Thermo Fisher Scientific Co., Ltd. (Munich, Germany). Formic acid (HPLC grade, ≥98%) was from Fuchen Chemical Reagent Co., Ltd. (Tianjin, China). Ammonium acetate (HPLC grade, ≥99%) was from Aladdin Biochemical Technology Co., Ltd. (Shanghai, China). Sodium chloride (analytically pure) was from China National Pharmaceutical Group Corporation (Beijing, China). Hexane (HPLC grade, ≥99%) was from Merck & Co., Inc. (Hunterdon, NJ, USA). Finally, 3-Hexanone (internal standard, 50 μg/mL, HPLC grade, ≥99%) was from Sigma-Aldrich Corp (St. Louis, MO, USA).

2.2. Tea Samples

The Tianshanhong black tea samples were graded in accordance with the quality specifications established in T/NDJCCX 003-2021, the Chinese consortium standard, with classification performed by the Jiaochen Tea Industry Association in Ningde. The standard samples of Tianshanhong black tea are owned by the Jiaocheng District Tea Industry Association in Ningde City, which entrusted Fujian Hongjun Agricultural Development Co., Ltd. (Ningde, China) for production. All samples use fresh leaves of Tianshan Caicha (local tea variety) in spring, processed via an optimized traditional black tea workflow: primary steps (wilting, rolling, fermentation, drying) and refining steps (sieving, sorting, aroma-enhancing baking). As critical references for tea production/trading, these samples are authoritative and widely used in teaching, research, and brand promotion. They also support the grading/research of Tianshanhong-related products by enterprises/individuals, available free upon formal application. For foreign readers, its four grades (Te, 1, 2, and 3) are termed TSH-0, TSH-1, TSH-2, and TSH-3. Grade differences originate from fresh leaf maturity variations, leading to sensory quality distinctions (appearance, aroma, taste, liquor color, leaf base).

2.3. Sensory Evaluation

Five professional tea tasters from the Tea Evaluation Center of Ningde City, certified as senior tea tasters, performed sensory evaluation analyses on TSH samples. The evaluation room was located in a clean, dry, and well-lit environment (room temperature, 25 ± 2 °C). Each tea sample (3.0 g) was brewed with boiling water (150 mL) for 5 min. The tea infusion was then poured into evaluation bowls (250 mL) (GB/T 8313-2018) [28].
Prior to sensory evaluation, the five evaluators thoroughly discussed the evaluation methodology (GB/T 23776-2018) [29], including TSH characteristics, flavor selection, and scoring criteria. They also committed to operating independently without communication throughout the process. After initial preparation, the panel focused on taste attributes (e.g., heavy, thick, umami, and sweet) and aroma attributes (e.g., pure, sweet, flowery, and lasting). Each member scored the samples based on sensory attributes of aroma and taste. Intensity was rated as follows: very weak/detectable only (0–1), weak (1–2), neutral (2–3), strong (3–4), and very strong (>4). Data are presented as mean values.

2.4. Detection and Analysis of Non-Volatile Compounds by UPLC-MS

2.4.1. Catechin and Caffeine Analysis

Sample Preparation: Sample preparation followed the GB/T 8313-2018 method for detecting tea polyphenols and catechins in tea. A 200 mg (accurate to 0.5 mg) sample of uniformly ground and sieved tea was weighed into a 10 mL tube. Then, 5 mL of 70% methanol solution preheated to 70 °C was added, vortexed, and immediately placed in a 70 °C water bath for 10 min (mixed every 5 min). After extraction, the sample was cooled to room temperature and centrifuged at 3500 rpm for 10 min. The supernatant was transferred to a 10 mL volumetric flask. The residue was extracted once more with 5 mL of 70% methanol, repeating the above steps, and the extracts were combined and diluted to 10 mL in the volumetric flask. A 1 mL aliquot of the supernatant was transferred to a 10 mL tube, mixed with PSA (5 mg) and C18 (40 mg) adsorbents, vortexed for 2 min, and centrifuged at 3500 rpm for 5 min. The supernatant was filtered through a 0.22 µm organic membrane for analysis.
Standard Solution Preparation: Each standard (20.0 mg) was dissolved in methanol and diluted to 10 mL in a volumetric flask to prepare individual stock solutions at 2000 µg/mL. Mixed standard solutions for calibration curves were prepared fresh before use.
Chromatographic Conditions: The analytical conditions followed the Chen S method [30]. Column: Hypersil GOLD (100 × 2.1 mm, 1.9 µm); flow rate: 0.3 mL/min; column temperature: 30.0 °C; mobile phase A: 0.1% formic acid in water, mobile phase B: acetonitrile with 0.1% formic acid; gradient elution: 0–12 min, 5–17% B; 12–13 min, 17–100% B; 13–16.5 min, 100% B; 16.5–16.6 min, 100–5% B; 16.6–20 min, 5% B; injection volume: 1 µL.
Mass Spectrometry Conditions: Scan mode: electrospray ionization (H-ESI); catechins in negative ion mode, caffeine in positive ion mode; detection mode: multiple reaction monitoring (MRM); positive ion voltage: 3.5 kV, negative ion voltage: 3.8 kV; sheath gas (flowing around the capillary column to protect the ion source and transport ions): 20 Arbs (Arbitrary Units), auxiliary gas (used to assist in atomization and maintain ion transport efficiency): 5 Arbs; ion source temperature: 350 °C, vaporizer temperature: 400 °C; cone and desolvation gas: N2, collision gas: argon. Optimization of mass spectrometry parameters was performed using 10 ng/mL single standards of catechins and caffeine to determine characteristic parent and product ions.

2.4.2. Free Amino Acid Analysis

Sample Preparation: A 30 mg (accurate to 0.5 mg) sample of uniformly ground and sieved tea was weighed, and 1 mL of 70% methanol was added for metabolite extraction. The sample was vortexed and ultrasonically extracted at 25 °C for 20 min, followed by centrifugation at 6000 rpm for 10 min. The supernatant was filtered through a 0.22 µm organic membrane for analysis.
Standard Solution Preparation: Each standard (20.0 mg) was weighed and dissolved according to the solubility of the respective amino acid standards to prepare individual stock solutions at 2000 µg/mL for optimization. A mixed stock solution at 1 µmol/mL was prepared by dissolving a measured amount of each amino acid in methanol and diluting to 10 mL in a volumetric flask. Mixed standard solutions for calibration curves were prepared fresh before use.
Chromatographic Conditions: The analytical conditions followed Valérie Thibert’s method [31]. Column: Acclaim Trinity P1 (100 × 2.1 mm, 3 µm); flow rate: 0.3 mL/min; column temperature: 30.0 °C; mobile phase A: 5 mM ammonium acetate in deionized water, mobile phase B: acetonitrile with 0.1% formic acid; gradient elution: 0–5 min, 0–30% B; 5–7 min, 30–100% B; 7–11 min, 100% B; 12–18 min, 0% B; injection volume: 2 µL.
Mass Spectrometry Conditions: Scan mode: electrospray ionization (H-ESI); amino acids in positive ion mode; detection mode: multiple reaction monitoring (MRM); positive ion voltage: 3.5 kV; sheath gas: 45 Arb, auxiliary gas: 15 Arb; ion source temperature: 270 °C, vaporizer temperature: 370 °C; cone and desolvation gas: N2, collision gas: argon. Optimization of mass spectrometry parameters was performed using 10 ng/mL single standards of amino acids to determine characteristic parent and product ions.

2.5. Detection and Analysis of Volatile Compounds by GC–MS

2.5.1. Sample Preparation and Treatment

Materials were harvested, weighed, immediately frozen in liquid nitrogen, and stored at −80 °C until needed. Samples were ground to a powder in liquid nitrogen. Next, 500 g (1 mL) of the powder was transferred immediately to a 20 mL head-space vial (Agilent, 395 Page Mill Rd, Palo Alto, CA 94306, USA), containing NaCl saturated solution, to inhibit any enzyme reaction. The vials were sealed using crimp-top caps with TFE-silicone headspace septa (Agilent). At the time of SPME analysis, each vial was placed in 60 °C for 5 min, then a 120 µm DVB/CWR/PDMS fiber (Agilent) was exposed to the headspace of the sample for 15 min at 100 °C.

2.5.2. GC-MS Conditions

After sampling, desorption of the VOCs from the fiber coating was carried out in the injection port of the GC apparatus (Model 8890; Agilent) at 250 °C for 5 min in the splitless mode. The identification and quantification of VOCs was carried out using an Agilent Model 8890 GC and a 7000D mass spectrometer (Agilent), equipped with a 30 m × 0.25 mm × 0.25 μm DB-5MS (5% phenyl-polymethylsiloxane) capillary column. Helium was used as the carrier gas at a linear velocity of 1.2 mL/min. The injector temperature was kept at 250 °C and the detector at 280 °C. The oven temperature was programmed from 40 °C (3.5 min), increasing at 10 °C/min to 100 °C, at 7 °C/min to 180 °C, at 25 °C/min to 280 °C, hold for 5 min. Mass spectra were recorded in electron impact (EI) ionization mode at 70 eV. The quadrupole mass detector, ion source, and transfer line temperatures were set, respectively, at 150, 230, and 280 °C. Mass spectra were scanned in the range m/z 50–500 amu at 1 s intervals. Identification of volatile compounds was achieved by comparing the mass spectra with the data system library and linear retention index.

2.6. Statistical Analysis

All experimental data are presented as mean ± standard deviation. Differences in the content of non-volatile and volatile compounds were determined using Tukey’s honest significant difference (HSD) test. Correlation analysis (Pearson’s coefficient) was performed using SPSS software (PASW Statistics version_18, IBM, Chicago, IL, USA) to assess the relationships between metabolite content, TSH grades, and flavor characteristics. Bioinformatics analysis, including flavor radar charts, partial least squares-discriminant analysis (PLS-DA), heatmaps, and network diagrams, was conducted using the OmicStudio tool (available online: https://www.omicstudio.cn/tool, accessed on 29 January 2020) [32].

3. Results

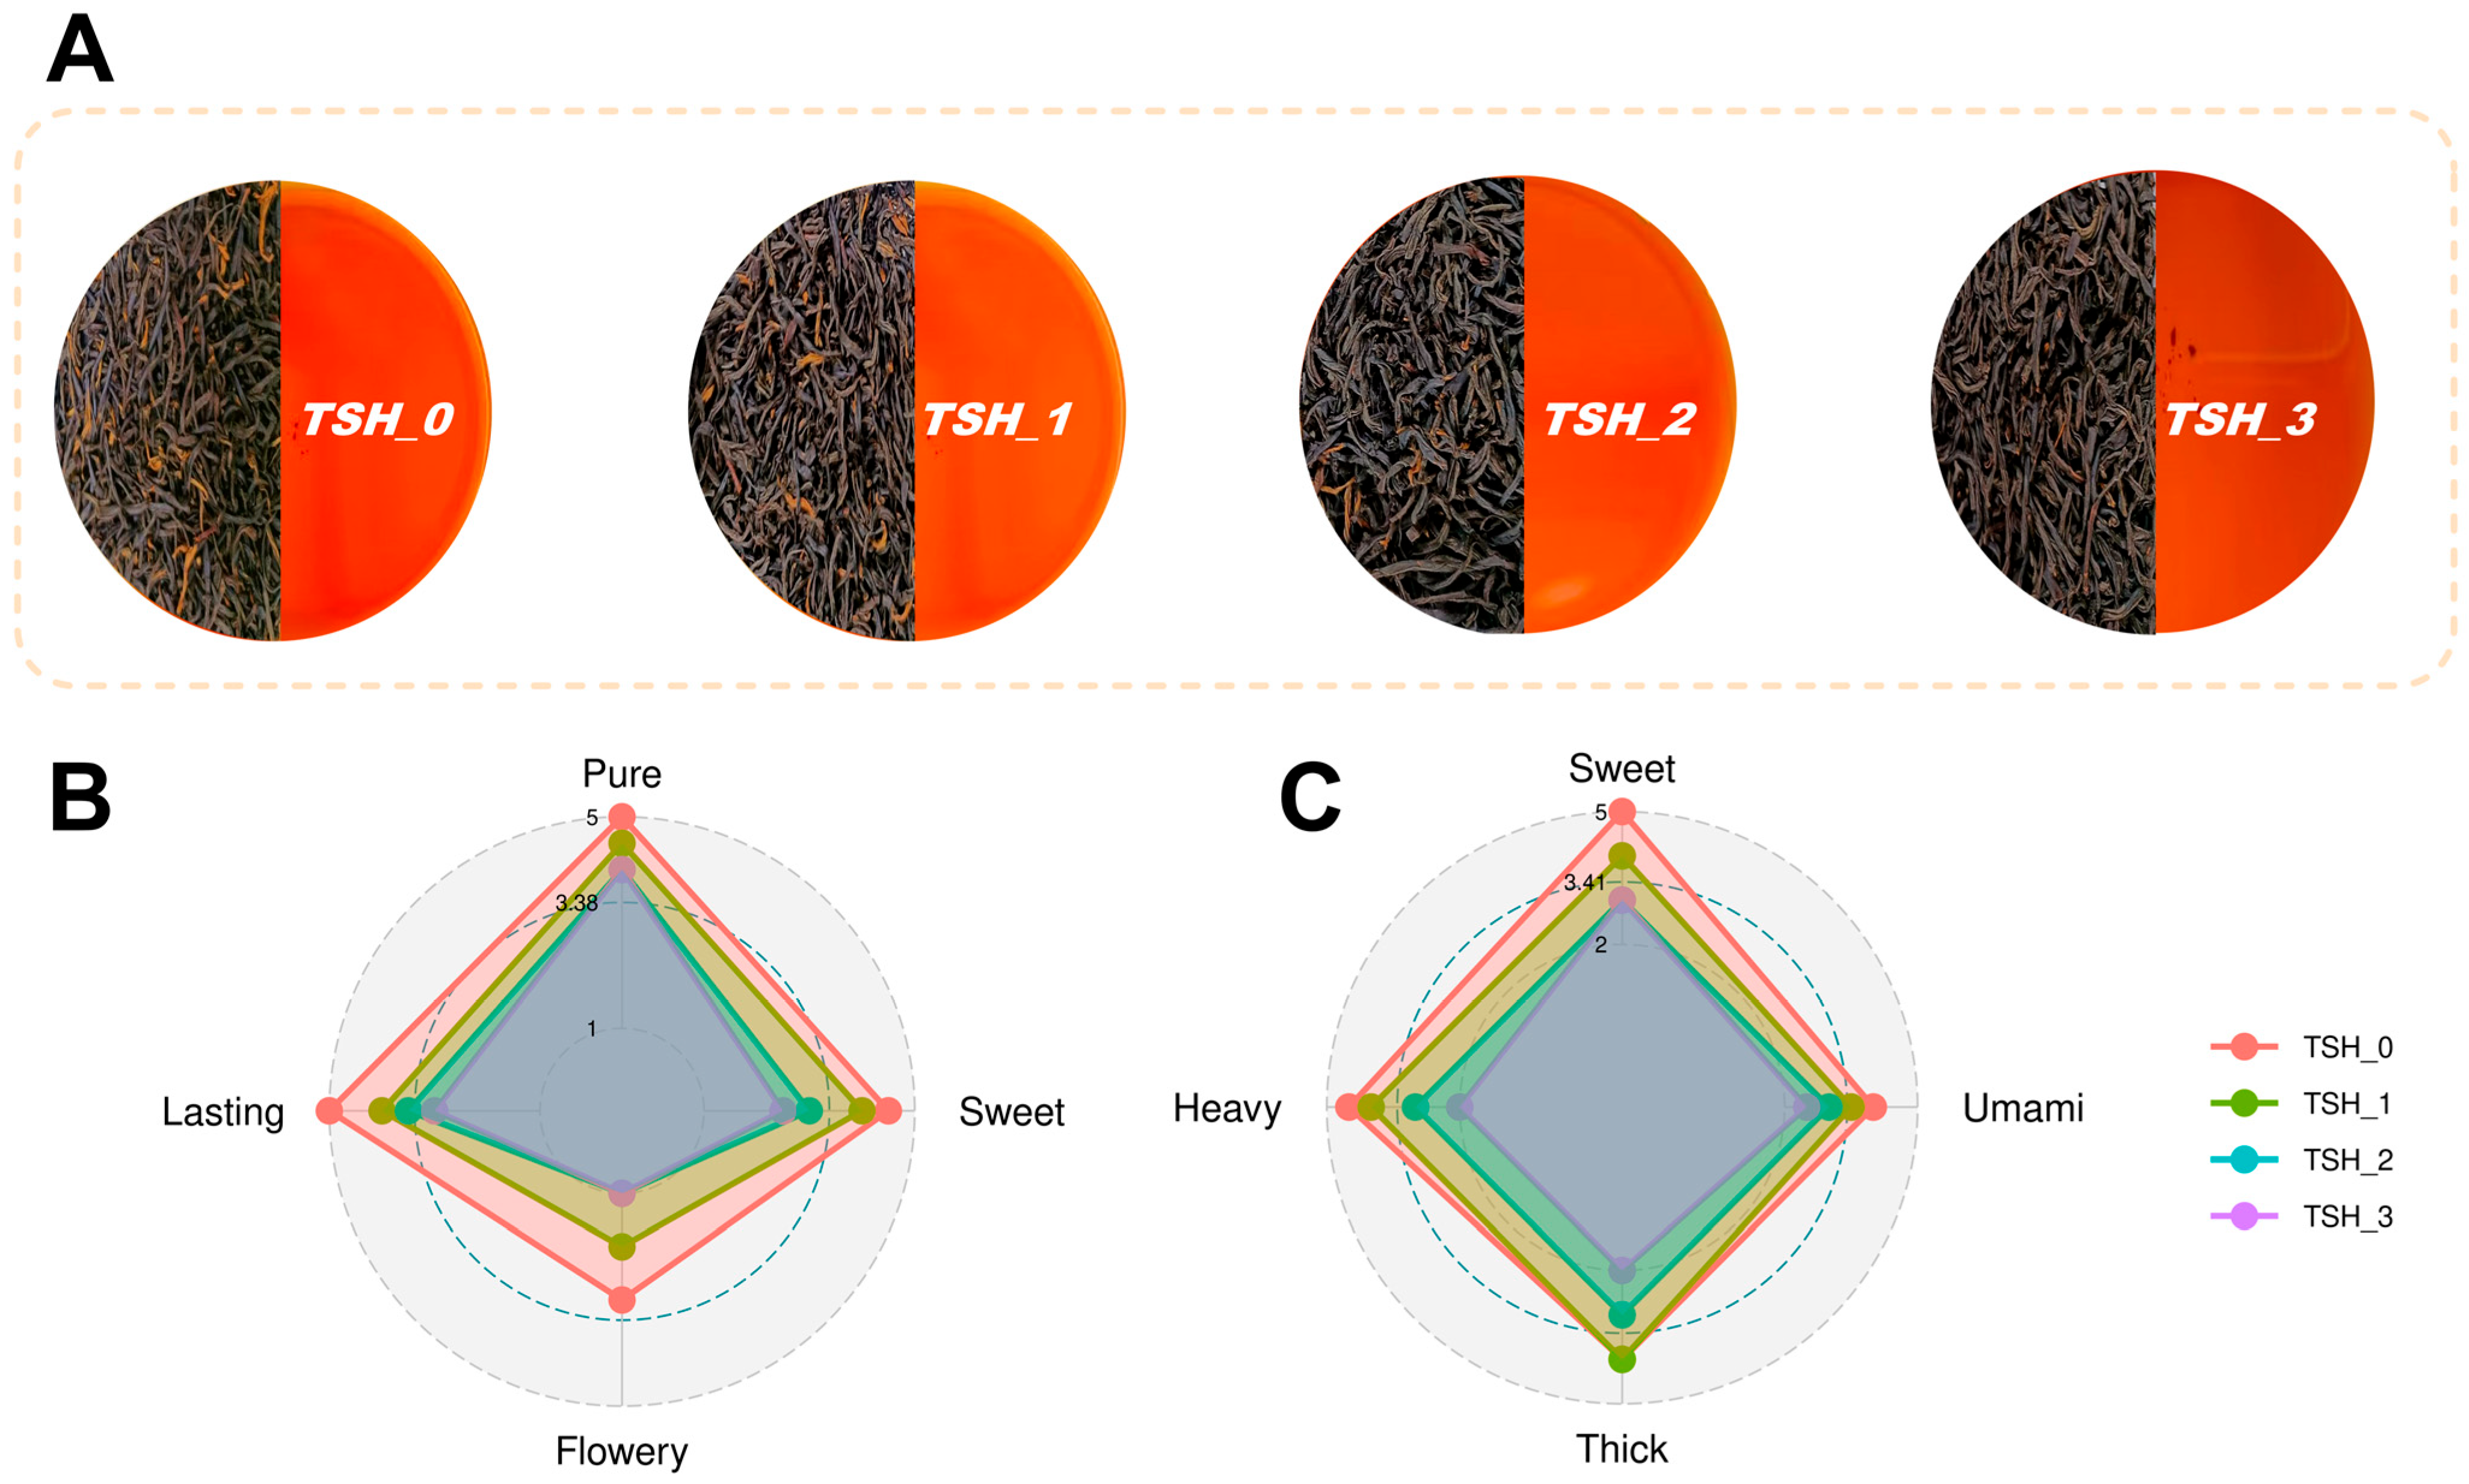
3.1. The Sensory Evaluation of Different Grades of TSH

Sensory evaluation was conducted on different grades of TSH (Figure 1). As the grade of TSH decreased, the appearance of the dry tea darkened, the number of golden tips reduced, and the brightness of the tea liquor weakened (Figure 1A), clearly indicating a decline in overall tea quality with lower grades. To further investigate the specific factors contributing to this decline, flavor radar charts were used for assessment. In terms of aroma characteristics, floral, sweet, purity, and persistence showed strong correlations across different grades of TSH. Specifically, higher-grade TSH exhibited more intense floral and sweet aromas, as well as superior purity and persistence (Figure 1B). Regarding taste attributes, sweetness, umami, concentration, and thickness also demonstrated strong correlations, with higher-grade TSH performing better in sweetness, umami, concentration, and thickness. Notably, the thickness of TSH-1 was comparable to that of TSH-0 (Figure 1C).

3.2. The Analysis of Catechins and Caffeine Content Between Different Grades of TSH

Catechins, as the primary non-volatile components in tea, are classified into ester-type catechins and non-ester catechins. Ref. [33] ester-type catechins are the main contributors to the bitter and astringent taste of tea. In this study, we identified and quantified five catechin compounds, including two ester-type catechins (EGCG and ECG) and three non-ester catechins (C, EC, and EGC) (Table 1). Notably, ester-type catechins accounted for nearly 80% of the total catechin content, with ECG levels higher than EGCG. As the grade of TSH decreased, the overall content of ester-type catechins showed a declining trend, and significant differences in ECG content were observed among different TSH grades. Among non-ester catechins, the content of C decreased with lower grades, while EGC increased. EC content generally decreased with lower grades but showed a slight increase in TSH-3 before declining again. Caffeine also contributes to the bitter taste of tea. The results revealed that caffeine content was highest in TSH-1 and lowest in TSH-2, with fluctuations across grades but no significant differences.
In summary, the content of catechins, particularly ester-type catechins, varied significantly among different TSH grades. The esterified catechin content in TSH-0 was significantly higher than in other grades, aligning with the sensory evaluation results that higher-grade TSH exhibits a more robust and intense taste.

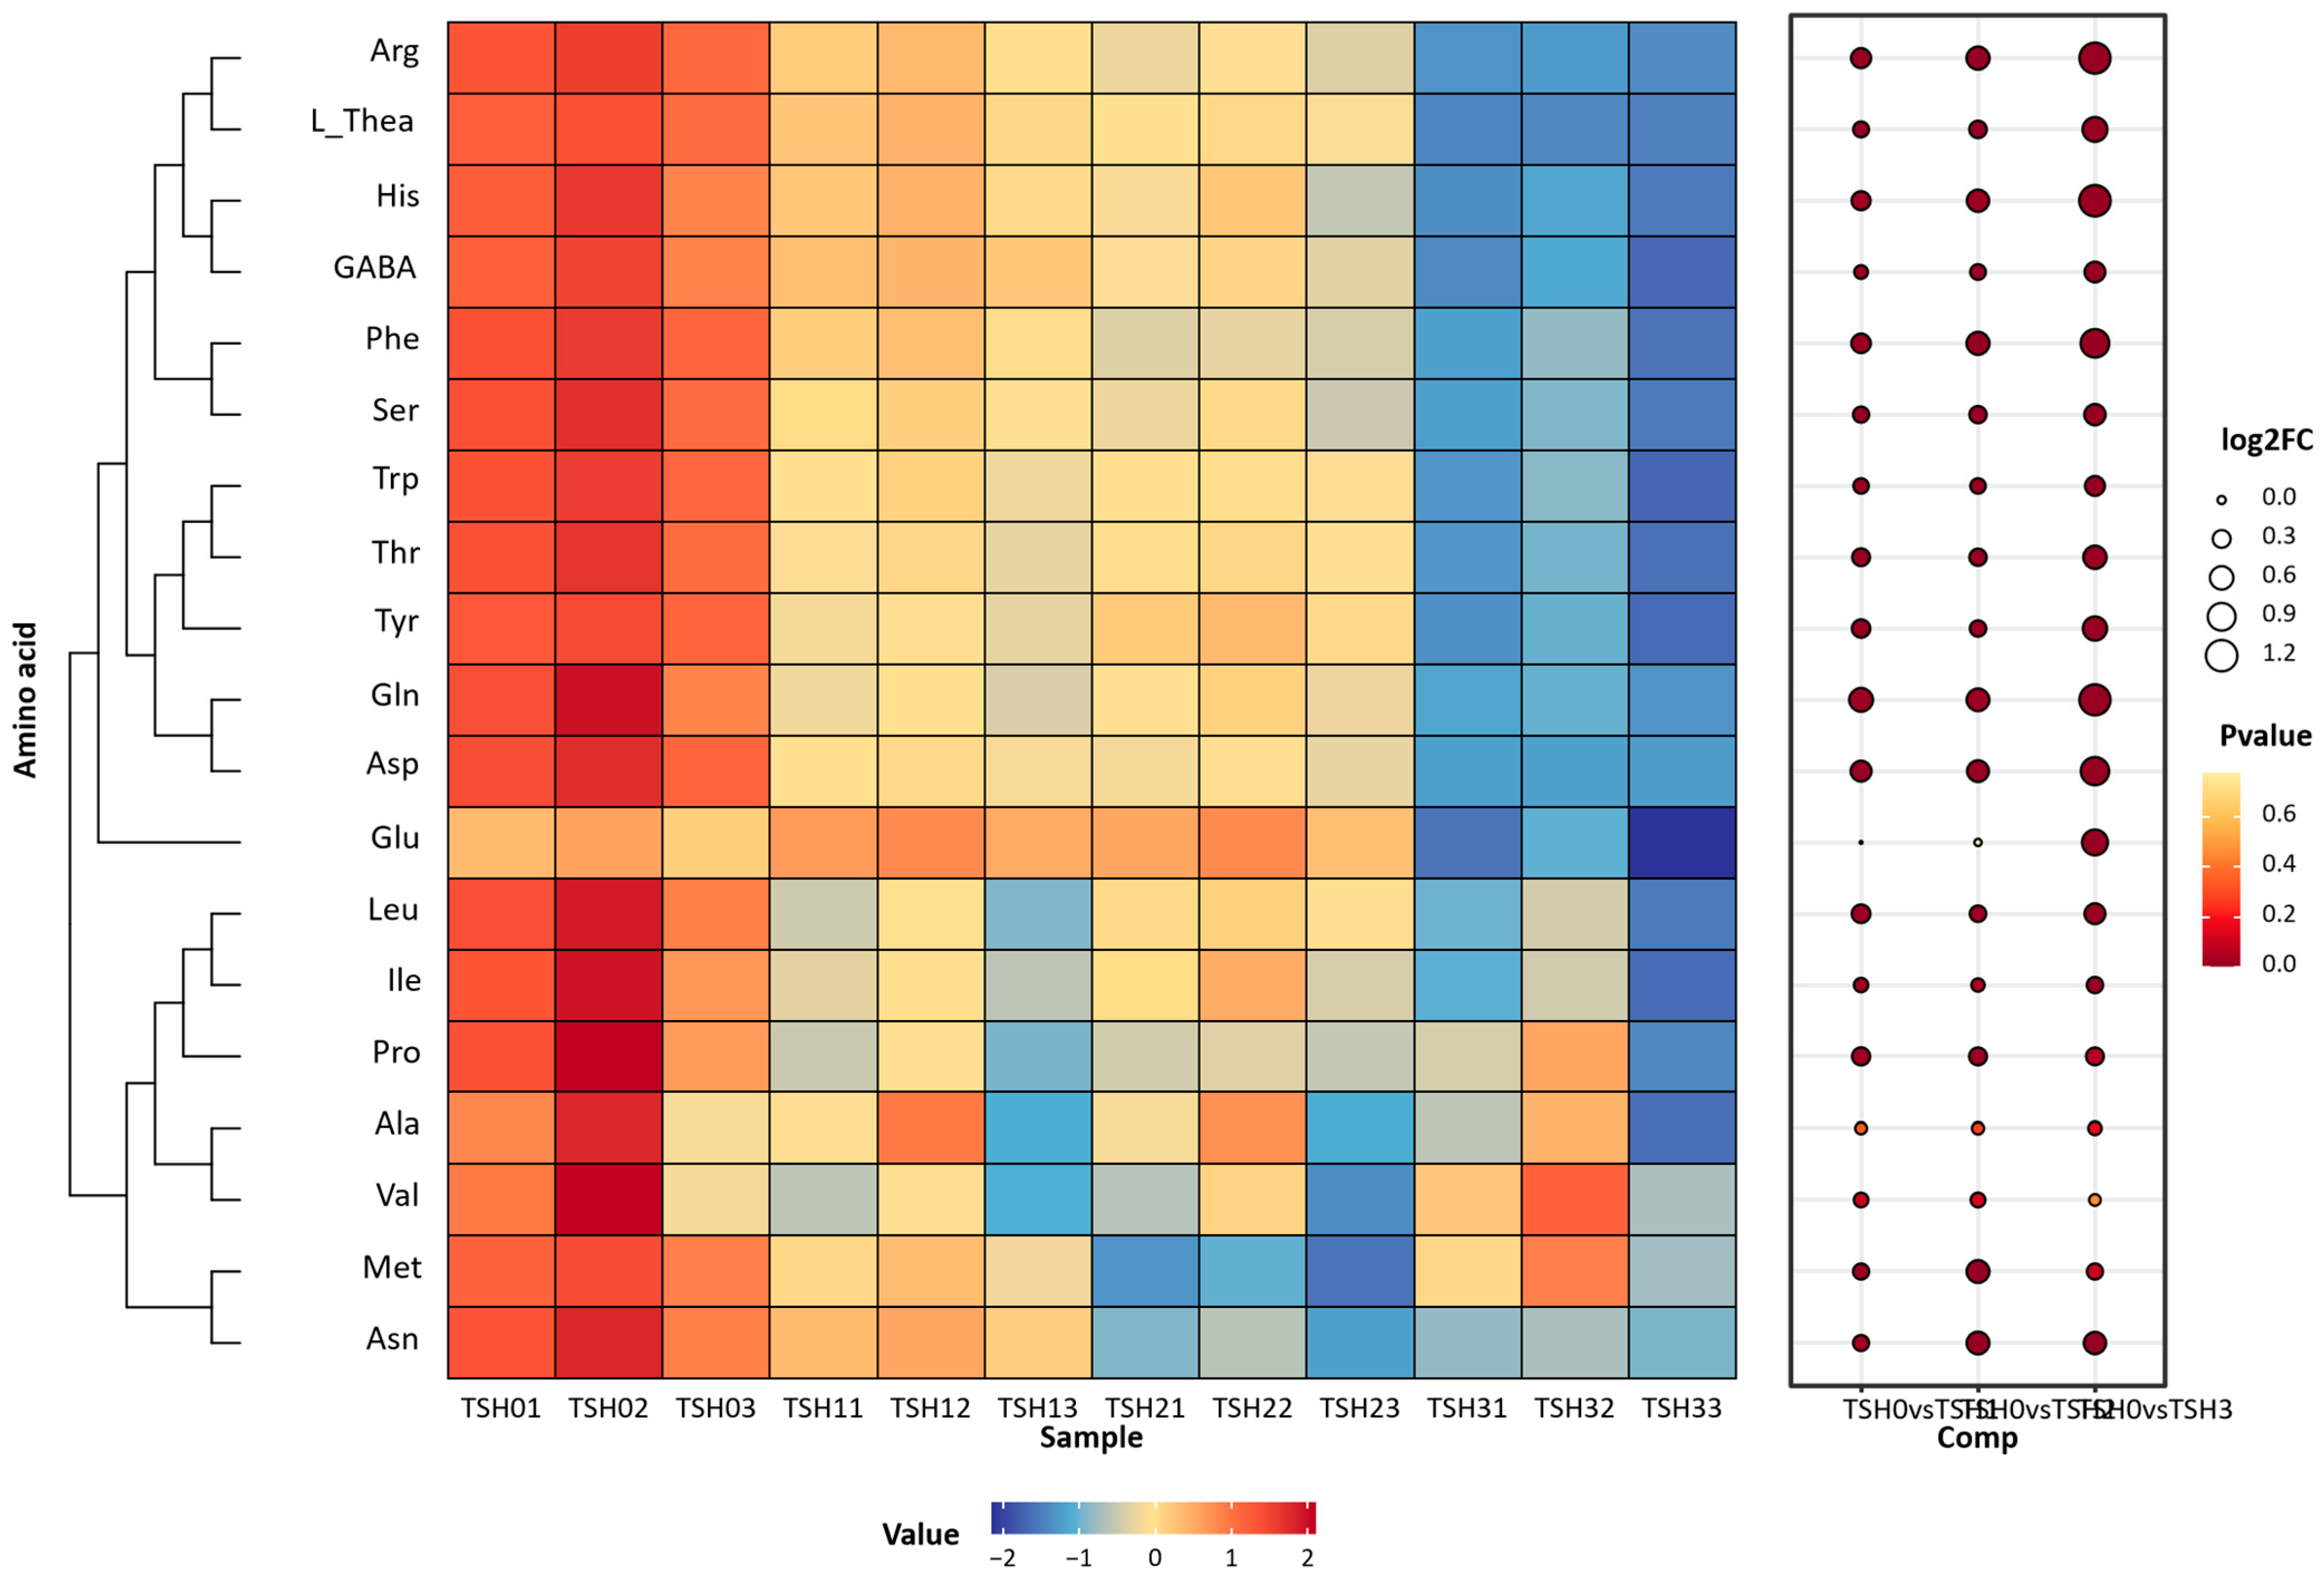
3.3. The Analysis of AA Content Between Different Grades of TSH

Amino acids (AAs) are the primary contributors to the fresh and refreshing taste of tea. In this study, 19 AAs were quantified across different grades of TSH (Figure 2), showing a strong correlation with TSH grades. The results indicated that the total AA content in TSH-0 was significantly higher than in other grades (p < 0.05), with TSH-0 exhibiting a fresh, sweet, and mellow taste, while TSH-3 was less fresh and primarily characterized by thickness.
Cluster analysis of the 19 AAs revealed three distinct groups. The first group included Arg, L_Thea, His, GABA, Phe, and Ser. These six AAs were most abundant in TSH-0 and decreased with lower grades. Significant differences were observed among grades, with pairwise comparisons showing significant differences (except between TSH-1 and TSH-2). The second group consisted of Trp, Thr, Tyr, Gln, Asp, and Glu. These AAs were also most abundant in TSH-0, with significant differences among grades. Except for Glu, which showed no significant differences among TSH-0, TSH-1, and TSH-2, the other five AAs were higher in TSH-2 than in TSH-1, though not significantly (p > 0.05). The third group included seven AAs: Leu, Ile, Pro, Ala, Val, Met, and Asn. Among these, Leu and Pro were significantly higher in TSH-0 than in other grades (p < 0.05), while Ala and Val showed no significant differences among grades (p > 0.05). Asn exhibited significant differences among TSH-0, TSH-1, and TSH-2 (p < 0.05). Additionally, we performed ANOVA based on cluster analysis for the 19 AAs to further validate their differential expression among TSH grades (Figure S1).
Therefore, we infer that the six AAs in the first group, Asp in the second group, and Asn in the third group are characteristic AAs for distinguishing TSH grades.

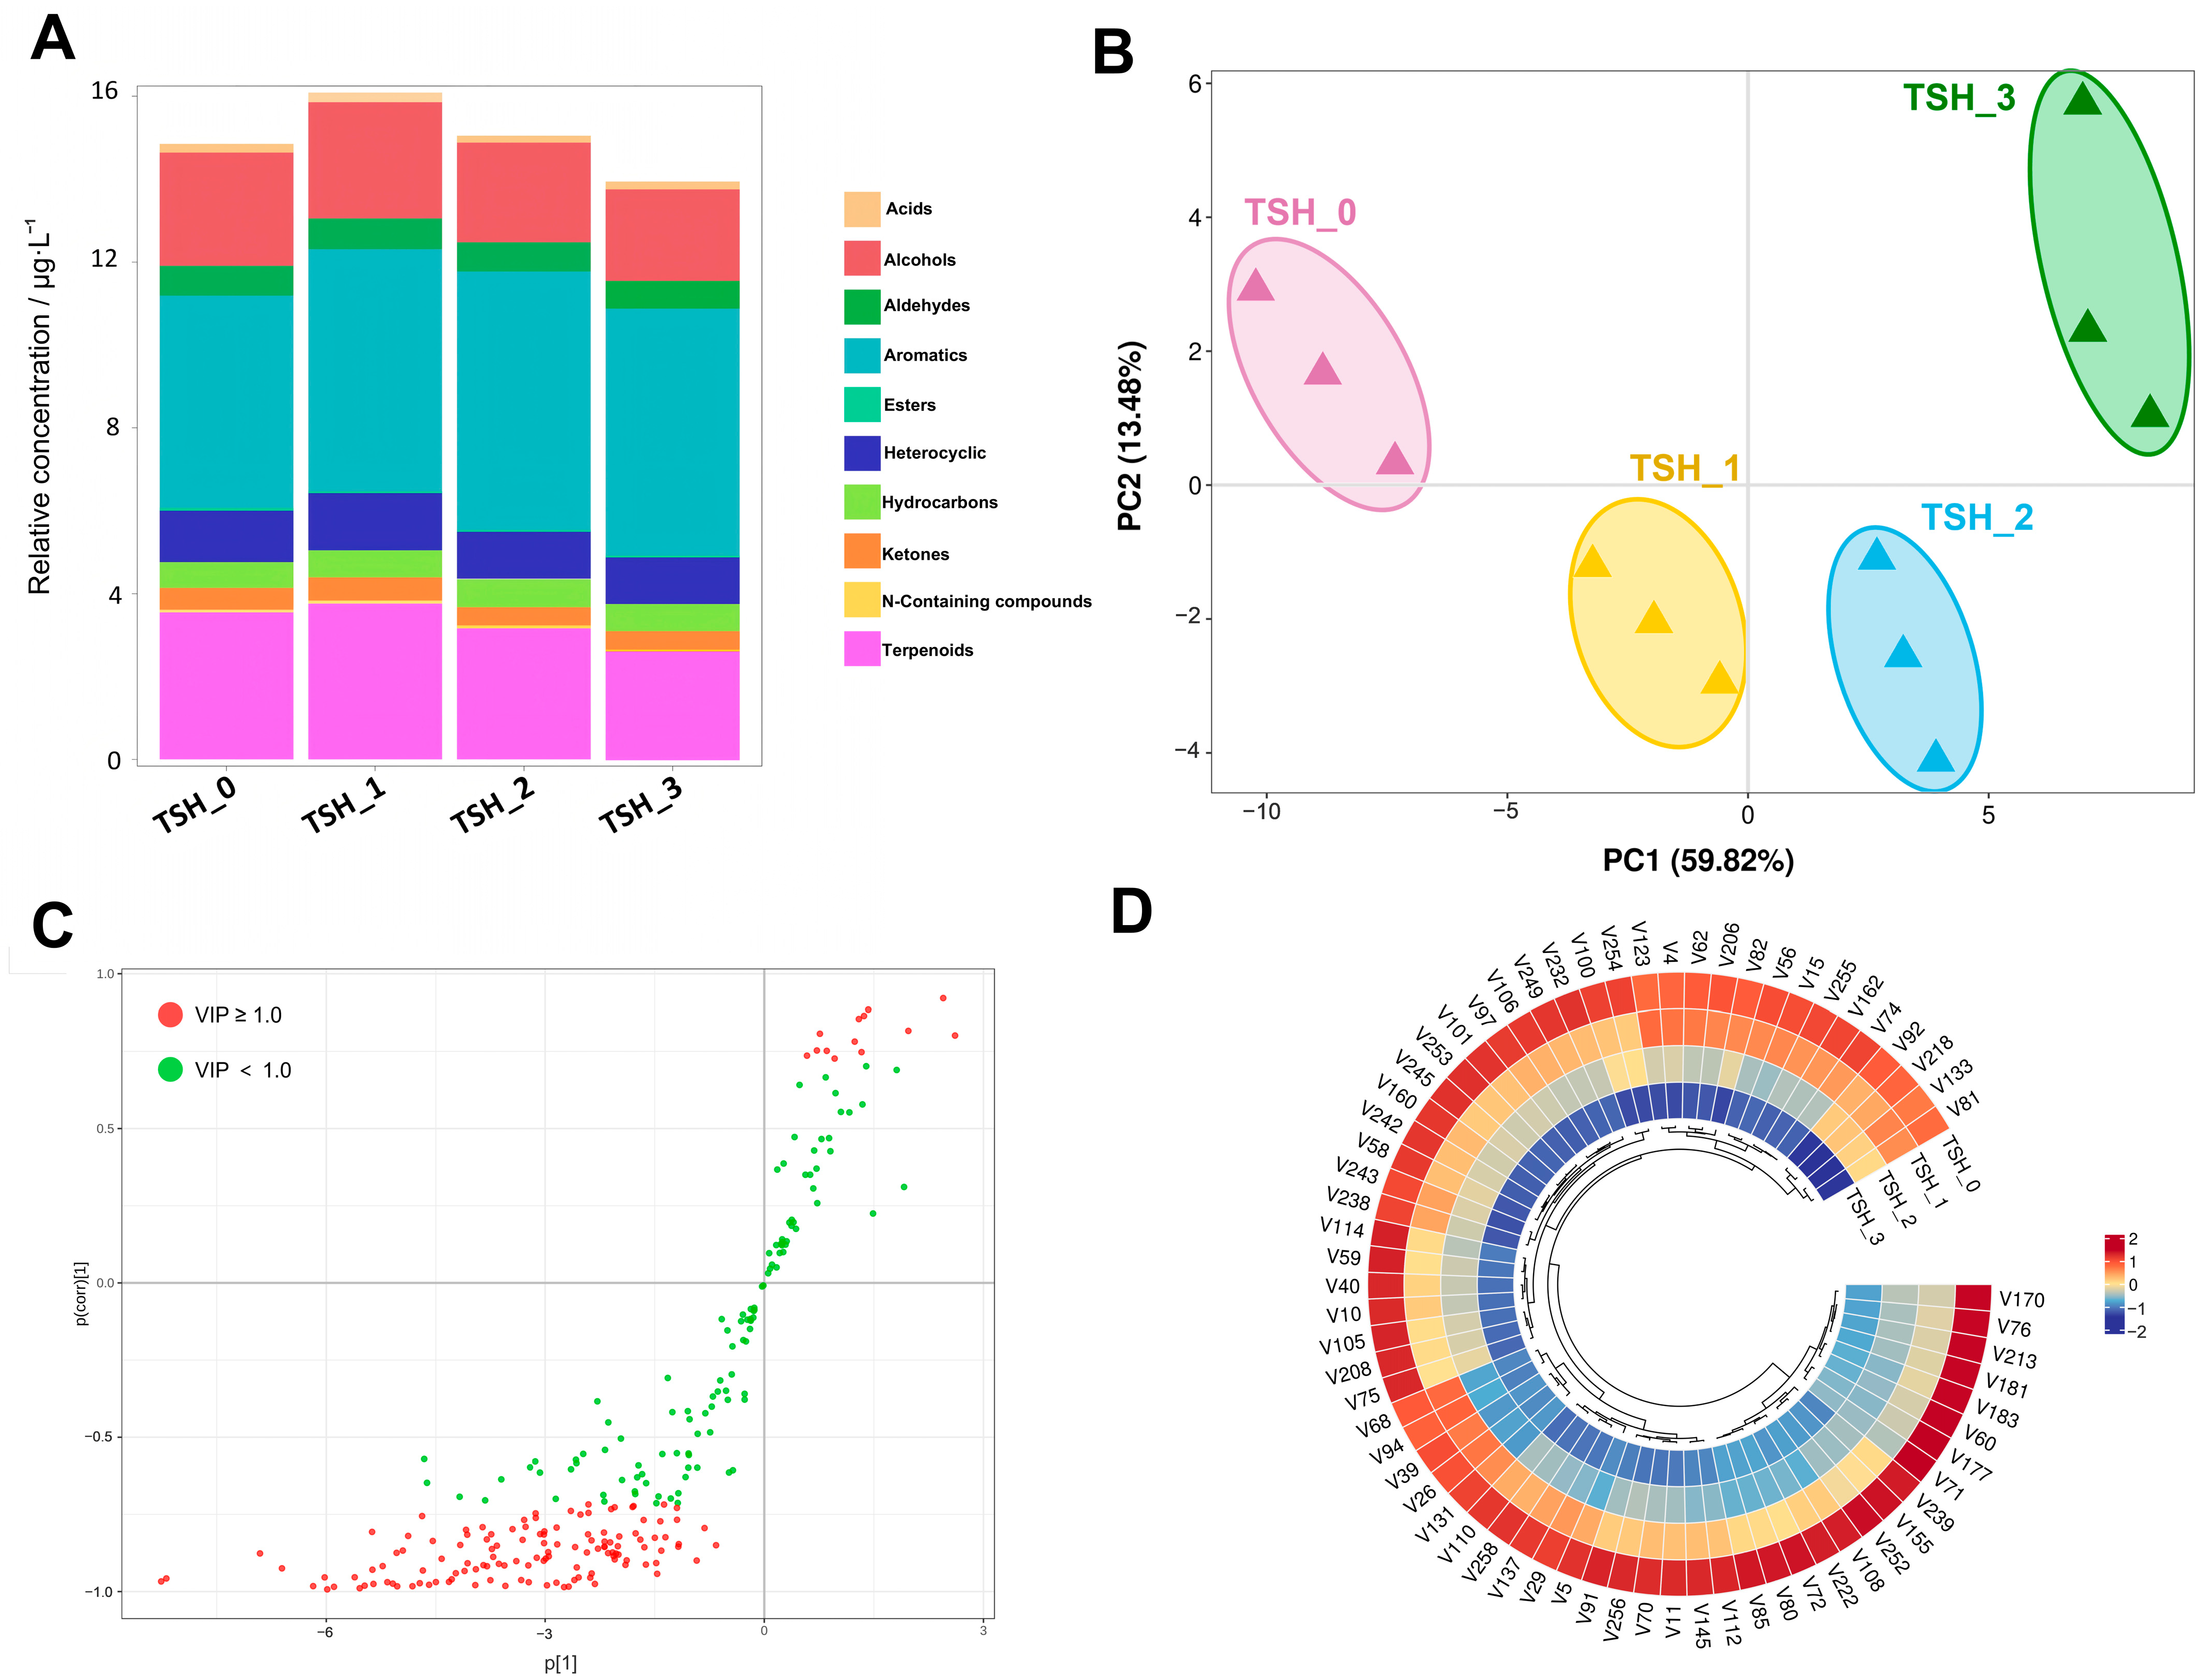
3.4. The Analysis of Volatile Between Different Grades of TSH

The analysis of the volatile compounds in TSH samples showed the presence of a total of 282 kinds of components and according to the qualitative and quantitative analyses, the compounds could be clustered into ten categories listing as acids, alcohols, aldehydes, aromatics, esters, heterocyclic, hydrocarbons, ketones, N-containing compounds, and terpenoids (Figure 3A). In all grades of TSH, aromatics represented the highest proportion, range 5.11~6.23%, followed by terpenoids (2.58~3.76%), and by alcohols (2.20~2.80%). These kinds of compounds tend to contribute to the floral and fruity fragrance of processed tea, which made up for the aroma profile of TSH.
Further analysis was conveyed under the PLS-DA mode combined with VIP more than (or equal to) 1 as measurement. Firstly, based on the results of PLS-DA mode (Figure 3B), four grades pf TSH could be dived and clustered into four circles. The value of PC1 (59.82%) and PC2 (13.48%) represented the reliability of this mode. Additionally, the distance between the replicates in different grades of samples was close, suggesting a reliable repeatability. TSH-0 is mostly located in the second quadrant and TSH-1 is located in the third quadrant, TSH-2 in the fourth quadrant, and TSH-3 in the first quadrant. When the measurement of VIP more than 1 (or equal to) was applied (Figure 3C), in total 108 kinds of compounds were identified (red rounds), and the green rounds represent the compounds with VIP value less than 1. Interestingly, both red and green rounds were mostly located in the first and third quadrant, while the green rounds were distributed in the center more closely, and the red rounds distributed on both ends sparsely. This loading scatter plot could reflect the distinctive components in different grades of TSH. Furthermore, to more precisely screen for differential volatiles between grades, we further refined the selection of key compounds by comparing fold change (FC) values between adjacent grades. Specifically, the sum of FC values (TSH-0 vs. TSH-1), FC (TSH-1 vs. TSH-2), and FC (TSH-2 vs. TSH-3) was calculated for 108 volatiles with VIP > 1.0. Compounds with a total FC > 3.0 were selected for analysis [34], resulting in the identification of 68 key volatiles (Table S1).
Figure 3D shows the gradually dynamic change of 68 selected components in different grades of TSH. The higher grade of TSH tends to possess higher amounts of components, while the lower grade of TSH possessed a lower amount of components. As shown in Table 2, the odor character and concentration of selected key compounds are listed. Among them, the majority of selected compounds like 2,6,10-Trimethyltridecane,2-Ethylbutyric acid, tetrahydrofurfuryl ester, and 3-Isopropylidene-tricyclo[4.3.1.1(2,5)]undecan-10-one, etc. showed the highest concentration in TSH-0, which was the highest grade of TSH, approving the best aroma quality of TSH. (Z)-3-Hexen-1-ol, formate, 1-Isopropyl-3-methyl-2-pyrazoline, 6-Methyl-5-hepten-2-one, and (Z)-3-Hexenyl iso-butyrate, among others, showed significant increase trend along with the approving of grade, and all these compounds as well as (E,Z)-2-Butenoic acid, 3-hexenyl ester, 2,2-Dimethyl-oxazolidine,1,2,3,4,4a,7-Hexahydro-1,6-dimethyl-4-(1-methylethyl)-naphthalene, etc. were higher in TSH-0 and TSH-1. In summary, higher grade of TSH possessed higher amount of aroma volatile compounds, which in consistent with the sensory evaluation of TSH.

3.5. The Association Analysis of Non-Volatile and Volatile Compounds Between Different Grades of TSH

A Pearson correlation analysis was conducted between the grade sensory analysis data and key non-volatile and volatile compounds. Using a threshold of p < 0.01 and an absolute r-value > 0.95, we analyzed the correlations between compounds and grades, compounds and taste attributes, as well as compounds and aroma attributes.
A total of 32 compounds showed significant positive correlations with TSH grades. These included four amino acids—Thea (umami, r = 0.964), Arg (slightly bitter, r = 0.975), GABA (sweet and refreshing, r = 0.961), and Phe (aromatic, r = 0.966)—all of which positively contribute to the freshness and intensity of the taste. The remaining 29 compounds were volatiles, with β-Myrcene (V242, fruity, tropical), β-Myrcene (V243, apple, pear, fruity), and Methyl salicylate (V97, mint, green) showing particularly high correlations. This suggests that these compounds are major contributors to the flavor profile of higher-grade TSH (Figure 4A).
Correlation analysis between TSH aroma attributes and metabolites revealed 29 and 25 metabolites positively associated with lasting and sweet aroma attributes, respectively, with 13 metabolites showing significant positive correlations with both of them. Notably, ECG exhibited a significant positive correlation with lasting, while EGC showed a significant negative correlation with sweet. Four amino acids—Arg, Phe, Asp, and Ser—were significantly positively correlated with lasting. Both pure and sweet attributes were significantly positively correlated with five volatiles—V108 (aromatic), V222, V112 (floral, citrus), V131, V137—and one amino acid (Asn, sweet). Among these, V137 (3-[4-(2-Methylpropyl) phenyl]butan-2-one, terpenoids, aromatic) was the only metabolite positively correlated with all four aroma attributes (Figure 4B).
Although taste attributes are more strongly associated with non-volatile compounds, volatiles also play a positive role in enhancing sensory taste quality. Therefore, we conducted correlation analyses between TSH taste attributes and both non-volatile and volatile compounds. The results showed that 32 and 23 metabolites were positively correlated with umami and heavy attributes, respectively, with 21 metabolites showing significant positive correlations with both of them. Among these, the amino acids Thea, Arg, GABA, and Asn were significantly correlated with sweet attributes, while no non-volatile compounds were found to be significantly correlated with thick attributes (Figure 4C).

4. Discussion

4.1. The Selection of Non-Volatile Compounds and Their Correlation Between Different TSH Grades

The quality characteristics of black tea, including heavy, thick, umami, and sweet attributes, are closely associated with non-volatile secondary metabolites such as catechins, amino acids, and caffeine [35]. Sensory evaluation revealed that the taste profile of TSH progresses from mellow to moderately rich and mellow, and finally to rich, mellow, and refreshing with increasing grade. This enhancement in intensity and thickness correlates strongly with ester-type catechins (ECG and EGCG), which increase synchronously with taste attributes. In contrast, non-ester catechins (C, EC, EGC) are present at lower levels and show weaker correlations. Our previous study on the innovative black tea MKH [19] revealed multiple catechin monomers closely associated with grade differentiation. However, in TSH, only ester-type catechins showed significant grade-dependent correlations—a pattern consistent with Li Chen et al.’s (2023) findings on graded Hehong Congou tea [36]. This suggests that in traditionally processed black teas, ester-type catechins exhibit stronger associations with quality grades, likely attributable to their characteristic heavy fermentation process. Traditional methods typically use a bud with one or two leaves as the material and employ high-temperature, high-humidity fermentation to achieve signature sensory qualities like sweet mellowness, robust thickness, and “red liquor with red leaves” [37]. Prolonged fermentation promotes the conversion of non-esterified to ester-type catechins [38]. In contrast, innovative teas like MKH primarily adopt light fermentation techniques. Thus, the enrichment of ester-type catechins in high-grade traditional Congou black teas may serve as a critical indicator of premium quality.
In high-grade TSH (TSH-0 and TSH-1), a distinctive “umami” sensory experience was observed. Quantitative analysis of 20 amino acids revealed that nine—including Thea, GABA, Phe, and His—increased with grade elevation. Correlation analysis identified Thea, GABA, and Arg as showing the strongest associations with umami. L-Thea (the most abundant amino acid in tea [39]) is a Glu derivative that contributes significantly to freshness and is closely linked to tea grade. Higher-quality black teas under varied processing conditions consistently exhibited elevated L-Thea levels [19]. Arg, the second most abundant free amino acid, imparts a mildly sweet taste [40]. Xie et al. [41] identified Arg as a key differential component in graded Dianhong teas, while Wang et al. [42] noted that traditional Congou processing (with prolonged heat transfer) promotes Arg accumulation, enhancing sweet-mellow notes. GABA—a glutamate decarboxylation product—also showed strong umami correlation. Contrary to studies linking GABA enrichment solely to anaerobic conditions (e.g., heavy fermentation), our MKH data revealed grade-dependent GABA increases, suggesting that withering-induced dehydration is the primary driver: heavier withering correlates with higher GABA accumulation and concurrent aroma compound formation [43], explaining the floral prominence in premium traditional black teas. Thus, Thea, Arg, and GABA collectively shape TSH’s fresh-sweet profile while serving as critical biomarkers for premium-grade products.

4.2. The Selection of Volatile Compounds and Their Correlation Between Different TSH Grades

Benefiting from full fermentation, black tea possesses the most diverse and complex aroma profile among the six major tea categories [44]. Unlike traditional black teas that pursue bright red liquor and evenly reddish infused leaves, innovative black teas (e.g., MKH, Golden Junmei) retain more floral aroma compounds through light fermentation [45]. In contrast, the comprehensive fermentation in traditional black tea results in more profound and holistic volatile accumulation and interactions. Our aroma profiling revealed that Methyl salicylate, Geraniol, Linalool, and Phenylethyl alcohol exhibited notably high concentrations.
Methyl salicylate, which contributes a fresh, minty, and slightly floral scent with wintergreen notes (reminiscent of peppermint or eucalyptus), may be associated with the heavier withering degree during TSH processing—Wu et al. [46] showed that moderate withering intensity facilitates the accumulation of such key aroma components. Geraniol, a key component of rose oil that imparts “rich,” “romantic,” and “elegant” aromatic traits, is positively correlated with raw material tenderness: Zhou et al. [47] confirmed that younger plucking standards in black tea (indicating more tender leaves) are directly associated with higher geraniol content.
Our previous research identified Methyl salicylate as a key volatile marker distinguishing traditional black tea (Fuyun No. 6 cultivar) from innovative varieties [48]. The relative abundance of Geraniol and Linalool reflects varietal characteristics (large- vs. small-leaf), seasonal variations, and plucking standards [49,50]. Their consistently high levels across TSH grades suggest the use of premium spring shoots and potential involvement of Fuyun No. 6 cultivar—a variety genetically related to Camellia sinensis var. assamica—evidenced by linalool’s marked predominance over geraniol. Phenylethyl alcohol contributes a characteristic rose-like note to premium TSH’s refined aroma profile. As demonstrated by Liu et al. [51], this compound plays a crucial role in sun-withered black teas. These findings collectively highlight how cultivar selection and precise processing techniques fundamentally shape TSH’s distinctive aromatic qualities.
Furthermore, we identified volatile compounds exhibiting strong correlations with specific sensory aroma attributes. Notably, V112 [(E)-geranic acid methyl ester (floral)] and V108 [1,6-dimethyl-4-(1-methylethyl)-naphthalene (aromatic)] both demonstrate characteristic floral or aromatic profiles. Chen’s study [52] confirmed (E)-geranic acid methyl ester as a signature aroma compound in Jiangxi’s traditional Ninghong Golden Hao tea. This compound has also been detected in traditional Hunan Caicha black tea and Anji black tea products. We therefore propose that V112 represents a characteristic volatile in traditional black teas, making significant contributions to TSH’s tender sweet and floral notes. Although V137 shows correlations with multiple aroma attributes, this compound remains unreported in existing literature.
Additionally, among the 29 volatile compounds strongly correlated with tea grades, 19 volatile compounds exhibited characteristic odor profiles. Notably, compound V101 (hexanoic acid, methyl ester) represents a typical aliphatic volatile with a relatively high odor threshold. With future technological advancements, these distinctive and readily detectable volatiles could serve as reliable markers for evaluating tea grade quality.

5. Conclusions

In this study, we employed a combination of tea flavor sensory evaluation, GC-MS, and UPLC-MS techniques coupled with multivariate statistical analysis to quantitatively analyze major flavor metabolites and identify key components distinguishing different grades of TSH standard samples. Furthermore, we investigated the biochemical basis underlying the formation of TSH’s flavor quality. The main conclusions are as follows:
(1)
TSH samples generally exhibit linear correlations with the contents of non-volatile compounds (including amino acids and ester-type catechins). Thea, Arg, and GABA show significant differences across grades and serve as potential biomarker components for MKH.
(2)
Methyl salicylate and linalool were the most abundant volatile compounds in higher-grade TSH, contributing to the formation of delicate sweetness and floral notes. These compounds not only showed significant correlations with tea grades but also played crucial roles in developing the persistent sweet aroma with floral characteristics in premium-grade TSH.
(3)
The cultivar, harvesting season, and maturity of fresh tea leaves were closely associated with TSH grades and flavor profiles, which may represent the primary factors contributing to the differential accumulation of flavor metabolites across various grades.

Supplementary Materials

The following supporting information can be downloaded at: https://www.mdpi.com/article/10.3390/beverages11040111/s1, Figure S1: Cluster analysis ANOVA of 19 amino acids in different grades of Tianshanhong; Table S1: Key compounds by comparing fold change (FC) values of different grades of Tianshanhong (TSH).

Author Contributions

S.-T.X. and X.-Z.H.: investigation; writing—original draft; formal analysis; writing—review and editing. J.-F.H.: investigation; Q.-Y.W.: methodology. Y.W.: formal analysis, T.-T.D.: validation, X.-X.X.: formal analysis, H.-X.L.: supervision. X.-H.C.: resources. S.-Z.Z.: data curation. Z.-W.Z.: conceptualization; writing—review and editing; and funding acquisition supervision. All authors have read and agreed to the published version of the manuscript.

Funding

This research was funded by Spark Technology Project of Fujian Province (2023S0061); the Fujian Provincial Natural Science Foundation of China (2022J05271); Educational and Scientific Research Project for Young and Middle-aged Teachers in Fujian Province (JAT220756); Professional Group of Tea Production and Processing Technology of the Provincial-level Teaching Innovation Team for Vocational College Teachers in Fujian Province (Document No. Minjiaobanshi [2023] No. 16); Huang Xianzhou Skilled Master Studio in Ningde City (024/3232301).

Institutional Review Board Statement

Tea is universally recognized as a safe food material that does not typically require special ethical review for analytical studies. Our methodology strictly follows established protocols for tea evaluation (GB/T 23776-2018) and utilizes standard analytical procedures with certified reagents.

Informed Consent Statement

The five authors (Xian-Zhou Huang, Xian-Xian Xu, Xiao-Hui Chen, Shi-Zhong Zheng, Zi-Wei Zhou) are all national senior tea tasters. We voluntarily participated in the sensory evaluation test of Tienshanhong (TSH) black tea at different grades, adhering to an objective and fair attitude and a rigorous and meticulous professional spirit. Moreover, no ethical tests were involved in the tea evaluation process.

Data Availability Statement

The original contributions presented in this study are included in this article/Supplementary Materials. Further inquiries can be directed to the corresponding author.

Conflicts of Interest

Author Jian-Feng Huang was employed by the company Fujian Hongjun Agricultural Development Co., Ltd. He participated in investigation in the study. The role of the company was general manager. Author Xian-Xian Xu was employed by the company Fujian Haiwu Tea Industry Development Co., Ltd. She participated in formal analysis in the study. The role of the company was general manager. The remaining authors declare that the research was conducted in the absence of any commercial or financial relationships that could be construed as a potential conflict of interest.

Abbreviations

The following abbreviations are used in this manuscript:
TSHTianshanhong black tea
AAsAmino acids

References

  1. Xu, Y.M.; Qiao, F.B.; Huang, J.K. Black tea markets worldwide: Are they integrated? J. Integr. Agric. 2022, 21, 552–565. [Google Scholar] [CrossRef]
  2. Ma, J.Q.; Wang, Y.J.; Li, J.Y.; Zhang, J.X.; Wei, Y.M.; Yan, Y.X.; Wang, H.P.; Pan, Y.; Xiong, Z.C.; Wang, R.J.; et al. Aroma formation mechanism by the drying step during Congou black tea processing: Analyses by HP-SPME and SAFE with GC-MS. LWT 2024, 198, 116019. [Google Scholar] [CrossRef]
  3. Wen, M.C.; Hu, W.; Li, L.; Long, P.P.; Han, Z.S.; Ke, J.P.; Deng, Z.Y.; Zhu, M.T.; Zhang, L. Developed metabolomics approach reveals the non-volatile color-contributing metabolites during Keemun congou black tea processing. Food Chem. 2025, 463, 141222. [Google Scholar] [CrossRef] [PubMed]
  4. Deb, S.; Jolvis Pou, K.R. A Review of Withering in the Processing of Black Tea. J. Biosyst. Eng. 2016, 41, 365–372. [Google Scholar] [CrossRef]
  5. Wang, L.L.; Yang, Y.Q.; Xie, J.L.; Miao, Y.W.; Wang, Q.W.; Jiang, Y.W.; Deng, Y.L.; Tong, H.R.; Yuan, H.B. Evaluation of aroma quality in premium and defective black teas using electronic nose combined with GC-MS technology. Food Sci. 2024, 45, 274–282. (In Chinese) [Google Scholar]
  6. Xue, T.T. Research on Ningde Tea Industry Development and Targeted Poverty Alleviation Innovation Model. Master’s Thesis, Fujian Agriculture and Forestry University, Fuzhou, China, 2018. (In Chinese). [Google Scholar]
  7. Zhu, Y.; Fan, X.; Yu, W.; Liu, C.; Wang, P.; Wei, M.; Lu, M.; Lv, S.; Cai, C.; Ye, N. Genetic variation of tea plant in Ningde and its adjacent regions revealed by single nucleotide polymorphism genotyping. Agron. J. 2023, 115, 2829–2842. [Google Scholar] [CrossRef]
  8. Zheng, K.L.; Fang, C.; Wu, H.X. Quality and processing technology of Tianshanhong Congou black tea. China Tea 2011, 33, 28–29. (In Chinese) [Google Scholar]
  9. Ouyang, J.; Jiang, R.G.; An, H.M.; Ou, X.C.; Wang, J.; Xie, H.; Fu, W.J.; Zhang, J.; Chen, H.Y.; Liu, Q.; et al. Decoding the specific minty-like aroma of ‘Rucheng baimaocha’ (Camellia pubescens) black tea. Food Chem. X 2025, 26, 102253. [Google Scholar] [CrossRef] [PubMed]
  10. Yan, F.; Chen, X.H.; Qu, D.; Huang, W.; He, L.J.; Wan, T.; Zhang, L.J.; Wang, Q.; Hu, C.Y. Determination of geographical origin of Southern Shaanxi Congou black teas using sensory analysis combined with gas chromatography-ion mobility spectrometry. Foods 2024, 13, 3904. [Google Scholar] [CrossRef] [PubMed]
  11. Peng, Q.; Li, S.S.; Shen, R.; Huang, J.X.; Beatrice, B.M.; Chen, X.P.; Xie, G.F. Comparative study of volatile compounds and metabolic pathways of Congou black tea from four regions based on sensory evaluation and HS-SPME/GC-MS. Microchem. J. 2024, 205, 111276. [Google Scholar] [CrossRef]
  12. Long, P.P.; Su, S.X.; Han, Z.S.; Granato, D.; Hu, W.; Ke, J.P.; Zhang, L. The effects of tea plant age on the color, taste, and chemical characteristics of Yunnan Congou black tea by multi-spectral omics insight. Food Chem. X 2024, 21, 101190. [Google Scholar] [CrossRef] [PubMed]
  13. Wang, Q.S.; Qiao, X.Y.; Wu, H.L.; Cao, J.X.; Chen, D. Study on Aroma Compounds of Black Teas from Five Regions in Sri Lanka by HS-SPME/GC-MS. Food Res. Dev. 2016, 37, 128–133. [Google Scholar]
  14. Wang, Q.S.; Qin, D.D.; Huang, G.Z.; Jiang, X.H.; Fang, K.X.; Wang, Q.; Ni, E.D.; Li, B.; Pan, C.D.; Li, H.J.; et al. Identification and characterization of the key volatile flavor compounds in black teas from distinct regions worldwide. Food Chem. 2022, 390, 133207. [Google Scholar] [CrossRef] [PubMed]
  15. Yue, C.N.; Wang, Z.H.; Peng, H.; Li, W.J.; Yang, P.X. UPLC-QTOF/MS-based non-targeted metabolomics coupled with the quality component, QDA, to reveal the taste and metabolite characteristics of six types of Congou black tea. LWT 2023, 185, 115197. [Google Scholar] [CrossRef]
  16. Niu, Y.W.; Zhang, Y.; Xiao, Z.B.; Zhu, J.C.; Zhang, F.M.; Chen, F. Release effect of aroma compounds of Keemun black tea brewed with deuterium-depleted water with different deuterium content. LWT 2023, 173, 114382. [Google Scholar] [CrossRef]
  17. Yue, C.N.; Yang, P.X.; Qin, D.D.; Cai, H.L.; Wang, Z.H.; Li, C.; Wu, H.L. Identification of volatile components and analysis of aroma characteristics of Jiangxi Congou black tea. Int. J. Food Prop. 2020, 23, 2160–2173. [Google Scholar] [CrossRef]
  18. Yue, C.N.; Li, W.J.; Li, C.; Wang, Z.H.; Peng, H.; Yang, P.X. Differential characterization of volatile components and aroma sensory properties of different types of Hehong tea (Congou black tea). Flavour Fragr. J. 2022, 38, 61–72. [Google Scholar] [CrossRef]
  19. Zhou, Z.W.; Wu, Q.Y.; Chen, L.Q.; Ruan, S.L.; Yang, Z.Y.; Sun, Y.; Aikebaier, R. Comparison of Different Grades of Innovative Tanyang Congou Black Tea (Minkehong) Based on Metabolomics and Sensory Evaluation. Horticulturae 2024, 10, 374. [Google Scholar] [CrossRef]
  20. Gao, C.; Huang, Y.; Li, J.; Lyu, S.; Wang, Z.; Xie, F.; Luo, Y.; Zhang, F.; Chen, Z.; Sun, W. Relationship between the grade and the characteristic flavor of PCT (Panyong Congou Black Tea). Foods 2022, 11, 2815. [Google Scholar] [CrossRef] [PubMed]
  21. Pang, X.M.; Chen, F.Y.; Liu, G.Y.; Zhang, Q.; Ye, J.H.; Lei, W.X.; Jia, X.L.; He, H.B. Comparative analysis on the quality of Wuyi Rougui (Camellia sinensis) tea with different grades. Food Sci. Technol. 2022, 42, 115321. [Google Scholar] [CrossRef]
  22. Zeng, L.; Fu, Y.Q.; Liu, Y.Y.; Huang, J.S.; Chen, J.X.; Yin, J.F.; Jin, S.; Sun, W.J.; Xu, Y.Q. Comparative analysis of different grades of Tieguanyin oolong tea based on metabolomics and sensory evaluation. LWT 2023, 174, 114423. [Google Scholar] [CrossRef]
  23. Fu, X.S.; Xu, L.; Yu, X.P.; Ye, Z.H.; Cui, H.F. Robust and automated internal quality grading of a Chinese green tea (Longjing) by near-infrared spectroscopy and chemometrics. J. Spectrosc. 2013, 2013, 139347. [Google Scholar] [CrossRef]
  24. Chen, L.Q.; Zhou, Z.W.; Cai, Y.W.; Zhang, Z.H.; Jiang, S.T.; Aikebaier, R.; Chen, Y. Analysis of main chemical components in nine white tea reference materials based on UPLC-MS/MS technology. J. Agric. Sci. Technol. 2024, 26, 50–62. (In Chinese) [Google Scholar] [CrossRef]
  25. Yue, W.J.; Sun, W.J.; Rao, R.S.P.; Ye, N.X.; Yang, Z.B.; Chen, M.J. Non-targeted metabolomics reveals distinct chemical compositions among different grades of Bai Mudan white tea. Food Chem. 2018, 277, 289–297. [Google Scholar] [CrossRef] [PubMed]
  26. Lü, H.P.; Lin, Z.; Zhang, Y.; Liang, Y.R. Comparison of chemical composition and antioxidant activity of Pu-erh tea with different grades. J. Tea Sci. 2013, 33, 386–395. (In Chinese) [Google Scholar] [CrossRef]
  27. Zhang, J.D. Primary processing technology of high-aroma Tianshanhong Congou black tea. Fujian Tea 2014, 36, 36–37. (In Chinese) [Google Scholar]
  28. GB/T 8313-2018; Method for the Determination of Tea Polyphenols and Catechins in Tea. China Standards Press: Beijing, China, 2018. (In Chinese)
  29. GB/T 23776-2018; Method for Sensory Evaluation of Tea. China Standards Press: Beijing, China, 2018. (In Chinese)
  30. Chen, S.; Li, M.H.; Zheng, G.Y.; Wang, T.T.; Lin, J.; Wang, S.S.; Wang, X.X.; Chao, Q.L.; Cao, S.X.; Yang, Z.B.; et al. Metabolite Profiling of 14 Wuyi Rock Tea Cultivars Using UPLC-QTOF MS and UPLC-QqQ MS Combined with Chemometrics. Chem. Chem. 2018, 23, 104. [Google Scholar] [CrossRef] [PubMed]
  31. Thibert, V.; Legeay, P.; Chapuis-Hugon, F.; Pichon, V. Molecularly imprinted polymer for the selective extraction of cocaine and its metabolites, benzoylecgonine and ecgonine methyl ester, from biological fluids before LC-MS analysis. J. Chromatogr. B 2014, 949–950, 16–23. [Google Scholar] [CrossRef] [PubMed]
  32. Lyu, F.Y.; Han, F.R.; Ge, C.L.; Mao, W.K.; Chen, L.; Hu, H.P.; Chen, G.G.; Lang, Q.L.; Fang, C. OmicStudio: A composable bioinformatics cloud platform with real-time feedback that can generate high-quality graphs for publication. iMeta 2023, 2, e85. [Google Scholar] [CrossRef] [PubMed]
  33. Xu, Y.Q.; Zhang, Y.N.; Chen, J.X.; Wang, F.; Du, Q.Z.; Yin, J.F. Quantitative analyses of the bitterness and astringency of catechins from green tea. Food Chem. 2018, 258, 16–24. [Google Scholar] [CrossRef] [PubMed]
  34. Shi, S.-H.; Lee, S.-S.; Zhu, Y.-M.; Jin, Z.-Q.; Wu, F.-B.; Qiu, C.-W. Comparative metabolomic profiling reveals key secondary metabolites associated with high quality and nutritional value in broad bean (Vicia faba L.). Molecules 2022, 27, 8995. [Google Scholar] [CrossRef] [PubMed]
  35. Fan, J.; Wang, Q.S.; Qin, D.D.; Fang, K.X.; Zhu, H.Y.; Jiang, X.H.; Chen, D.; Wu, H.L. Research progress on black tea quality and related biochemical factors. Food Sci. 2020, 41, 246–253. (In Chinese) [Google Scholar]
  36. Li, C.; Jiang, X.F.; Cao, H.H.; Zhang, J.G.; Yu, Z.; Ni, D.J.; Dong, C.W.; Jiang, H.Y. Flavor characteristics of Hehong tea (Congou black tea) at different quality grades. Chin. Agric. Sci. Bull. 2023, 39, 151–157. (In Chinese) [Google Scholar]
  37. Su, D.; Zhu, J.Y.; Li, Y.C.; Qin, M.X.; Lei, Z.D.; Zhou, J.T.; Yu, Z.; Chen, Y.Q.; Zhang, D.; Ni, D.J. Effect of drying temperature on sensory quality, flavor components, and bioactivity of Lichuan black tea processed by Echa No. 10. Molecules 2025, 30, 361. [Google Scholar] [CrossRef] [PubMed]
  38. Huang, M.H.; Tang, Y.; Tan, Z.P.; Ren, J.C.; He, Y.; Huang, H.S. Detection of black tea fermentation quality based on optimized deep neural network and hyperspectral imaging. Infrared Phys. Technol. 2024, 143, 105625. [Google Scholar] [CrossRef]
  39. Fu, X.M.; Liao, Y.Y.; Cheng, S.H.; Deng, R.F.; Yang, Z.Y. Stable isotope-labeled precursor tracing reveals that L-alanine is converted to L-theanine via L-glutamate not ethylamine in tea plants in vivo. J. Agric. Food Chem. 2021, 69, 15354–15361. [Google Scholar] [CrossRef] [PubMed]
  40. Du, Y.Y.; Liu, X.Z.; Ye, M.J.; Xu, J.F.; Gao, H.Y.; Zheng, G.J. Determination of free amino acid components in tea by ultra performance liquid chromatography-tandem mass spectrometry. Chin. J. Chromatogr. 2019, 37, 597–604. [Google Scholar] [CrossRef] [PubMed]
  41. Xie, J.L.; Chen, J.Y.; Yuan, H.B.; Wang, L.L.; Yang, Y.Q.; Jiang, Y.W. Evaluation of non-volatile differential components in Dianhong tea infusions across different grades using electronic tongue and metabolomics. J. Chin. Inst. Food Sci. Technol. 2024, 24, 354–368. (In Chinese) [Google Scholar] [CrossRef]
  42. Wang, H.J.; Hua, J.J.; Jiang, Y.W.; Wang, J.J.; Yuan, H.B. Effects of full-fire heat transfer method on quality components, color and taste of Congou black tea. Food Sci. 2020, 41, 148–157. (In Chinese) [Google Scholar]
  43. Xiao, H.; Xiao, W.X. Formation mechanism and enrichment technology of γ-aminobutyric acid in tea. Fujian Tea 2003, 2, 33–35. (In Chinese) [Google Scholar]
  44. Chen, L.; Shi, Y.X.; Sun, J.Y.; Wang, H.J.; Wang, Y.F.; Shu, Z.F.; He, W.Z.; Dong, C.W.; Xu, P. Deciphering the flavor profile and seasonal variation of black tea processed from cultivar ‘Baiye 1’. Food Res. Int. 2025, 208, 116181. [Google Scholar] [CrossRef] [PubMed]
  45. Huang, W.J.; Ye, Z.B.; Wu, Y.D.; Yu, T.Z.; Zhao, W.; Qi, Z.H.; Jiang, Y.Q.; Liu, Q.Y.; Lu, G.F.; Ning, J.M. Evaluation of taste quality of Keemun congou black tea during ripening and the effect of this quality on antioxidant capacity and in vitro inhibition of α-amylase and α-glucosidase. Food Chem. X 2025, 26, 102264. [Google Scholar] [CrossRef] [PubMed]
  46. Wu, Z.; Jiao, Y.; Jiang, X.; Li, C.; Sun, W.; Chen, Y.; Yu, Z.; Ni, D. Effects of Sun Withering Degree on Black Tea Quality Revealed via Non-Targeted Metabolomics. Foods 2023, 12, 2430. [Google Scholar] [CrossRef] [PubMed]
  47. Zhou, H.C.; Yang, J.H.; Liu, Y.Q.; Wang, H.; Xu, Y.J.; Huang, J.Q.; Lei, P.D. Analysis of the Contribution of Stems and Leaves to the Quality of Keemun Black Tea. Food Sci. 2023, 44, 220–228. [Google Scholar]
  48. Wu, Q.Y.; Zhou, Z.W.; Zhang, Y.N.; Huang, H.Q.; Ou, X.X.; Sun, Y. Identification of key components responsible for the aromatic quality of jinmudan black tea by means of molecular sensory science. Foods 2023, 12, 1794. [Google Scholar] [CrossRef] [PubMed]
  49. Wang, X.C.; Xia, T. Secondary Metabolism of Tea Plant, 1st ed.; Science Press: Beijing, China, 2015. (In Chinese) [Google Scholar]
  50. Wan, X.C. Biochemistry of Tea; China Agriculture Press: Beijing, China, 2003. [Google Scholar]
  51. Liu, C.; Wang, C.; Zheng, T.T.; Zhao, M.M.; Gong, W.Y.; Wang, Q.M.; Yan, L.; Zhang, W.J. Characterization of key odor-active compounds in sun-dried black tea by sensory and instrumental-directed flavor analysis. Foods 2022, 11, 1740. [Google Scholar] [CrossRef] [PubMed]
  52. Chen, L.J.; Liu, Y.N.; Fan, Y.L.; Xu, T.X.; Zhang, L.; Li, J.; Yao, L.P.; Gao, Y.X. Comparative analysis of aroma component variations in Ninghong Golden Hao tea across different storage years. Mod. Food Sci. Technol. 2023, 39, 271–280. (In Chinese) [Google Scholar]
Figure 1. Sensory evaluation of different grades of TSH. (A) The appearance characteristics of four grades of TSH samples and their corresponding tea infusions prepared according to national standard evaluation methods. (B,C) Radar charts illustrating the aroma and taste attributes of the four grades of TSH samples, respectively.
Beverages 11 00111 g001
Figure 2. Abundance (mg/g, DW) of AAs detected in relation to different grades of TSH. The heatmap displays the content of amino acids measured in four grades of TSH samples across three replicates. On the left side of the heatmap, clustering analysis of amino acids among samples was performed using the neighbor-joining (NJ) method, revealing three distinct clusters. On the right side, the analysis is based on fold change (FC) and p-values between different grades of TSH samples (1 vs. 0, 2 vs. 0, and 3 vs. 0). Larger circles indicate higher LOG2FC values, while darker colors represent larger p-values.
Beverages 11 00111 g002
Figure 3. Comparison of volatile compounds in TSH. (A) Proportion chart of volatile compounds of different grades of TSH; (B) PLS-DA score plots of different grades of TSH, PC1: principal component 1; PC2: principal component. (C) S-plot of different grades of TSH. S-plot is often used in PLS—DA to find bio-markers based on VIP value. The red dot indicates a VIP value of the volatile compound more than 1.0 (or equal to), and the green indicates a VIP value of volatile compound less than 1.0. (D) Heatmap of differential volatile compounds (VIP > 1).
Beverages 11 00111 g003
Figure 4. Pearson correlation coefficient of non-volatile and volatile compounds with TSH grade and sensory factors. (A) Network analysis diagram illustrating correlations between grade attributes and non-volatile/volatile compounds in TSH. (B) Network analysis diagram showing correlations between grade-related sensory aroma attributes and non-volatile/volatile compounds in TSH. (C) Network analysis diagram displaying correlations between grade-related sensory taste attributes and non-volatile/volatile compounds in TSH. Note: SWEET(A) represents sweet aroma attributes, while SWEET(T) denotes sweet taste attributes in the tea infusion. The absolute value of the correlation coefficient threshold was set at >0.9800 (p < 0.01). Larger circles for attribute indicators represent a greater number of highly correlated metabolites. The thickness of connecting lines between attributes and metabolites is proportional to the absolute value of the correlation coefficient, indicating stronger correlations. Solid lines represent positive correlations, while dashed lines indicate negative correlations.
Beverages 11 00111 g004
Table 1. Abundance (mg/g, DW) of catechin and caffeine in relation to different grades of TSH.
Compound/mg/gTSH-0TSH-1TSH-2TSH-3
EGCG56.60 ± 4.01 a47.81 ± 1.13 b50.28 ± 1.07 b 49.99 ± 0.80 b
ECG84.30 ± 5.09 a68.56 ± 2.13 b64.60 ± 3.76 b58.14 ± 2.45 c
C11.12 ± 0.66 a10.95 ± 0.25 a10.82 ± 0.28 a10.52 ± 0.40 a
EC8.47 ± 0.42 a8.06 ± 0.50 a8.39 ± 0.69 a7.60 ± 0.76 a
EGC3.49 ± 0.20 b3.94 ± 0.55 b5.97 ± 0.65 a6.57 ± 0.36 a
Caffeine27.90 ± 1.45 a28.32 ± 1.62 a25.38 ± 0.63 a28.07 ± 0.69 a
Note: Different lowercase letters (a, b, and c) represent significant differences at p < 0.05.
Table 2. Concentration of 45 key volatile compounds in different grades of TSH.
NoCompoundsRI Nist_RIClassOdor DescriptionRelative Mean Content (μg/g)
TSH-0TSH-1TSH-2TSH-3
V4Hexenoic acid964995.61AcidsFruity, fat0.0194 ± 0.00070.0191 ± 0.00240.0152 ± 0.00060.0108 ± 0.0011
V5(Aminooxy)-acetic acid8951015.83AcidsVinegar0.0736 ± 0.00390.0649 ± 0.00570.0534 ± 0.00260.0511 ± 0.0093
V10(3R,6S)-2,2,6-Trimethyl-6-vinyltetrahydro-2H-pyran-3-ol12551174.86AlcoholsCitrus, green0.4491 ± 0.00480.375 ± 0.01110.3396 ± 0.00170.2897 ± 0.0132
V11α-Terpineol11431193.42AlcoholsPine, iris, teil0.0325 ± 0.0010.0281 ± 0.00140.025 ± 0.00030.0227 ± 0.0012
V152,6-Cyclooctadien-1-ol11121069.81Alcohols0.0056 ± 0.00010.0053 ± 0.00020.0045 ± 0.00050.0041 ± 0.0003
V262-Chloro-(E)-cyclopentanol954864.30Alcohols0.0091 ± 0.00010.0084 ± 0.00040.0048 ± 0.00030.0045 ± 0.0006
V29Phenylethyl alcohol 60 μg/kg11361113.84AlcoholsFruity, rose, sweet, 1.1668 ± 0.00961.0623 ± 0.05290.879 ± 0.02030.8041 ± 0.069
V39α-Ethylidene-benzeneacetaldehyde12651275.90Aldehydes0.0301 ± 0.00150.0278 ± 0.00150.0175 ± 0.00040.0174 ± 0.0016
V404-(1,1-Dimethylethyl)-benzenepropanal15081218.47AldehydesFlowery0.0056 ± 0.00020.0046 ± 0.00010.0042 ± 0.00010.0036 ± 0.0001
V561-Ethyl-4-methoxy-benzene10821089.60Aromatics0.0286 ± 0.00090.0267 ± 0.0010.0222 ± 0.00020.0191 ± 0.0043
V584-Ethenyl-1,2-dimethyl-benzene11101090.17AromaticsAromatic0.0097 ± 0.00030.0085 ± 0.00020.008 ± 0.00020.0066 ± 0.0007
V59Butoxy-benzene11681221.64Aromatics0.0038 ± 0.00010.0029 ± 0.00010.0027 ± 0.00010.0022 ± 0.0001
V60Butylated hydroxytoluene16681517.22Aromatics0.0528 ± 0.00440.0363 ± 0.00240.0336 ± 0.00250.0323 ± 0.0034
V62Naphthalene12311187.97AromaticsPungent, dry, tarry0.0766 ± 0.00120.0741 ± 0.00210.0621 ± 0.00230.0521 ± 0.0022
V68Toluene794751.23AromaticsSweet0.0078 ± 0.00020.0076 ± 0.00010.006 ± 0.00030.0059 ± 0.0003
V701,3-oxazole-4-carboxylic acid, 4,5-dihydro-5-(1-methylethyl)-, ethyl ester12321375.78Esters0.0046 ± 0.00010.0038 ± 0.00040.0033 ± 0.00050.0028 ± 0.0003
V721H-Indene-1-methanol, acetate14561336.18EstersAromatic0.0023 ± 0.00020.0016 ± 0.00010.0012 ± 0.00040.0011 ± 0.0001
V74(E,Z)-2-Butenoic acid, 3-hexenyl ester11991234.46EstersGreen, fruity0.0066 ± 0.00040.0057 ± 0.00030.0042 ± 0.00040.003 ± 0.0004
V752-Cyclohexyl-1,3-dioxolane-4,5-dicarboxylic acid, dimethyl ester18551517.70Esters0.002 ± 0.00010.0015 ± 0.00010.0014 ± 0.00010.0011 ± 0.0004
V762-Ethylbutyric acid, tetrahydrofurfuryl ester13491349.75Esters0.0022 ± 0.00020.0016 ± 0.00010.0015 ± 0.00010.0014 ± 0.0001
V802-propenoic acid, 2-methyl-, 4-formylphenyl ester15281389.34Esters0.013 ± 0.0010.0095 ± 0.00080.0076 ± 0.00010.0072 ± 0.001
V81(Z)-3-Hexen-1-ol, formate989852.53EstersGreen, waxy, fresh, fruity0.0524 ± 0.00250.0505 ± 0.00190.0459 ± 0.00180.0322 ± 0.0003
V82(Z)-3-Hexen-1-ol, propanoate10911231.66EstersGreen, fresh, fruity0.0205 ± 0.00010.019 ± 0.0010.0154 ± 0.00020.0099 ± 0.0014
V855-Methyl-2-(1-methylethenyl)-4-hexen-1-ol, acetate12701382.98EstersFresh, green0.0346 ± 0.0030.026 ± 0.00210.021 ± 0.00150.0202 ± 0.0018
V91Carbonic acid, monoamide, N-(2-pentyl)-N-hexyl-, ethyl ester15651551.98Esters0.0083 ± 0.00090.0063 ± 0.00050.0051 ± 0.00030.0042 ± 0.0004
V92(Z)-3-Hexenyl iso-butyrate11261185.29EstersGreen, sweet, fruity0.0149 ± 0.00030.0125 ± 0.00060.0117 ± 0.00040.0047 ± 0.0009
V94Diisobutyl dimethylpyrophosphonate-1229.71Esters0.0028 ± 0.00010.0028 ± 0.00010.002 ± 0.00020.0019 ± 0.0001
V97Ethyl 6-methylpyridine-2-carboxylate12671036.78Esters0.0716 ± 0.00280.0568 ± 0.00240.0449 ± 0.00250.0284 ± 0.0024
V100(Z)-Hexanoic acid, 3-hexenyl ester13891380.72EstersGreen, natural, cognac, herbal0.0707 ± 0.00530.0534 ± 0.0050.0483 ± 0.00160.0241 ± 0.0052
V101Hexanoic acid, methyl ester884923.30EstersCabbage, rubbery0.0064 ± 0.00030.0054 ± 0.00020.0049 ± 0.00010.004 ± 0.0001
V105Methyl 5-methyl-4H-1,2,3-triazole-4-carboxylate-1403.21EstersHerbal, floral0.0147 ± 0.00160.009 ± 0.00080.0076 ± 0.00030.0038 ± 0.0007
V106Methyl salicylate12811197.72EstersMint, green2.2248 ± 0.02531.8931 ± 0.06381.6134 ± 0.04761.2785 ± 0.1079
V1081,6-Dimethyl-4-(1-methylethyl)-naphthalene17061688.29EstersAromatic0.009 ± 0.00090.0068 ± 0.00050.0051 ± 0.00010.0049 ± 0.0005
V110Phosphoric acid, diundecyl ethyl ester-985.60EstersSweet, fruity tropical0.0025 ± 0.00010.0021 ± 0.00010.0017 ± 0.00010.0013 ± 0.0001
V112(E)-Geranic acid methyl ester12521324.14EstersFloral, citrus0.023 ± 0.00150.0187 ± 0.00110.0154 ± 0.00010.0139 ± 0.0012
V114Phosphoric acid, di-2-propenyl ester-1271.61EstersHerbal, floral0.0069 ± 0.00020.005 ± 0.00030.0043 ± 0.00040.0034 ± 0.0003
V1236-Hydroxy-2(1H)-pyridinone977990.49Heterocyclic compound0.0107 ± 0.00020.0107 ± 0.00040.0081 ± 0.00020.0057 ± 0.0002
V1312-Hydrazinopyridine12661092.47Heterocyclic compound0.0321 ± 0.00040.0287 ± 0.00110.0195 ± 0.0020.0194 ± 0.0008
V1331-Isopropyl-3-methyl-2-pyrazoline9571038.02Heterocyclic compound0.0036 ± 0.00010.0035 ± 0.00020.0032 ± 0.00030.0021 ± 0.0002
V1373-[4-(2-Methylpropyl)phenyl]butan-2-one15111502.51TerpenoidsAromatic0.0061 ± 0.00060.005 ± 0.00020.0035 ± 0.00010.0027 ± 0.0001
V1455-(4-Nitropyrazol-1-yl)-2H-1,2,3,4-tetrazole-1530.14Heterocyclic compound0.003 ± 0.00030.0024 ± 0.00010.0018 ± 0.00010.0016 ± 0.0002
V155N-(2-Methylpropionyl)-cyclobutylamine11751344.88Heterocyclic compound0.0089 ± 0.00060.007 ± 0.00010.0064 ± 0.00050.0059 ± 0.0003
V160N-(3-Ethylpentyn-3-yl)pyrrolidine12221142.44Heterocyclic compoundBread0.0029 ± 0.00020.0022 ± 0.00010.0018 ± 0.00010.0011 ± 0.0001
V1622,2-Dimethyl-oxazolidine869991.04Heterocyclic compound0.0052 ± 0.00020.0045 ± 0.00020.0033 ± 0.00020.0023 ± 0.0003
V712-Hexyl-1H-benzimidazole18581516.65Heterocyclic compound0.0062 ± 0.00040.0037 ± 0.00030.0036 ± 0.00010.0036 ± 0.0004
V1702,6,10-Trimethyltridecane14191461.07Hydrocarbons0.034 ± 0.00160.0261 ± 0.00140.0256 ± 0.00110.0238 ± 0.0011
V1772,6,10-Trimethyl-dodecane13201569.65Hydrocarbons0.0054 ± 0.00060.0032 ± 0.00020.0029 ± 0.00030.0029 ± 0.0003
V1812,6,11,15-Tetramethyl-hexadecane17531495.67Hydrocarbons0.0485 ± 0.00290.0366 ± 0.00070.0346 ± 0.00140.0327 ± 0.0034
V183Tetradecane14131398.52HydrocarbonsWaxy0.0356 ± 0.00190.0249 ± 0.00090.0223 ± 0.0010.0215 ± 0.0009
V2062,2-Dimethylnon-5-en-3-one11741236.57Ketone0.0095 ± 0.00010.0089 ± 0.00050.0075 ± 0.00020.0062 ± 0.0001
V208(Z)-2-Cyclopenten-1-one, 3-methyl-2-(2-pentenyl)-13381403.78KetoneStrong, caramel0.0202 ± 0.00240.0126 ± 0.00110.0107 ± 0.00030.0054 ± 0.0013
V2133-Isopropylidene-tricyclo[4.3.1.1(2,5)]undecan-10-one14321389.83Ketone0.0047 ± 0.00020.0031 ± 0.00010.0029 ± 0.00020.0025 ± 0.0006
V2186-Methyl-5-hepten-2-one938986.31KetoneHerbal, green, citrus, musty, lemon grass0.0475 ± 0.00240.045 ± 0.00160.0438 ± 0.00110.0338 ± 0.0009
V2221-(5-Methyl-1-phenyl-1H-pyrazol-4-yl)-ethanone17031634.98Ketone0.0026 ± 0.00040.0018 ± 0.00020.0012 ± 0.00010.0011 ± 0.0002
V232N-Methyl-mercaptoacetamide1023888.73Nitrogen compounds0.015 ± 0.00080.013 ± 0.00010.0118 ± 0.00070.0102 ± 0.0004
V238(1S,4S,4aS)-1-Isopropyl-4,7-dimethyl-1,2,3,4,4a,5-hexahydronaphthalene14401355.45Terpenoids0.0118 ± 0.00080.0101 ± 0.00040.0082 ± 0.00020.0058 ± 0.0005
V239α-Calacorene15471552.33TerpenoidsWoody0.0409 ± 0.00420.0289 ± 0.0020.0239 ± 0.00020.0194 ± 0.0016
V242β-Myrcene958990.42TerpenoidsFruity, tropical0.2159 ± 0.00530.1693 ± 0.00480.1442 ± 0.00490.0967 ± 0.008
V243β-Ocimene9761047.41TerpenoidsApple, pear, fruity0.0956 ± 0.00310.0818 ± 0.00330.0665 ± 0.00260.0431 ± 0.0027
V2451-Methyl-4-(1-methylethyl)-1,3-cyclohexadiene9981016.24TerpenoidsLemon, citrus0.0171 ± 0.00070.0137 ± 0.00050.0123 ± 0.00050.0094 ± 0.0012
V249(E)-2,6-Octadienal, 3,7-dimethyl-11741271.32TerpenoidsFloral, rose, soapy, citrus, dewy, pear0.0362 ± 0.00240.0283 ± 0.00210.0224 ± 0.00130.0152 ± 0.0034
V2522-Methylene-4,8,8-trimethyl-4-vinyl-bicyclo[5.2.0]nonane14071429.69Terpenoids0.0092 ± 0.0010.006 ± 0.00040.0052 ± 0.00010.0044 ± 0.0018
V253Geraniol 4012281254.08TerpenoidsSweet, floral, fruity, rose, waxy, citrus2.1867 ± 0.12331.6762 ± 0.11791.4309 ± 0.03841.0119 ± 0.0831
V254Linalool 1010821099.12TerpenoidsFlowery0.8175 ± 0.00290.7165 ± 0.02280.7009 ± 0.00050.5576 ± 0.1032
V2551,2,3,4,4a,7-Hexahydro-1,6-dimethyl-4-(1-methylethyl)-naphthalene14401642.98Terpenoids0.0031 ± 0.00030.0027 ± 0.00020.002 ± 0.00010.0014 ± 0.0004
V2561,2,3,5,6,8a-Hexahydro-4,7-dimethyl-1-(1-methylethyl)-, (1S-Z)-naphthalene14691530.75TerpenoidsThyme, herbal, woody, dry0.0364 ± 0.00330.0259 ± 0.0010.0203 ± 0.00060.0141 ± 0.0009
V258(E)-Calamenene15371531.55TerpenoidsVanilla0.0702 ± 0.00590.0551 ± 0.00250.0406 ± 0.00080.0305 ± 0.0042
Note: RI refers to the Retention Index, which is used for qualitative analysis of compounds in gas chromatography to determine the type of compound by comparing its retention behavior with that of standard substances. Nist_RI refers to the “National Institute of Standards and Technology (NIST) Retention Index,” which is used for qualitative confirmation of compounds in gas chromatography-mass spectrometry (GC-MS) analysis. Relative Mean Content (μg/g) refers to the relative average content (micrograms per gram), indicating the content level of volatile compounds in tea. The data are presented as the mean ± standard deviation (mean ± SD) of three repeated experiments.
Disclaimer/Publisher’s Note: The statements, opinions and data contained in all publications are solely those of the individual author(s) and contributor(s) and not of MDPI and/or the editor(s). MDPI and/or the editor(s) disclaim responsibility for any injury to people or property resulting from any ideas, methods, instructions or products referred to in the content.

