Article

Construction of Sensory Wheel for Grape Marc Spirits by Integration of UFP, CATA, and RATA Methods

by
Evangelia Anastasia Tsapou
,
Panagiotis Ignatiou
,
Michaela Zampoura
and
Elisabeth Koussissi
*
Department of Wine, Vine and Beverage Sciences, University of West Attica, Agiou Spyridonos, 12243 Egaleo, Greece
*
Author to whom correspondence should be addressed.
Beverages 2025, 11(4), 101; https://doi.org/10.3390/beverages11040101
Submission received: 14 May 2025 / Revised: 24 June 2025 / Accepted: 26 June 2025 / Published: 3 July 2025

Abstract

Grape marc spirits represent a significant category within the alcoholic beverage sector, particularly across Mediterranean Europe. This study aimed to construct a sensory flavor wheel—covering aroma, taste, and mouthfeel modalities—specifically for non-flavored and non-wood-aged grape marc distillates. To achieve this, we explored the feasibility of a novel methodological approach combining three rapid sensory techniques: Ultra Flash Profiling (UFP), Check-All-That-Apply (CATA), and Rate-All-That-Apply (RATA). Forty-five (45) samples from Greece, Cyprus, and Italy were evaluated by a trained panel of 12 assessors. UFP generated 205 initial descriptors, which were refined to 59 for CATA. Despite the long attribute list, CATA data helped identify the most relevant terms for the final RATA experiment. The sequential application of these methods, along with intermediate data filtering, led to the selection of 45 key descriptors with occurrence frequencies ranging from 33.3% to 97.7%. These were organized into a comprehensive flavor wheel grouped into 12 general categories. This approach offers a flexible framework for future flavor wheel construction in other under-characterized product categories.

Graphical Abstract

1. Introduction

The solid by-product remaining after grape pressing and juice extraction in winemaking—commonly known as grape marc—is widely utilized in Mediterranean Europe for crafting traditional distilled alcoholic beverages. Countries such as Italy, Spain, France, Greece, and Cyprus collectively generate around 10 million tons of this by-product annually, which is then repurposed for spirit production, adding economic value to the winemaking process [1,2,3]. Those grape marc spirits, recognized under different names depending on their country of origin—like Grappa in Italy, Orujo in Spain, Eau de vie de marc in France, and Zivania in Cyprus—are integral to the cultural identity of their regions [4,5,6]. Despite their significance, sensory research on those spirits remains relatively limited, with only a few studies exploring their characteristics.
Sensory lexicons are standardized systems of collection of the sensory vocabulary relevant to a product category created using various sensory methods. Those serve as reference lists for describing various products, including beverages like wine, beer, spirits, and coffee [7,8,9,10]. Over time, specific descriptive lexicons have been created for beer [11], wine [12,13], whisky [14], and other alcoholic beverages, such as brandy [15] and rosé port wines [16]. Those lexicons help qualitatively differentiate products based on specific attributes, while, for the quantitative aspect, one could focus on the intensity of those. Sensory lexicons for food and beverages are often organized into flavor wheels, which serve as a tool for descriptive terminology to characterize a product’s attributes. Such tools facilitate the harmonization of sensory terminology, enhancing clarity in communication among stakeholders such as producers, traders, and consumers when describing product attributes [1,17].
Most sensory professionals use descriptive analyses by trained sensory panels in order to develop such lexicons. On highly alcoholic beverages specifically, there are few works in which sensory lexicons have been developed using descriptive analyses. In the research by Donnell and co-workers (2007) [18], for example, a sensory lexicon for the olfactory assessment of distilled spirits was developed using descriptive analysis, in which 16 assessors initially generated a list of over 100 odor attributes, which was further reduced to a final list of 20 descriptors. Key sensory attributes included terms like alcohol strength, aniseed, fruity, aromatic spices, and woody. In that study, Principal Component Analysis (PCA) and Analysis of Variance (ANOVA) were used to assess the panel’s ability to discriminate between samples, and, throughout three sessions, the panel showed significant improvement in their ability to describe and differentiate between the odors of eight colorless distilled beverages, such as vodka, gin, and tequila. The study demonstrated how dynamic sensory learning occurs during vocabulary development, providing useful tools for the future sensory analysis of beverages [18].
Related to the category of grape marc distillates, there are to date two studies, to our knowledge, that have created sensory lexicons or an aromatic wheel to characterize them. Namely, first, Tsahaki and co-workers in 2010 [19] attempted to create a lexicon for ouzo and tsipouro with aniseed addition, spirits. In that study, descriptors like anise, sweet, menthol, and herbal for odor and sweet, alcoholic, and spicy for taste were included, and PCA and cluster analysis were used to highlight sensory differences between the aniseed samples assessed. Later, in the work of Darici et al. (2021) [1], a sensory lexicon and wheel for Turkish Raki products were developed, identifying 78 attributes for aroma, mouthfeel/taste, and appearance. For aroma, the attributes with the highest frequency were “fresh aniseed”, “sweet odour”, “green apple”, “suma”, and “spicy”. Descriptive sensory and Principal Component Analyses (PCA) revealed strong relationships between Raki samples and sensory terms. Both those studies, emphasizing the importance of the identification and categorization of unique sensory descriptors relevant to the flavor profiles of those spirits, were based on the aniseed-flavored version of that product category and not the spirits that result from the distillation of grape marc without any flavor addition/intervention or aging.
Moreover, and more recently, alternative methods such as rapid sensory methodologies have been used to construct sensory lexicons and flavor wheels. Namely, in the work of Silvello and coworkers (2020) [9], Ultra Flash Profiling (UFP), a method using verbal product descriptions, and Napping, a method focused on measuring similarities between products, were employed in order to construct a new barrel-aged beer flavor wheel. Similarly, a free sorting task, another method focusing on similarities and/or differences between products, was used by Spencer and coworkers (2016) [7] to design a new coffee flavor wheel. Finally, Phetxumphou and coworkers (2020) [8] developed a lexicon for Virginia hard (alcoholic) ciders with the Check-All-That-Apply (CATA) method. In that case, CATA was employed to eliminate the need for a time-consuming and costly descriptive analysis of the products by trained panels, and the rapidly developed lexicon encompassed adequate sensory attributes [8]. CATA and Rate-All-That-Apply (RATA) questions provide a flexible multiple-choice-format type of approach where respondents are given a list of words and asked to select all the terms that they find relevant [20,21].
This work was primarily aimed at constructing a sensory flavor wheel—covering aroma, taste, and mouthfeel modalities—specifically for grape marc distillates that were unaged and free from any added botanicals. To achieve this, we explored the feasibility of applying a novel methodological approach that combined three relatively rapid sensory techniques: Ultra Flash Profiling (UFP), followed by Check-All-That-Apply (CATA), and then Rate-All-That-Apply (RATA). Constructing a sensory wheel by applying a sequential combination of the above methods had a parallel aim. The latter was based on supporting the development of a preliminary sensory lexicon and identifying both the most discriminative descriptors among samples and those most frequently expressed across all of them. To our knowledge, this is the first time that rapid sensory methods such as UFP, CATA, and RATA have been systematically applied to grape marc spirits in Greece. While countries like Italy have established official bodies—such as the Istituto Nazionale Grappa—that define sensory profiles for grappa, no such formal sensory committees currently exist in Greece or Cyprus for products like tsipouro/tsikoudia or zivania. This highlights the novelty and potential value of our approach.

2. Materials and Methods

2.1. Samples

Forty-five (45) grape marc spirits were collected. Thirty-six (36) of the spirits were Tsipouro/Tsikoudia spirits from Greece, two (2) were Grappa spirits from Italy, and the remaining seven (7) were Zivania spirits from Cyprus. Samples were either sourced directly from producers or obtained through retail outlets. To preserve confidentiality, and due to the nature of this study, brand names are not disclosed. However, all samples were selected to represent a wide range of production styles and geographic origins (Table 1). None of the samples contained anise or other added spices, and none had undergone wood maturation. Samples were stored in the dark at room temperature prior to sensory evaluation.

2.2. Sample Preparation

The beverages typically contained approximately 40% alcohol by volume. To support sensory evaluation, enhance aroma perception, and reduce ethanol-induced fatigue, all spirit samples were diluted with water prior to testing, following the procedure outlined in Tsapou et al. (2024) [3]. Commercial still water was used for dilution (Zagori natural mineral water, Epirus, Greece), adjusting the final alcohol concentration of each sample to 25% v/v. After preparation, the diluted spirits were transferred into transparent glass bottles, sealed, and stored at ambient temperature (20–22 °C). The same bottled water used for dilution was also made available to panelists during the sessions for palate cleansing between samples.

2.3. Assessors

The sensory panel consisted of twelve individuals (seven women and five men) aged between 27 and 65, all affiliated with the Department of Wine, Vine, and Beverage Sciences at the University of West Attica, either as staff or postgraduate students. A total of 45 samples were evaluated using the UFP and CATA methods, while a subset of 36 samples was assessed using RATA. The evaluations were carried out across thirteen sessions covering all three methods. Prior to participation, all assessors underwent screening to confirm normal olfactory and gustatory function and had previous experience as trained panelists in both wine and beer evaluations, with a stronger background in wine, as detailed in Tsapou et al. (2024) [3]. Although no specific training on spirits or the particular spirit type used in this study was provided, assessors were already familiar with the flavor profile of these products through earlier experiments. Ethical approval was obtained from the University of West Attica’s Research Ethics Committee (ref. no. 97565). Informed consent was secured from all participants, who confirmed their understanding of this study’s confidentiality terms and their right to withdraw at any time. All tested products were safe for consumption.
The sensory evaluations were conducted in individual, neutral-colored booths under a combination of natural and artificial lighting within a temperature-controlled environment (20 ± 2 °C) compliant with ISO standards [22]. Samples were served in a randomized sequence across participants and sessions, using a partially balanced design. Each sample was identified with a unique three-digit code. Prior to evaluation, 20 mL portions of diluted samples were served at ambient temperature (18–21 °C) in ISO-standard tasting glasses, covered with plastic Petri dish lids. Participants received printed instructions for both the UFP and CATA/RATA tasks, which were also explained verbally by the experimenter. Responses were recorded on paper questionnaires. Assessors were instructed to consider all relevant sensory dimensions: orthonasal and retronasal aroma, basic tastes, mouthfeel, and aftertaste. Bottled water (identical to that used for dilution) and neutral-flavored cream crackers (Papadopoulos Cream Crackers wheat, Athens, Greece), were provided to cleanse the palate between samples. Visual attributes were excluded from the evaluation, as all samples were clear and colorless. Panelists were allowed as much time as needed to complete their assessments.

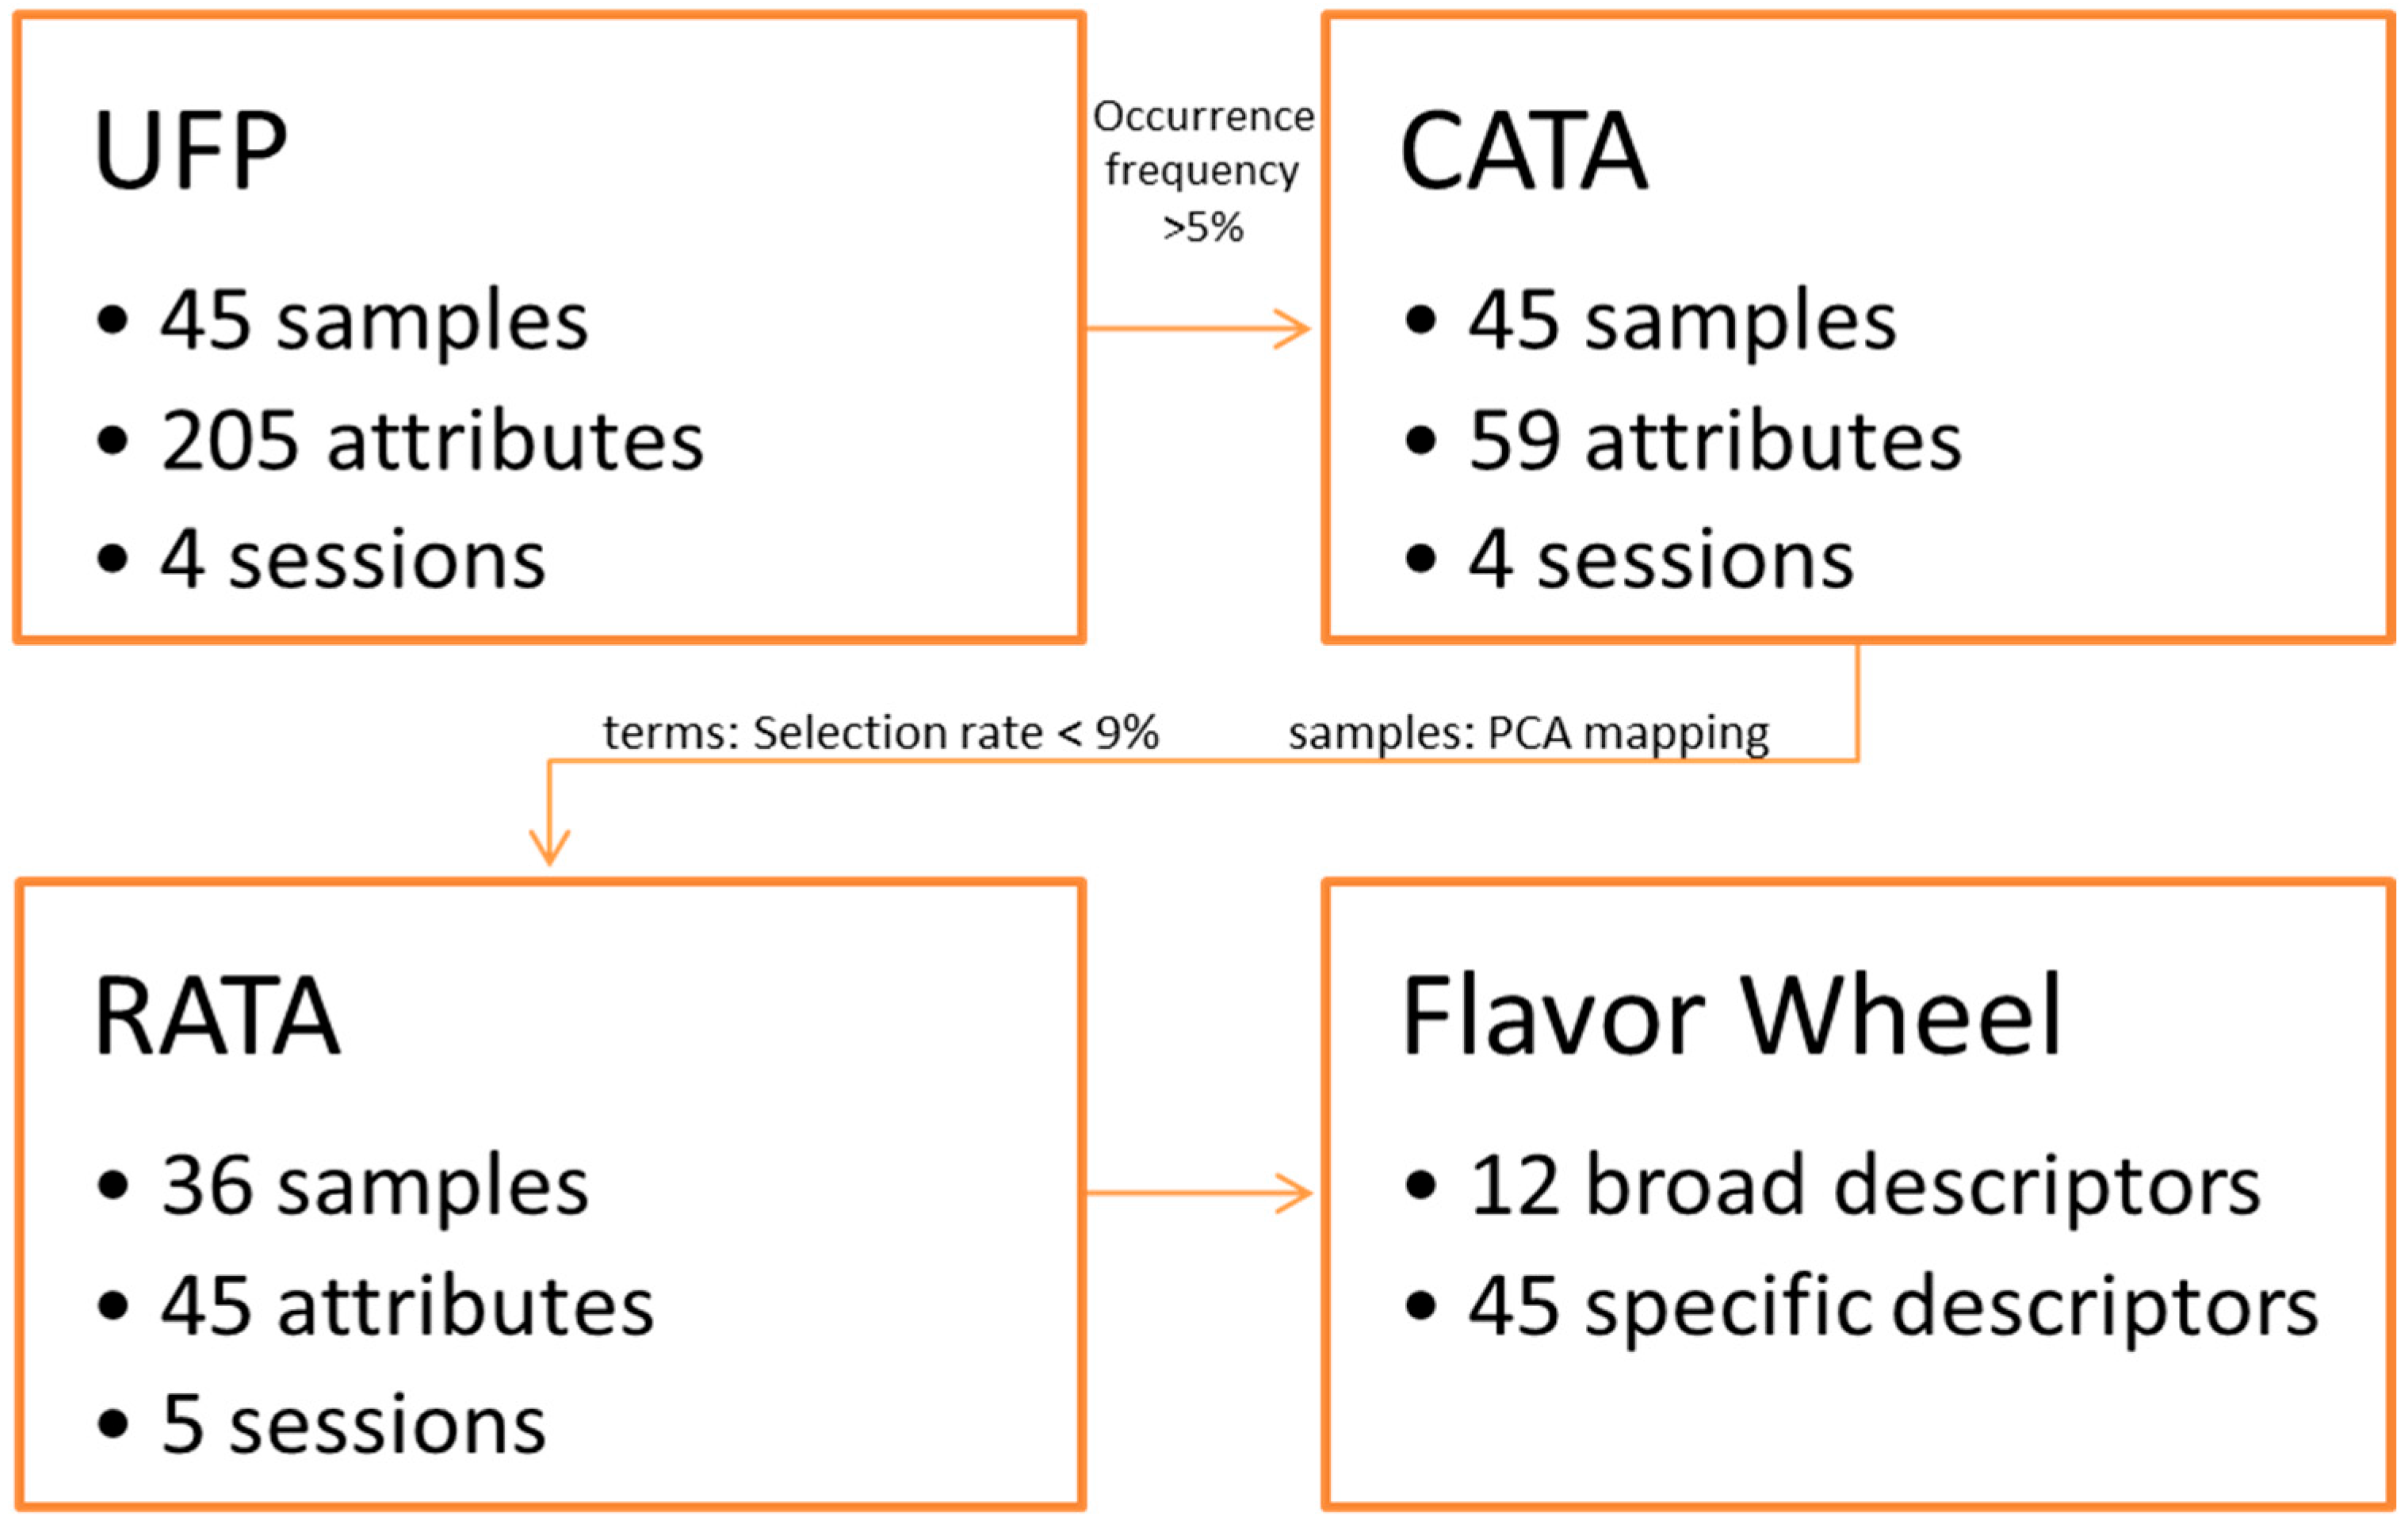
2.4. Experimental Design

This sequential combination of UFP, CATA, and RATA was designed to support the identification of both the most discriminative descriptors among samples and those most frequently expressed across all of them, thus ensuring a comprehensive and representative flavor wheel for this product category. Figure 1 is a graphical representation of the experimental design.
In the first part of our experiment, the aim was to capture all relevant flavor attributes for all forty-five (45) grape marc spirits used in this study. Therefore, four sessions of UFP [9] per assessor were carried out in order to generate the descriptors relevant to the sensory profiling of all samples. The samples were presented in a randomized order across sessions and assessors, split into three sessions of 11 spirits and one session of 12 spirits. Attributes generated after the completion of all UFP sessions, 205 words, were collected and initially listed in alphabetical order. The terms were first assessed based on their occurrence frequency, with an acceptable threshold set at over 5% [23]. Following that, the main investigators of this study grouped the remaining terms based on their semantic similarities, the literature [3], and the expertise of the researchers. Redundant terms were removed, and expressions with similar or identical meanings were consolidated.
Subsequently, the fifty-nine (59) remaining terms were collected and used in the second part of our experiment, which comprised four (4) CATA [20,24] sessions per panelist. The purpose of CATA in the second phase was to screen relevant attributes for all forty-five (45) samples, and the presentation order of the samples was randomized across sessions and assessors using. The four sessions were split into three sessions of 11 spirits and one session of 12 spirits. The terms included in the CATA part of our study, even though possibly on the high end regarding the number of CATA words used, were easy to understand for the assessors, as they were generated by the same group of assessors in the first place. According to the CATA results and specifically the percentage of counts of checked attributes and their p-values (Table 2), the terms were reduced further (selection rate below 9%) to forty-five (45) terms, including those related to aromas, basic tastes, mouthfeel, and aftertaste modalities (Table 2).
Finally, in the last part of our experiment, which was the RATA method application, the number of samples used was reduced in parallel to the number of sensory terms in order to reduce assessor fatigue per session and enhance data value. The reduction of the samples to be further used in RATA was based on a mapping according to PCA of the spirits using the terms from CATA (Figure S1). Samples were removed if, after studying the first two PCA dimensions, they appeared very similar to each other regarding their mapping based on all fifty-nine (59) attributes (Figure S1). To reduce the number of terms, we used the selection rate of each term by the assessors. The RATA experiment was run, using forty-five (45) terms (Table 2) and thirty-six (36) spirit samples (Table 1), split into five sessions (four sessions of 7 and one session of 8 spirits). This time, besides the randomization of sample presentation across sessions and assessors, the words presented in the RATA questionnaire were categorized according to their modality (aroma, basic taste, mouthfeel) in order to make the task easier for the assessors [20].

2.5. Statistical Analysis

UFP, CATA, and RATA data were analyzed separately. CATA and RATA data were analyzed according to the suggested methods from XLSTAT. Specifically for CATA, we used Cochran’s Q test, Correspondence Analysis (CA), Principal Coordinates Analysis (PCoA), and Agglomerative Hierarchical Clustering (AHC); for RATA, ANOVA and Correspondence Analysis (CA) were used, while UFP data were analyzed using PCA. Last, PCA was applied to the CATA data in order to acquire a quick mapping of the samples for the sole purpose of eliminating certain similar samples for the last experiment with RATA. All statistical analyses were conducted using XLSTAT Version 2024.3.0 (Addinsoft, 2024) [25].

3. Results

3.1. Ultra Flash Profile

Two hundred and five (205) terms were collected from all UFP sessions and panelists. A Principal Component Analysis was conducted for all terms and explained a variance of 28.83% in the first two axes (F1 23.01% and F2 5.82%) (Figure S2). The terms that stood out in F1 axes were fruity, citrus, sweet, and floral notes, as well as grassy, herbal, green wood, and cooked/canned aromas. These descriptors suggest that the initial UFP phase captured a wide range of both fresh and processed aromatic characteristics, reflecting the diversity of the grape marc distillates. However, the dispersion of terms and the relatively low explained variance indicated a high level of redundancy and overlap among descriptors. Therefore, in line with the previous literature [23,26], the terms were first evaluated based on their frequency of occurrence, with an acceptable threshold set at >5%. This filtering step eliminated 104 descriptors, leaving 101. These remaining terms were then grouped by the researchers according to their degree of similarity, reducing the list to 59 terms, which were subsequently used for the CATA evaluation (Table 2).
This process demonstrated the role of UFP as an exploratory tool that provided a broad sensory vocabulary, which was then refined to create a more structured and manageable set of descriptors. This refined list formed the foundation for the subsequent CATA and RATA evaluations, allowing for more focused and statistically robust analysis of the sensory profiles.
Table 2. Percentage of counts of checked attributes and their p-values according to Cochran’s Q test on CATA results. In bold are the attributes with important effects on explaining product differences from CATA.
Attributes%p-ValuesAttributes%p-Values
sweet45%0.405bread12%0.821
burning41%0.066nuts12%0.162
coating30%0.157spicy12%0.880
floral28%0.086medical12%0.340
bitter25%0.050salty12%0.680
citrus fruit24%0.062dill11%0.033
fruity22%0.036earthy11%0.277
eucalyptus20%0.030smoky11%0.255
fresh19%0.568grape10%0.079
grassy19%0.790rose10%0.022
anise19%0.257mint10%0.925
dried (hay, straw, tea)18%0.512pine10%0.529
white flowers18%0.200waxy10%0.581
petroleum18%0.023berries9%0.159
woody17%0.147lavender9%0.108
stone fruit17%0.232fishy9%0.005
caramel17%0.028rubbery9%0.059
ethyl acetate17%0.910dry7%0.660
vanilla16%0.509sea7%0.220
fatty16%0.579cherry7%0.256
tropical fruit16%0.588fruit jam7%0.686
honey15%0.693pool6%0.101
rough15%0.128butter6%0.893
soapy14%0.173dusty6%0.457
pipfruit (apple/pear)14%0.233soil6%0.397
canned/cooked14%0.605mushroom5%0.333
dried fruit (plum, raisin, etc.)13%0.055laurel3%0.325
orange blossom13%0.680animalic3%0.325
coffee3%0.488
oily2%0.661
acetic acid1%0.025

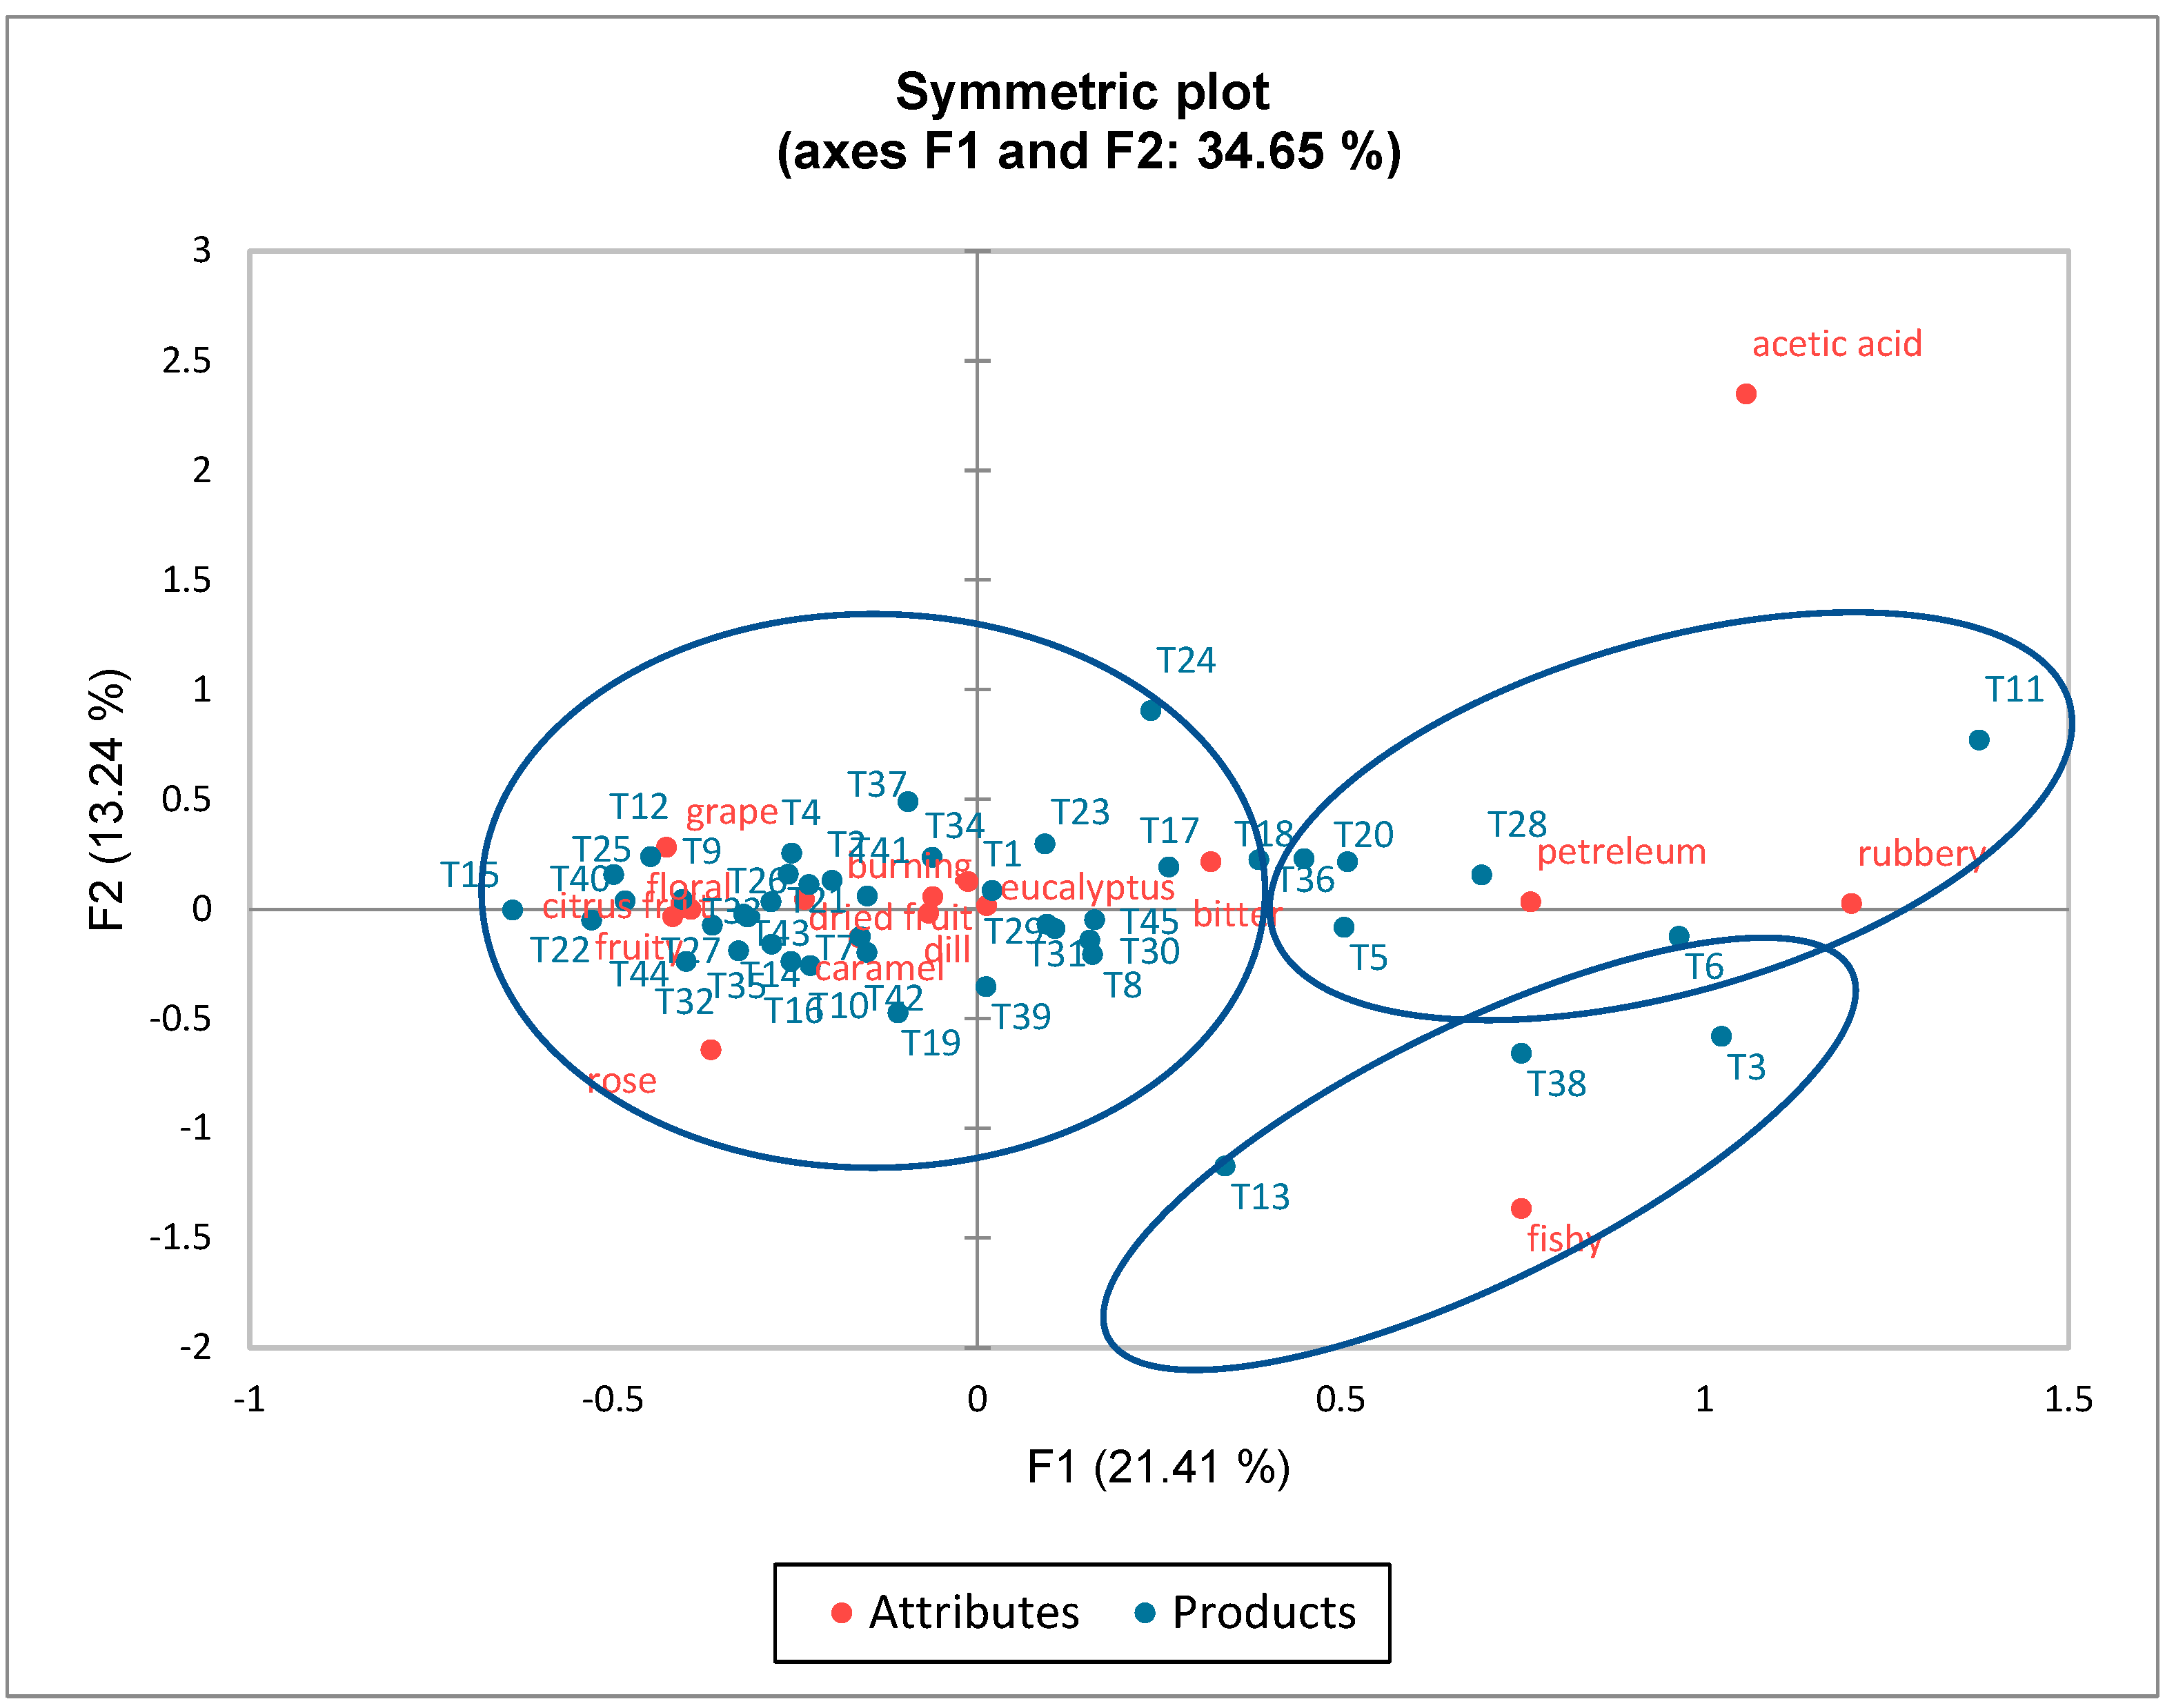
3.2. Check-All-That-Apply

Fifty-nine (59) terms were used for the CATA assessment on all forty-five (45) samples. According to the results from Cochran’s Q test, fifteen attributes had important p-values, with nine of those showing p-values < 0.05, thus explaining significant differences between the products, and six with 0.05 < p < 0.1, thus being less significant in differentiation (Table 2). Based on these observations, it is highly probable that the products differed meaningfully in terms of their sensory attributes. Correspondence Analyses (CAs) for those terms were conducted, explaining 34.65% of the variation between the products on the first two dimensions (F1 = 21.41%, F2 = 13.24%) (Figure 2). Although the Correspondence Analysis did not reveal strong separation among most samples, certain descriptors—such as fruity, floral, herbal, and caramel—appeared frequently and were positioned near the center of the plot, suggesting that they were commonly used across products. However, this did not imply clear differentiation among samples based on these attributes. In contrast, approximately 25% of the samples were differentiated primarily along the F1 axis by four descriptors typically regarded as defects: acetic acid, petroleum, rubbery, and fishy notes.
Subsequently, Principal Coordinates Analysis (PCoA) was applied to the correlation coefficients in the first two axes (F1 and F2) (Figure 3a), and Agglomerative Hierarchical Clustering (AHC) was also run on the data (Figure 3b) in order to detect the groups. To effectively visualize the various dimensions of the data, XLSTAT performed a Principal Coordinates Analysis (PCoA), applying the Lingoes correction when required. This approach was favored over traditional Multidimensional Scaling (MDS) because it automatically oriented the coordinate system so that the first axis captured the greatest amount of variance in the data. There, we observed that burning and bitter were outliers, highlighting their unique sensory impact. The clustering of rubbery, acetic acid, and fishy suggested a strong correlation, likely representing negative odors, while the pleasant descriptors (floral, fruity, and citrus fruit) were consistently clustered together, indicating shared sensory profiles (Figure 3). These groupings not only reflected meaningful sensory relationships but also provided a robust framework for distinguishing between the samples. Their emergence through multivariate analysis underscored the potential of structured sensory profiling for characterizing and differentiating spirits within this category.

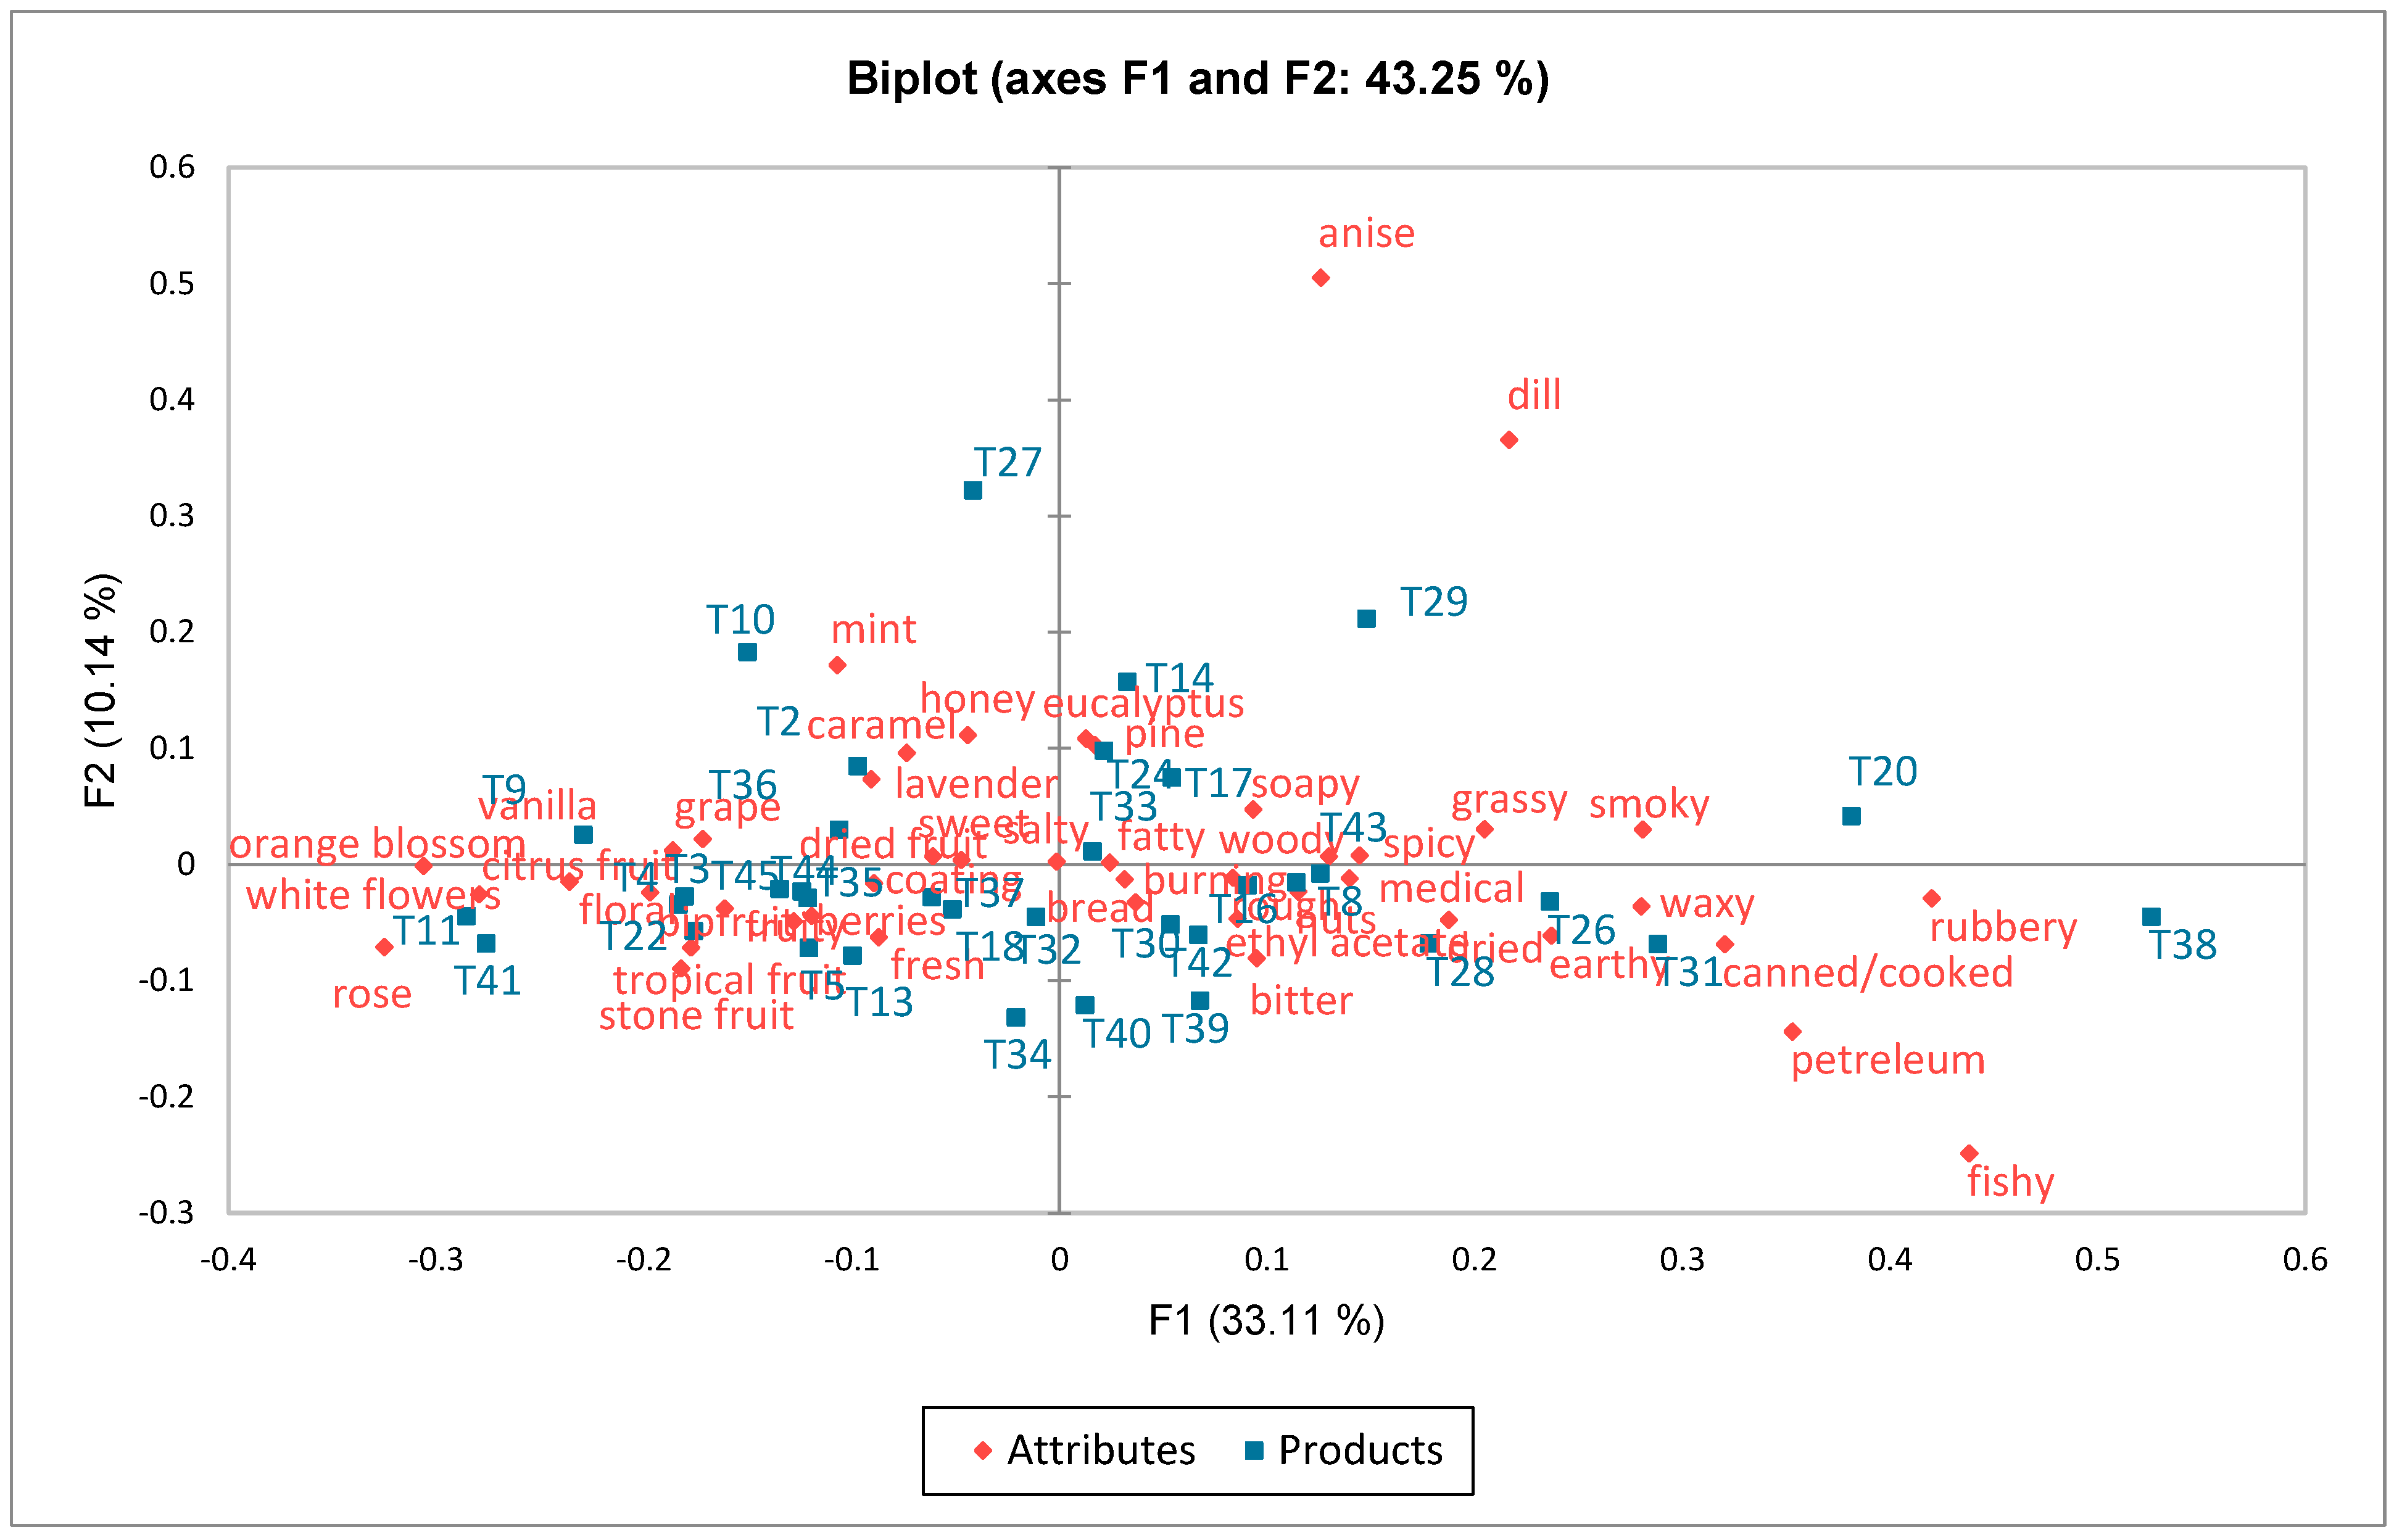
3.3. Rate-All-That-Apply
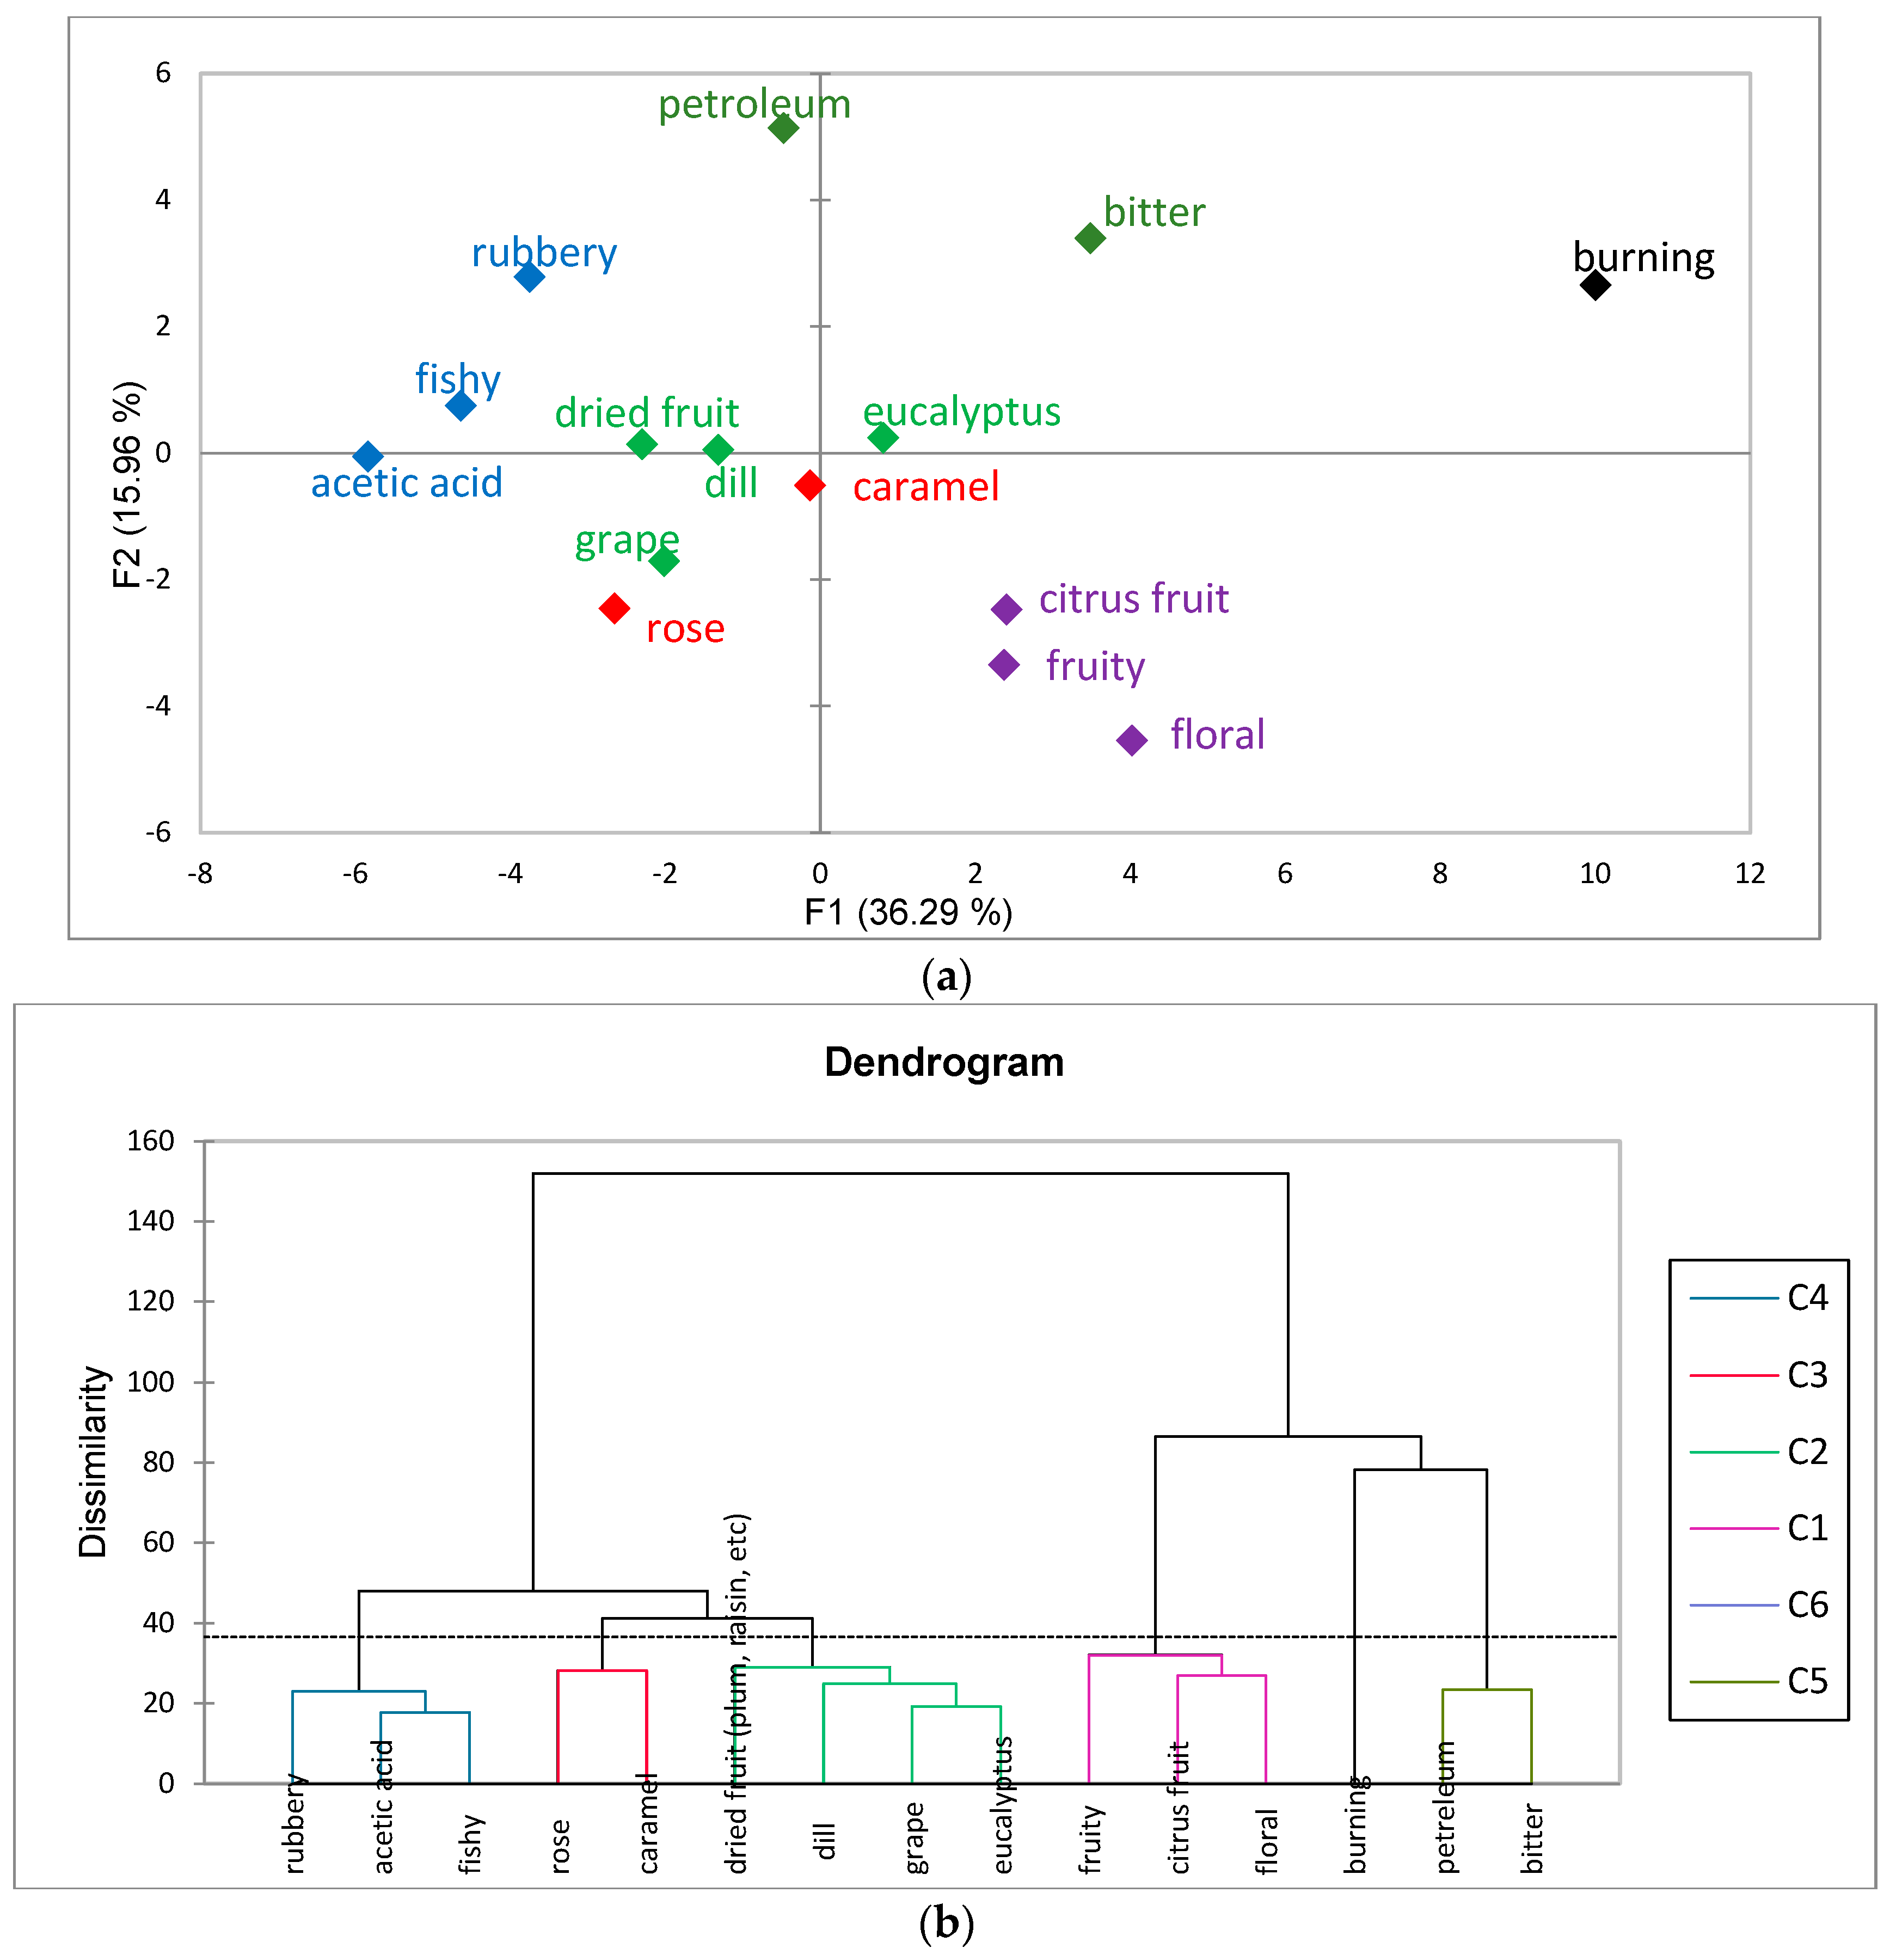
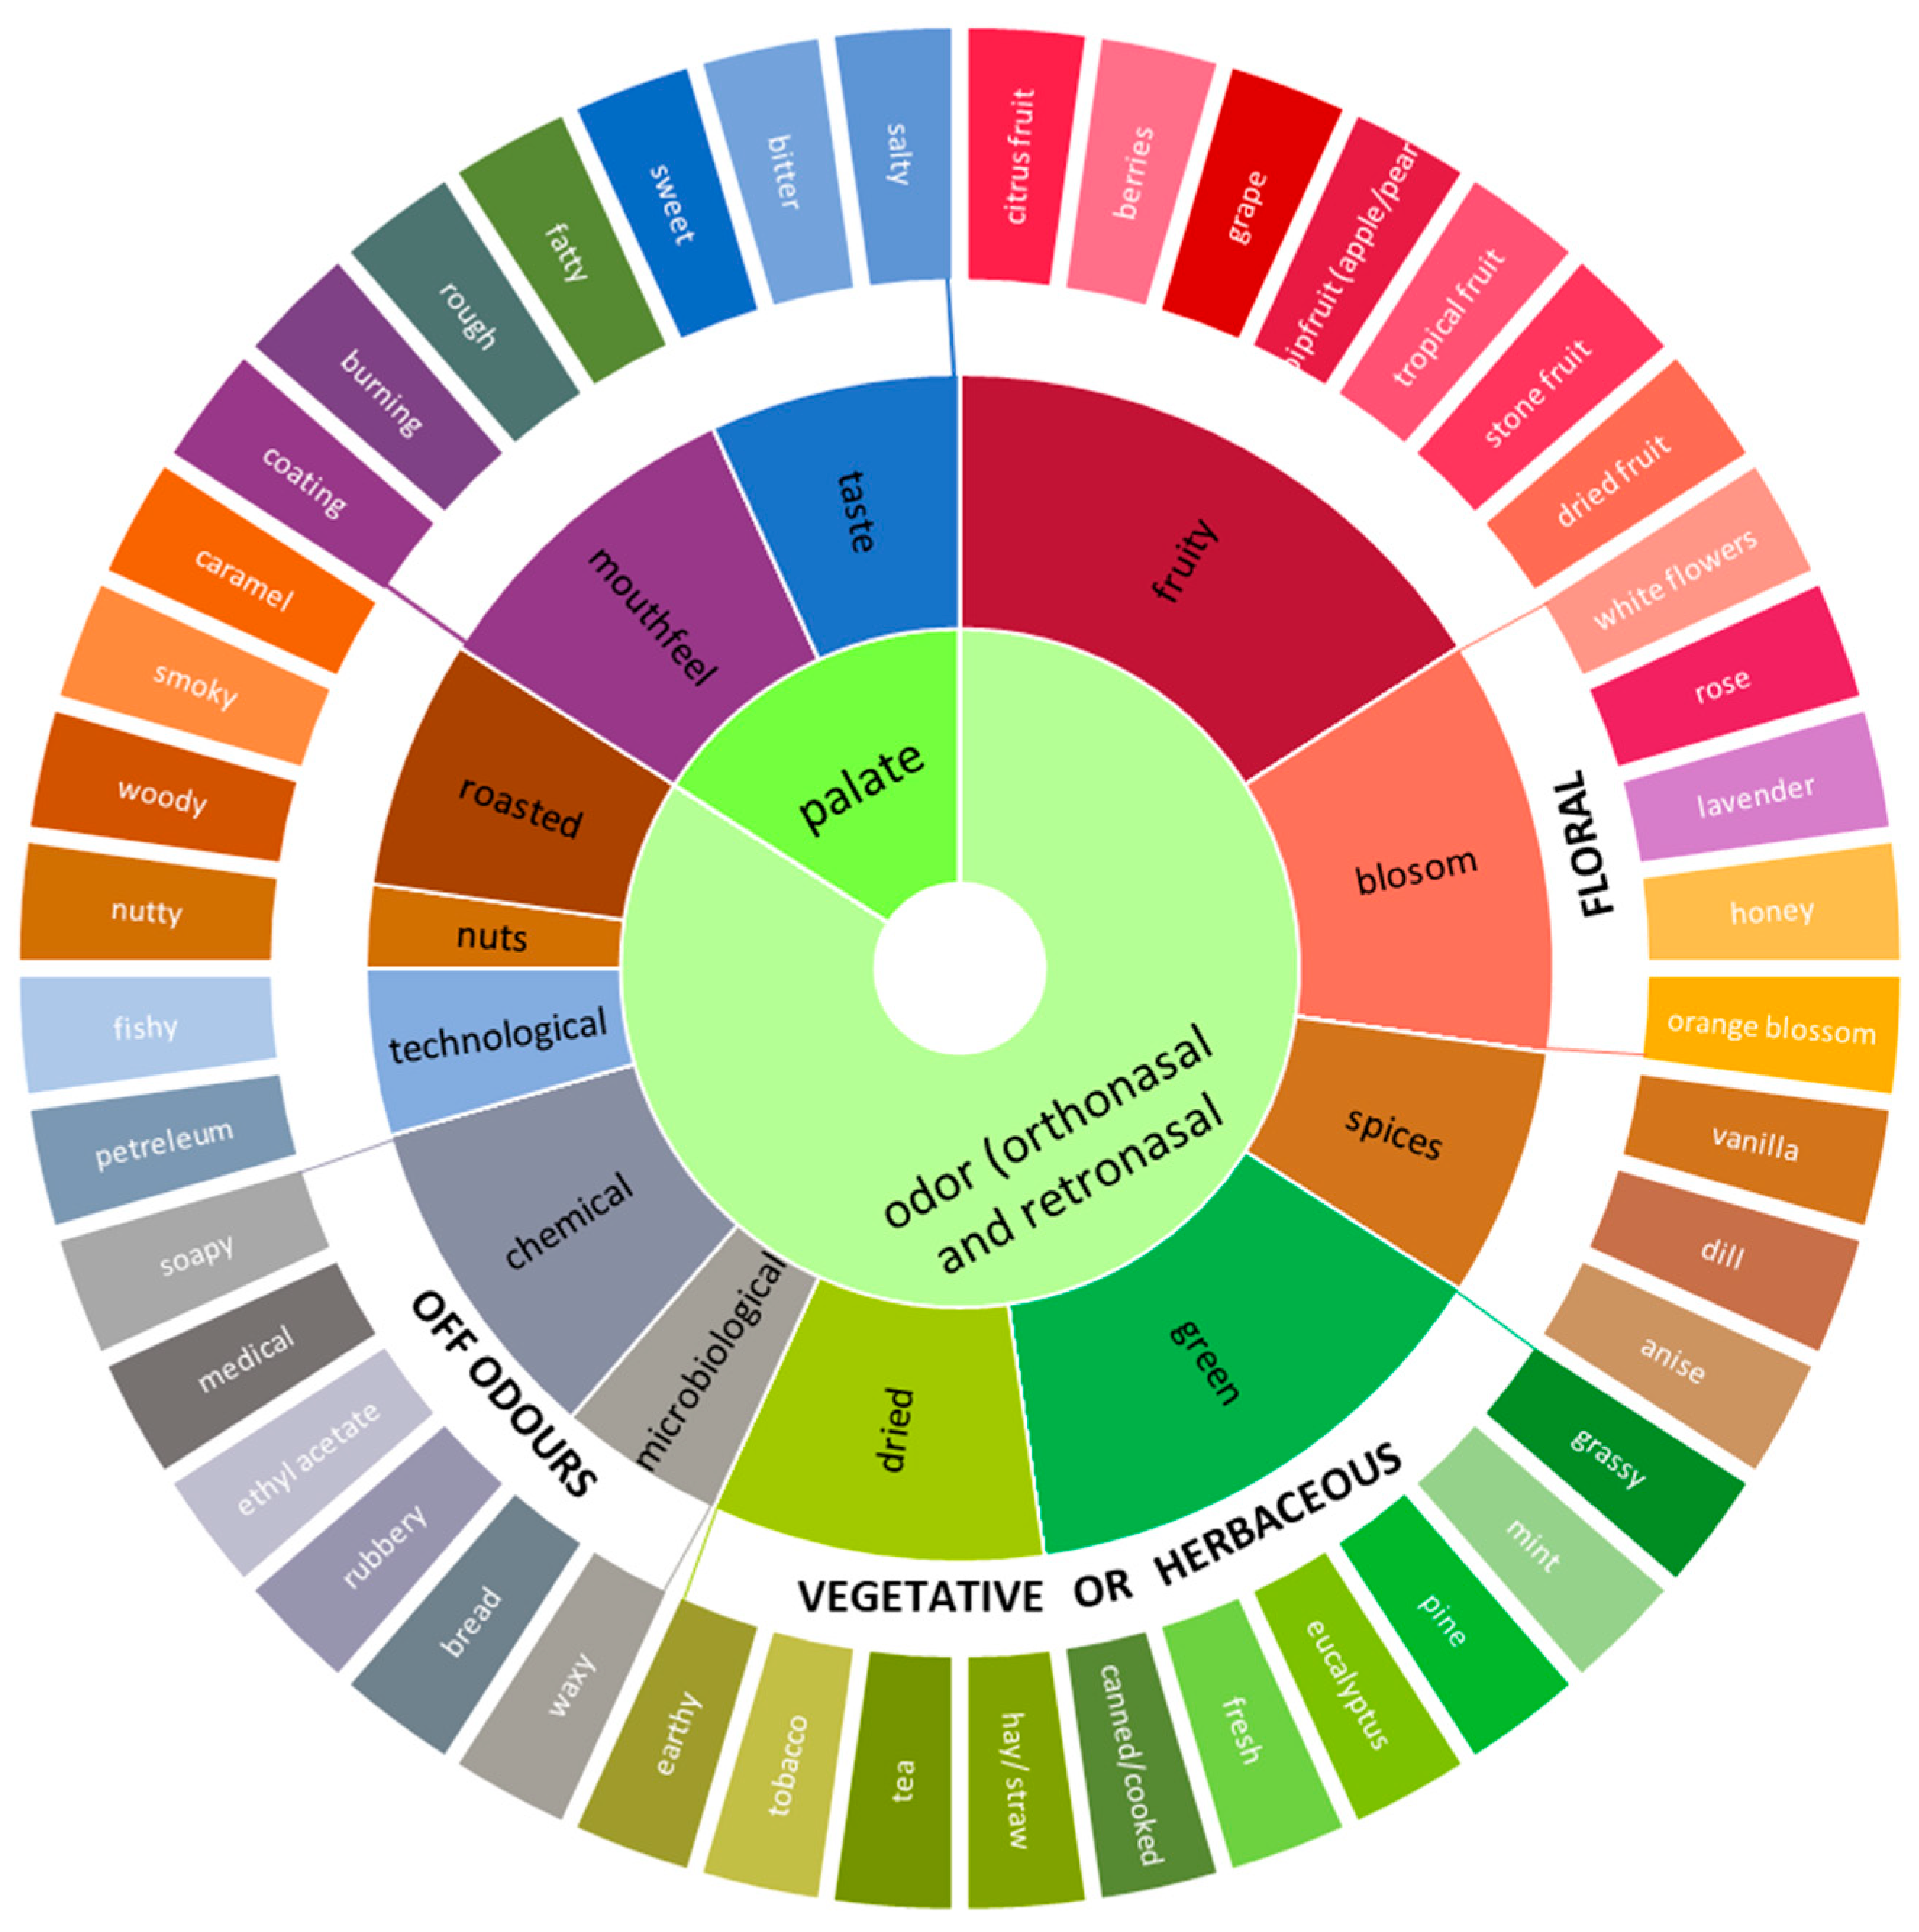
As previously described, terms with a selection rate below 9% were excluded [23,26], resulting in a refined list of 45 descriptors. This threshold was chosen to balance descriptor diversity with statistical robustness in the subsequent RATA analysis. Regarding the reduction of samples, PCA was conducted for the samples and the fifty-nine terms across the first two axes (F1: 13.08%, F2: 7.65%) (Figure S1). When observing those plots, samples that had very similar counterparts or that did not contribute any differentiation to the aromatic profile of the distillates were removed. At this stage, only the Greek grape marc spirit samples were removed, while all Grappa and Zivania samples were retained. Specifically, the following nine samples were excluded: T19, T25, T12, T15, T7, T21, T23, and T1. The remaining samples (36 out of 45) used for the RATA assessment are indicated in Table 1. A five-point applicability scale (not applicable at all, slightly applicable, moderately applicable, very applicable, and extremely applicable) was used for the RATA test. ANOVA results for the attributes showed that twenty-five (25) out of forty-five (45) attributes were significant at the 95% confidence level and, therefore, those attributes were discriminating (Table 3). Nevertheless, the primary objective here was not the categorization of the samples but the development of a lexicon capable of accurately describing grape marc distillates. According to the CA, the first two axes explained 43.25% of the total variance in the sensory data (Figure 4). While the biplot provided a visual overview of the relationships between products and attributes, the moderate level of explained variance and the lack of clear sample separation limited the strength of conclusions regarding the discriminative power of specific terms. Nevertheless, several attributes—such as floral, fruity, herbal, and off-odor—appeared in proximity to multiple product points and were frequently selected by assessors across samples. To further support the identification of relevant descriptors, ANOVA results were considered (Table 3). Attributes such as citrus fruit (p = 0.001), grape (p = 0.008), fruity (p = 0.011), dill (p = 0.017), and dried (hay, straw, tea) (p = 0.009) showed statistically significant differences among products (Table 3), indicating their potential role in product discrimination. Importantly, our aim was not limited to identifying discriminative attributes but also included highlighting those most frequently perceived across the product set, as these were essential for the development of a comprehensive flavor wheel.
A comparative analysis between the CATA and RATA methods was conducted to explore the consistency and complementarity of the two sensory techniques. Figure S3 presents a scatter plot, where each point represents a sensory attribute, plotted according to its frequency of selection in CATA (% CATA) and its mean intensity rating in RATA. It is important to note that the two methods were applied to different sets of samples and involved partially different sets of sensory terms, which limits the possibility of a direct statistical comparison. However, for the overlapping attributes, the visualization reveals a general trend of agreement between the two methods. Attributes such as burning, sweet, and coating showed both high selection frequency and high intensity, and were also statistically significant (p-value < 0.05), supporting their discriminative power across samples. This analysis reinforces the robustness of the sensory profiling and highlights the value of combining CATA and RATA for complementary insights.

3.4. Flavor Wheel

The terms that were finally selected for the wheel, based on the collective results of UFP, CATA, and RATA and the respective data analyses, were organized into a flavor wheel, as shown in Figure 4. Therefore, the grape marc spirit flavor wheel that we suggest in this study is split into three tiers, with 2 first-, 12 second-, and 45 third-tier descriptors (Figure 4). The innermost tier represents two primary sensory modalities, whereas the outer tier refines these categories with more specific descriptors. This means that the primary descriptors located in the inner and second tiers represent broad, generic terms that encompass specific groups of related adjectives, whereas the more detailed attributes are positioned in the third tier. All second-tier descriptors included in this study were previously used in sensory lexicons for alcoholic beverages, chocolate, milk, and herbal products [7,9,14,15,17,23,27,28,29]. While these categories differ in product matrices, the recurrence of certain sensory terms across them supports their relevance and robustness. This cross-referencing is particularly valuable in the context of constructing a sensory wheel, where the goal is to capture a broad and representative vocabulary of perceived attributes. The descriptors included in our suggested flavor wheel are derived solely from the analysis of 45 samples representing three countries where those products are traditionally made. It is anticipated that adjustments and refinements may be necessary over time in this suggested sensory wheel, especially if adopted and utilized by the industry. It should also be clarified here that the suggested flavor wheel is recommended for flavor descriptions of any grape marc spirit originating from the Mediterranean, even though we did not include samples from Spain (Orujo) or France (Eau de Vie de Marc). It is, however, not recommended for usage for the flavor description of spirits that have undergone anise or other spice additions or any kind of aging with wood.

4. Discussion

The construction of flavor lexicons or sensory wheels has been applied to many beverages and foods, including Raki [1], Ouzo and aniseed-flavored Tsipouro [19], Pisco [30], coffee [7], rooibos tea [17], and other foods ranging from chocolate [23] to marine oils [29] and human milk [28]. The development of a sensory wheel requires a sample set that reflects diverse sources of variability and encompasses an extensive array of sensory descriptors [29]. In this study, 45 different grape marc spirit samples from three Mediterranean countries (Greece, Italy, and Cyprus) were selected to represent a wide range of those spirits (Table 1). A similar methodology was applied by Koch et al. (2012) [17], who used 69 rooibos tea samples from 64 producers. Sample selection aimed to capture variation in grape variety, region, and distillation method, ensuring a representative sensory space (Table 1).
The number of descriptors in published flavor wheels typically ranges from 40 to 80. For example, Tura et al. (2023) [26] identified 44 attributes for hemp seed oil, while Yu et al. (2022) [28] structured 53 descriptors for human milk Specifically in the work of Tura and coworkers [26], a trained sensory panel conducted an evaluation using a conventional descriptive analysis methodology to generate a sensory lexicon, which categorized 44 attributes into positive (e.g., nutty, hay, bitter) and negative (e.g., rancid, fishy) [26] descriptors, while Yu and coworkers [28] used the ISO standard [31] to organize the sensory descriptors of human milk; a hierarchical framework was applied, categorizing them into three primary sensory modalities: aroma, flavor, and mouthfeel. By performing multivariate analyses, 53 sensory descriptors were identified, narrowed down through statistical screening based on significance (M-values), thereby constructing a three-tiered flavor wheel with specific layers for aroma, flavor, and texture nuances [28]. Finally, in the work of Darici et al. (2021) [1], 76 specific attributes were identified for Raki spirits, including 8 terms for appearance, 55 for aroma, and 13 for taste and mouthfeel.
Most studies employing CATA questions have used lists containing between 10 and 40 terms [8,32,33]. Shorter lists may prompt consumers to select all available terms, reducing their ability to distinguish between samples. Longer attribute lists can induce heuristic decision-making, where consumers opt for initial choices rather than fully processing the sensory profile of the product [34,35]. However, research indicates that the length of the list, when between 12 and 30 terms, does not significantly impact the results [36]. The long list of attributes risk was also present in our study, as the experimental design initially included 59 terms for the CATA questions and a correspondingly large number of samples. However, first, we knew we were going to work with a trained panel of assessors rather than naïve consumers who would be able to manage more demanding sensory tasks, and, most importantly, it was part of our plan to further reduce the terms in order to employ RATA questions subsequently in our last experiment. Therefore, despite the initial complexity, our aim was to reduce both the number of terms and samples and then reassess the most significant terms using the RATA questions. Following UFP, 59 attributes were selected for CATA evaluation, forming the basis for subsequent refinement through RATA.
According to Delarue and Lawlor (2022) [37], terms included in the CATA questions should be familiar and easily understood by assessors. For this reason, we employed the UFP to generate vocabulary grounded in the assessors’ own language. The UFP method, following the free vocabulary approach as described in Free Choice Profiling (FCP) [38], allowed each judge independently to describe the most salient sensory differences among the spirits. This method was particularly suitable for our objective, as it enabled the inclusion of diverse sensory perspectives and expanded the lexicon with terms relevant across all samples. Furthermore, the incorporation of individual descriptors facilitated the integration of multiple perspectives within each evaluation. For example, one judge may prioritize taste, another may concentrate on mouthfeel properties, and a third may highlight specific aroma notes. Similar approaches have been used in the development of sensory lexicons for apple juice [39] and barrel-aged beer [9], where UFP replaced traditional Quantitative Descriptive Analysis (QDA), allowing assessors to freely describe products without formal training. In our study, the UFP results aligned with previous findings on Greek marc distillates [3], in which Greek marc distillates were similarly categorized using combined UFP with Polarized Projective Mapping, using the same flavor notes that were statistically important in the F1 axis (Figure 2). In addition, aroma, taste, and mouthfeel attributes were all important in the differentiation of the 45 products used (Table 2 and Table 3).
Alternatively, rapid methods such as single free sorting [7], UFP with Napping [9], and free sorting with CATA analysis [8] have also been utilized for coffee, barrel-aged beer, and Virginia hard alcoholic ciders, respectively. For example, in a study by Spencer et al. (2016) [7], participants performed a modified, non-tasting sorting task using the 99 coffee flavor attributes from the World Coffee Research (WCR) sensory lexicon. They grouped the flavor attributes based on perceived similarities and differences, using their knowledge and experience rather than tasting samples. Other studies used 18 [8] and 4 [9] samples, respectively. In contrast, our methodology incorporated a larger number of samples, allowing for broader term generation and better category coverage. Our RATA results revealed that all selected terms had 23–97% occurrence across all samples representing the three different countries of origin (Greece, Cyprus, and Italy with tsipouro, zivania, and Grappa, respectively) (Table 4). In this way, we could ensure that the terms included in the sensory wheel had important relevance across all grape marc distillates analyzed in this study.
Existing flavor wheels across diverse products (e.g., tea, chocolate, rum) consistently employ tiered structures and 40–60 descriptors, supporting the structure adopted in our study. The rooibos tea flavor wheel in the research of Koch et al. (2012) [17], developed from a descriptive analysis of 69 samples collected across various regions and grades, reflects the complexity of this herbal tea by identifying 17 attributes (e.g., herbal–floral, woody, honey, hay). These attributes are organized into a two-tier structure, enabling the clear differentiation of high-quality tea (e.g., sweet, honey, caramel) from lower-quality batches with undesirable notes (e.g., green, hay, musty). Similarly, for chocolate, consumer-generated sensory descriptors were used for the construction of the wheel, emphasizing relevance to consumer preferences. Focus groups contributed 2.199 terms, later refined to a three-tiered wheel with 61 attributes across appearance, aroma, texture, and flavor for chocolate [23]. In contrast, the cold-pressed hemp seed oils flavor wheel in the research of Tura et al. (2023) [26] prioritized the natural complexity of the oil and its quality markers. A trained panel generated a vocabulary of 44 descriptors through descriptive analysis, grouping them into clusters such as color, aroma, flavor, and mouthfeel. This wheel also highlights both positive attributes (e.g., nutty, herbal) and defects (e.g., rancid, fishy) [26]. In another approach, a flavor wheel for rum was created using web-based material instead of traditional sensory panels, highlighting the diversity of this alcoholic beverage category. By analyzing over 1000 reviews, the developers categorized 147 sensory terms into 22 categories, such as fruity, woody, and sweet. For the construction of the brandy aroma wheel, as detailed in the paper by Jolly and Hattingh (2001) [15], a standardization of the descriptive terminology took place, and a list of 61 descriptors was compiled from the existing literature and expert consultations. The wheel was refined through industry feedback and expert panel evaluations and the final version includes 18 first-tier attributes and 75 second-tier attributes, providing a detailed standardized vocabulary for brandy aroma evaluation. According to the literature, all wheels employ a tiered structure, typically progressing from broad sensory modalities (e.g., aroma, taste, mouthfeel) to specific descriptors. It is observed that in almost all the mentioned studies, the sensory wheels consisted of three levels, and the number of terms used ranged from approximately 40 to 60.
The final wheel included two sensory modalities, 12 intermediate categories, and 44 specific descriptors derived from RATA. Specifically, the third tier encompassed all terms utilized in RATA analyses, whereas the first tier clearly grouped terms based on their modality. The second tier included groups categorized by modality, such as mouthfeel and taste, as well as groups with highly similar descriptions, like the fruity group. The organization of certain groups was also conducted by considering existing flavor wheels of other high-alcohol-containing beverages: spirits [1,14,19,27]. It is important to note that the samples were non-aged; however, there were terms that could be classified as aging aromas, such as honey, vanilla, and caramel. For those notes, the positioning of the terms was evaluated based on the tasters’ assessments. For instance, the honey note was predominantly used in samples that also contained other floral aromas, while the vanilla note was mainly associated with spicy notes. A comparison of sensory attributes with the previously mentioned aromatic wheels is challenging as even when limited to those of alcoholic beverages (e.g., brandy, rum), those products undergo an additional production step—aging—during which tertiary aromas develop, which were absent in our samples.
To our knowledge, there are to date no published flavor wheels on non-aniseed flavored grape marc spirits, apart from a work performed specifically on Grappa products [40]. However, even though the wheel appears in the respective Swiss site, it is not mentioned how that wheel was constructed; how many products were employed, if any; or what the overall development process was. Still, in that Grappa wheel, 68 descriptors are featured, and we observe significant overlap with the attributes identified in the present study. Specifically, for example, in the fruity category, the general subcategories at the second level are very similar, as both wheels include citrus, pip fruit, stone fruit, and dried fruit. However, in our wheel, an additional subcategory, tropical fruit, is introduced (Figure 5).
This process enabled the reduction from 205 to 45 descriptors, 25 of which were highly discriminating across products (Table 3), forming the basis of the proposed sensory wheel. The whole process helped us construct a flavor wheel of 12 broad and 45 specific descriptors covering the flavor of the category in question.

5. Conclusions

Flavor wheels are important sensory tools with broad applications in industry, quality assurance, and research. Despite the significance of grape marc spirits in the alcoholic beverage sector, no published flavor wheel has been available for this category to date, with the sole exception of an online Grappa wheel from a Swiss source in 2023 [40]. The aim of our study was to construct a flavor wheel for the category of non-flavored and non-wood-aged grape marc spirits. A parallel objective was to explore an alternative methodological pathway for flavor wheel development using a combination of rapid sensory evaluation techniques. The sequential use of UFP, CATA, and RATA allowed us to first generate a wide range of descriptors, then screen for relevance and frequency, and, finally, quantify their discriminative power. This approach offers a time-efficient and scalable alternative to traditional descriptive analysis, which may be particularly useful for under-characterized or emerging product categories. The panelists’ familiarity with the sensory space of such products ensured the reliability of the data, even though they were not specifically trained for this particular spirit category. The final flavor wheel comprises 12 broad and 45 specific descriptors, selected based on their frequency of occurrence across samples (33.3–97.7%). For example, sweet and bitter were among the most frequently cited taste attributes (97.7% and 95.5%, respectively), while fishy was the least frequent (33.3%, p = 0.005). This dual focus—on both discriminative and commonly shared descriptors—ensures that the wheel is both representative and practical (Table 3 and Table 4). Beyond its immediate application, the proposed methodology could be adapted for other traditional or region-specific beverages, offering a flexible framework for lexicon development. Further validation of the wheel using Mediterranean grape marc spirits such as Spanish Orujo would enhance its generalizability and industry relevance.

Supplementary Materials

The following supporting information can be downloaded at https://www.mdpi.com/article/10.3390/beverages11040101/s1: Figure S1: Principal Component Analysis in for CATA results, of fifty-nine (59) terms in forty-five (45) spirits, in order to remove the samples that had similar counterparts or did not contribute to the differentiation of the aromatic profile. The samples with yellow font were are the removed ones; Figure S2: Principal Component Analysis of UFP data results on two hundred and five (205) terms from forty-five spirits (45) in the first two axes; Figure S3: Scatter plot comparing the percentage of selection in Check-All-That-Apply (CATA) and the mean intensity ratings in Rate-All-That-Apply (RATA) for common sensory attributes. Attributes are color-coded based on statistical significance (blue = significant, red = not significant; p-value threshold = 0.05). Note: CATA and RATA were applied to different sample sets and used partially different sensory terms.

Author Contributions

E.A.T.: investigation, methodology, software, data curation, formal analysis, writing—original draft, visualization. P.I.: investigation, data curation. M.Z.: investigation, data curation. E.K.: conceptualization, methodology, validation, writing—review and editing, visualization, supervision. All authors have read and agreed to the published version of the manuscript.

Funding

This research received no external funding

Institutional Review Board Statement

This study was conducted in accordance with the Declaration of Helsinki and approved by the Ethics Committee of the University of West Attica (protocol code 97565, 24 October 2024).

Informed Consent Statement

Informed consent for participation was obtained from all subjects involved in this study.

Data Availability Statement

The original contributions presented in this study are included in the article/Supplementary Material. Further inquiries can be directed to the corresponding author.

Conflicts of Interest

The authors have no competing interests to declare.

References

  1. Darıcı, M.; Özcan, K.; Beypınar, D.; Cabaroglu, T. Sensory lexicon and major volatiles of rakı using descriptive analysis and GC-FID/MS. Foods 2021, 10, 1494. [Google Scholar] [CrossRef] [PubMed]
  2. Bovo, B.; Carlot, M.; Lombardi, A.; Lomolino, G.; Lante, A.; Giacomini, A.; Corich, V. Exploring the use of Saccharomyces cerevisiae commercial strain and Saccharomycodes ludwigii natural isolate for grape marc fermentation to improve sensory properties of spirits. Food Microbiol. 2014, 41, 33–41. [Google Scholar] [CrossRef]
  3. Tsapou, E.A.; Tzortzis, P.M.; Koussissi, E. Application of Polarized Projective Mapping combined with Ultra Flash Profiling to a complex− high fatigue product category: The case of Greek grape marc spirits. Food Qual. Prefer. 2024, 118, 105182. [Google Scholar] [CrossRef]
  4. Soufleros, E.H. Wine and Distillates; Papageorgiou Pub: Thessaloniki, Greece, 1987. [Google Scholar]
  5. Rodríguez-Solana, R.; Rodríguez, N.; Dominguez, J.M.; Cortés, S. Characterization by chemical and sensory analysis of commercial grape marc distillate (Orujo) aged in oak wood. J. Inst. Brew. 2012, 118, 205–212. [Google Scholar] [CrossRef]
  6. Tsapou, E.A.; Dourtoglou, V.; Dourtoglou, T.; Sinanoglou, V.; Koussissi, E. Volatile Profile in Greek Grape Marc Spirits with HS-SPME-GC-MS and Chemometrics: Evaluation of Terroir Impact. ACS Omega 2023, 8, 42803–42814. [Google Scholar] [CrossRef]
  7. Spencer, M.; Sage, E.; Velez, M.; Guinard, J.X. Using Single Free Sorting and Multivariate Explor-atory Methods to Design a New Coffee Taster’s Flavor Wheel. J. Food Sci. 2016, 81, 12. [Google Scholar] [CrossRef] [PubMed]
  8. Phetxumphou, K.; Cox, A.N.; Lahne, J. Development and characterization of a check-all-that-apply (CATA) lexicon for Virginia hard (alcoholic) ciders. J. Am. Soc. Brew. Chem. 2020, 78, 299–307. [Google Scholar] [CrossRef]
  9. Silvello, G.C.; Bortoletto, A.M.; Alcarde, A.R. The barrel aged beer wheel: A tool for sensory assessment. J. Inst. Brew. 2020, 126, 382–393. [Google Scholar] [CrossRef]
  10. Asih, N.E.; Ramadhanty, K.P.; Ramandias, J.; Azkarama, F.; Sunarharum, W.B. Lexicon, sensory wheel and kit as sensory communication tools: A review. In IOP Conference Series: Earth and Environmental Science; IOP Publishing: Bristol, UK, 2021; Volume 924, p. 012027. [Google Scholar] [CrossRef]
  11. Meilgaard, M.C.; Dalgliesh, C.E.; Clapperton, J.F. Beer flavor terminology. J. Am. Soc. Brew. Chem. 1979, 37, 47–52. [Google Scholar] [CrossRef]
  12. Noble, A.C.; Arnold, R.A.; Masuda, B.M.; Pecore, S.D.; Schmidt, J.O.; Stern, P.M. Progress towards a standardized system of wine aroma terminology. Am. J. Enol. Vitic. 1984, 35, 107–109. [Google Scholar] [CrossRef]
  13. Noble, A.C.; Arnold, R.A.; Buechsenstein, J.; Leach, E.J.; Schmidt, J.O.; Stern, P.M. Modification of a standardized system of wine aroma terminology. Am. J. Enol. Vitic. 1987, 38, 143–146. [Google Scholar] [CrossRef]
  14. Lee, K.Y.M.; Paterson, A.; Piggott, J.R.; Richardson, G.D. Origins of flavour in whiskies and a revised flavour wheel: A review. J. Inst. Brew. 2001, 107, 287–313. [Google Scholar] [CrossRef]
  15. Jolly, N.P.; Hattingh, S. A brandy aroma wheel for South African brandy. S. Afr. J. Enol. Vitic. 2001, 22, 16–21. [Google Scholar] [CrossRef]
  16. Monteiro, B.; Vilela, A.; Correia, E. Sensory profile of pink port wines: Development of a flavour lexicon. Flavour Fragr. J. 2014, 29, 50–58. [Google Scholar] [CrossRef]
  17. Koch, I.S.; Muller, M.; Joubert, E.; Van der Rijst, M.; Næs, T. Sensory characterization of rooibos tea and the development of a rooibos sensory wheel and lexicon. Food Res. Int. 2012, 46, 217–228. [Google Scholar] [CrossRef]
  18. Donnell, E.M.; Hulin-Bertaud, S.; Sheehan, E.M.; Delahunty, C.M. Development and learning process of a sensory vocabulary for the odor evaluation of selected distilled beverages using descriptive analysis. J. Sens. Stud. 2001, 16, 425–445. [Google Scholar] [CrossRef]
  19. Tsachaki, M.; Arnaoutopoulou, A.P.; Margomenou, L.; Roubedakis, S.C.; Zabetakis, I. Develop-ment of a suitable lexicon for sensory studies of the anise-flavoured spirits ouzo and tsipouro. Flavour Fragr. J. 2010, 25, 468–474. [Google Scholar] [CrossRef]
  20. Ares, G.; Jaeger, S.R. Check-all-that-apply questions: Influence of attribute order on sensory product characterization. Food Qual. Prefer. 2013, 28, 141–153. [Google Scholar] [CrossRef]
  21. Ares, G.; Bruzzone, F.; Vidal, L.; Cadena, R.S.; Giménez, A.; Pineau, B.; Hunter, D.C.; Paisley, A.G.; Jaeger, S.R. Evalua-tion of a rating-based variant of check-all-that-apply questions: Rate-all-that-apply (RATA). Food Qual. Prefer. 2014, 36, 87–95. [Google Scholar] [CrossRef]
  22. ISO8589: 2007; Sensory Analysis—General Guidance for the Design of Test Rooms. International Organization of Standardization: Geneva, Switzerland, 2007; 2nd ed.
  23. De Pelsmaeker, S.; De Clercq, G.; Gellynck, X.; Schouteten, J.J. Development of a Sensory Wheel and Lexi-con for Chocolate. Food Res. Int. 2019, 116, 1183–1191. [Google Scholar] [CrossRef]
  24. Meyners, M.; Castura, J.C. Randomization of CATA attributes: Should attribute lists be allocated to assessors or to samples? Food Qual. Prefer. 2016, 48, 210–215. [Google Scholar] [CrossRef]
  25. Lumivero. XLSTAT Statistical and Data Analysis Solution. 2025. Available online: https://www.xlstat.com/ (accessed on 31 July 2024).
  26. Tura, M.; Mandrioli, M.; Valli, E.; Dinnella, C.; Gallina Toschi, T. Sensory wheel and lexicon for the description of cold-pressed hemp seed oil. Foods 2023, 12, 661. [Google Scholar] [CrossRef]
  27. Ickes, C.M.; Lee, S.Y.; Cadwallader, K.R. Novel creation of a rum flavor lexicon through the use of web-based material. J. Food Sci. 2017, 82, 1216–1223. [Google Scholar] [CrossRef] [PubMed]
  28. Yu, M.; Zheng, C.; Xie, Q.; Tang, Y.; Wang, Y.; Wang, B.; Song, H.; Zhou, Y.; Xu, Y.; Yang, R. Flavor wheel construction and sensory profile description of human milk. Nutrients 2022, 14, 5387. [Google Scholar] [CrossRef] [PubMed]
  29. Larssen, W.E.; Monteleone, E.; Hersleth, M. Sensory description of marine oils through develop-ment of a sensory wheel and vocabulary. Food Res. Int. 2018, 106, 45–53. [Google Scholar] [CrossRef]
  30. Bordeu, E.; Formas, G.; Agosin, E. Proposal for a standardized set of sensory terms for pisco, a young muscat wine distillate. Am. J. Enol. Vitic. 2004, 55, 104–107. [Google Scholar] [CrossRef]
  31. ISO 11035:1994; Sensory Analysis—Identification and Selection of Descriptors for Establishing a Sensory Profile by a Multidimensional Approach. International Organization of Standardization: Geneva, Switzerland, 1994; 1st ed.
  32. .Bruzzone, F.; Vidal, L.; Antúnez, L.; Giménez, A.; Deliza, R.; Ares, G. Comparison of intensity scales and CATA questions in new product development: Sensory characterisation and directions for product reformulation of milk desserts. Food Qual. Prefer. 2015, 44, 183–193. [Google Scholar] [CrossRef]
  33. Vidal, L.; Tárrega, A.; Antúnez, L.; Ares, G.; Jaeger, S.R. Comparison of correspondence analysis based on Hellinger and chi-square distances to obtain sensory spaces from check-all-that-apply (CATA) questions. Food Qual. Prefer. 2015, 43, 106–112. [Google Scholar] [CrossRef]
  34. Krosnick, J.A.; Alwin, D.F. An evaluation of a cognitive theory of response-order effects in survey measurement. Public Opin. Q. 1987, 51, 201–219. [Google Scholar] [CrossRef]
  35. Rasinski, K.A.; Mingay, D.; Bradburn, N.M. Do respondents really “mark all that apply” on self-administered questions? Public Opin. Q. 1994, 58, 400–408. [Google Scholar] [CrossRef]
  36. Jaeger, S.R.; Beresford, M.K.; Paisley, A.G.; Antúnez, L.; Vidal, L.; Cadena, R.S.; Giménez, A.; Ares, G. Check-all-that-apply (CATA) questions for sensory product characterization by consumers: Investigations into the number of terms used in CATA questions. Food Qual. Prefer. 2015, 42, 154–164. [Google Scholar] [CrossRef]
  37. Delarue, J.; Lawlor, J.B. (Eds.) Rapid Sensory Profiling Techniques: Applications in New Product Development and Consumer Research; Woodhead Publishing: Sawston, UK, 2022. [Google Scholar]
  38. Williams, A.A.; Langron, S.P. The use of free-choice profiling for the evaluation of commercial ports. J. Sci. Food Agric. 1984, 35, 558–568. [Google Scholar] [CrossRef]
  39. Mendes da Silva, T.; Torello Marinoni, D.; Peano, C.; Roberta Giuggioli, N. A new sensory approach combined with a text-mining tool to create a sensory lexicon and profile of monovarietal apple juices. Foods 2019, 8, 608. [Google Scholar] [CrossRef] [PubMed]
  40. Agroscope. 2023. Available online: https://www.agroscope.admin.ch/agroscope/en/home/news/newsroom/2023/06-27_aromarad-grappa-marc.html (accessed on 20 November 2024).
Figure 1. Flowchart illustrating the sequential application of sensory methods—UFP, CATA, and RATA—in the development of a flavor wheel for grape marc spirits.
Beverages 11 00101 g001
Figure 2. Correspondence analysis for CATA questions on forty-five (45) samples using the fifteen (15) terms with the most important p-values.
Beverages 11 00101 g002
Figure 3. (a) Principal Coordinate Analysis applied to the attributes with the most important p-values from CATA questions. (b) Agglomerative Hierarchical Clustering. The colors of the attributes in the symmetric plot were grouped in the same way, with the colors of the clusters indicated by the Agglomerative Hierarchical Clustering. The dotted line represents the dissimilarity threshold used to define the six clusters.
Beverages 11 00101 g003
Figure 4. Correspondence analysis for RATA questions for thirty-six (36) samples using forty-five (45) terms.
Beverages 11 00101 g004
Figure 5. A flavor wheel for non-flavored and non-aged grape marc spirits with the terms that were finally selected for the lexicon based on the collective results of UFP, CATA, and RATA.
Beverages 11 00101 g005
Table 1. Spirits used, country and specific geographical region of origin of the products, code names, and inclusion in each sensory method of this study (UFP, CATA, and RATA).
RegionCodeUFPCATARATA
GreeceTyrnavosΤ1
Τ2
Τ3
Τ4
Τ5
Τ6
Τ27
Τ28
Τ29
Τ30
Τ31
Τ32
ThessalyΤ7
Τ8
Τ9
Τ10
Τ11
PeloponneseΤ12
Τ13
Τ15
Τ16
Τ17
ThraceΤ18
Τ19
Central GreeceΤ14
Τ22
Τ20
Τ21
Τ35
Τ36
CreteΤ23
Τ24
Τ25
Τ33
Τ34
CycladesΤ26
ItalyΤ37
Τ38
CyprusΤ39
Τ40
Τ41
Τ42
Τ43
Τ44
Τ45
Table 3. ANOVA summaries for each attribute in relation to the products according to RATA results.
Attributep-ValueAttributep-ValueAttributep-ValueAttributep-Value
anise<0.0001ethyl acetate0.013mint0.099smoky0.006
berries0.405eucalyptus0.442nuts0.253soapy0.543
bitter0.121fatty0.634orange blossom0.0001spicy0.006
bread0.270fishy0.006petroleum<0.0001stone fruit0.006
burning<0.0001floral0.0003pine0.327sweet0.673
canned/cooked0.022fresh0.112pip fruit (apple/pear)0.071tropical fruit0.197
caramel0.377fruity0.011rose0.019vanilla0.002
citrus fruit0.001grape0.008rough0.001waxy0.0004
coating0.001grassy0.003rubbery0.001white flowers0.007
dill0.017honey0.648salty0.819woody0.297
dried (hay, straw, tea)0.009lavender0.291
dried fruit0.490medical0.161
earthy0.083
Table 4. Identified percentages of occurrence of descriptions across all samples from RATA results.
Sensory ModalityDescriptionsOccurrence (%)Sensory ModalityDescriptionsOccurrence (%)
Odor (ortho and retronasal)Citrus fruit88.89Odor (ortho and retronasal)Mint60
Floral88.89Medical55.56
Eucalyptus86.67Earthy55.56
Grassy84.44Pine53.33
Anise84.44Dill53.33
Fresh82.22Smoky53.33
Dried (hay, straw, tea)82.22Grape51.11
Ethyl acetate82.22Waxy51.11
Stone fruit77.78Nuts51.11
Fruity75.56Berries46.67
Canned/cooked75.56Rose44.44
Tropical fruit73.33Lavender44.44
Vanilla73.33Rubbery44.44
Honey73.33Fishy33.33
White flowers71.11MouthfeelBurning93.33
Orange blossom68.89Coating91.11
Soapy68.89Fatty75.56
Petroleum68.89Rough64.44
Woody68.89Dry44.44
Bread66.67 Sweet97.78
Caramel66.67Basic tastesBitter95.56
Pip fruit (apple/pear)64.44Salty64.44
Spicy62.22
Dried fruit (plum, raisin, etc.)60
Disclaimer/Publisher’s Note: The statements, opinions and data contained in all publications are solely those of the individual author(s) and contributor(s) and not of MDPI and/or the editor(s). MDPI and/or the editor(s) disclaim responsibility for any injury to people or property resulting from any ideas, methods, instructions or products referred to in the content.

