

The Effect of an Energy Window with an Ellipsoid Phantom on the Differential Defect Contrast on Myocardial SPECT Images


Abstract
:1. Introduction
2. Methods
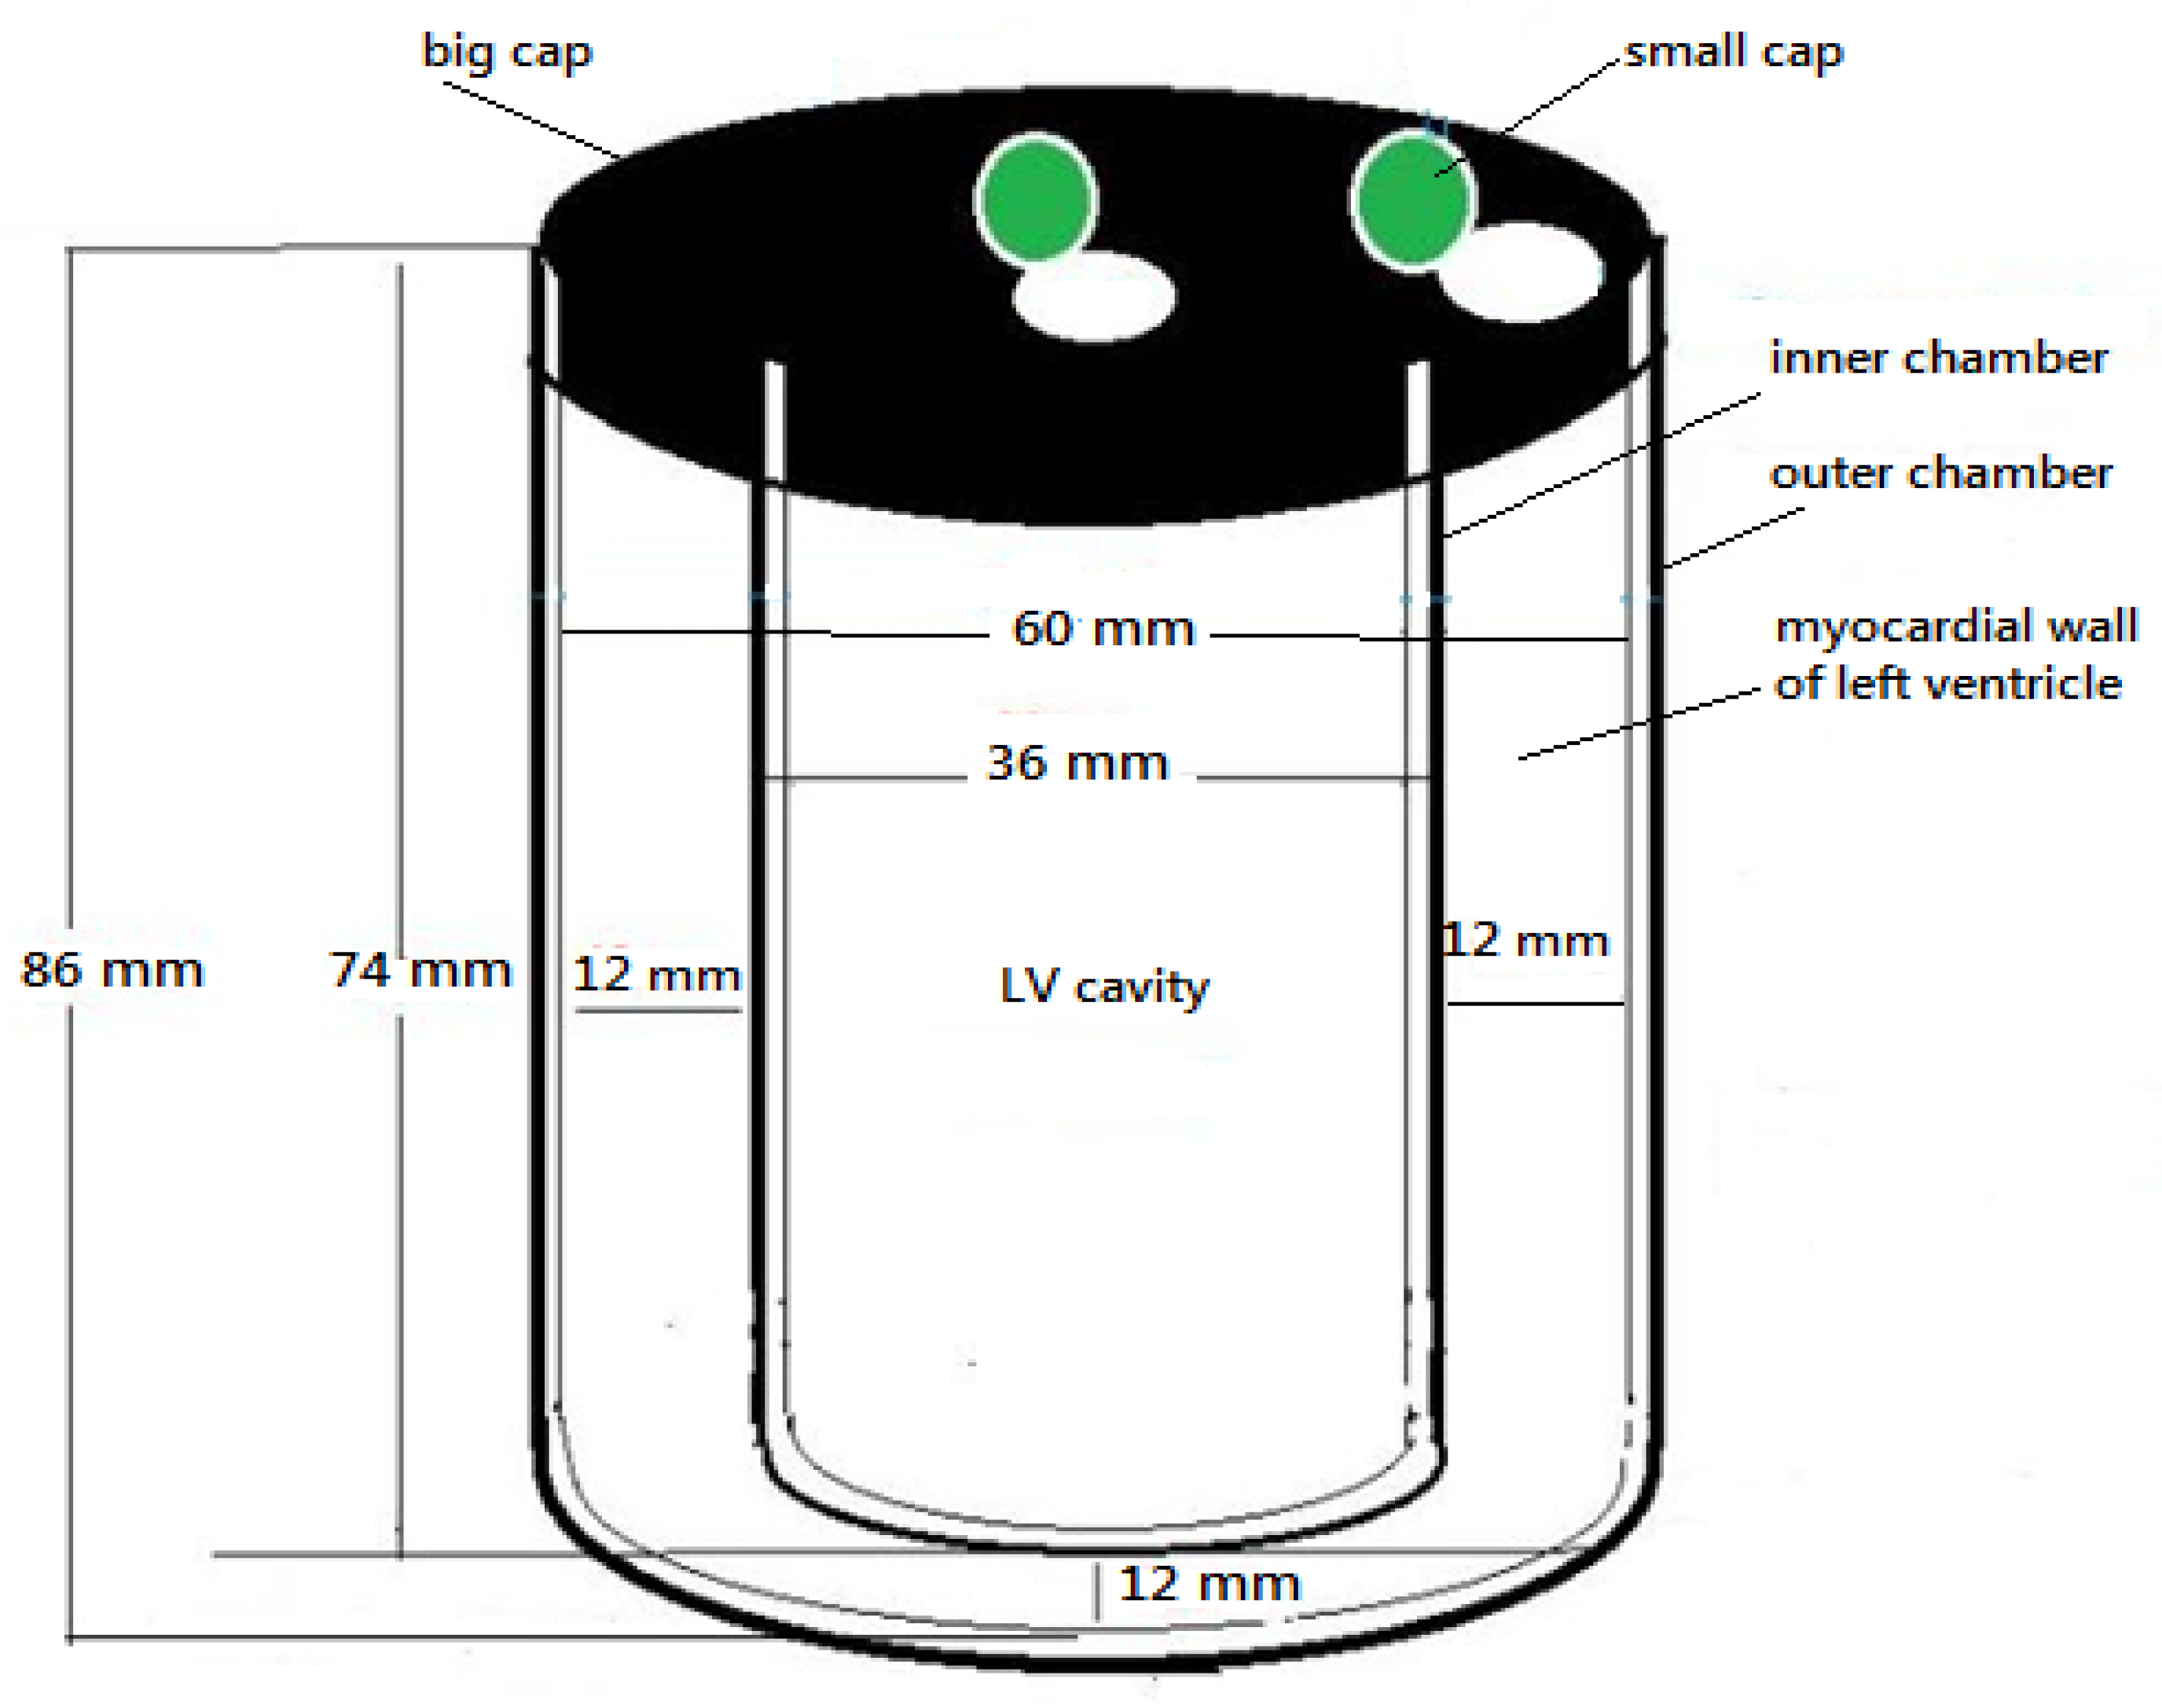
2.1. Phantom Design and Configuration
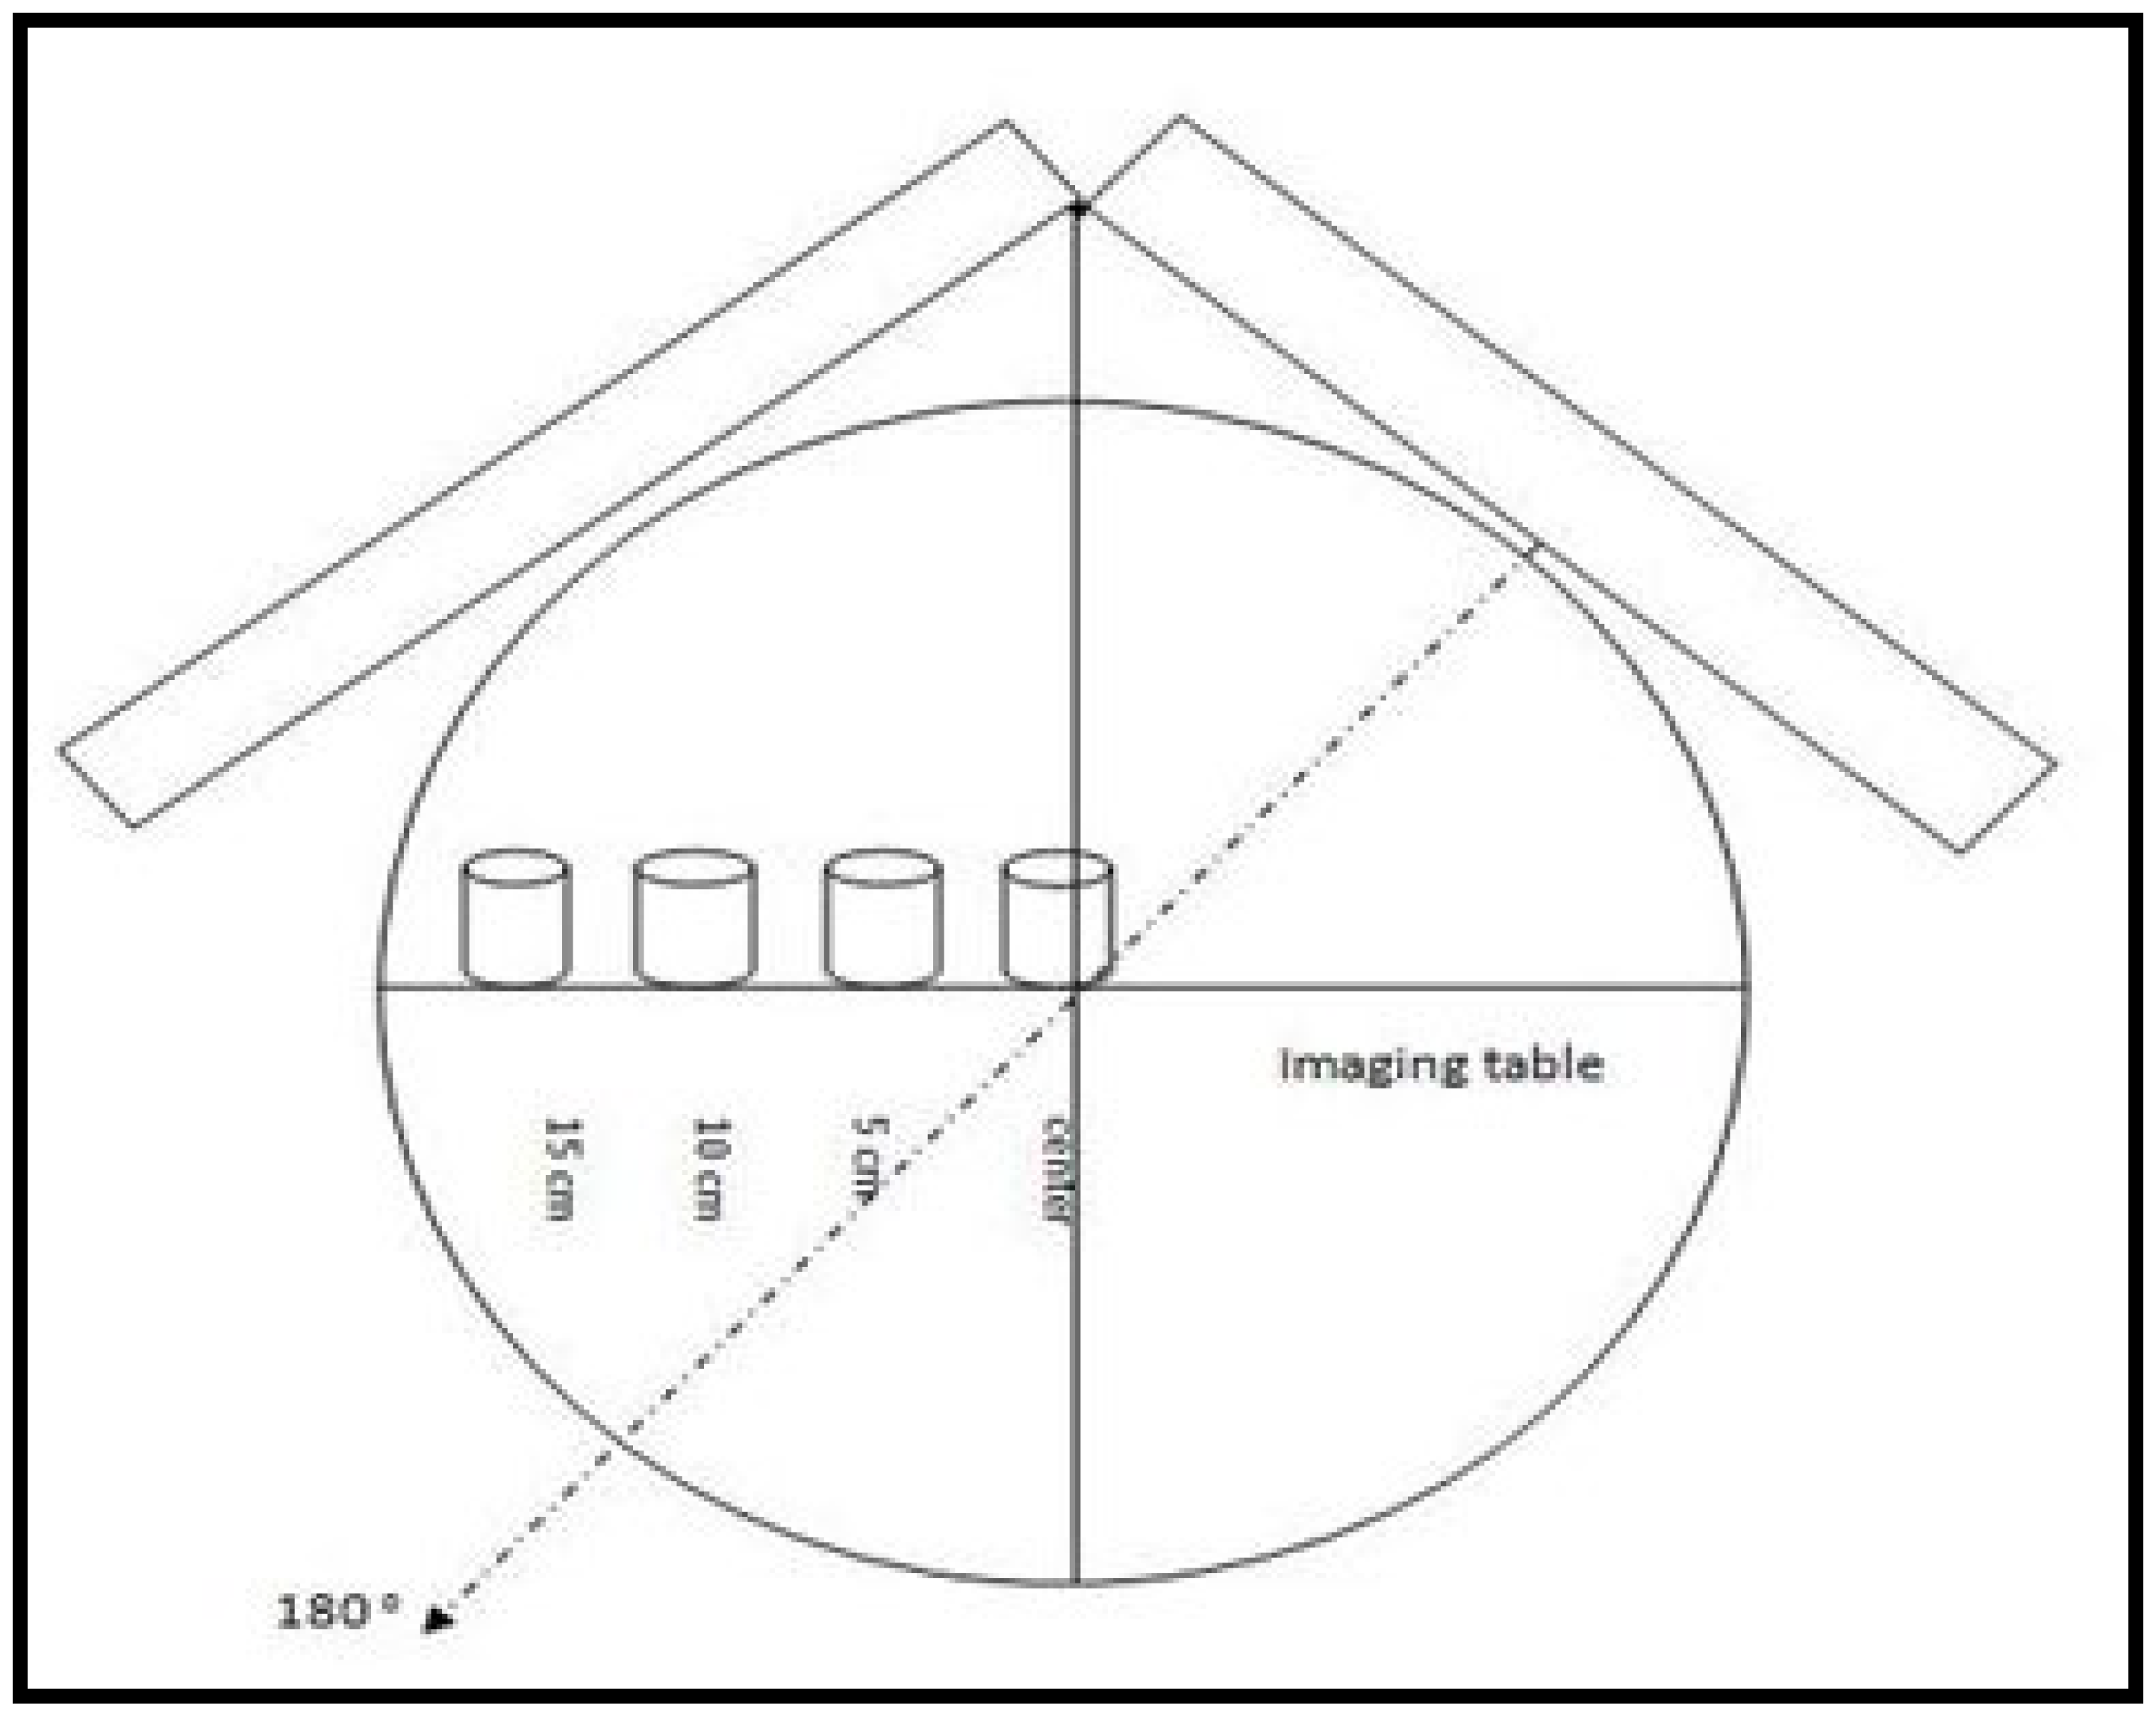
2.2. Image Acquisition
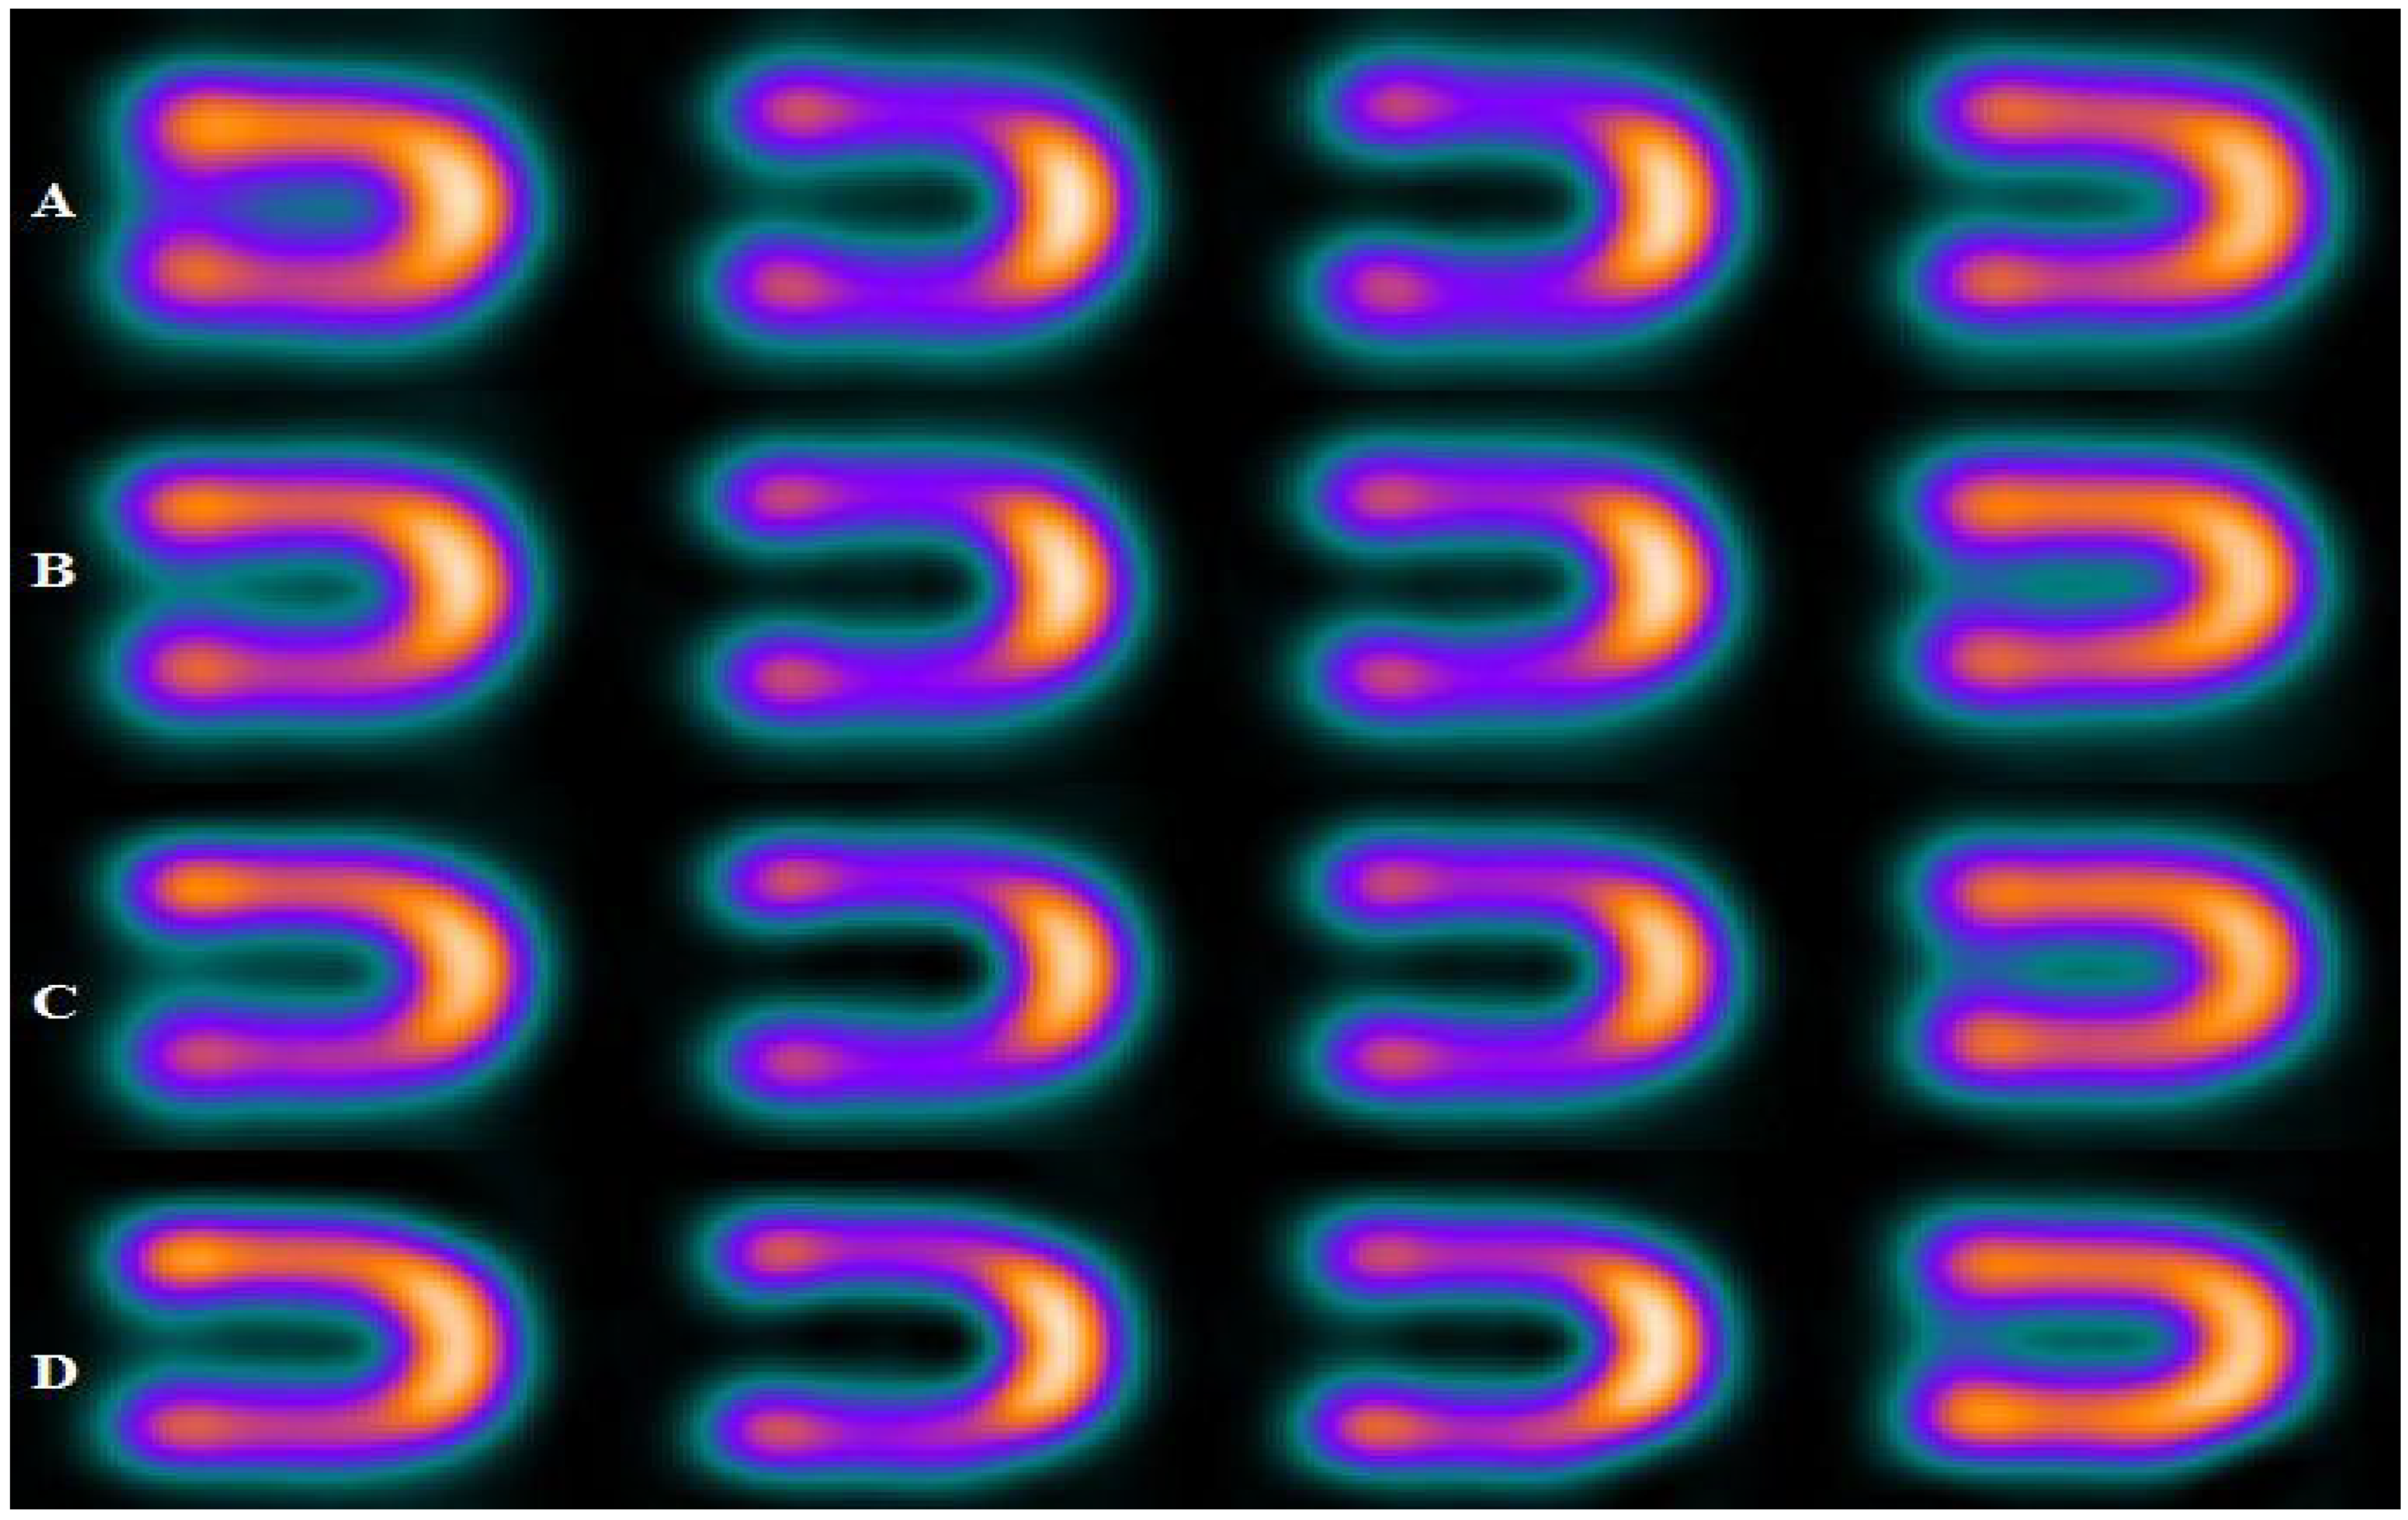
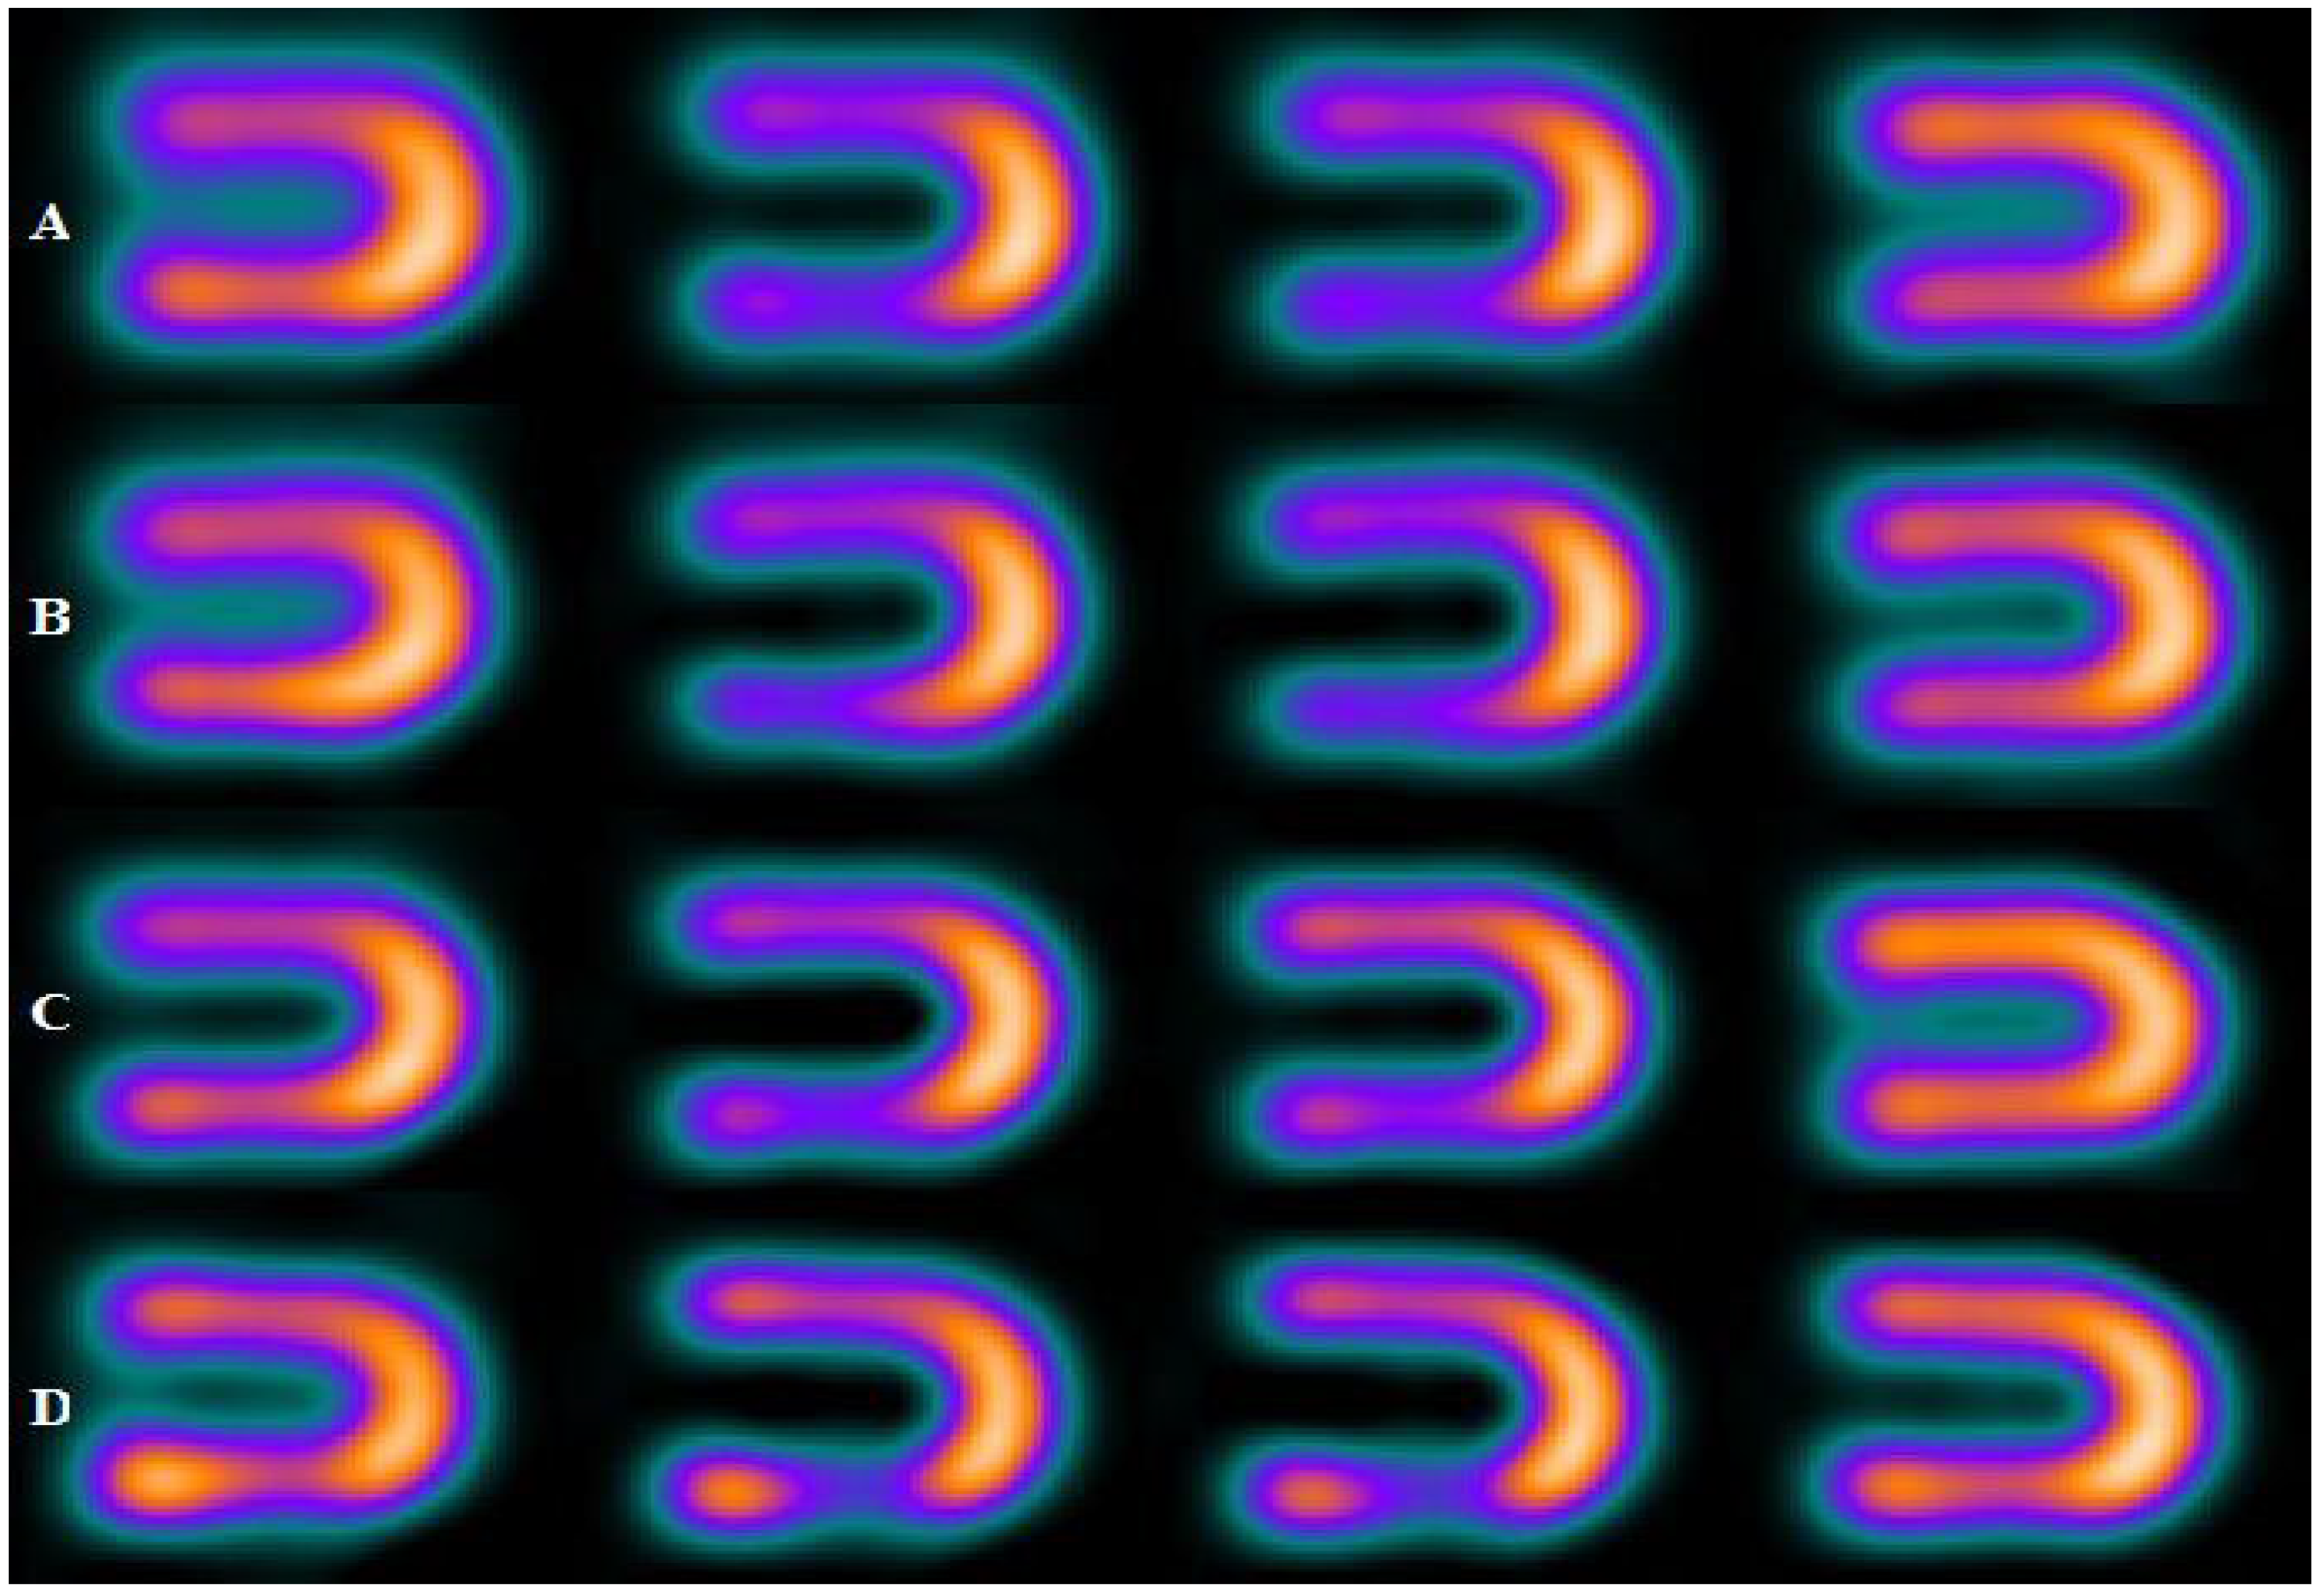
3. Results and Discussion
4. Conclusions
Author Contributions
Funding
Institutional Review Board Statement
Informed Consent Statement
Data Availability Statement
Acknowledgments
Conflicts of Interest
References
- Ljungberg, M.; Pretorius, P.H. SPECT/CT: An update on technological developments and clinical applications. Br. J. Radiol. 2018, 91, 20160402. [Google Scholar] [CrossRef] [PubMed]
- Ritt, P. Recent developments in SPECT/CT. In Seminars in Nuclear Medicine; Elsevier: Amsterdam, The Netherlands, 2022. [Google Scholar]
- Bocher, M.; Blevis, I.M.; Tsukerman, L.; Shrem, Y.; Kovalski, G.; Volokh, L. A fast cardiac gamma camera with dynamic SPECT capabilities: Design, system validation and future potential. Eur. J. Nucl. Med. Mol. Imaging 2010, 37, 1887–1902. [Google Scholar] [CrossRef] [PubMed]
- Abbott, B.G.; Case, J.A.; Dorbala, S.; Einstein, A.J.; Galt, J.R.; Pagnanelli, R.; Bullock-Palmer, R.P.; Soman, P.; Wells, R.G. Contemporary cardiac SPECT imaging—Innovations and best practices: An information statement from the American society of nuclear cardiology. Circ. Cardiovasc. Imaging 2018, 11, e000020. [Google Scholar] [CrossRef] [PubMed]
- Hendel, R.C.; Berman, D.S.; Di Carli, M.F.; Heidenreich, P.A.; Henkin, R.E.; Pellikka, P.A.; Pohost, G.M.; Williams, K.A. ACCF/ASNC/ACR/AHA/ASE/SCCT/SCMR/SNM 2009 appropriate use criteria for cardiac radionuclide imaging: A report of the American College of Cardiology Foundation Appropriate Use Criteria Task Force, the American Society of Nuclear Cardiology, the American College of Radiology, the American Heart Association, the American Society of Echocardiography, the Society of Cardiovascular Computed Tomography, the Society for Cardiovascular Magnetic Resonance, and the Society of Nuclear Medicine Endorsed by the American College of Emergency Physicians. J. Am. Coll. Cardiol. 2009, 53, 2201–2229. [Google Scholar] [PubMed]
- Brindis, R.G.; Douglas, P.S.; Hendel, R.C.; Peterson, E.D.; Wolk, M.J.; Allen, J.M.; Patel, M.R.; Raskin, I.E.; Hendel, R.C.; Bateman, T.M. ACCF/ASNC appropriateness criteria for single-photon emission computed tomography myocardial perfusion imaging (SPECT MPI) a report of the American College of Cardiology Foundation Quality Strategic Directions Committee Appropriateness Criteria Working Group and the American Society of Nuclear Cardiology endorsed by the American Heart Association. J. Am. Coll. Cardiol. 2005, 46, 1587–1605. [Google Scholar]
- Liu, Y.-H.; Lam, P.T.; Sinusas, A.J.; Wackers, F.J.T. Differential effect of 180 and 360 acquisition orbits on the accuracy of SPECT imaging: Quantitative evaluation in phantoms. J. Nucl. Med. 2002, 43, 1115–1124. [Google Scholar]
- Borges-Neto, S.; Pagnanelli, R.A.; Shaw, L.K.; Honeycutt, E.; Shwartz, S.C.; Adams, G.L.; Coleman, R.E. Clinical results of a novel wide beam reconstruction method for shortening scan time of Tc-99m cardiac SPECT perfusion studies. J. Nucl. Cardiol. 2007, 14, 555–565. [Google Scholar] [CrossRef]
- Khaw, B.A.; Strauss, H.W.; Carvalho, A.; Locke, E.; Gold, H.K.; Haber, E. Technetium-99m labeling of antibodies to cardiac myosin Fab and to human fibrinogen. J. Nucl. Med. 1982, 23, 1011–1019. [Google Scholar]
- Sciagrà, R.; Giaccardi, M.; Porciani, M.C.; Colella, A.; Michelucci, A.; Pieragnoli, P.; Gensini, G.; Pupi, A.; Padeletti, L. Myocardial perfusion imaging using gated SPECT in heart failure patients undergoing cardiac resynchronization therapy. J. Nucl. Med. 2004, 45, 164–168. [Google Scholar]
- Nagueh, S.F.; Bierig, S.M.; Budoff, M.J.; Desai, M.; Dilsizian, V.; Eidem, B.; Goldstein, S.A.; Hung, J.; Maron, M.S.; Ommen, S.R. American Society of Echocardiography clinical recommendations for multimodality cardiovascular imaging of patients with hypertrophic cardiomyopathy: Endorsed by the American Society of Nuclear Cardiology, Society for Cardiovascular Magnetic Resonance, and Society of Cardiovascular Computed Tomography. J. Am. Soc. Echocardiogr. 2011, 24, 473–498. [Google Scholar]
- Jaszczak, R.J. The early years of single photon emission computed tomography (SPECT): An anthology of selected reminiscences. Phys. Med. Biol. 2006, 51, R99. [Google Scholar] [CrossRef] [PubMed]
- Iskandrian, A.S.; Heo, J.; Askenase, A.; Segal, B.L.; Helfant, R.H. Thallium imaging with single photon emission computed tomography. Am. Heart J. 1987, 114, 852–865. [Google Scholar] [CrossRef]
- Buechel, R.R.; Herzog, B.A.; Husmann, L.; Burger, I.A.; Pazhenkottil, A.P.; Treyer, V.; Valenta, I.; von Schulthess, P.; Nkoulou, R.; Wyss, C.A. Ultrafast nuclear myocardial perfusion imaging on a new gamma camera with semiconductor detector technique: First clinical validation. Eur. J. Nucl. Med. Mol. Imaging 2010, 37, 773–778. [Google Scholar] [CrossRef] [PubMed]
- Baron, J.M.; Chouraqui, P. Myocardial single-photon emission computed tomographic quality assurance. J. Nucl. Cardiol. 1996, 3, 157–166. [Google Scholar] [CrossRef]
- Fahey, F.H.; A Harkness, B.; Keyes, J.W.; Madsen, M.T.; Battisti, C.; Zito, V. Society of Nuclear Medicine. Sensitivity, resolution and image quality with a multi-head SPECT camera. J. Nucl. Med. 1992, 33, 1859–1863. [Google Scholar]
- Lim, C.B.; Walker, R.; Pinkstaff, C.; Kim, K.I.; Anderson, J.; King, S.; Janzso, J.; Shand, D.; Valentino, F.; Coulman, K. Triangular SPECT system for 3-D total organ volume imaging: Performance results and dynamic imaging capability. IEEE Trans. Nucl. Sci. 1986, 33, 501–504. [Google Scholar] [CrossRef]
- Zwarts, F.; Dobbeleir, A.A.; te Kruibeke, B. Quantification and Data Optimisation of Heart and Brain Studies in Conventional Nuclear Medicine; University of Groningen: Groningen, The Netherlands, 2006. [Google Scholar]
- Ljungberg, M.; Strand, S.E. Scatter and attenuation correction in SPECT using density maps and Monte Carlo simulated scatter functions. J. Nucl. Med. 1990, 31, 1560–1567. [Google Scholar]
- Ogawa, K.; Harata, Y.; Ichihara, T.; Kubo, A.; Hashimoto, S. A practical method for position-dependent Compton-scatter correction in single photon emission CT. IEEE Trans. Med. Imaging 1991, 10, 408–412. [Google Scholar] [CrossRef]
- Young, K.; Kouris, K.; Awdeh, M.; Abdel-Dayem, H.M. Reproducibility and action levels for gamma camera uniformity. Nucl. Med. Commun. 1990, 11, 95–101. [Google Scholar] [CrossRef]
- Movahed, A.; Gnanasegaran, G.; Buscombe, J.; Hall, M.J.A.S.V. Integrating Cardiology for Nuclear Medicine Physicians; Springer: Berlin/Heidelberg, Germany, 2009. [Google Scholar]
- Knešaurek, K.; Machac, J.; Muzinic, M.; DaCosta, M.; Zhang, Z.; Heiba, S. Quantitative comparison of yttrium-90 (90 Y)-microspheres and technetium-99m (99m Tc)-macroaggregated albumin SPECT images for planning 90 Y therapy of liver cancer. Technol. Cancer Res. Treat. 2010, 9, 253–261. [Google Scholar] [CrossRef]
- Garcia, E.V.; Cooke, C.; Van Train, K.F.; Folks, R.; Peifer, J.; DePuey, E.; Maddahi, J.; Alazraki, N.; Galt, J.; Ezquerra, N.; et al. Technical aspects of myocardial SPECT imaging with technetium-99m sestamibi. Am. J. Cardiol. 1990, 66, E23–E31. [Google Scholar] [CrossRef]
- Vallejo, E. New radiotracers in cardiac imaging: Principles and applications taillefer and Tamaki. J. Nucl. Cardiol. 1999, 6, 549. [Google Scholar] [CrossRef]
- Ye, J.; Liu, L.; Braymer, W.; Buskard, T. Improvement in myocardial defect contrast and uniformity for SPECT in an anthropomorhphic phantom using attenuation correction and resolution recovery for Tc-99m and Tl-201. J. Nucl. Med. 1998, 39, 180. [Google Scholar]
- Lowe, V.J.; Greer, K.L.; Hanson, M.W.; Jaszczak, R.J.; Coleman, R.E. Cardiac phantom evaluation of simultaneously acquired dual-isotope rest thallium-201/stress technetium-99m SPECT images. Soc. Nucl. Med. 1993, 34, 1998–2006. [Google Scholar]

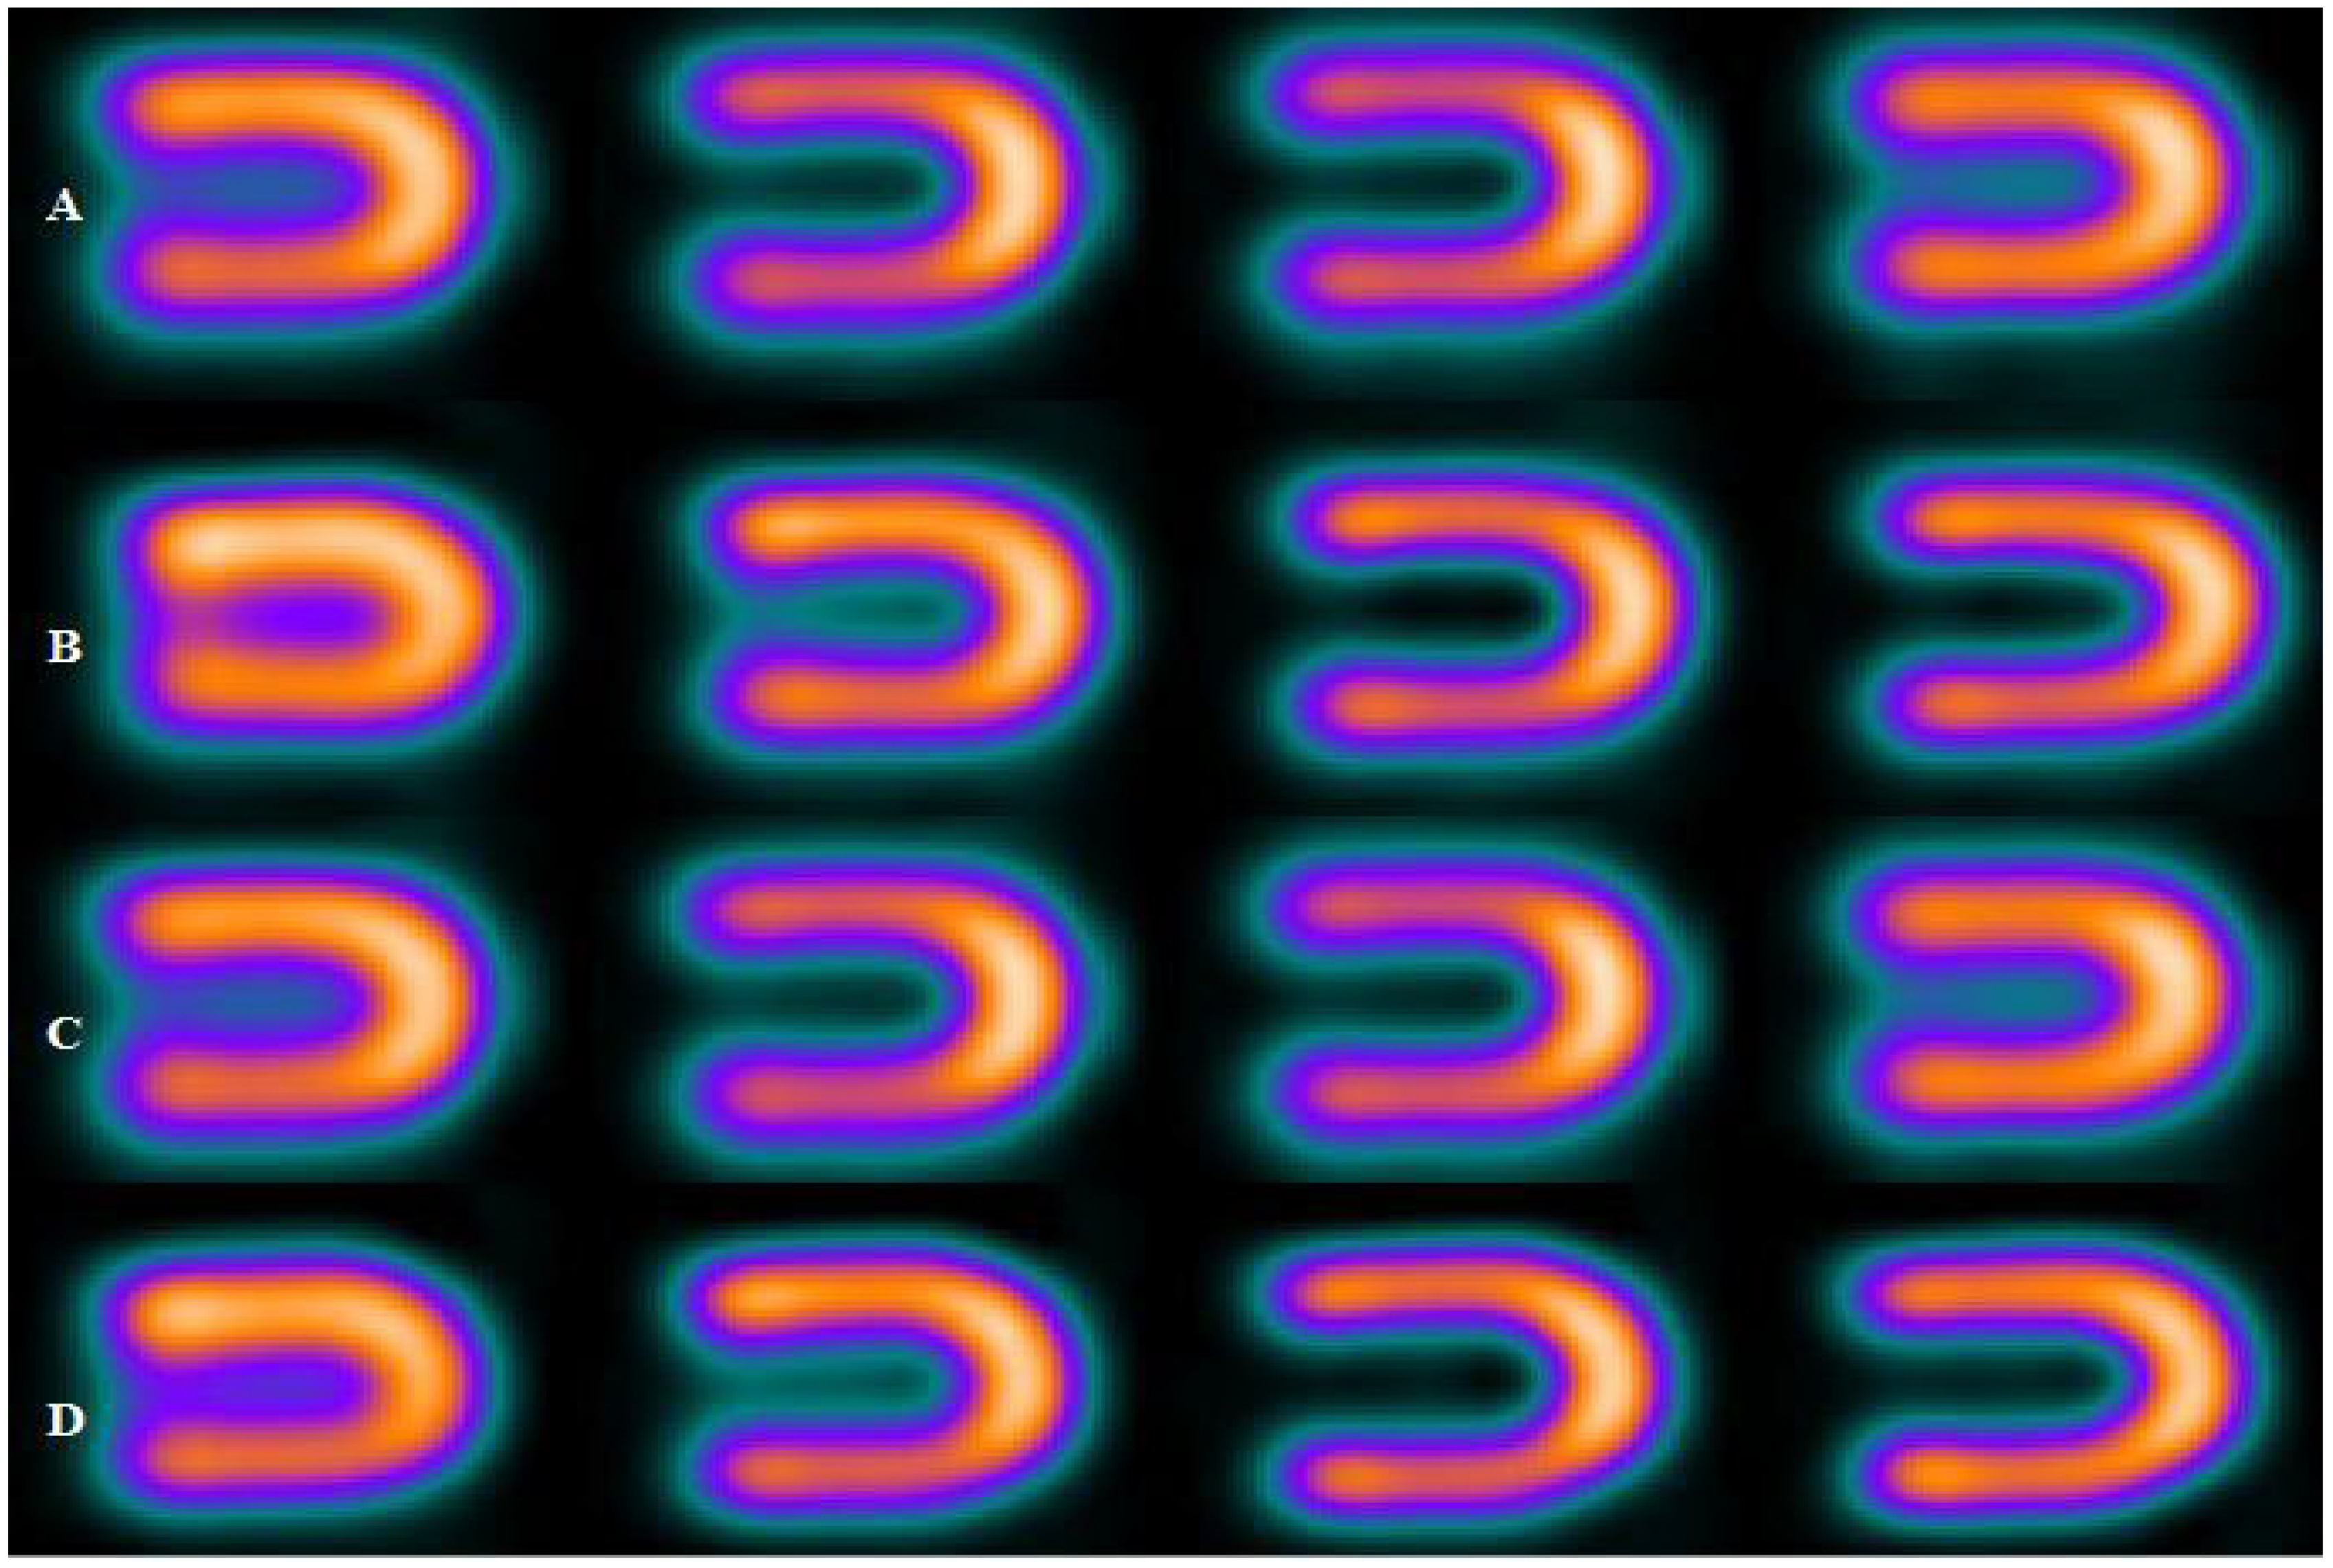
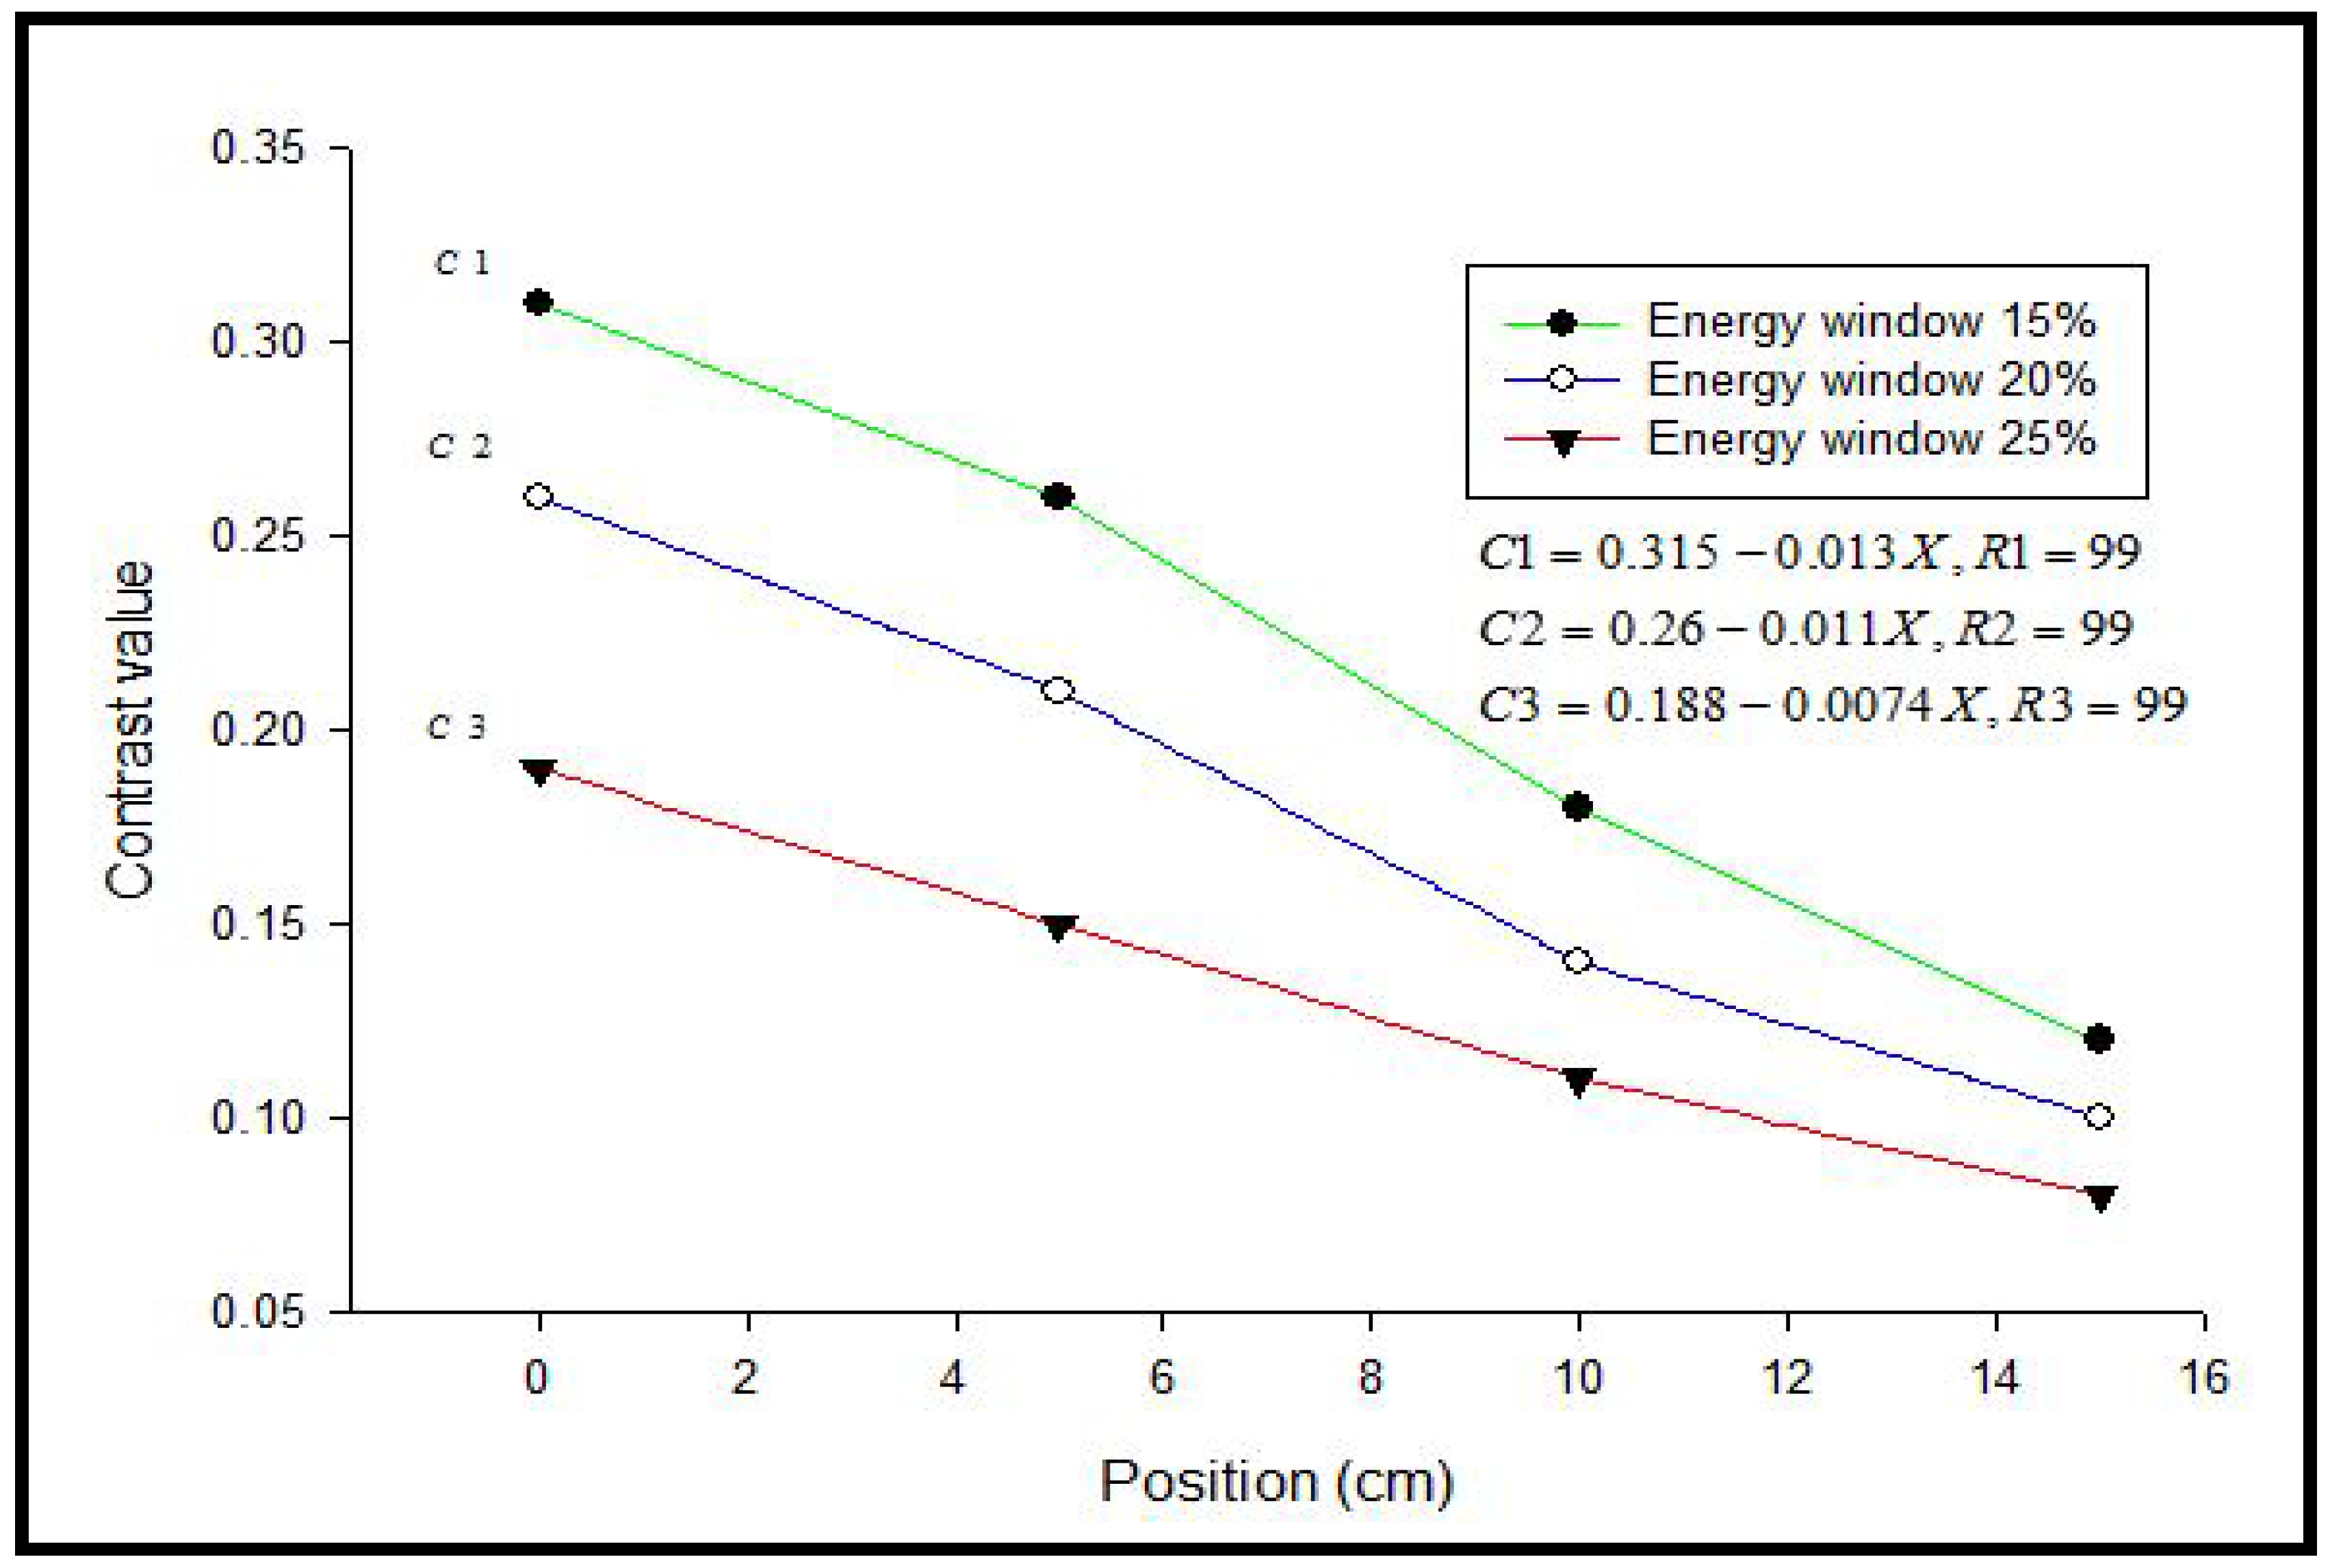
| Energy Window | A | B | C | D |
|---|---|---|---|---|
| 15% | 0.31 | 0.26 | 0.18 | 0.12 |
| 20% | 0.26 | 0.21 | 0.14 | 0.10 |
| 25% | 0.19 | 0.15 | 0.11 | 0.08 |
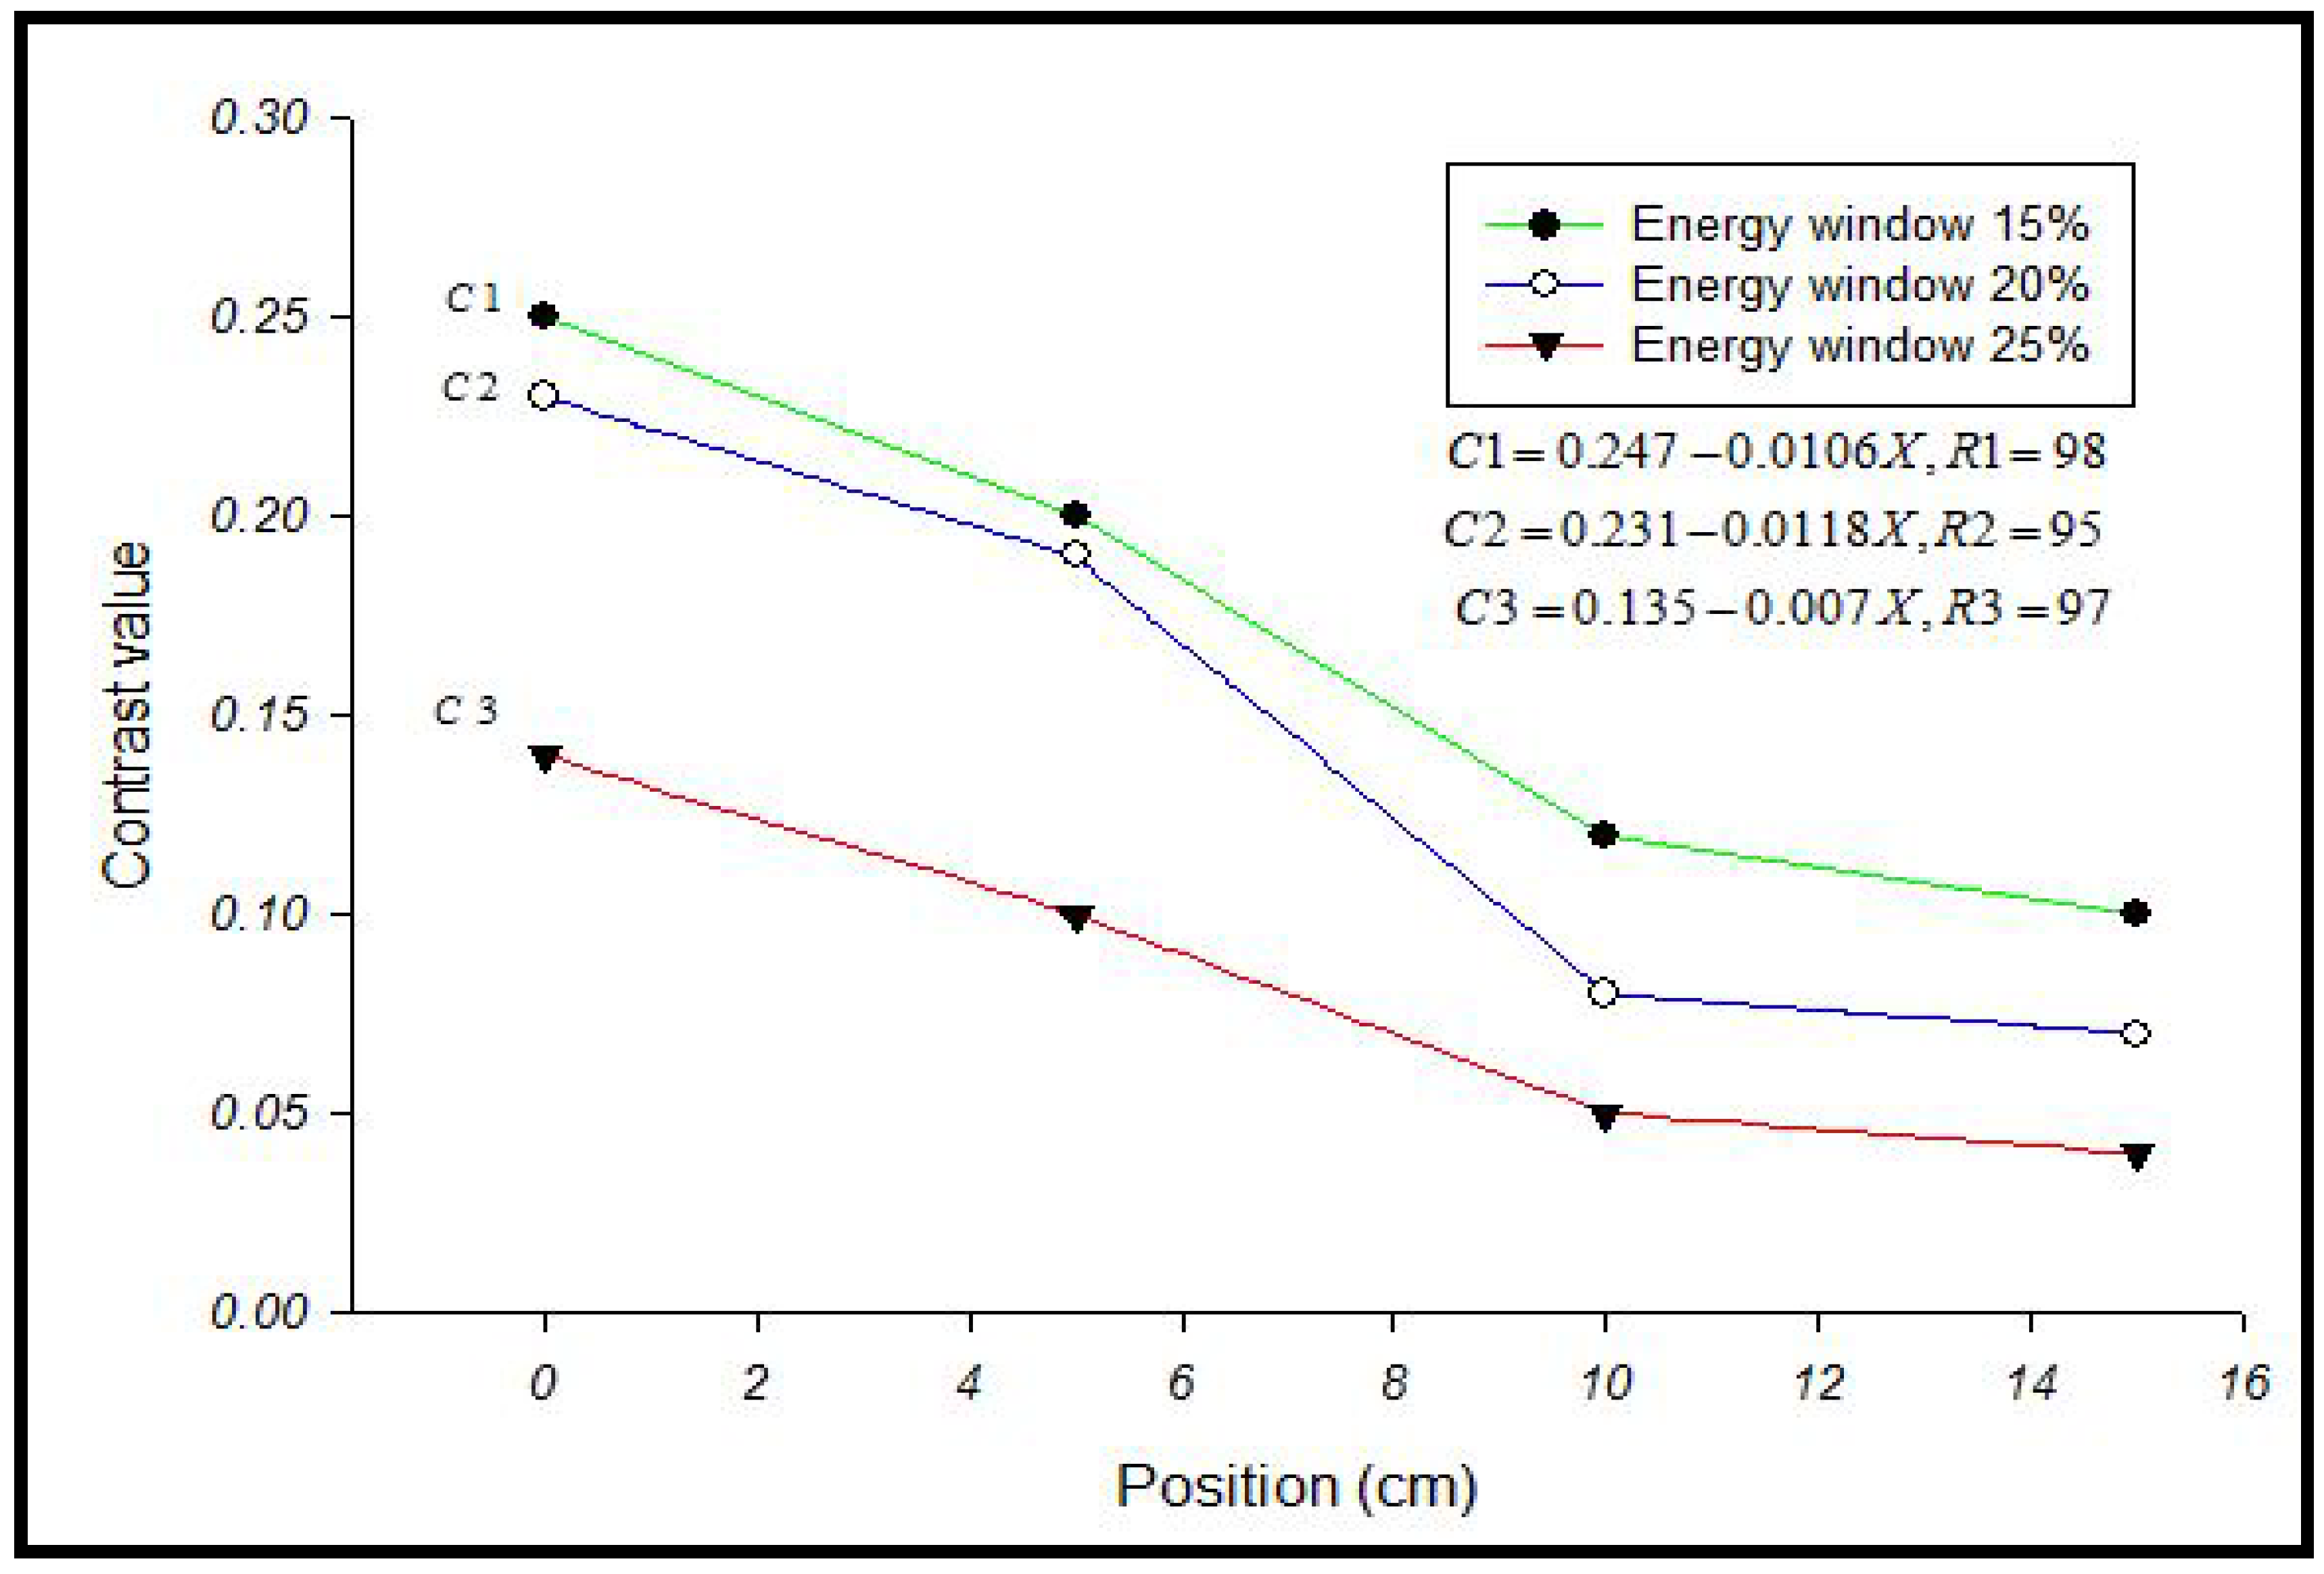
| Energy Window | A | B | C | D |
|---|---|---|---|---|
| 15% | 0.25 | 0.20 | 0.12 | 0.10 |
| 20% | 0.23 | 0.19 | 0.08 | 0.07 |
| 25% | 0.14 | 0.10 | 0.05 | 0.05 |
Publisher’s Note: MDPI stays neutral with regard to jurisdictional claims in published maps and institutional affiliations. |
© 2022 by the authors. Licensee MDPI, Basel, Switzerland. This article is an open access article distributed under the terms and conditions of the Creative Commons Attribution (CC BY) license (https://creativecommons.org/licenses/by/4.0/).
Share and Cite
Oglat, A.A.; Sayah, M.A.; Kabir, N.A. The Effect of an Energy Window with an Ellipsoid Phantom on the Differential Defect Contrast on Myocardial SPECT Images. Bioengineering 2022, 9, 341. https://doi.org/10.3390/bioengineering9080341
Oglat AA, Sayah MA, Kabir NA. The Effect of an Energy Window with an Ellipsoid Phantom on the Differential Defect Contrast on Myocardial SPECT Images. Bioengineering. 2022; 9(8):341. https://doi.org/10.3390/bioengineering9080341
Chicago/Turabian StyleOglat, Ammar A., Mohannad Adel Sayah, and Norlaili A. Kabir. 2022. "The Effect of an Energy Window with an Ellipsoid Phantom on the Differential Defect Contrast on Myocardial SPECT Images" Bioengineering 9, no. 8: 341. https://doi.org/10.3390/bioengineering9080341
APA StyleOglat, A. A., Sayah, M. A., & Kabir, N. A. (2022). The Effect of an Energy Window with an Ellipsoid Phantom on the Differential Defect Contrast on Myocardial SPECT Images. Bioengineering, 9(8), 341. https://doi.org/10.3390/bioengineering9080341