
Image Analysis Semi-Automatic System for Colony-Forming-Unit Counting


Abstract
:1. Introduction
2. Methodology
2.1. Bacterial Cultures
2.1.1. Culture Media
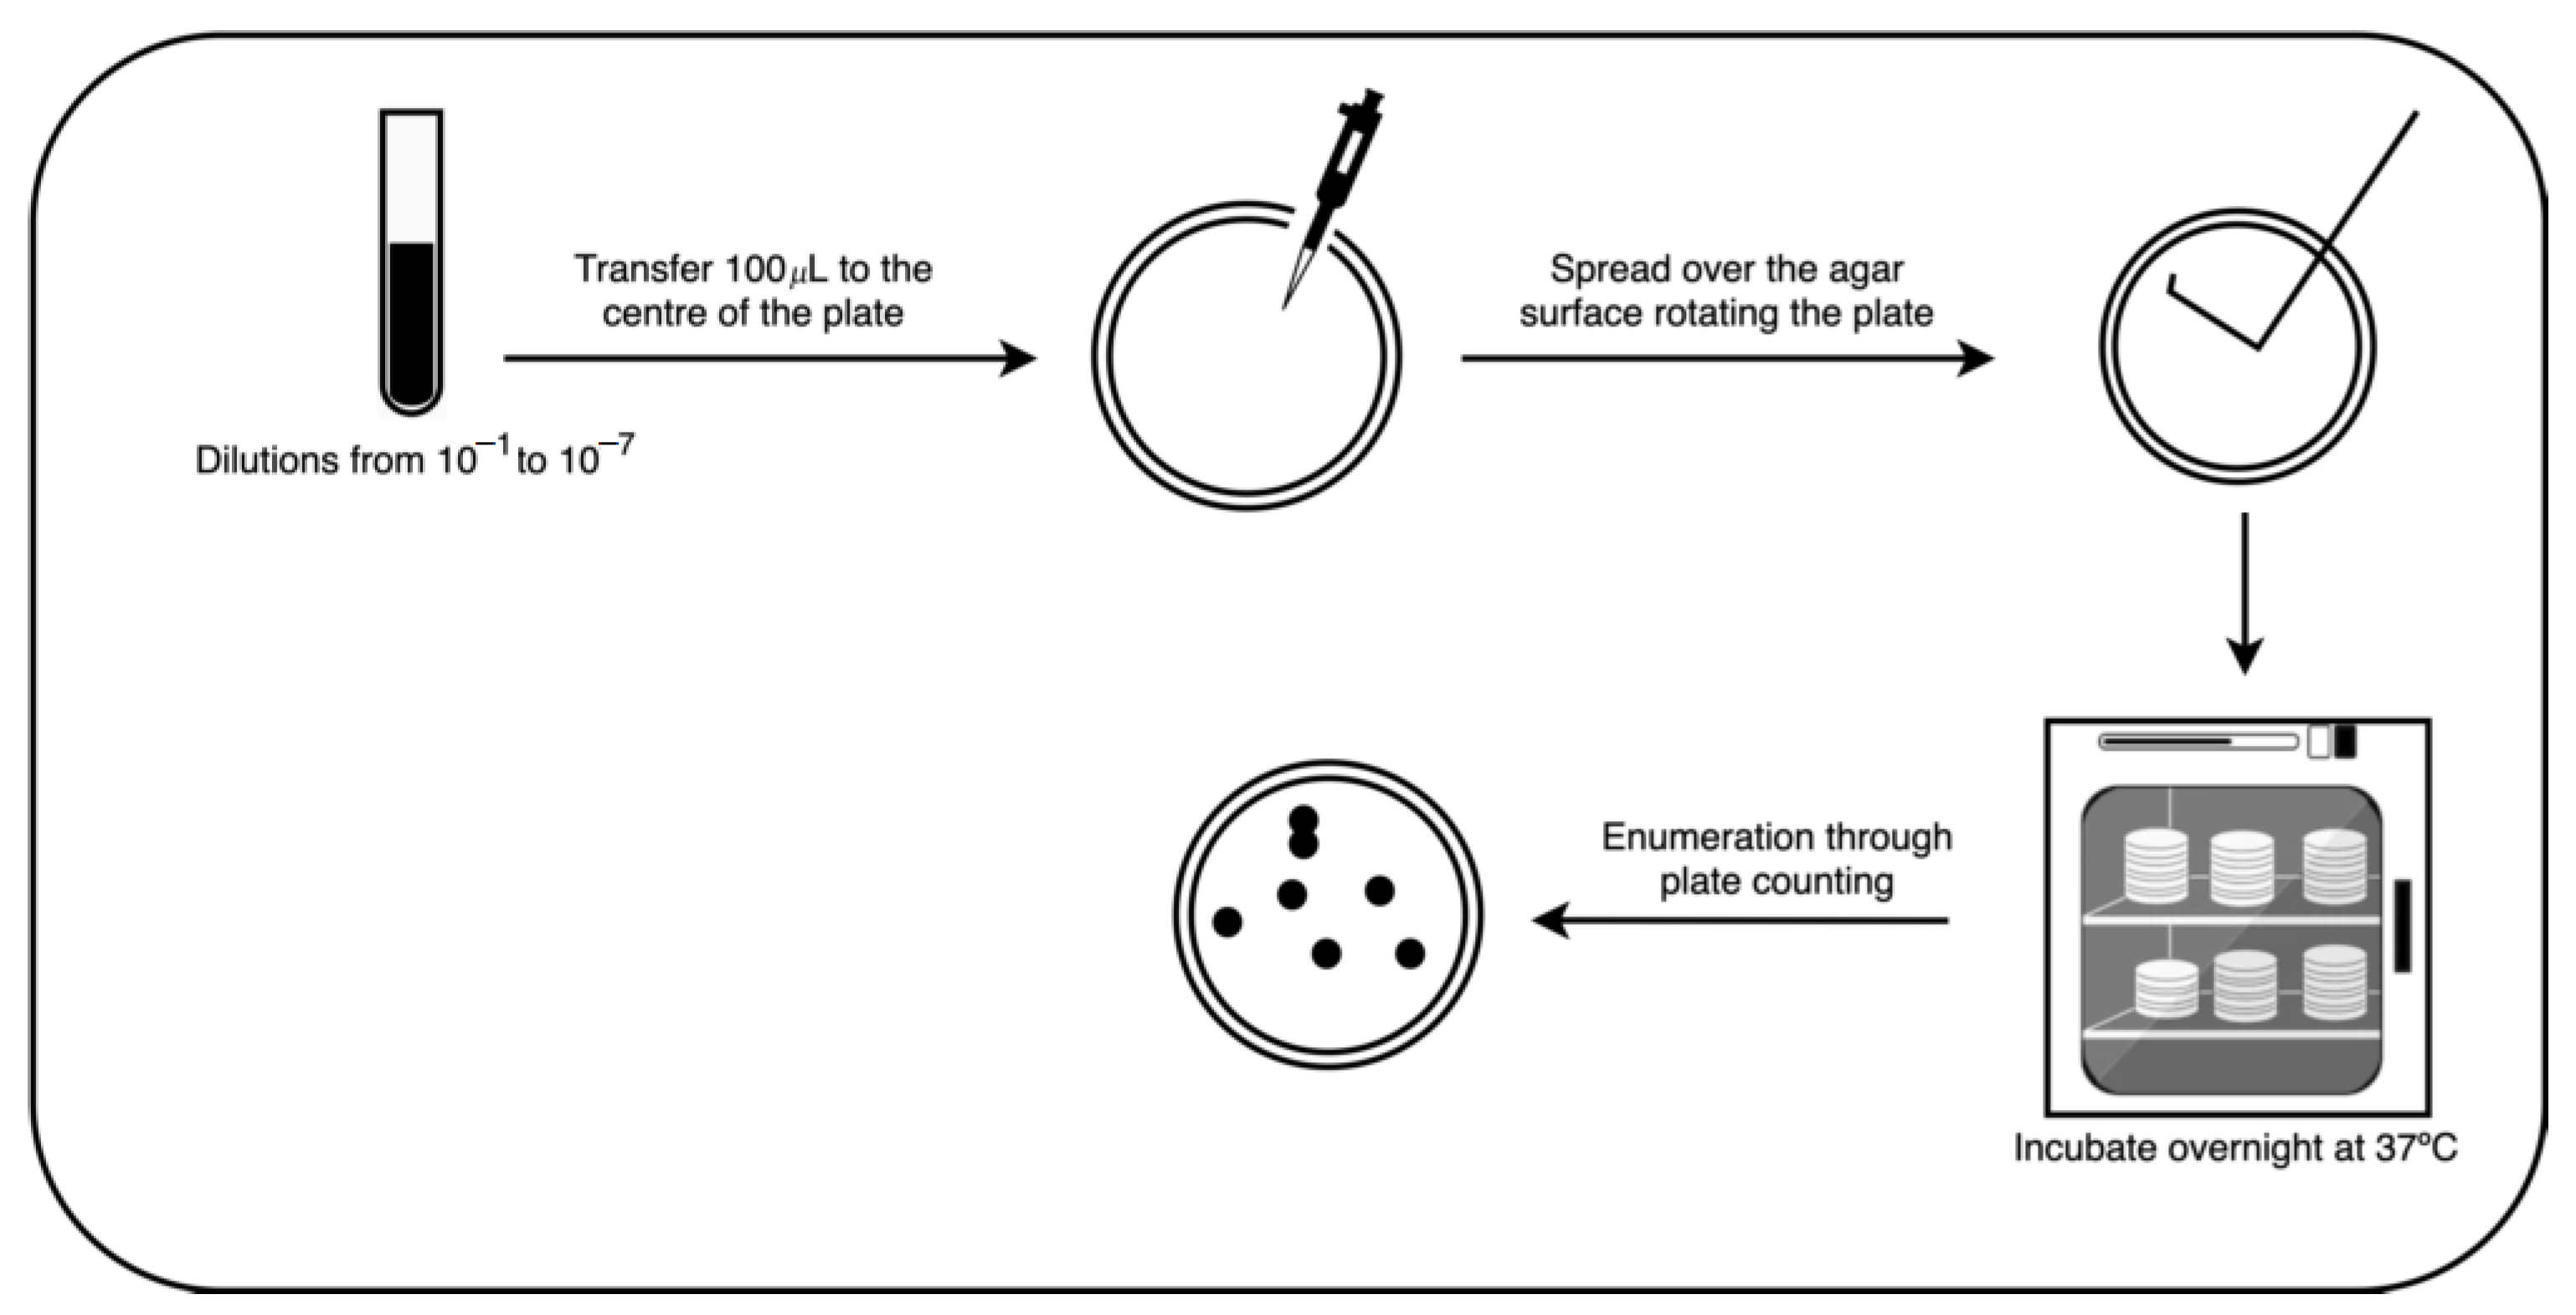
2.1.2. Inoculum Preparation
2.1.3. Serial Dilutions
2.1.4. Spread Plate Method
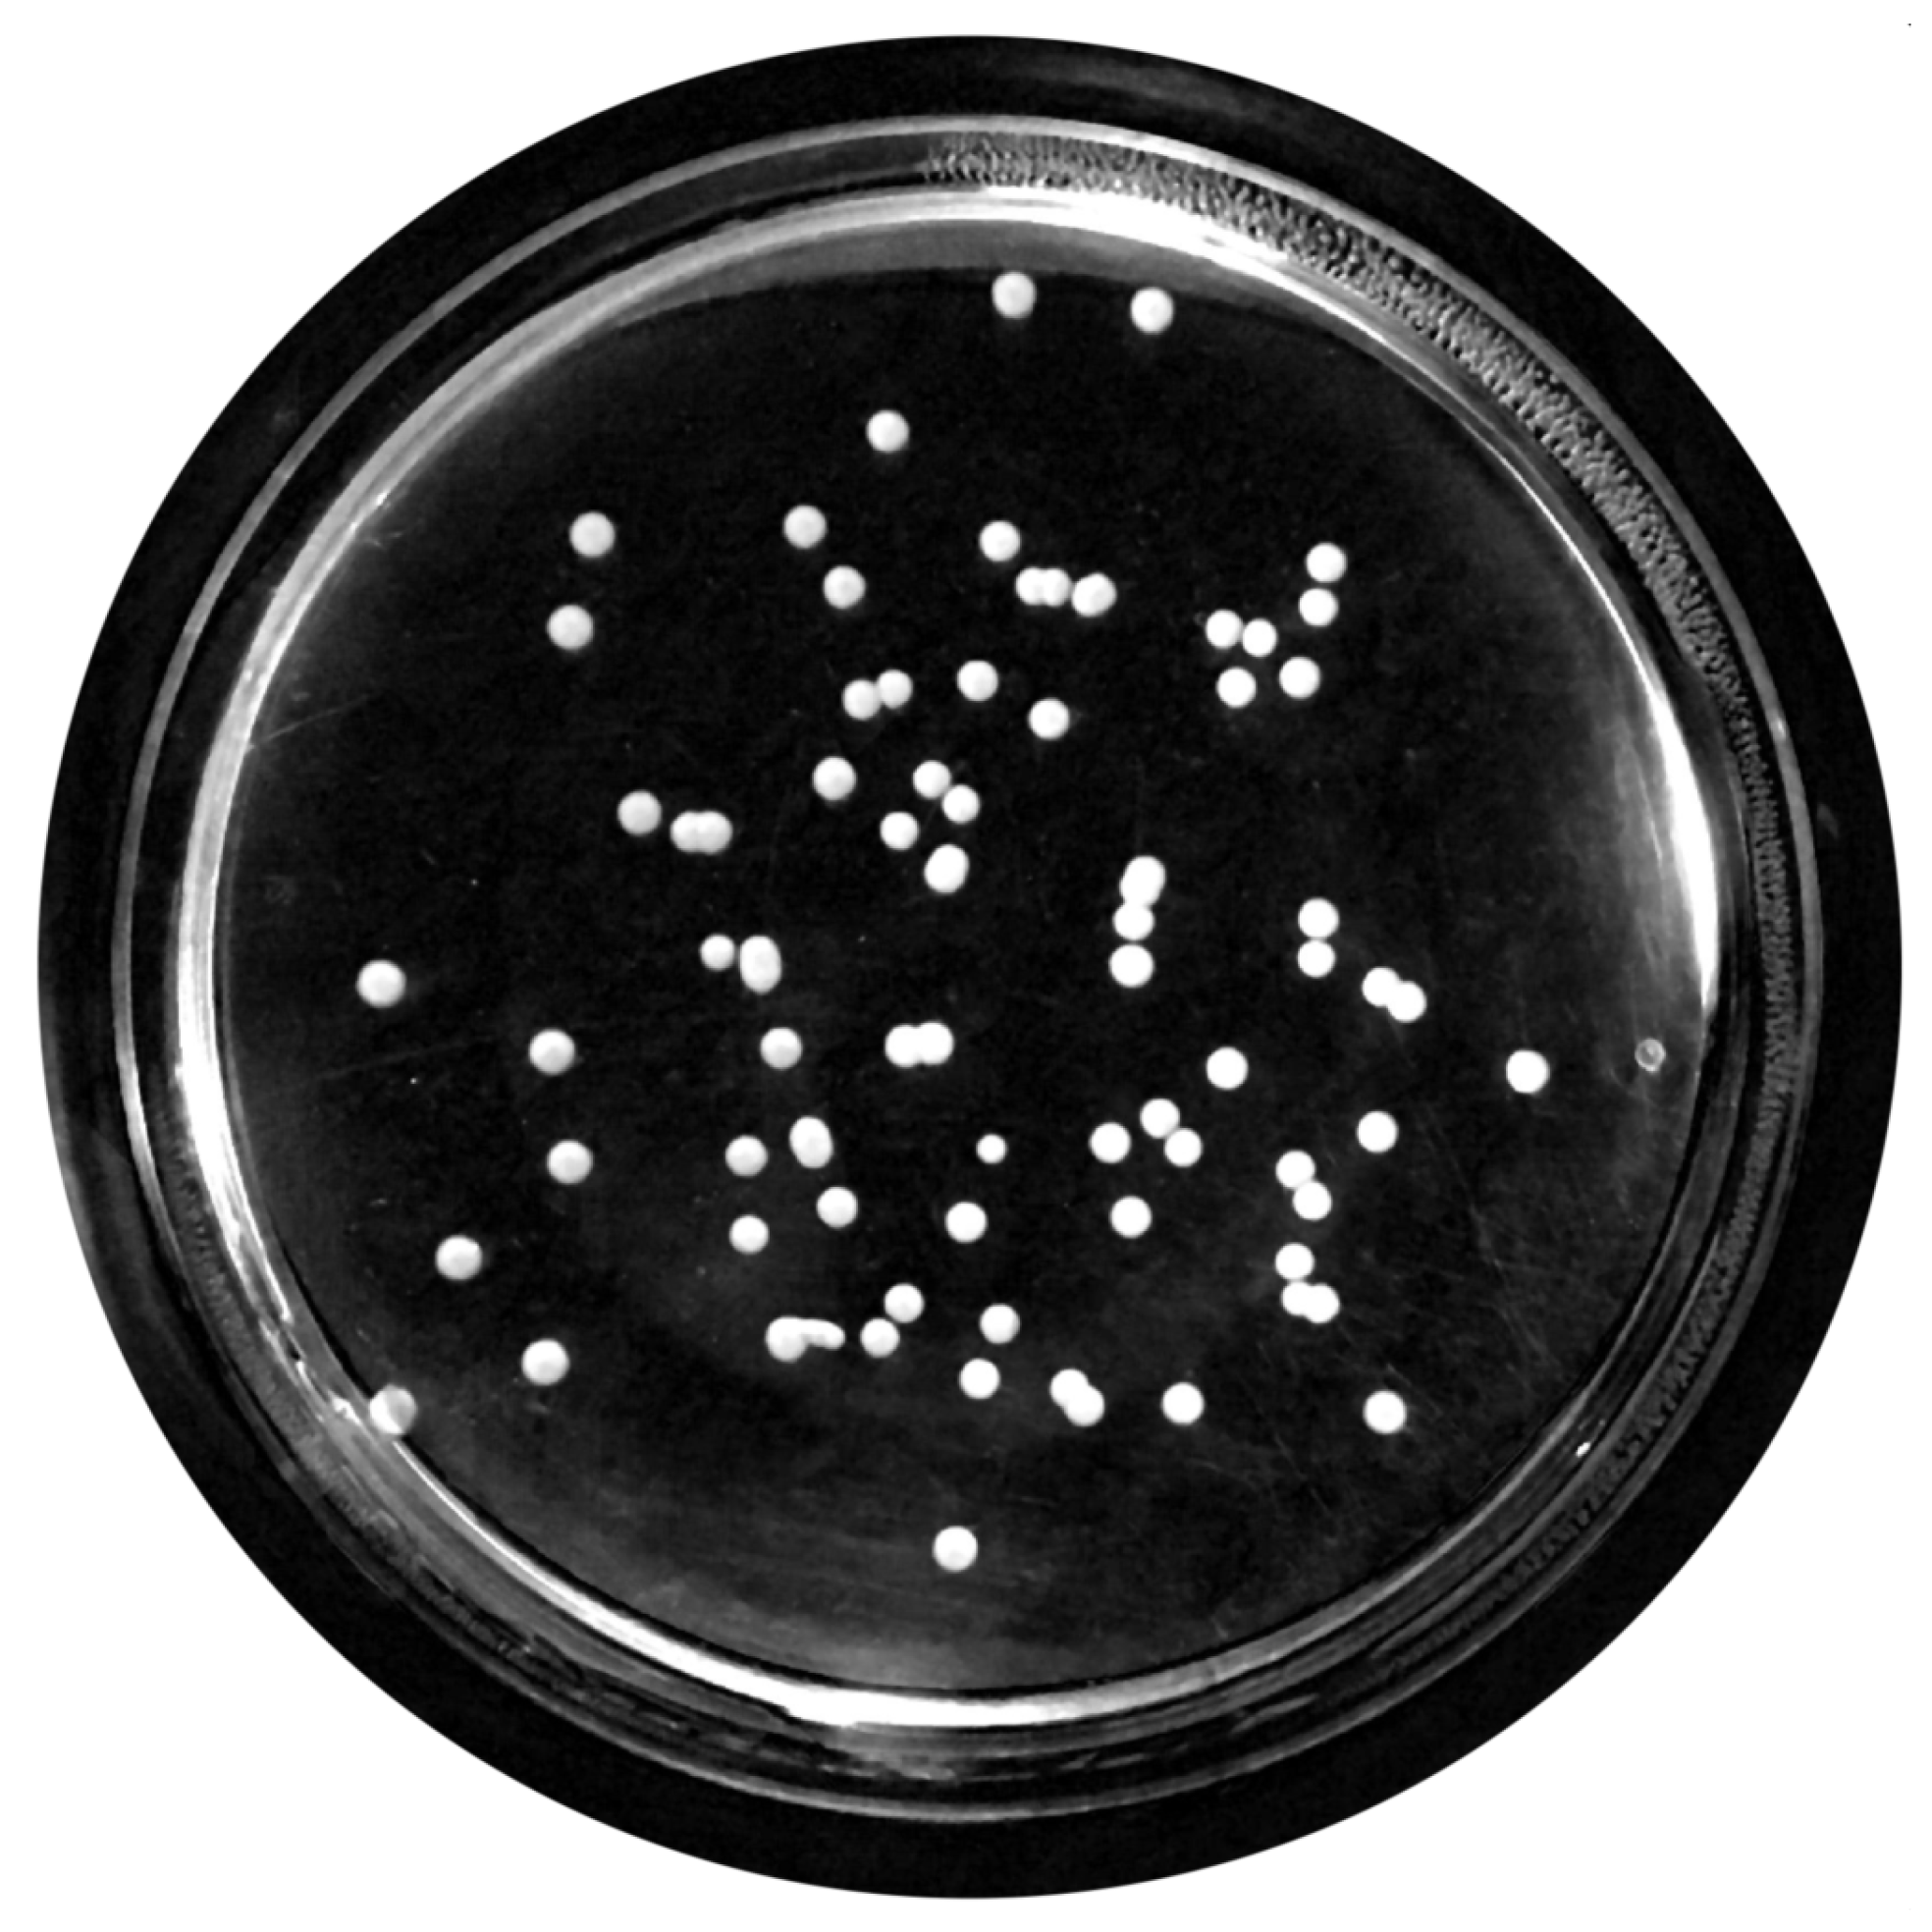
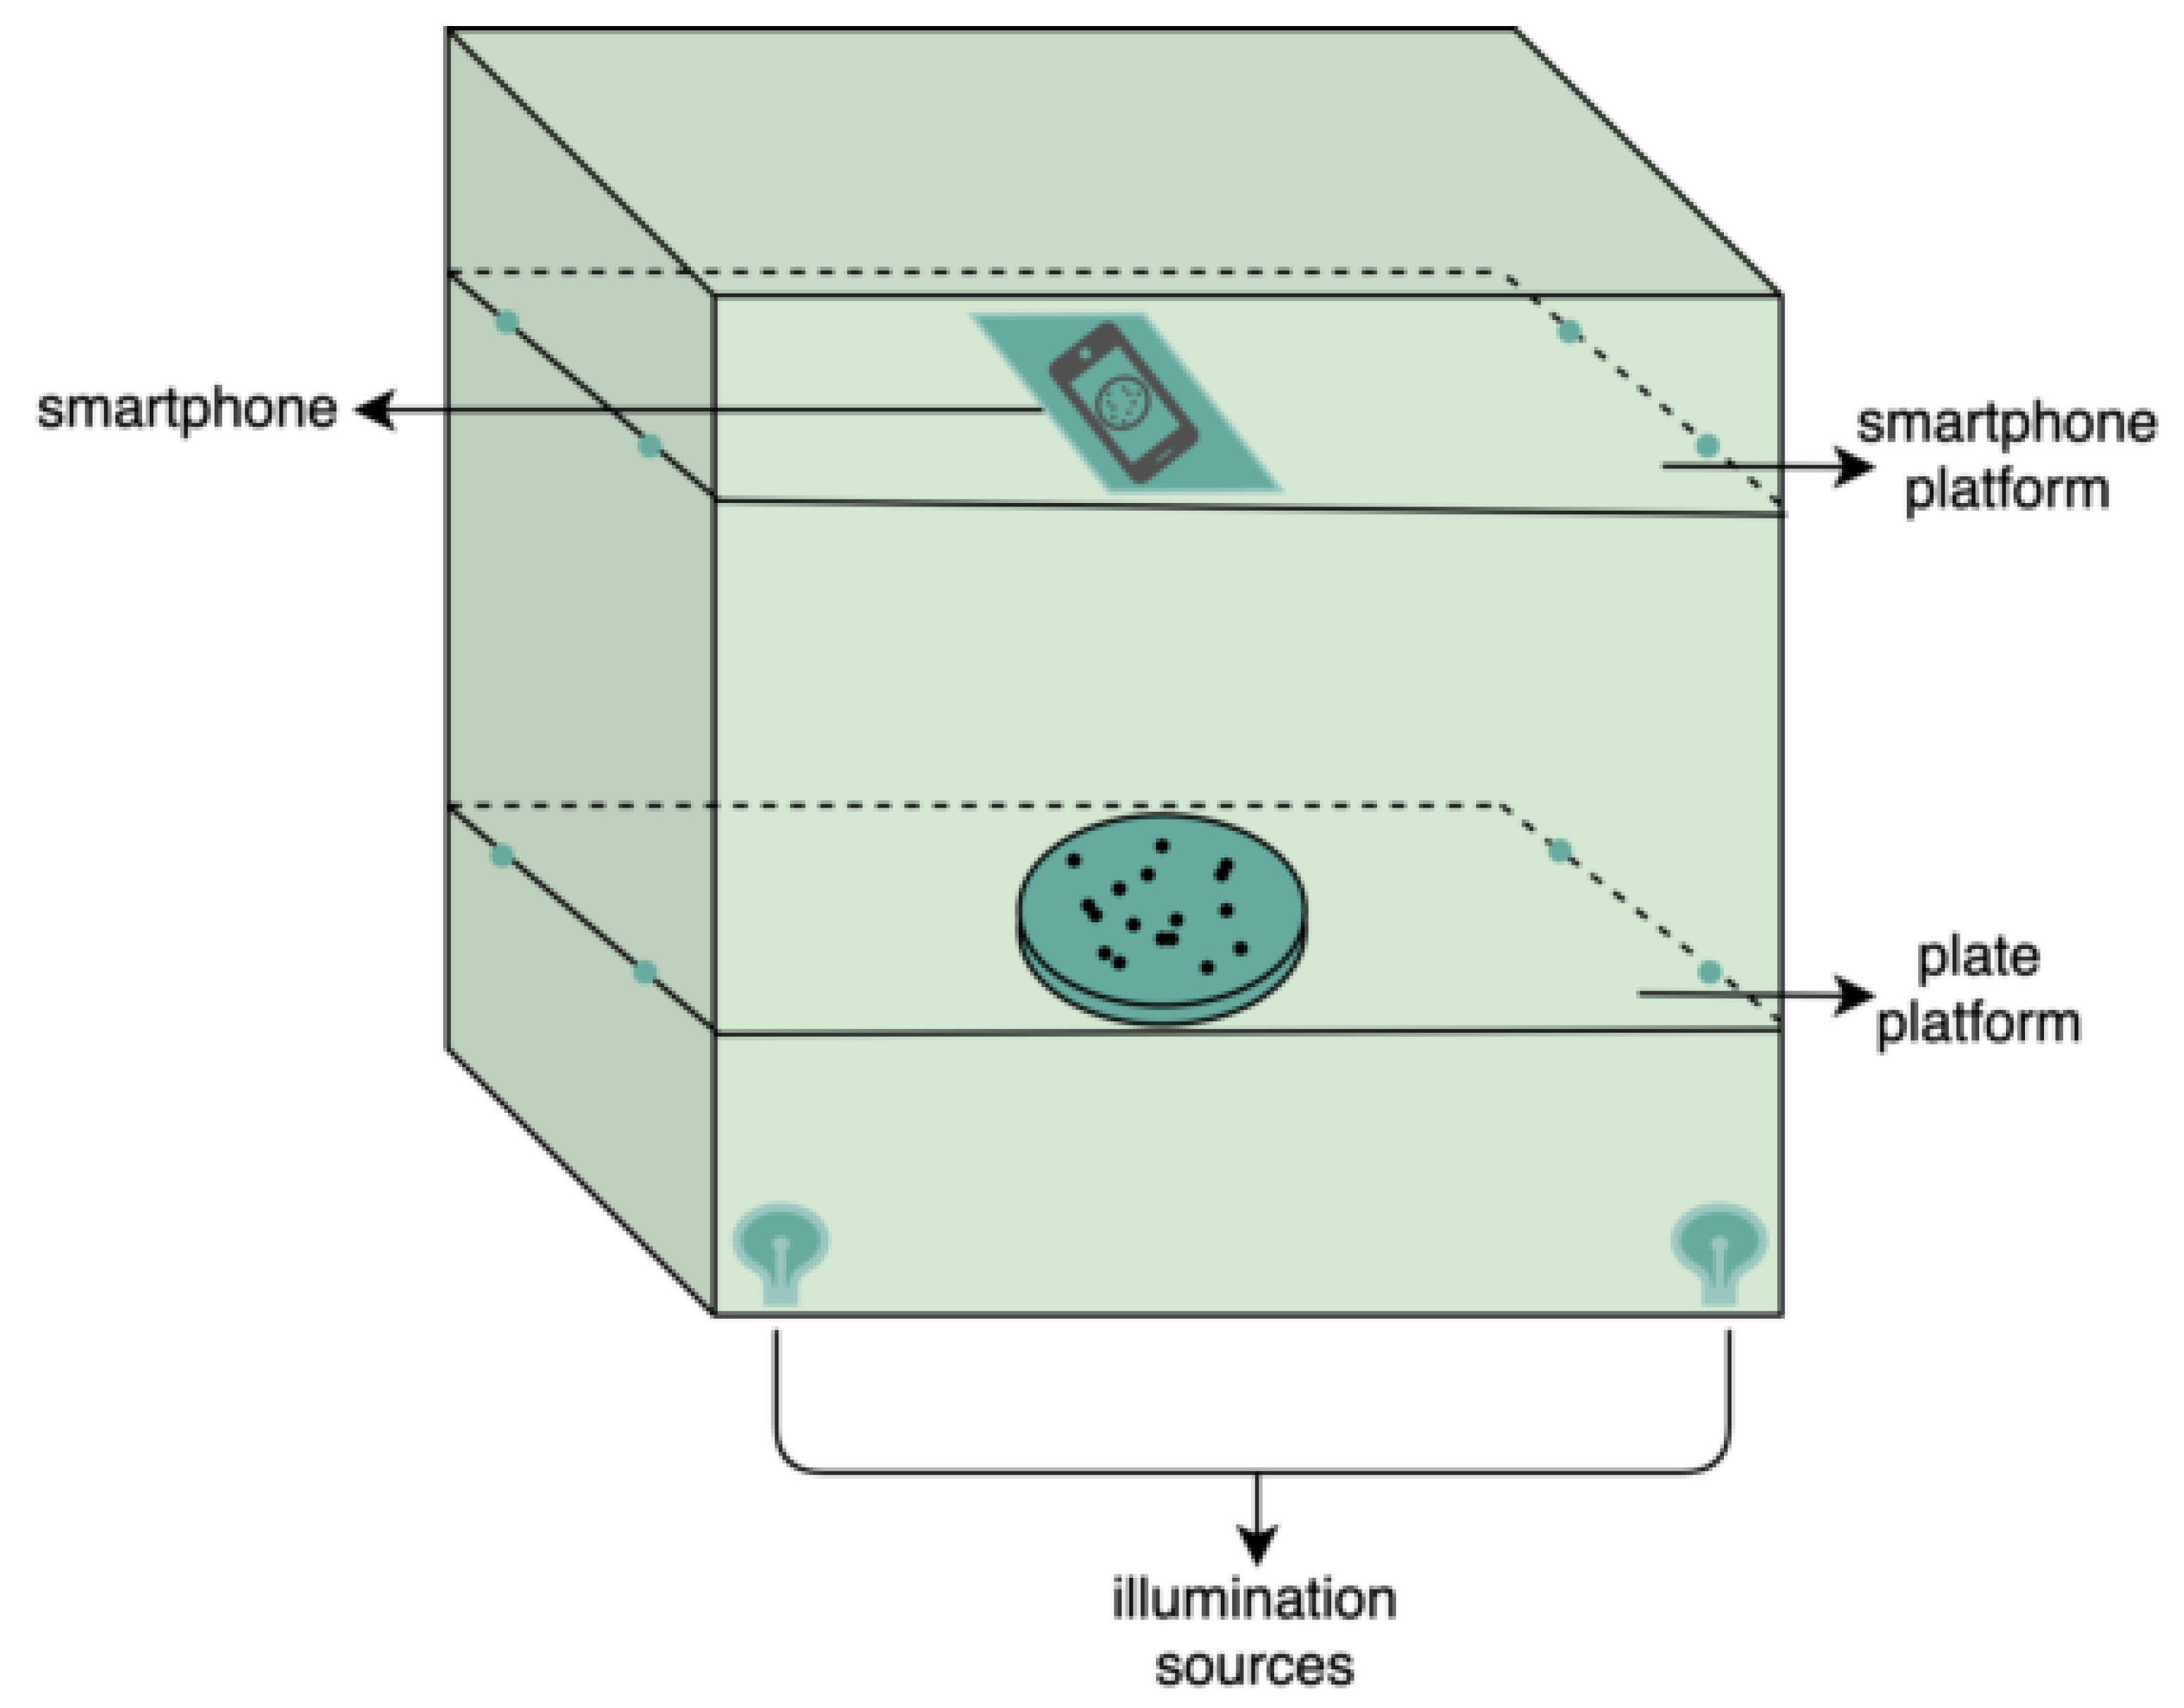
2.2. Image Database Collection
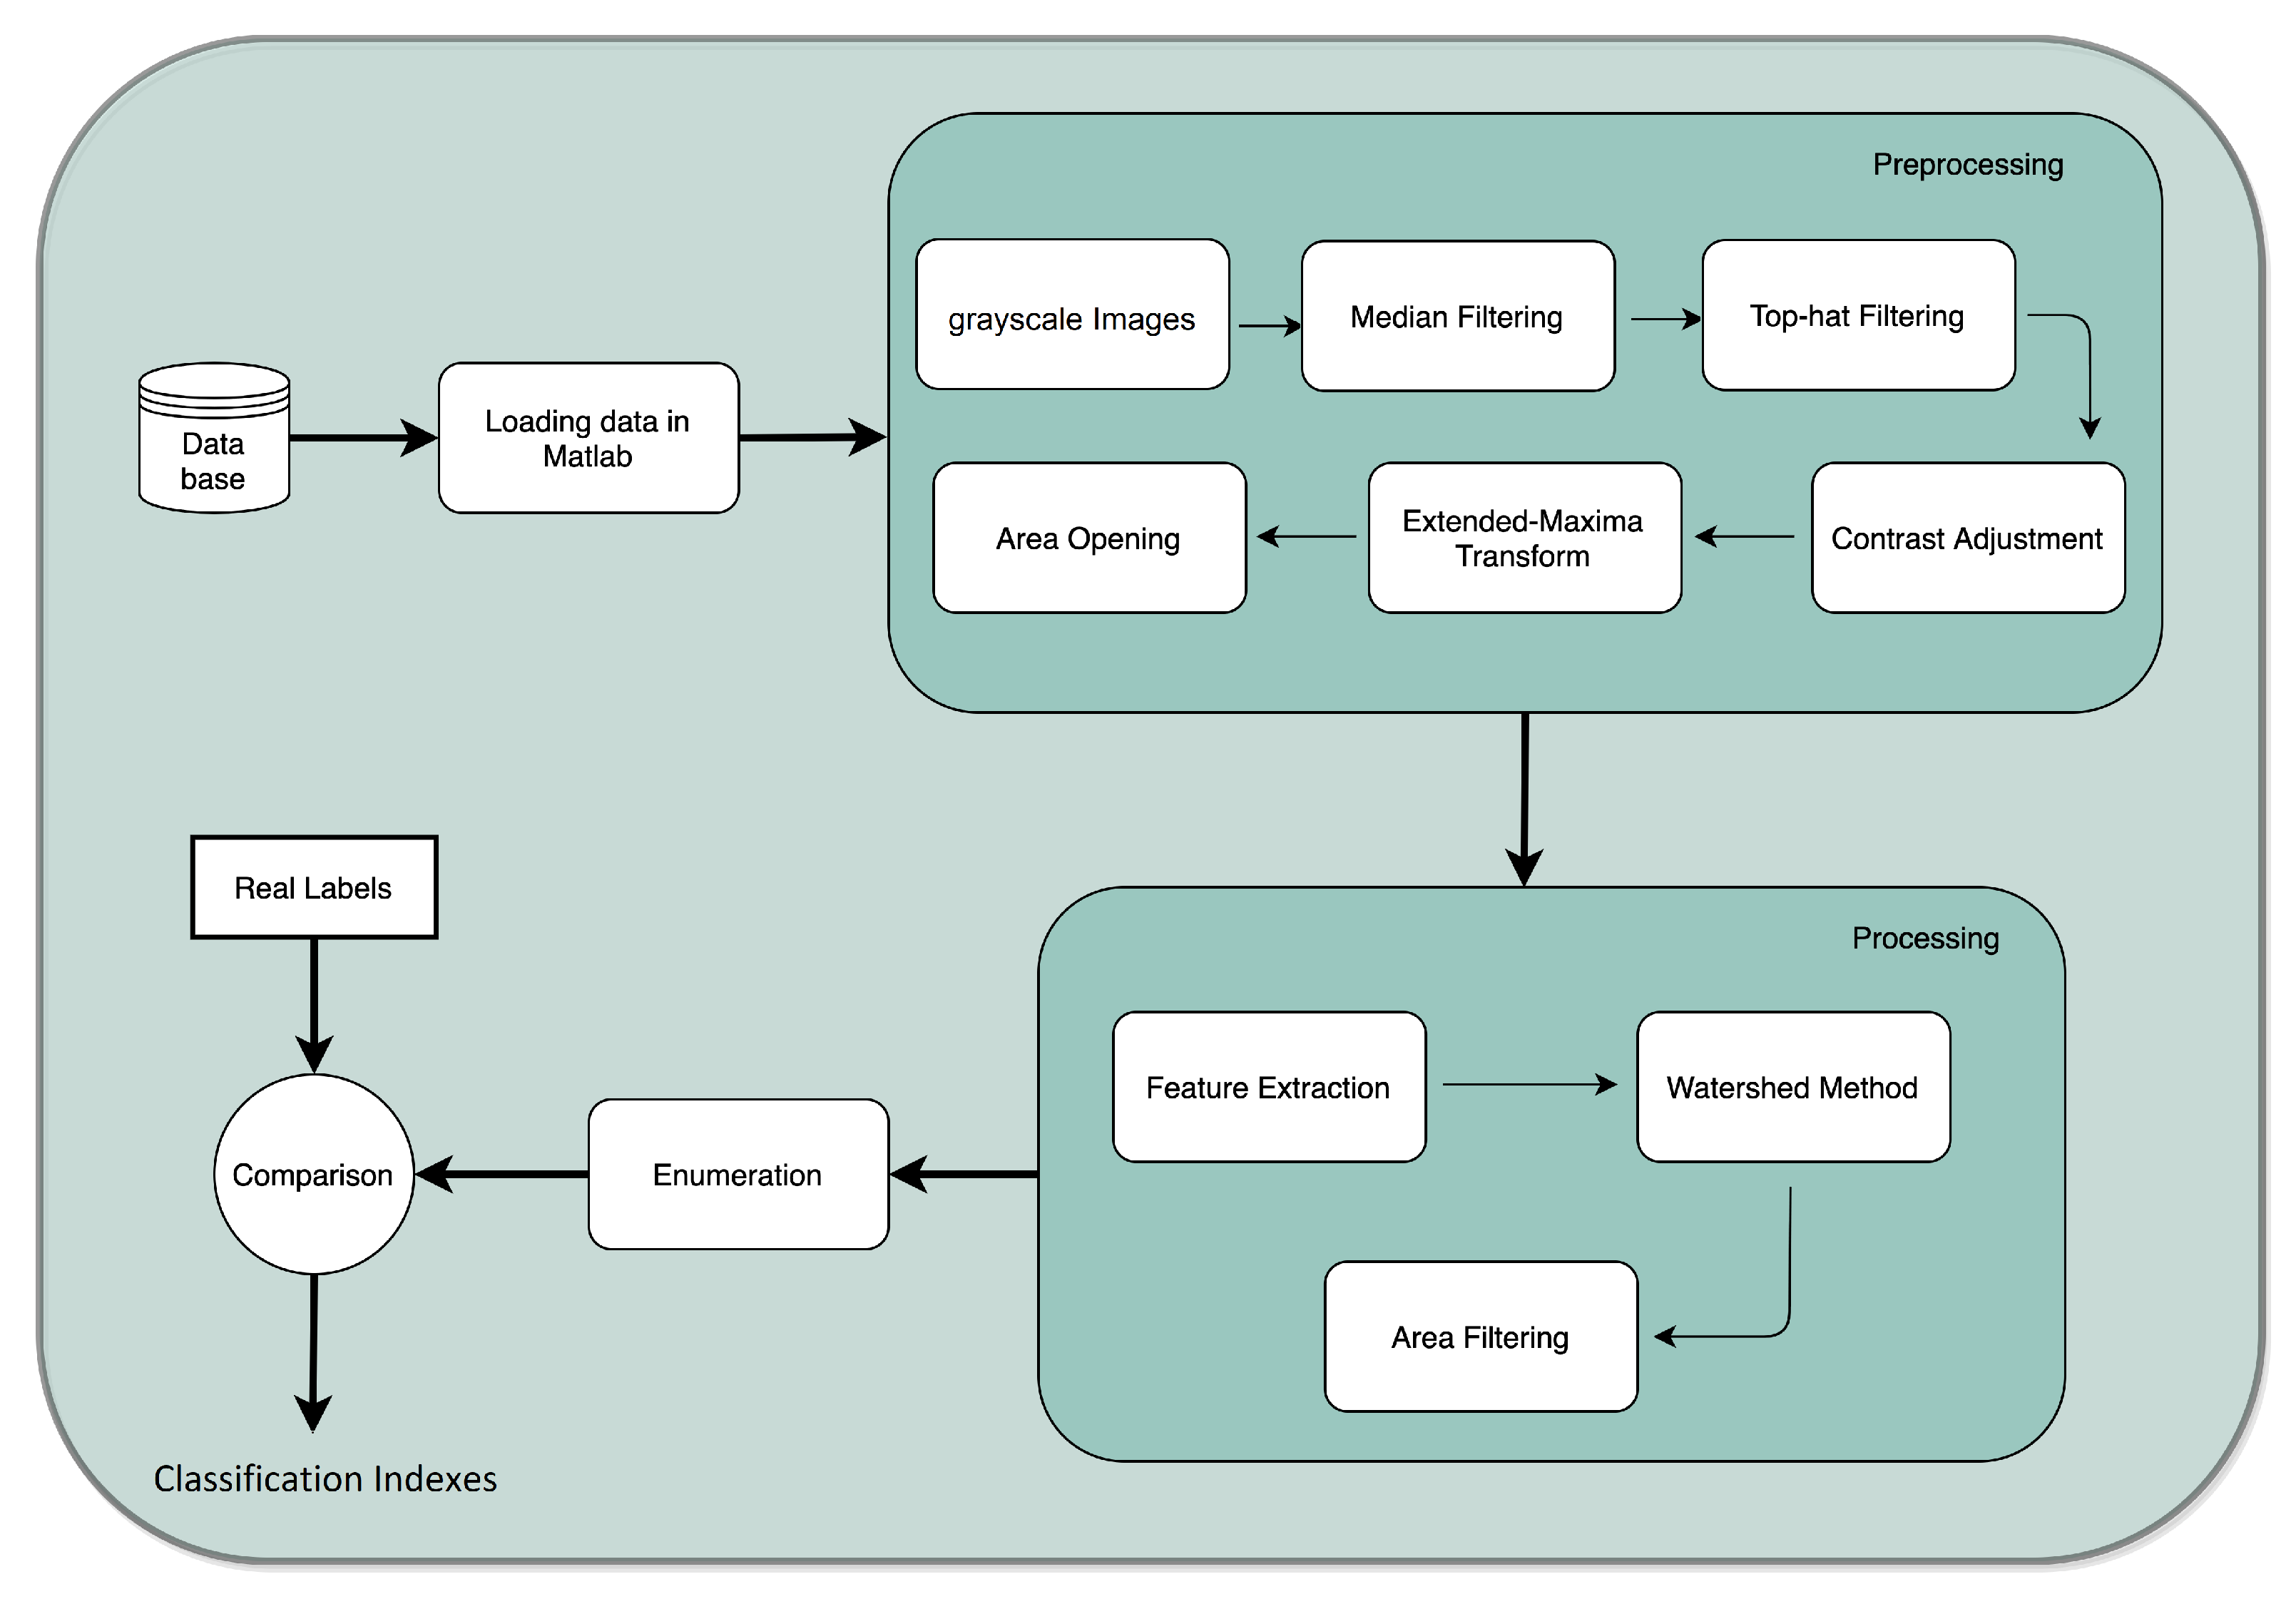
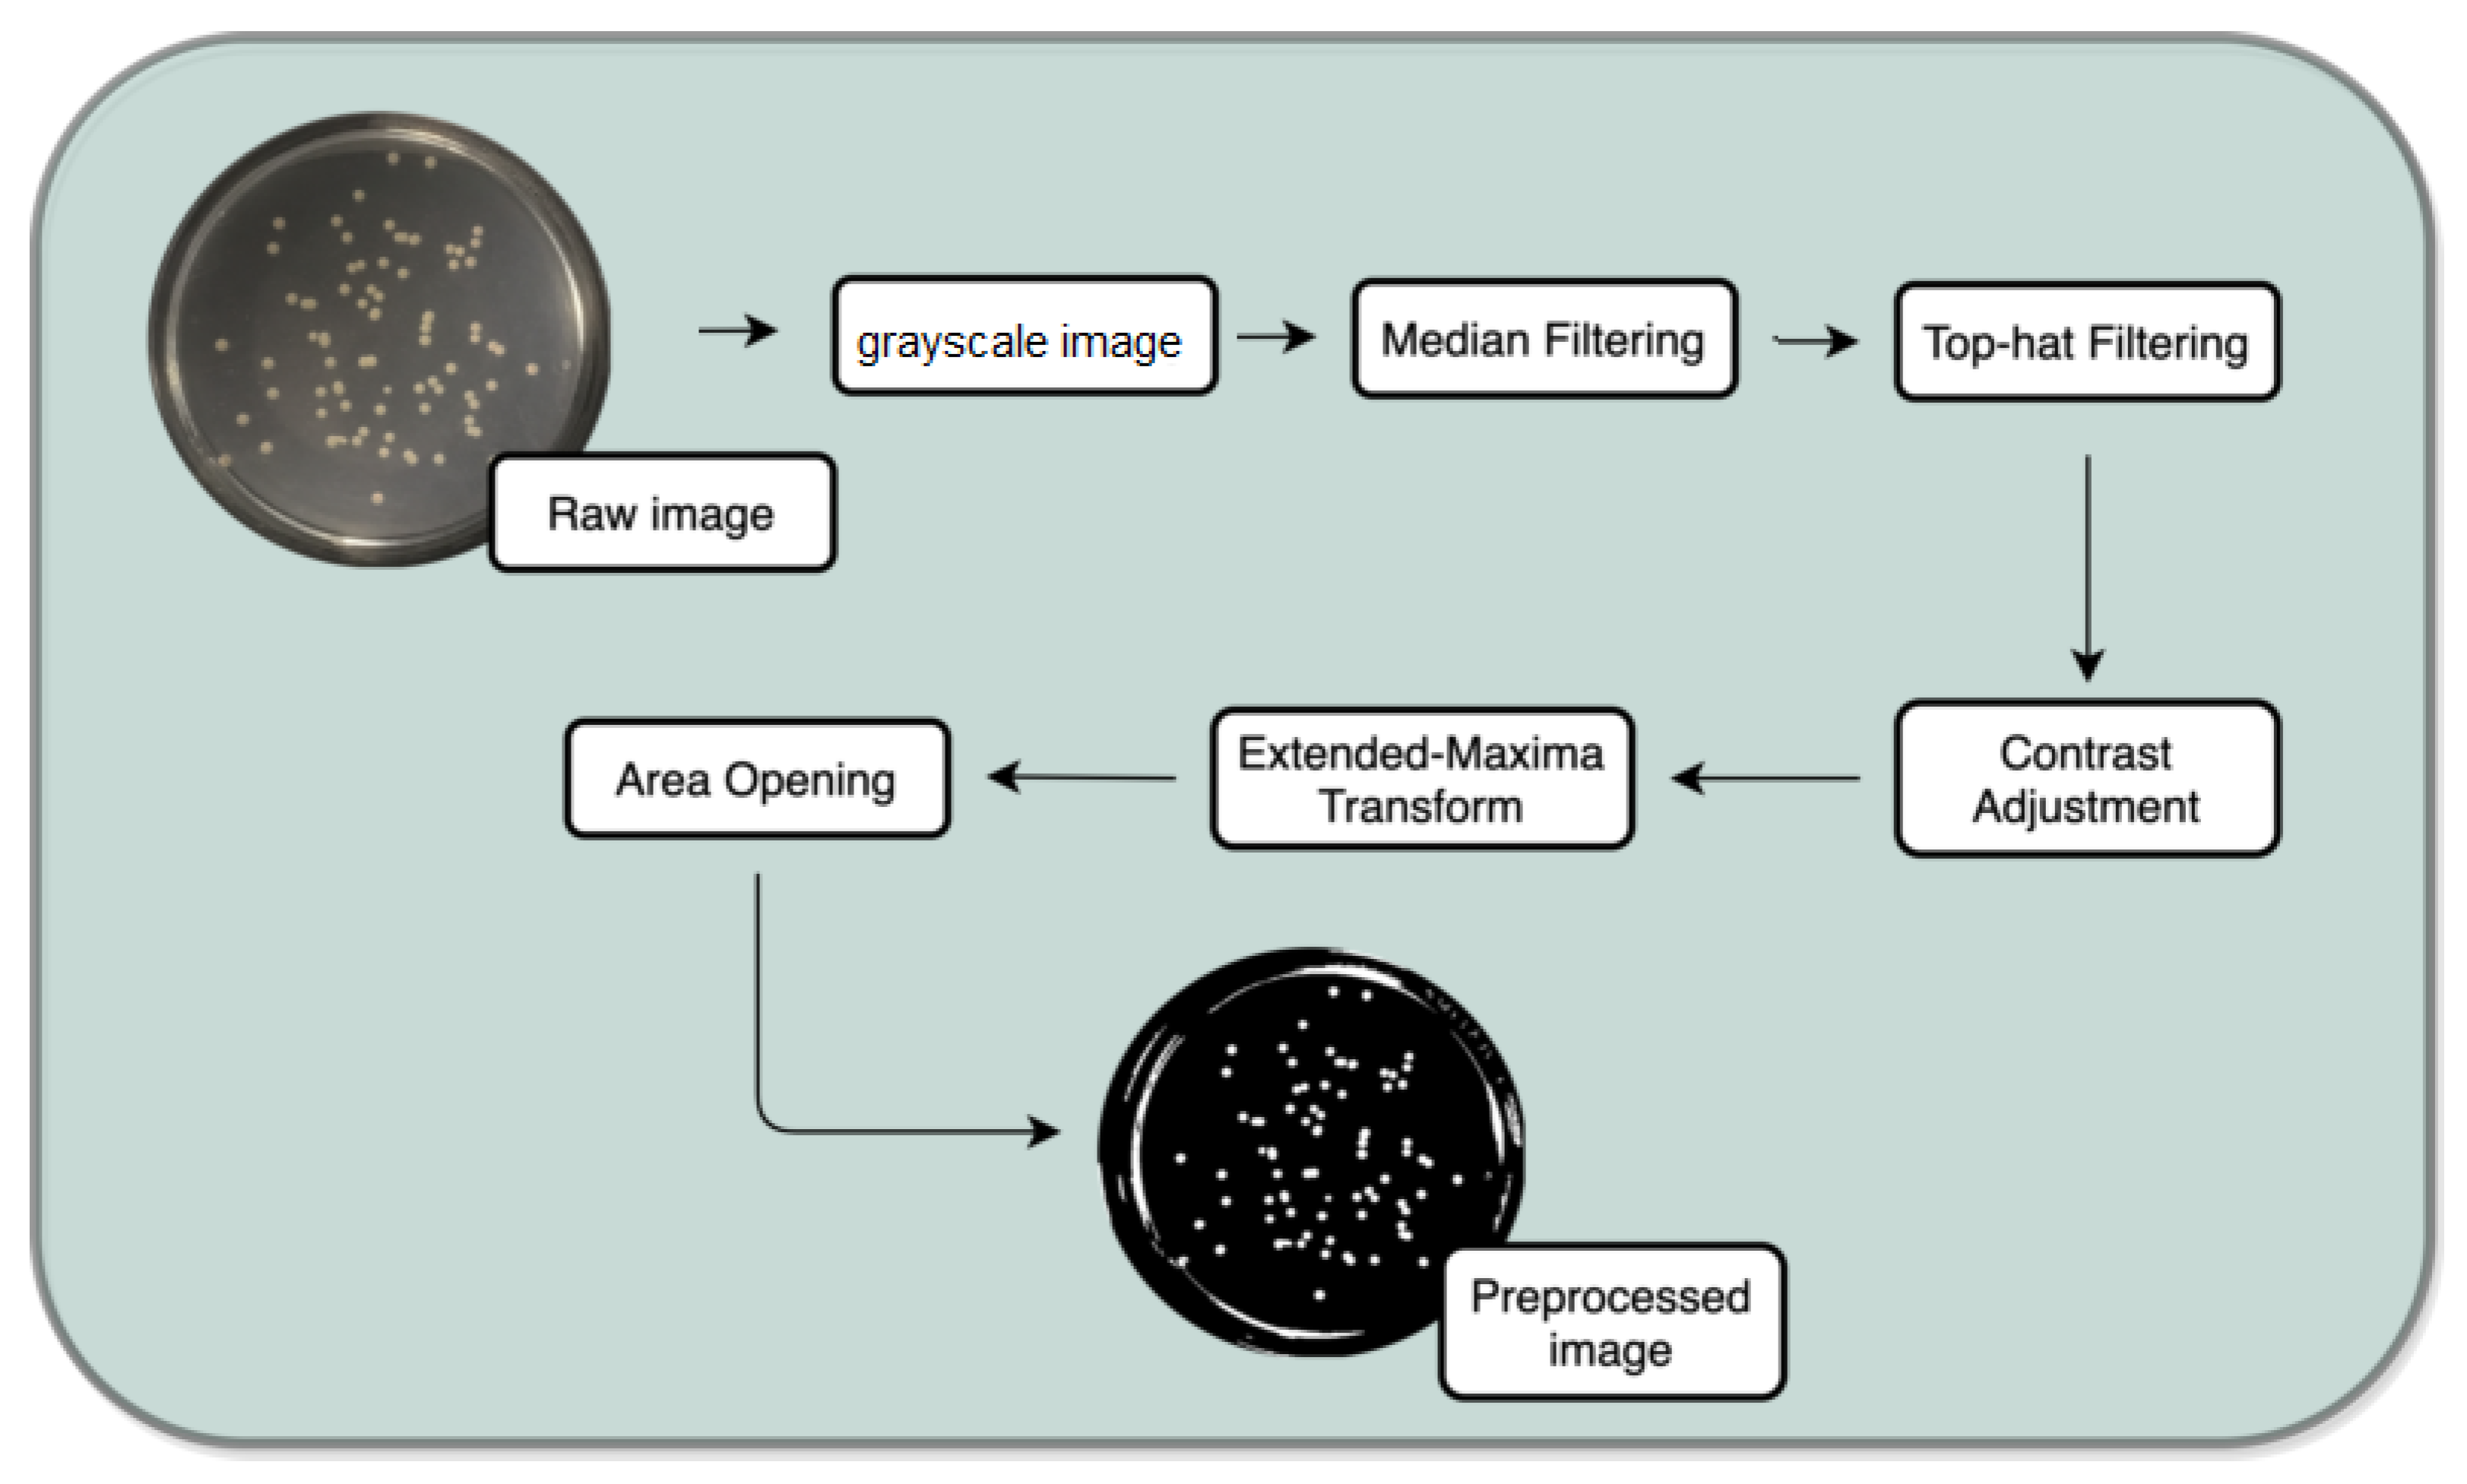
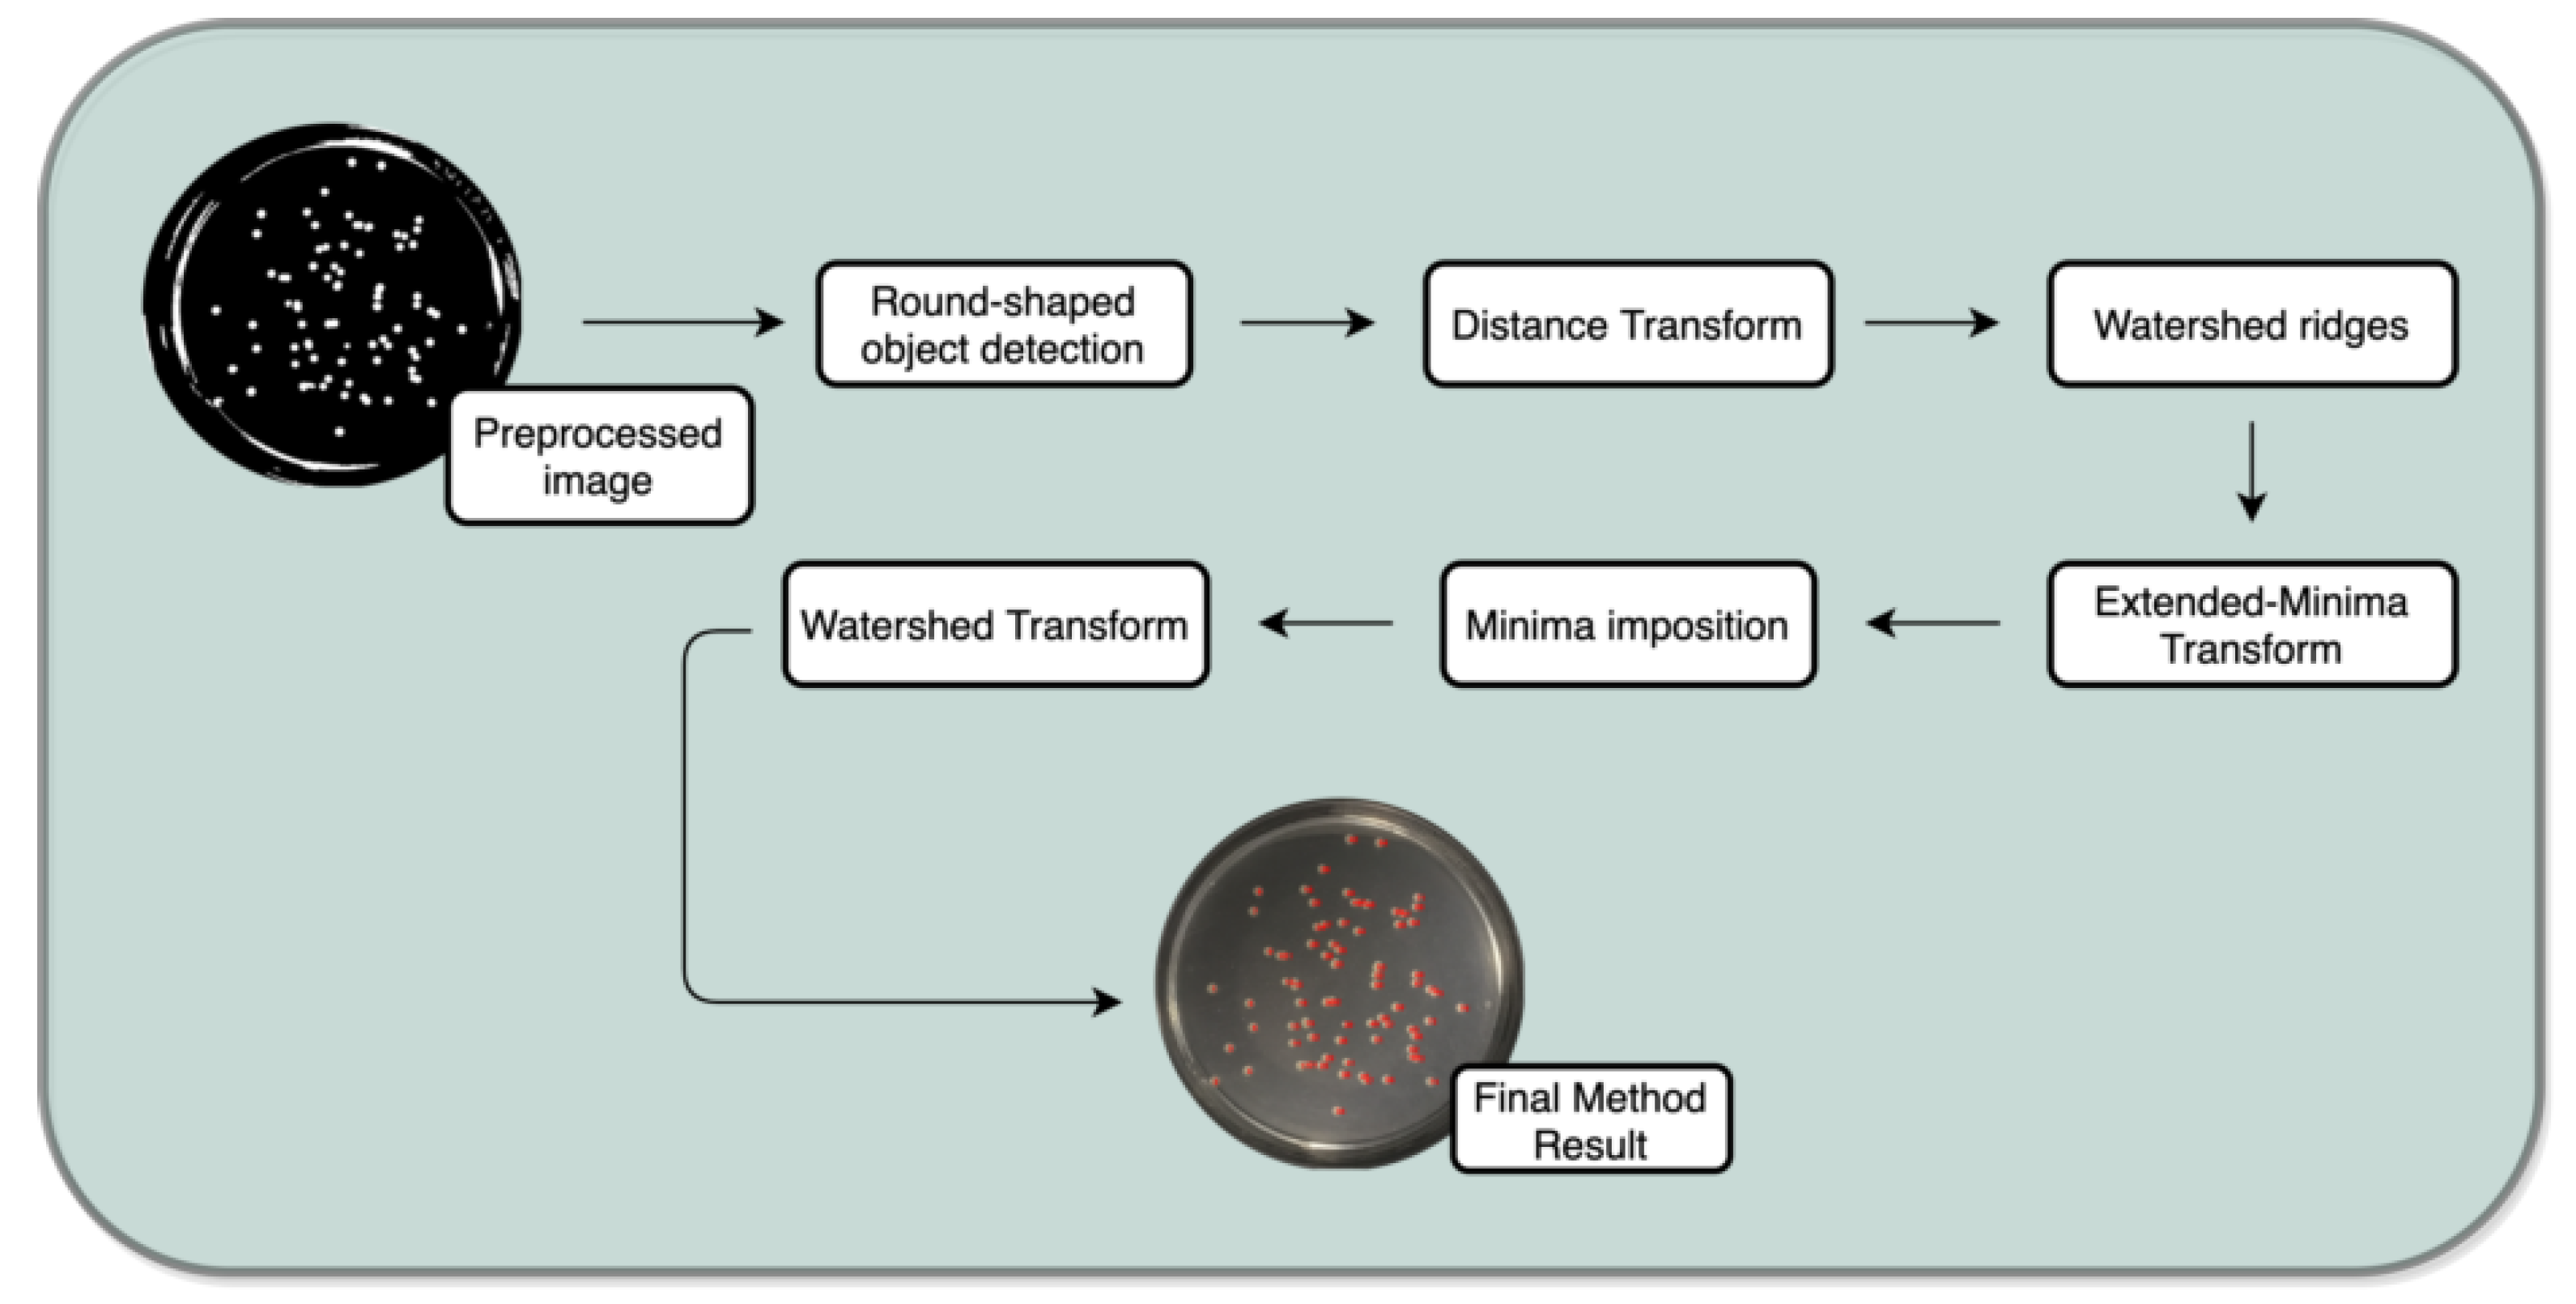
2.3. Semi-Automatic Enumeration Process Method
Preprocessing
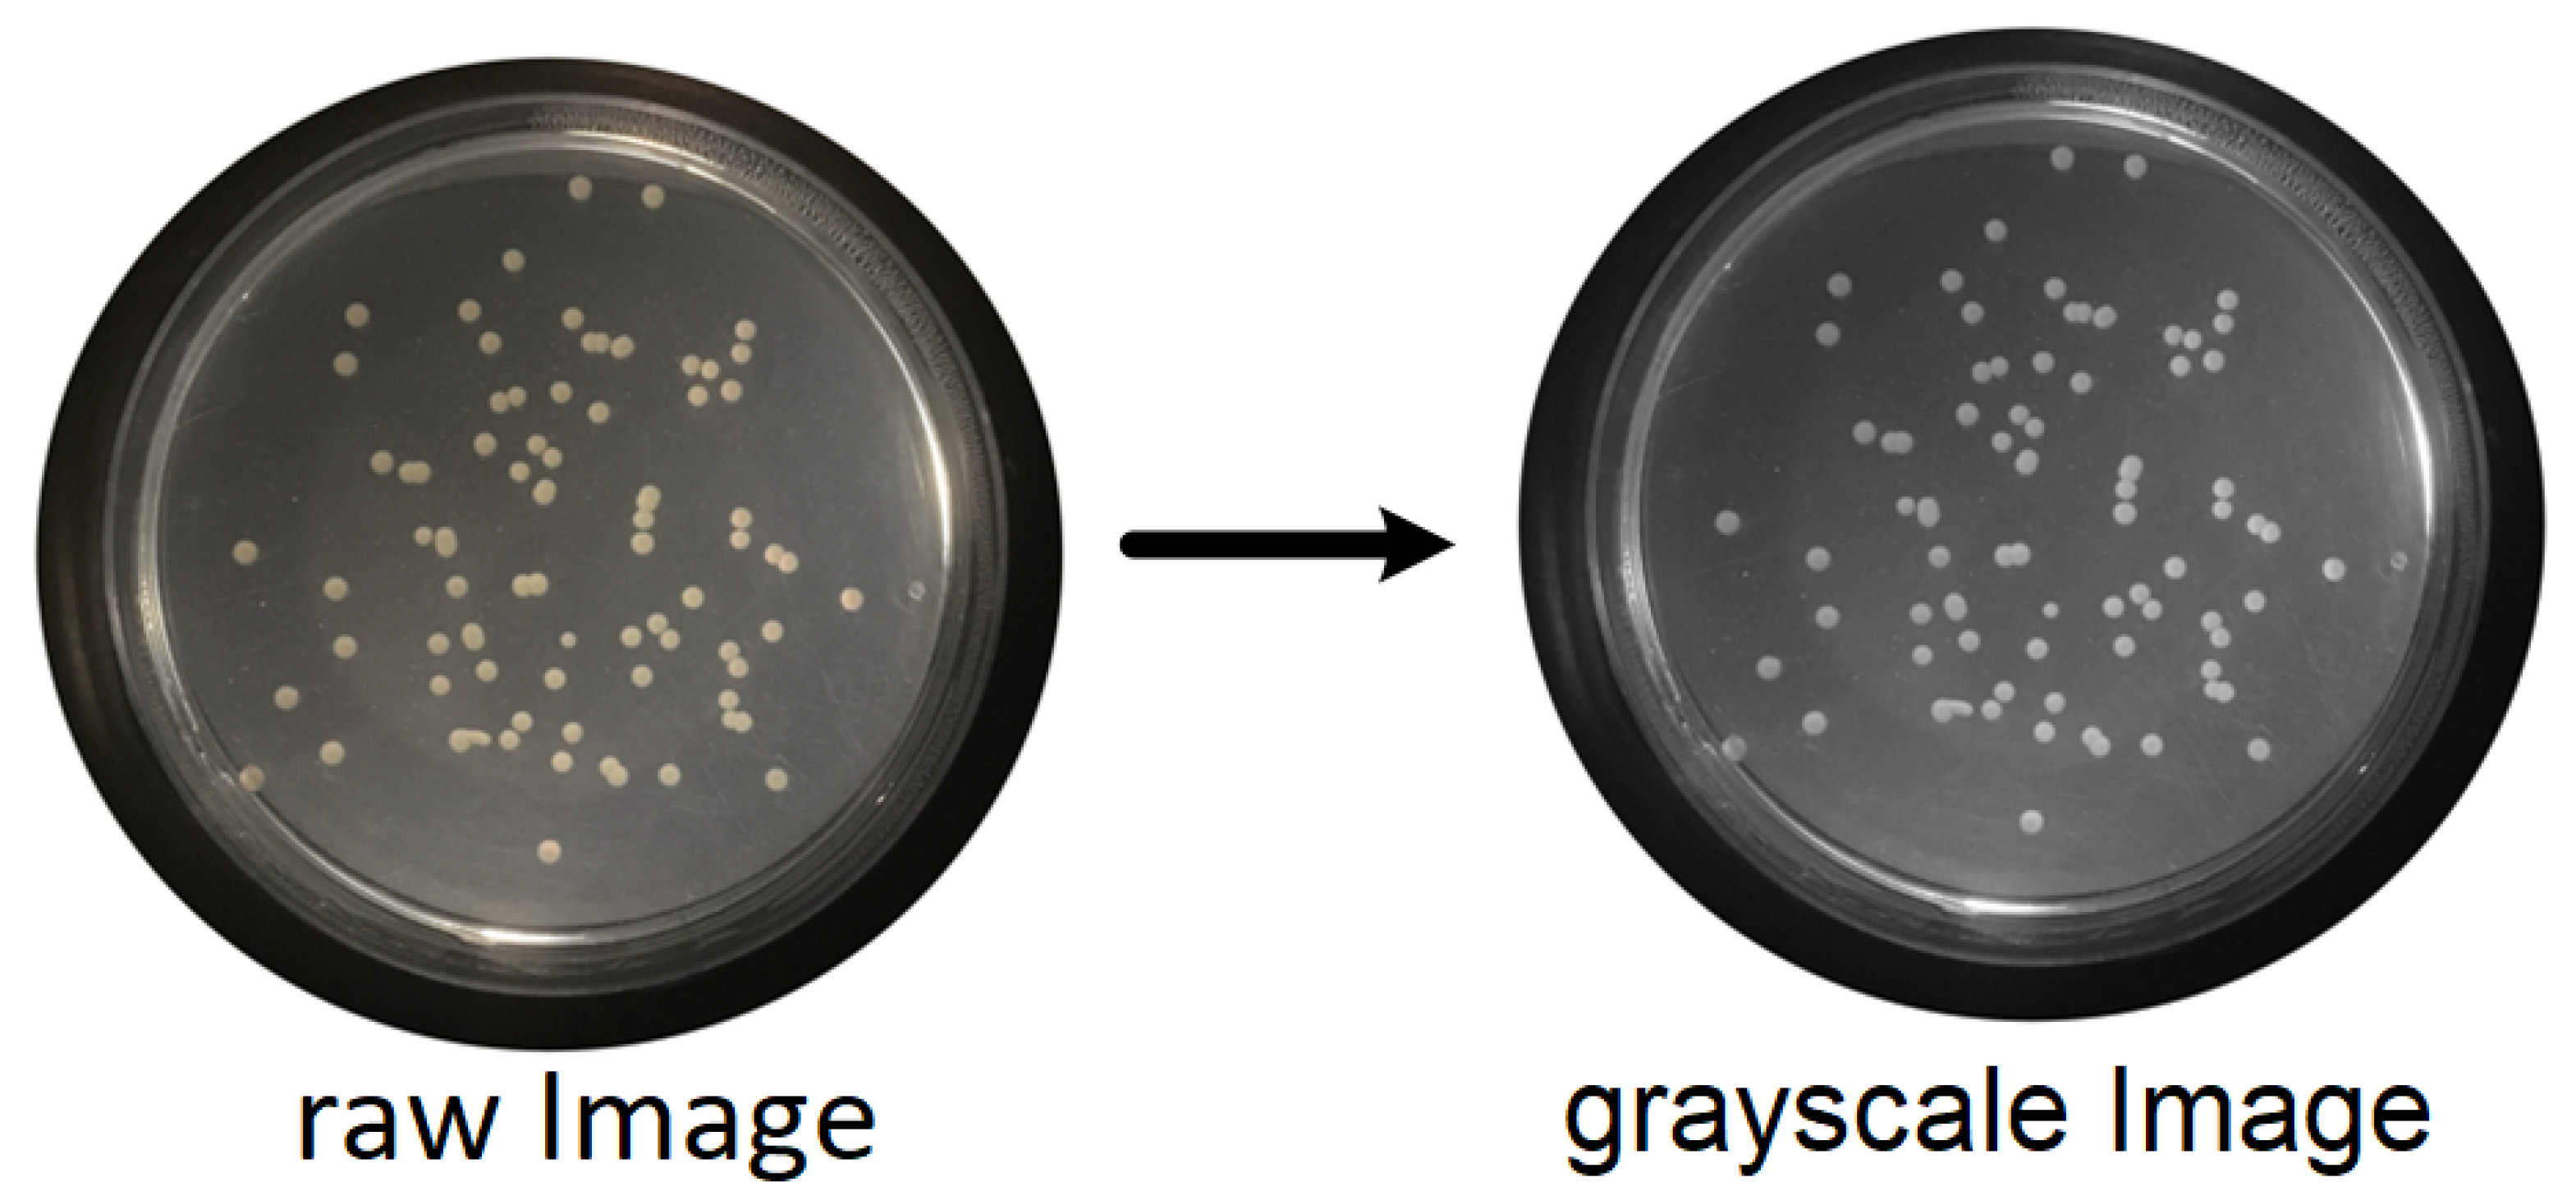
- RGB (red, green, blue components-color) images to grayscale images:
- Median Filtering:
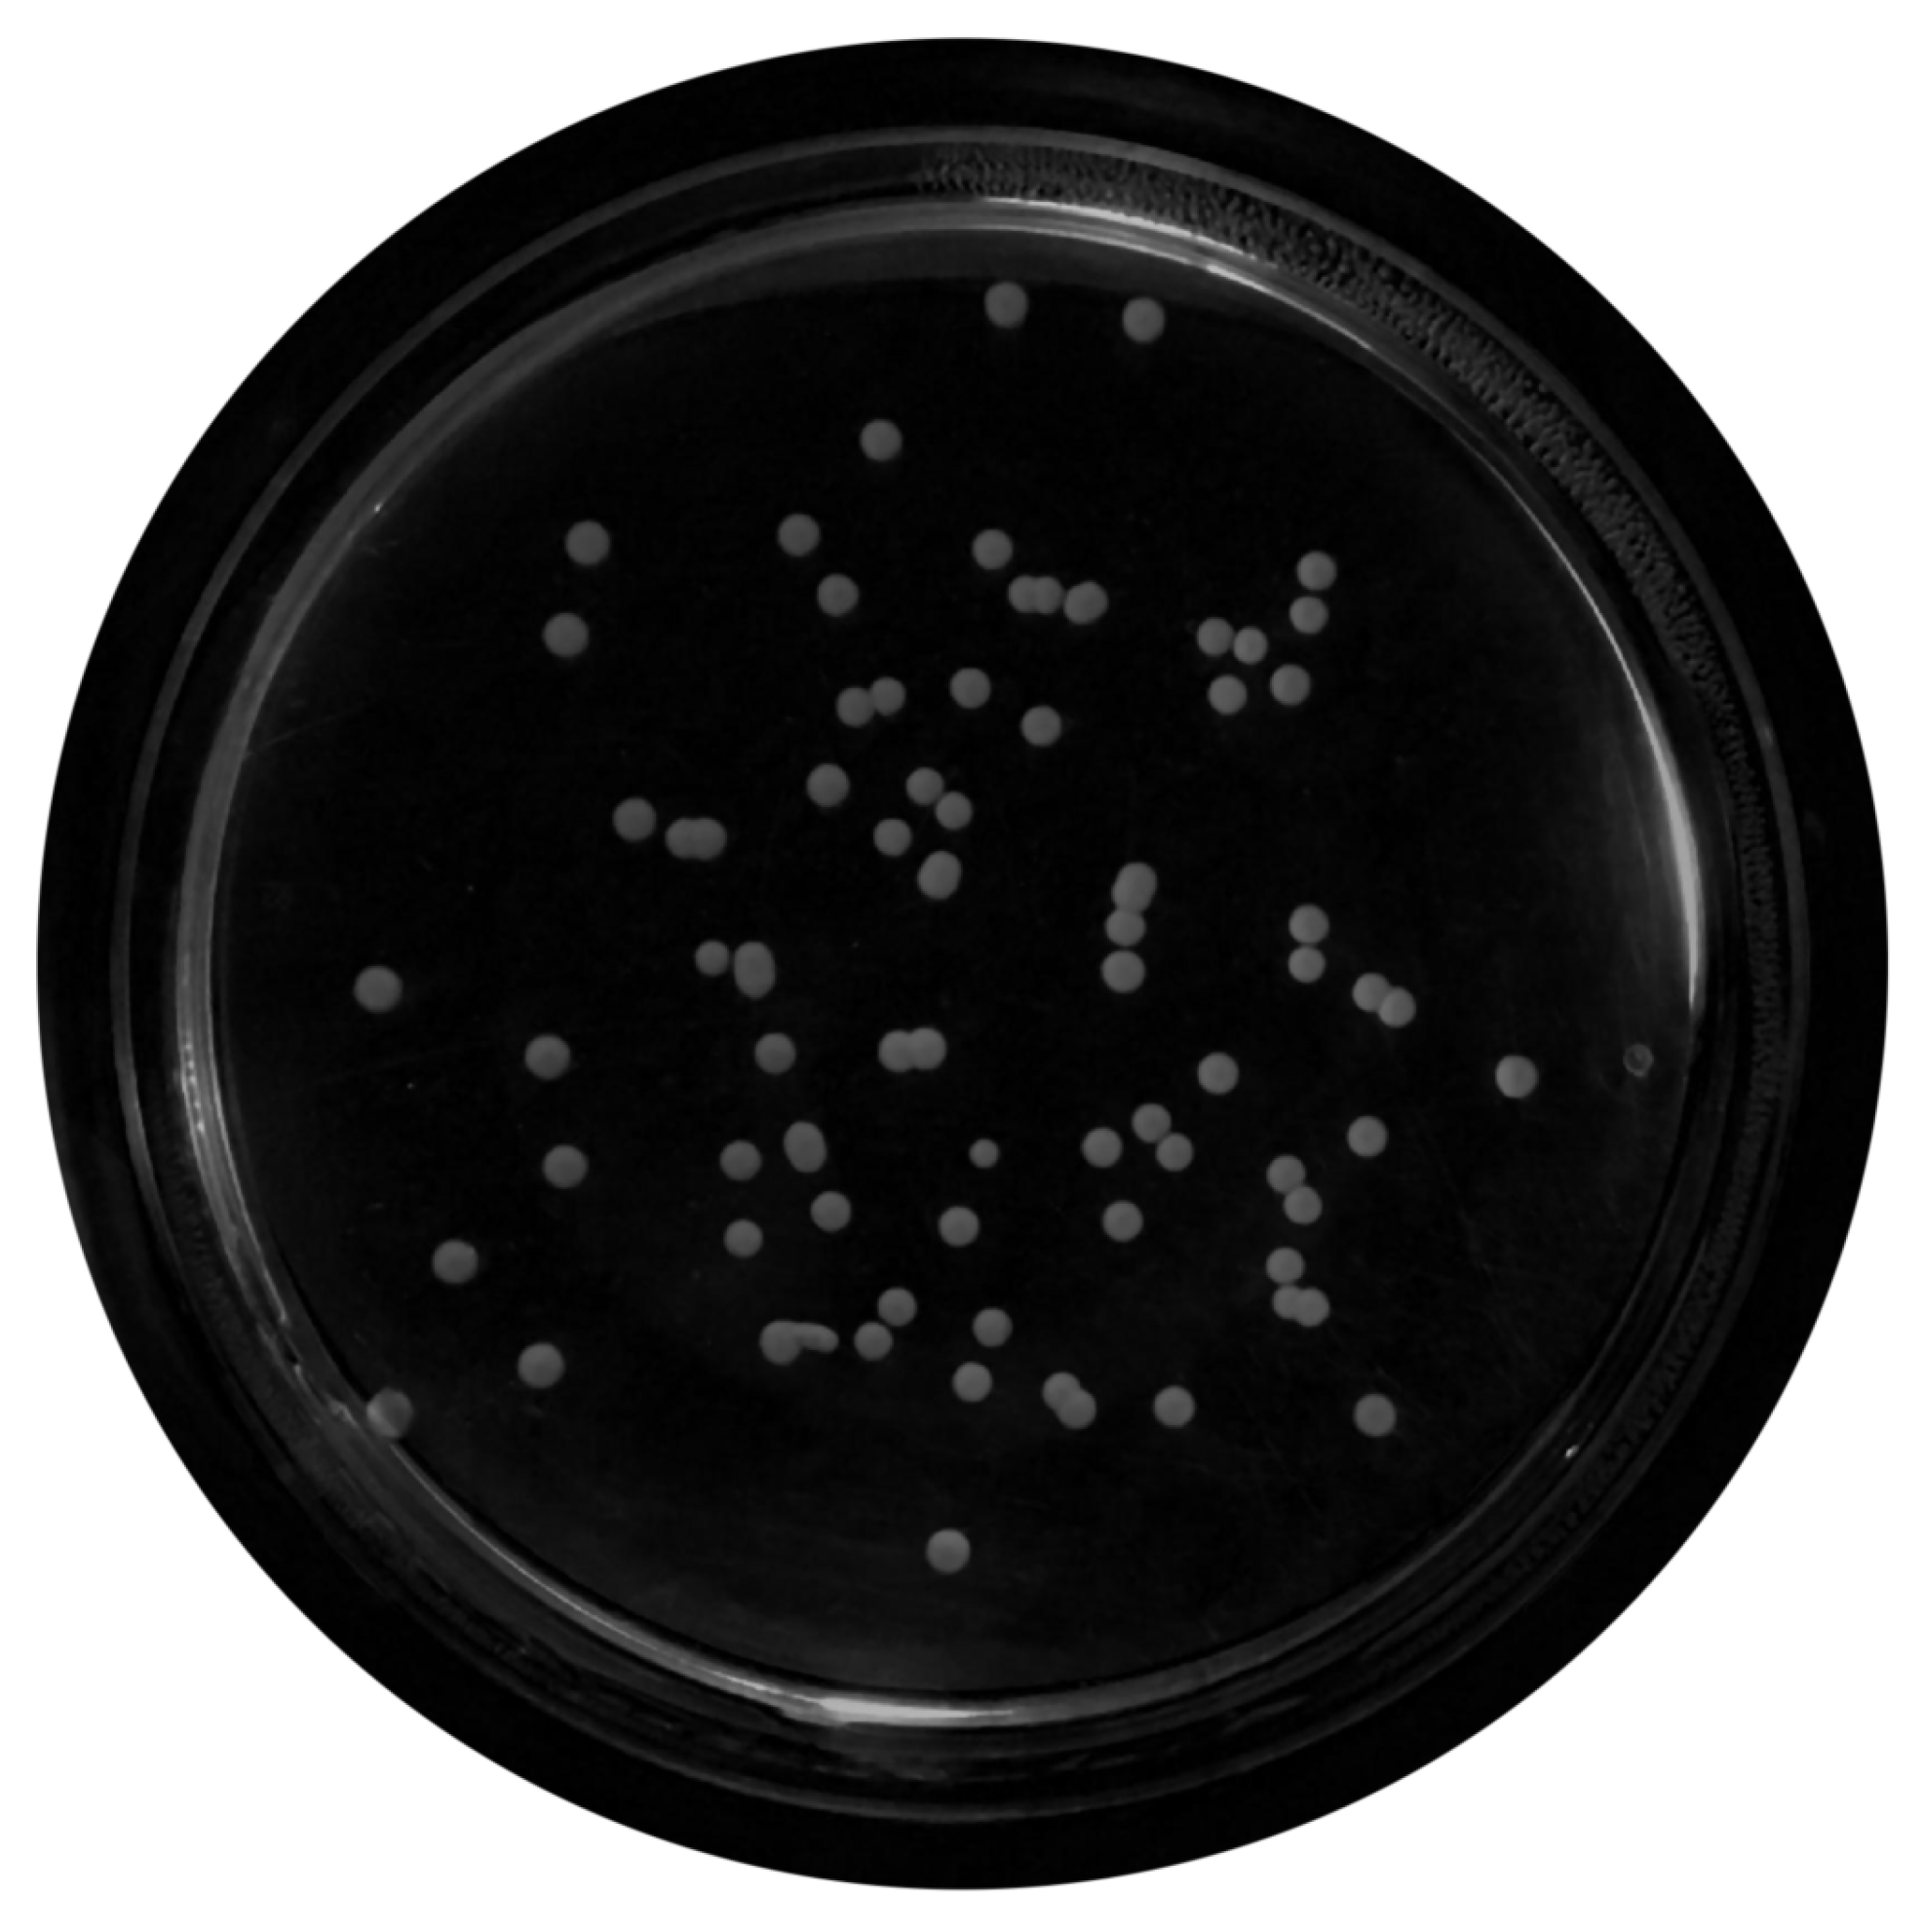
- Top-Hat Filtering:To correct possible uneven illumination, which leads to uneven contrast, a top-hat transform with a 200-pixel radius and disk-shaped single structuring element was performed. This morphological filter computes the image opening and then subtracts the image result from the input image [30], in this case the median-filtered image. Figure 7 illustrates the result of this step.
- Contrast Adjustment:
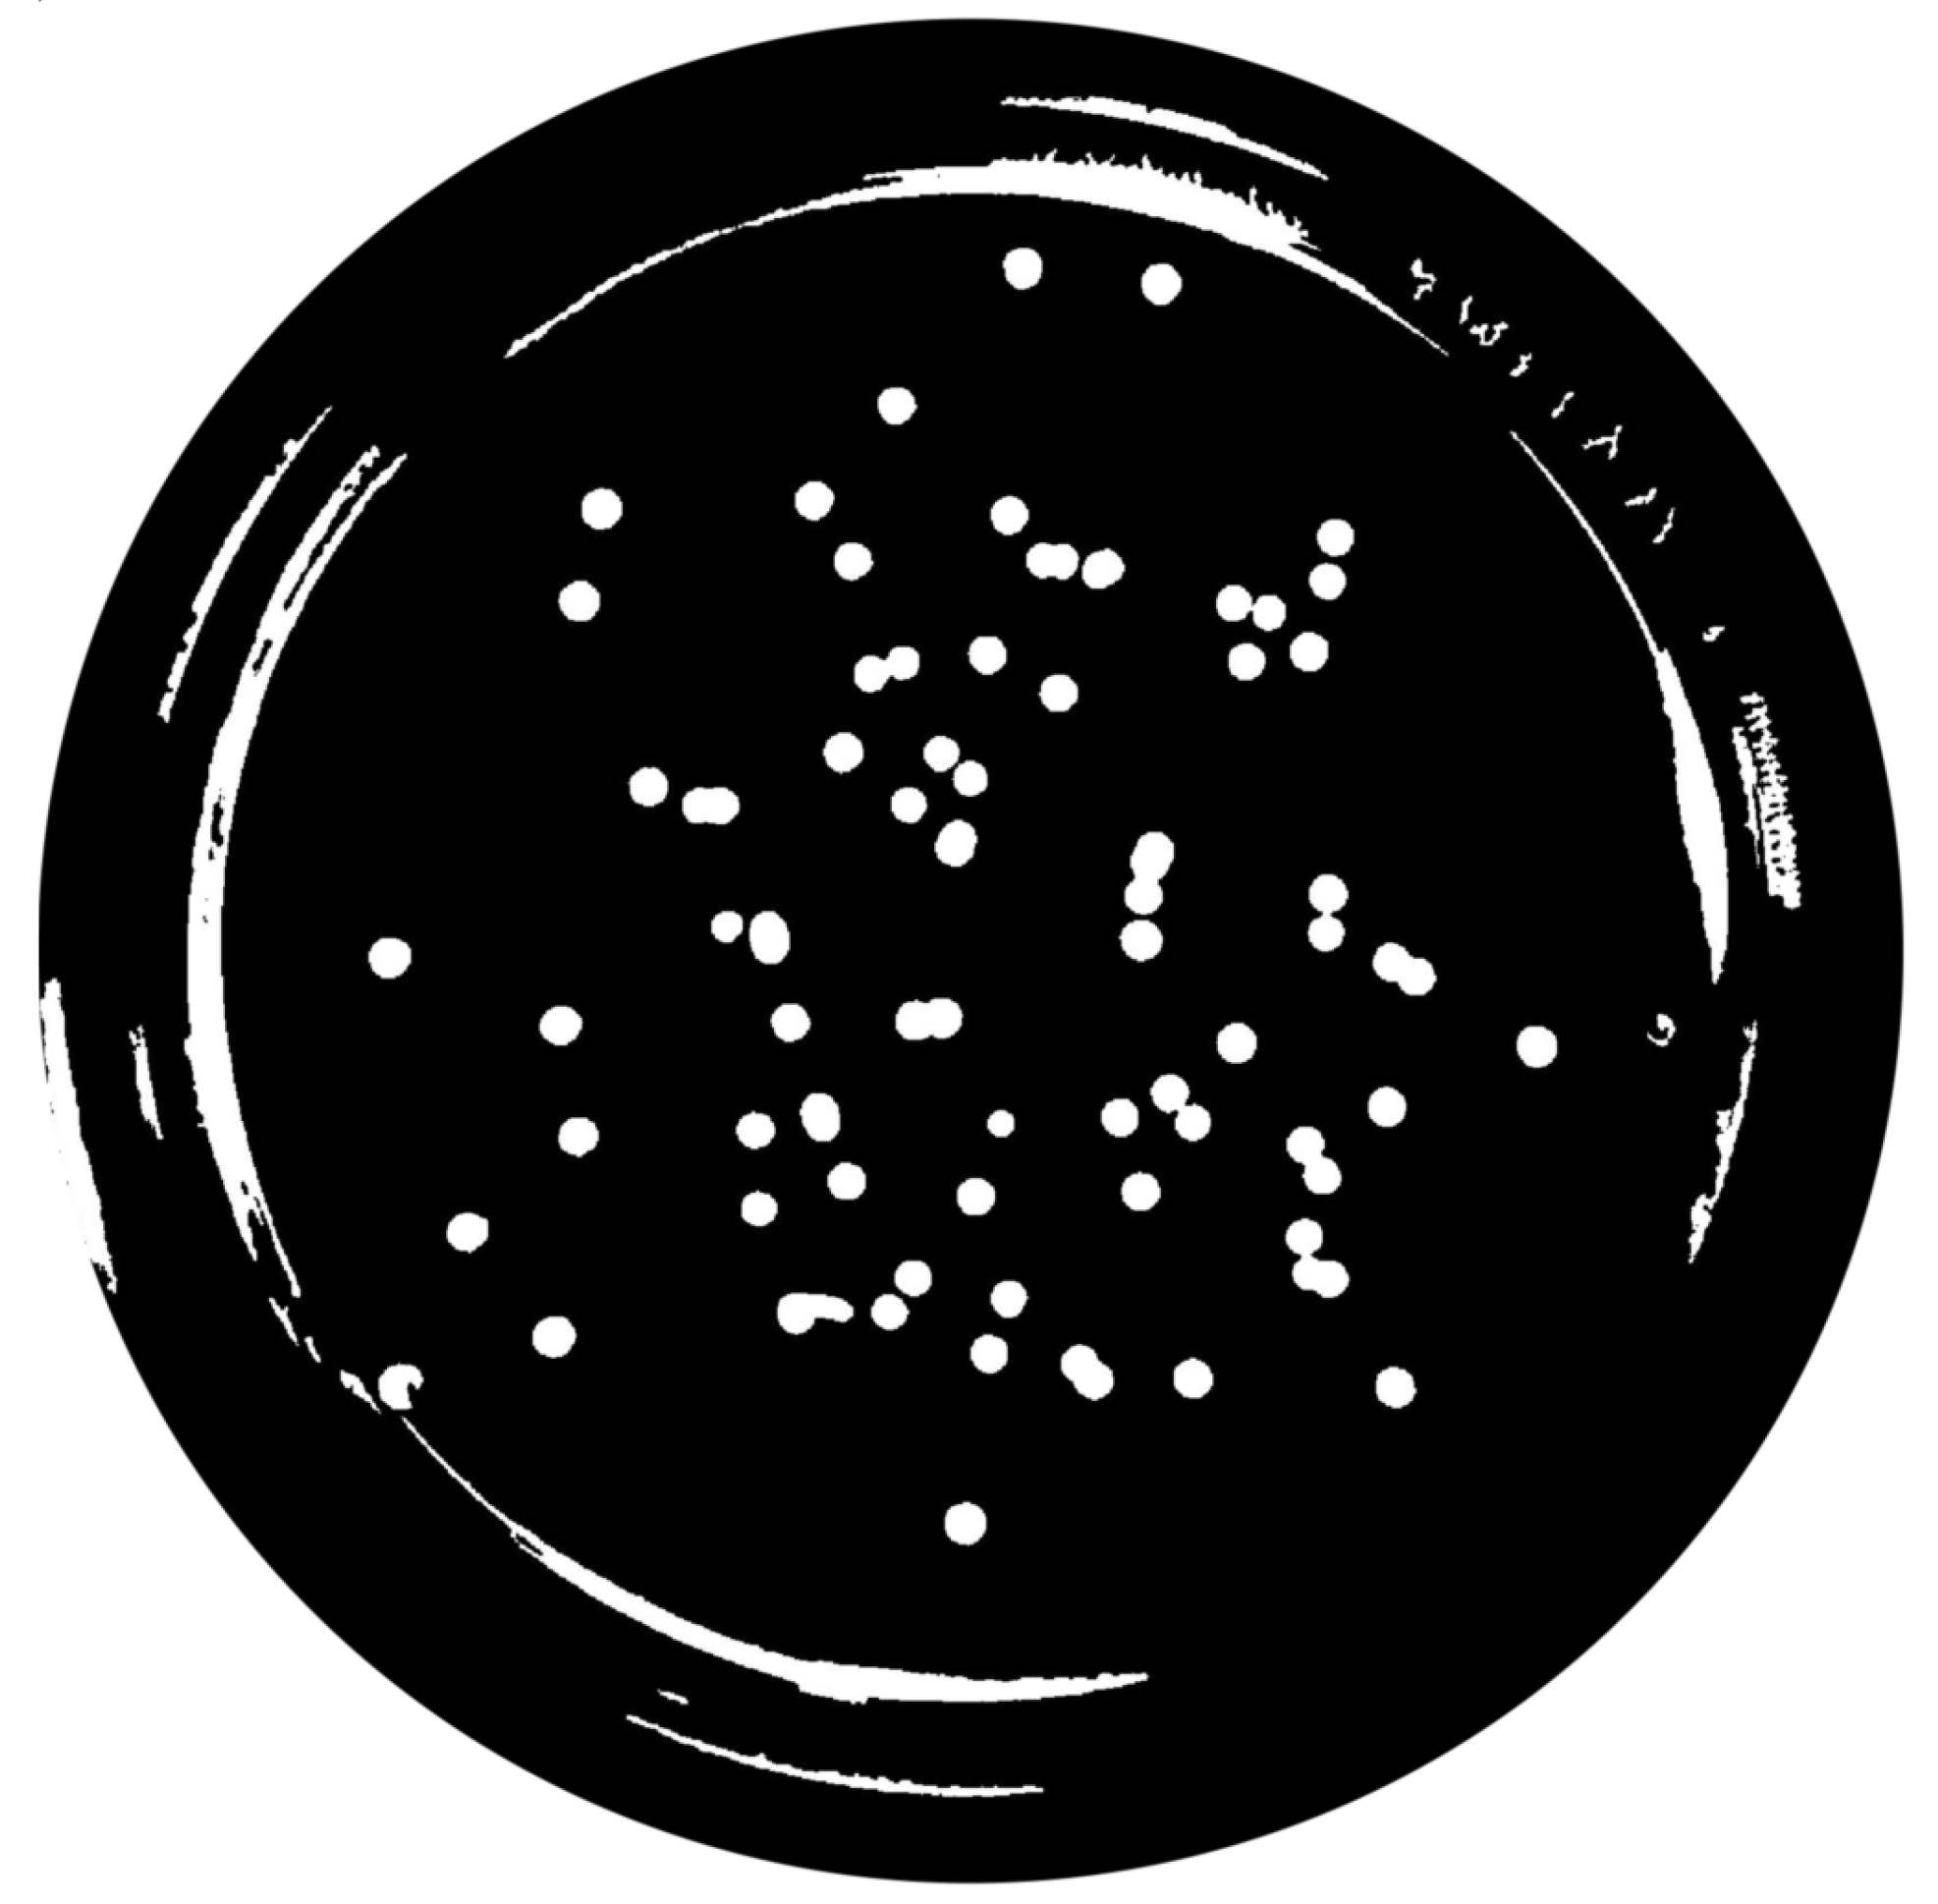
- Extended-Maxima Transform:Another normalization process occurred; the extended-maxima transform was applied, where the intensities of points inside the foreground regions were changed to show the distance to the closest boundary from each point. First the regional maxima were found; objectively, 80 pixel-region maxima were computed and with 8-connected pixels, i.e., the neighborhood of a pixel is the adjacent pixels in the horizontal, vertical or diagonal direction; subsequently, the transformation is performed (see Figure 9).
- Area Opening:
2.4. Processing
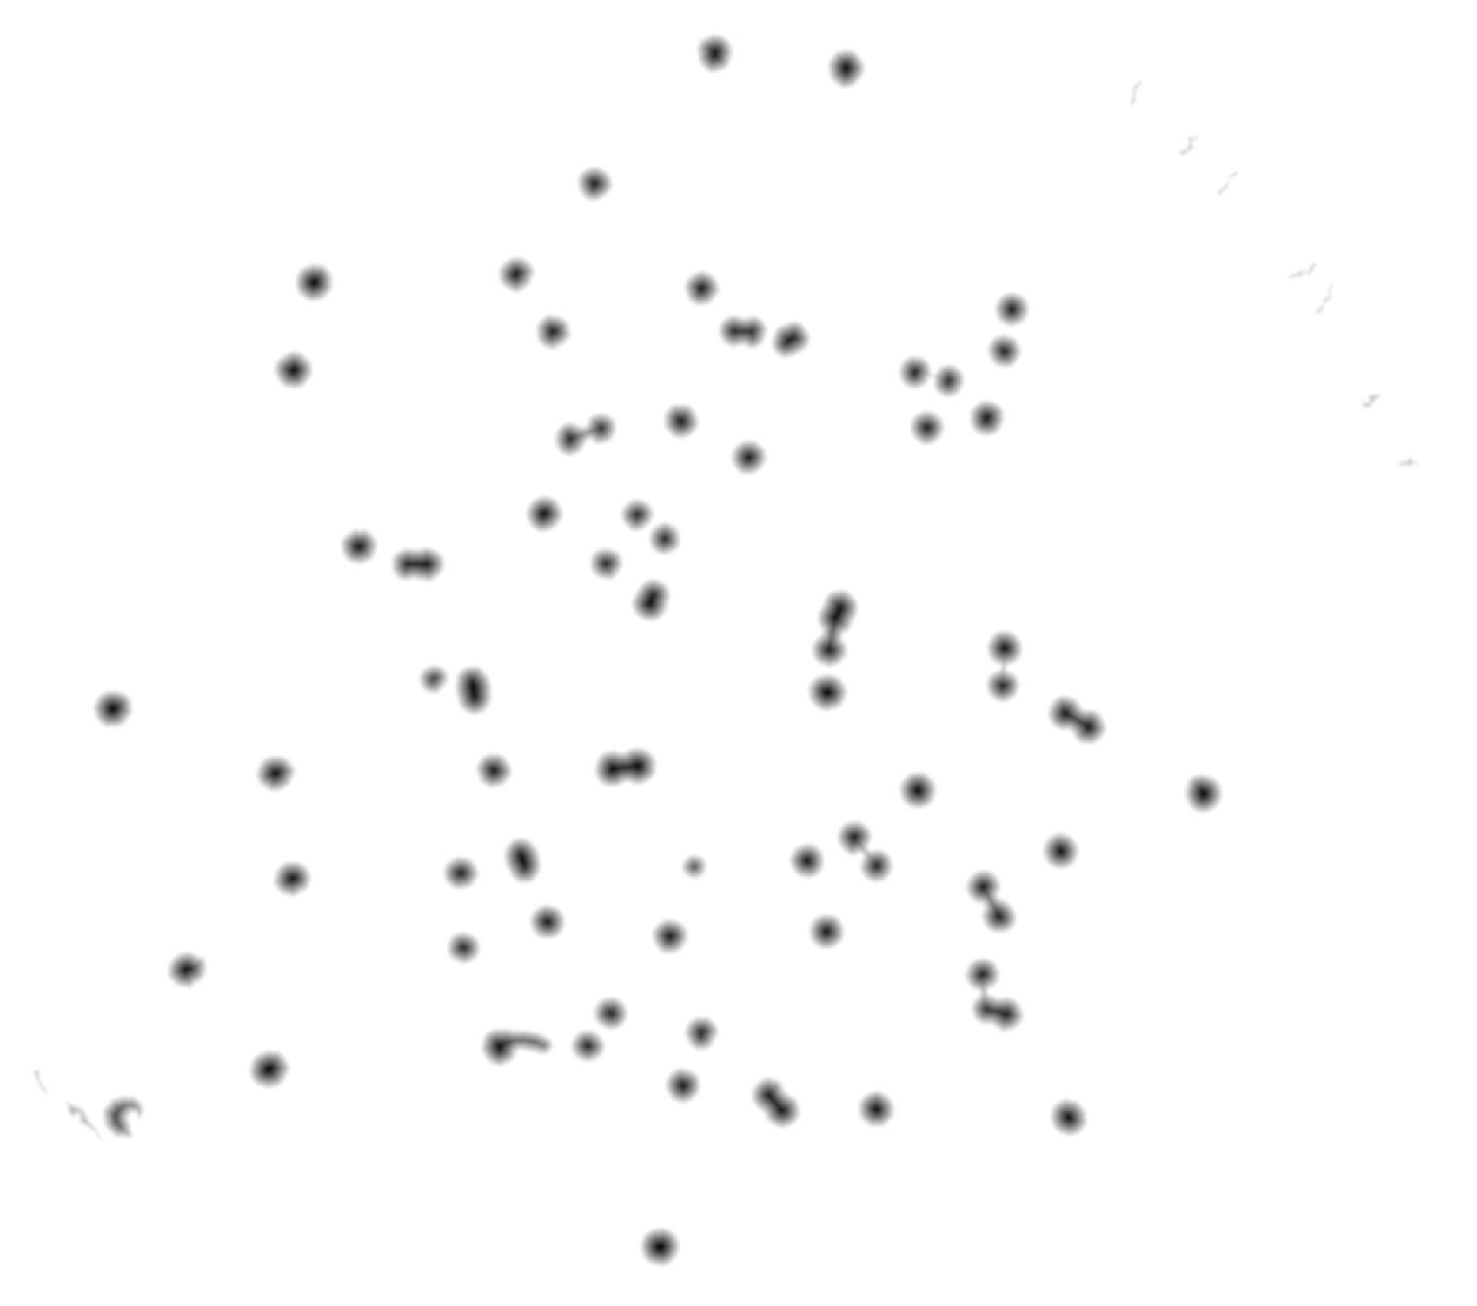
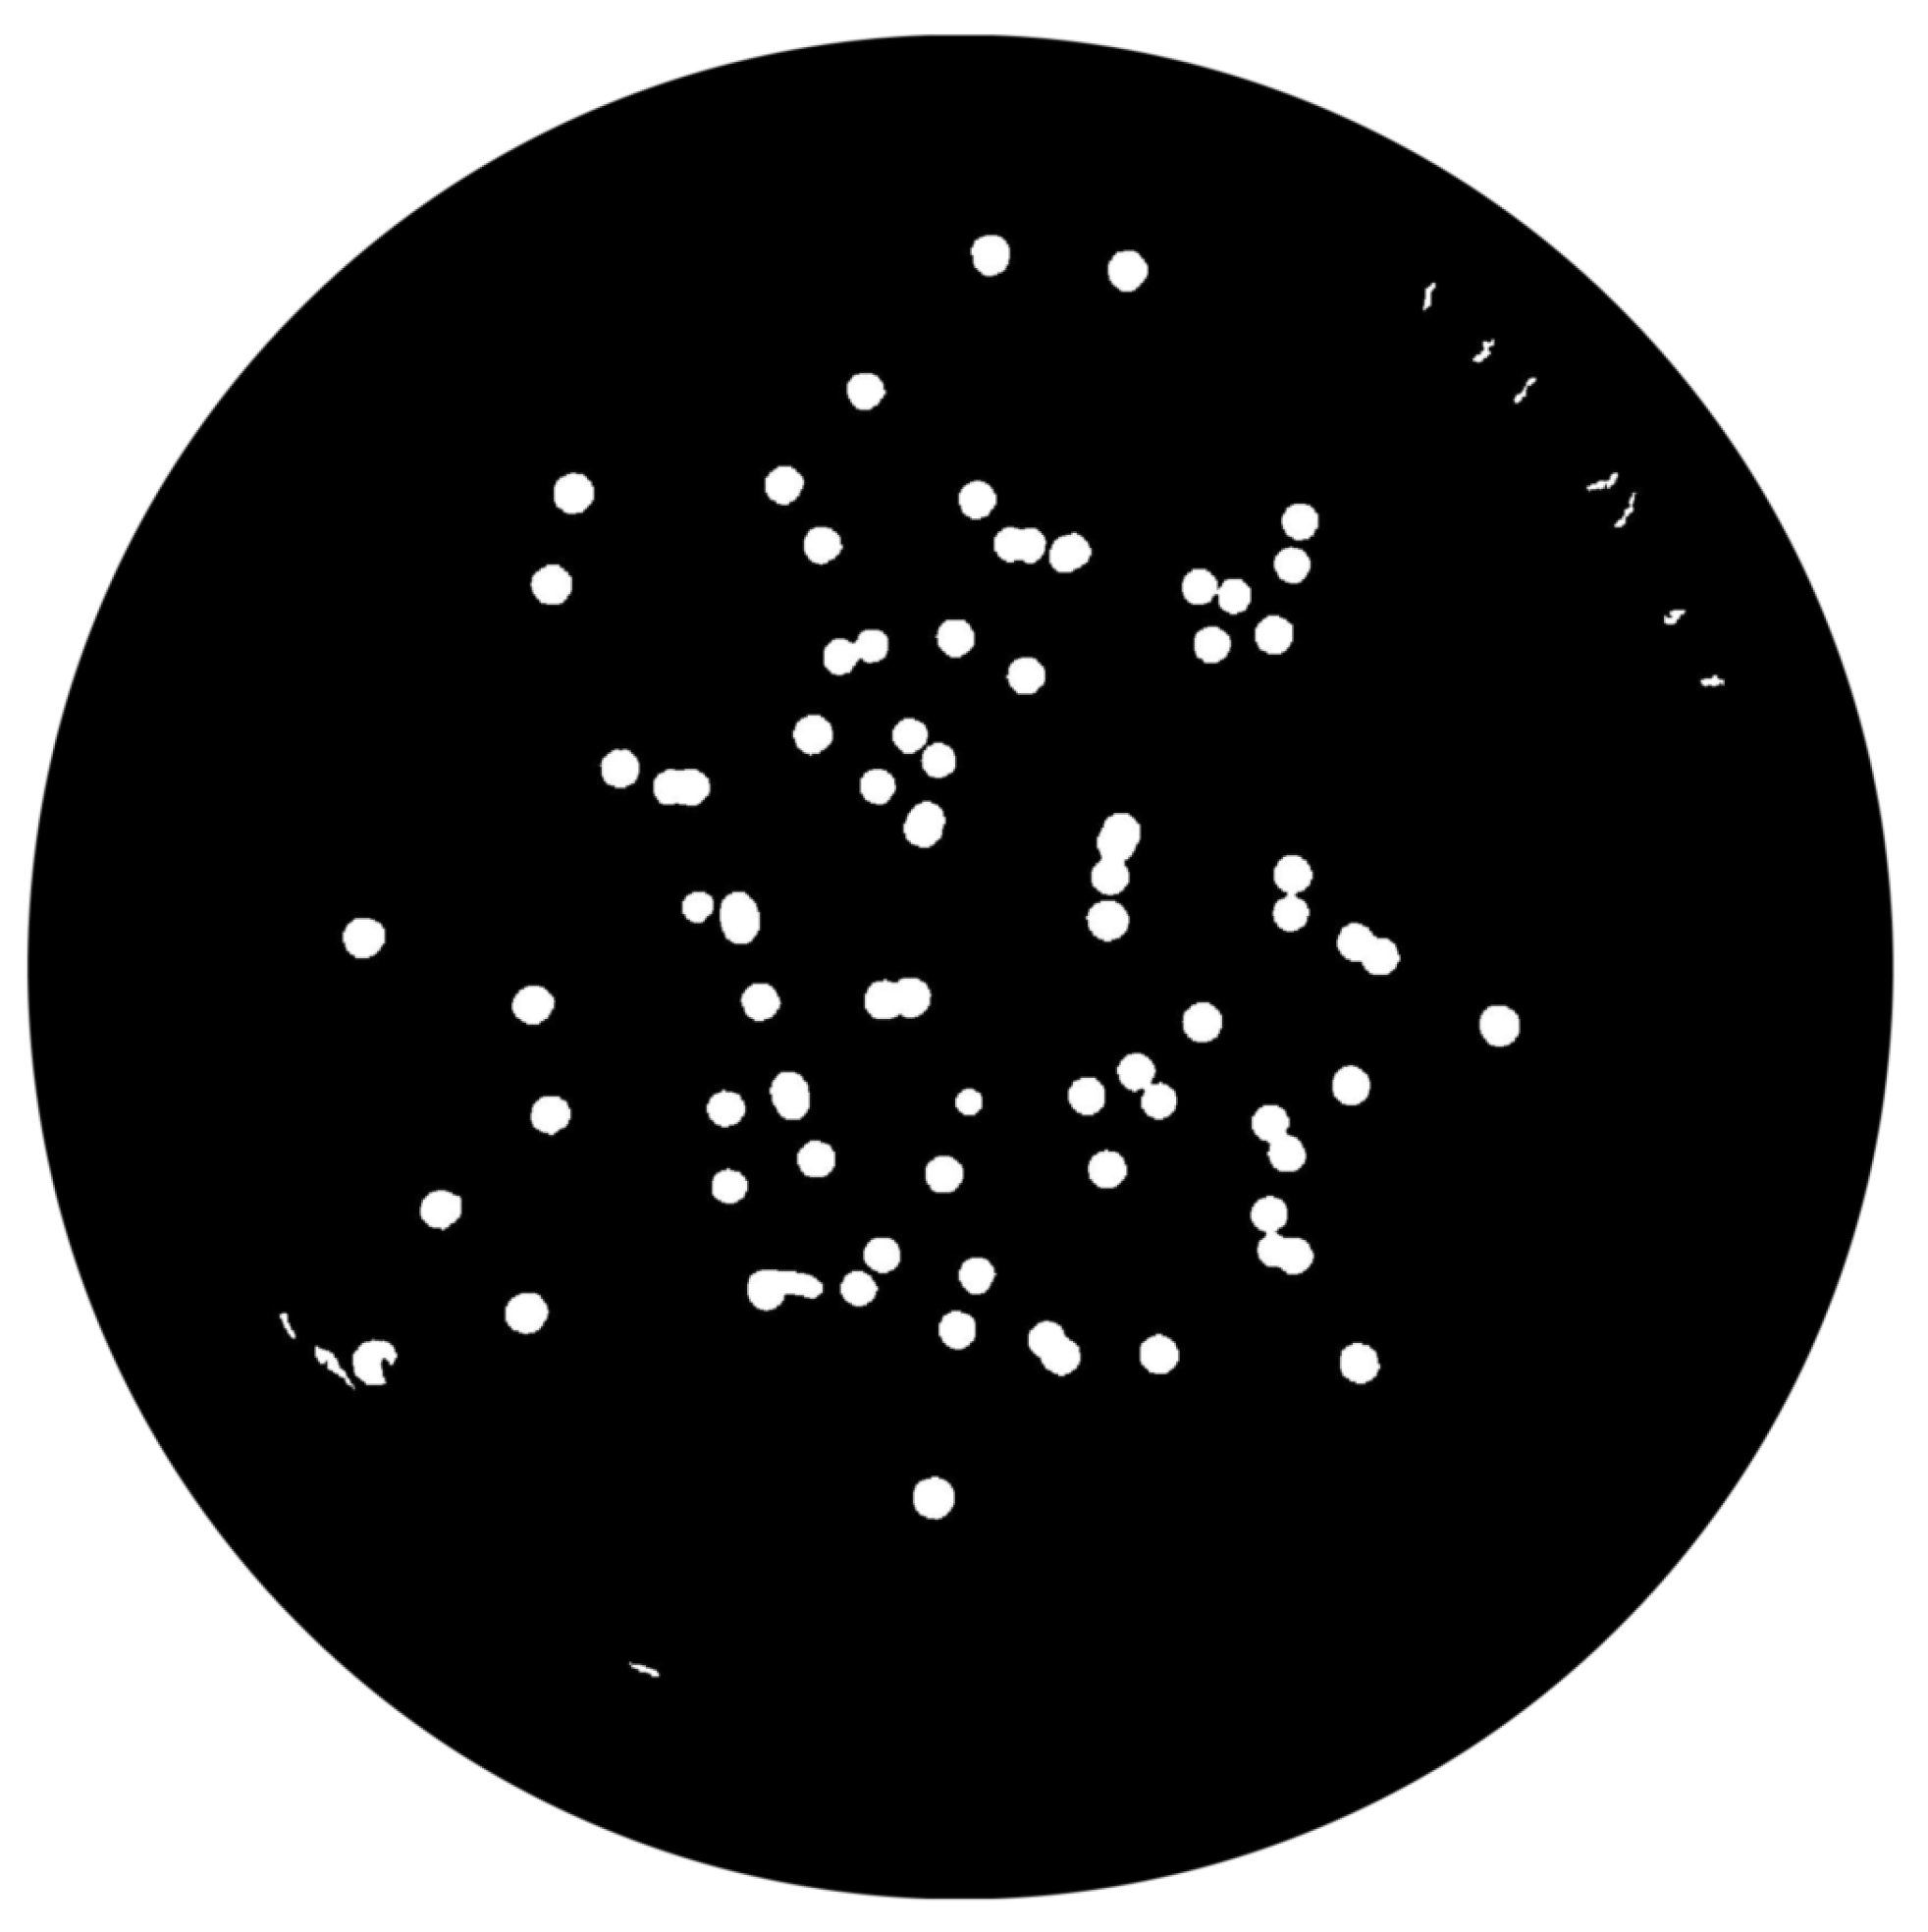
- Round-shaped objects detection:The aim of this task is to select potential colonies. Foremost, from all the detected objects, 3 features are extracted: area, perimeter and circularity. From the areas and perimeters, a metric of the “roundness” of the objects is computed, and those objects with a value of 1 are indicative of perfect circles. Since several colonies are not a perfect circle, not only the objects with a metric of 1 are selected but also those within an interval, i.e., 0.48 to 1.6. The third extracted feature, circularity, is also a metric of “roundness” and improves the detection procedure (check task image result at Figure 12).
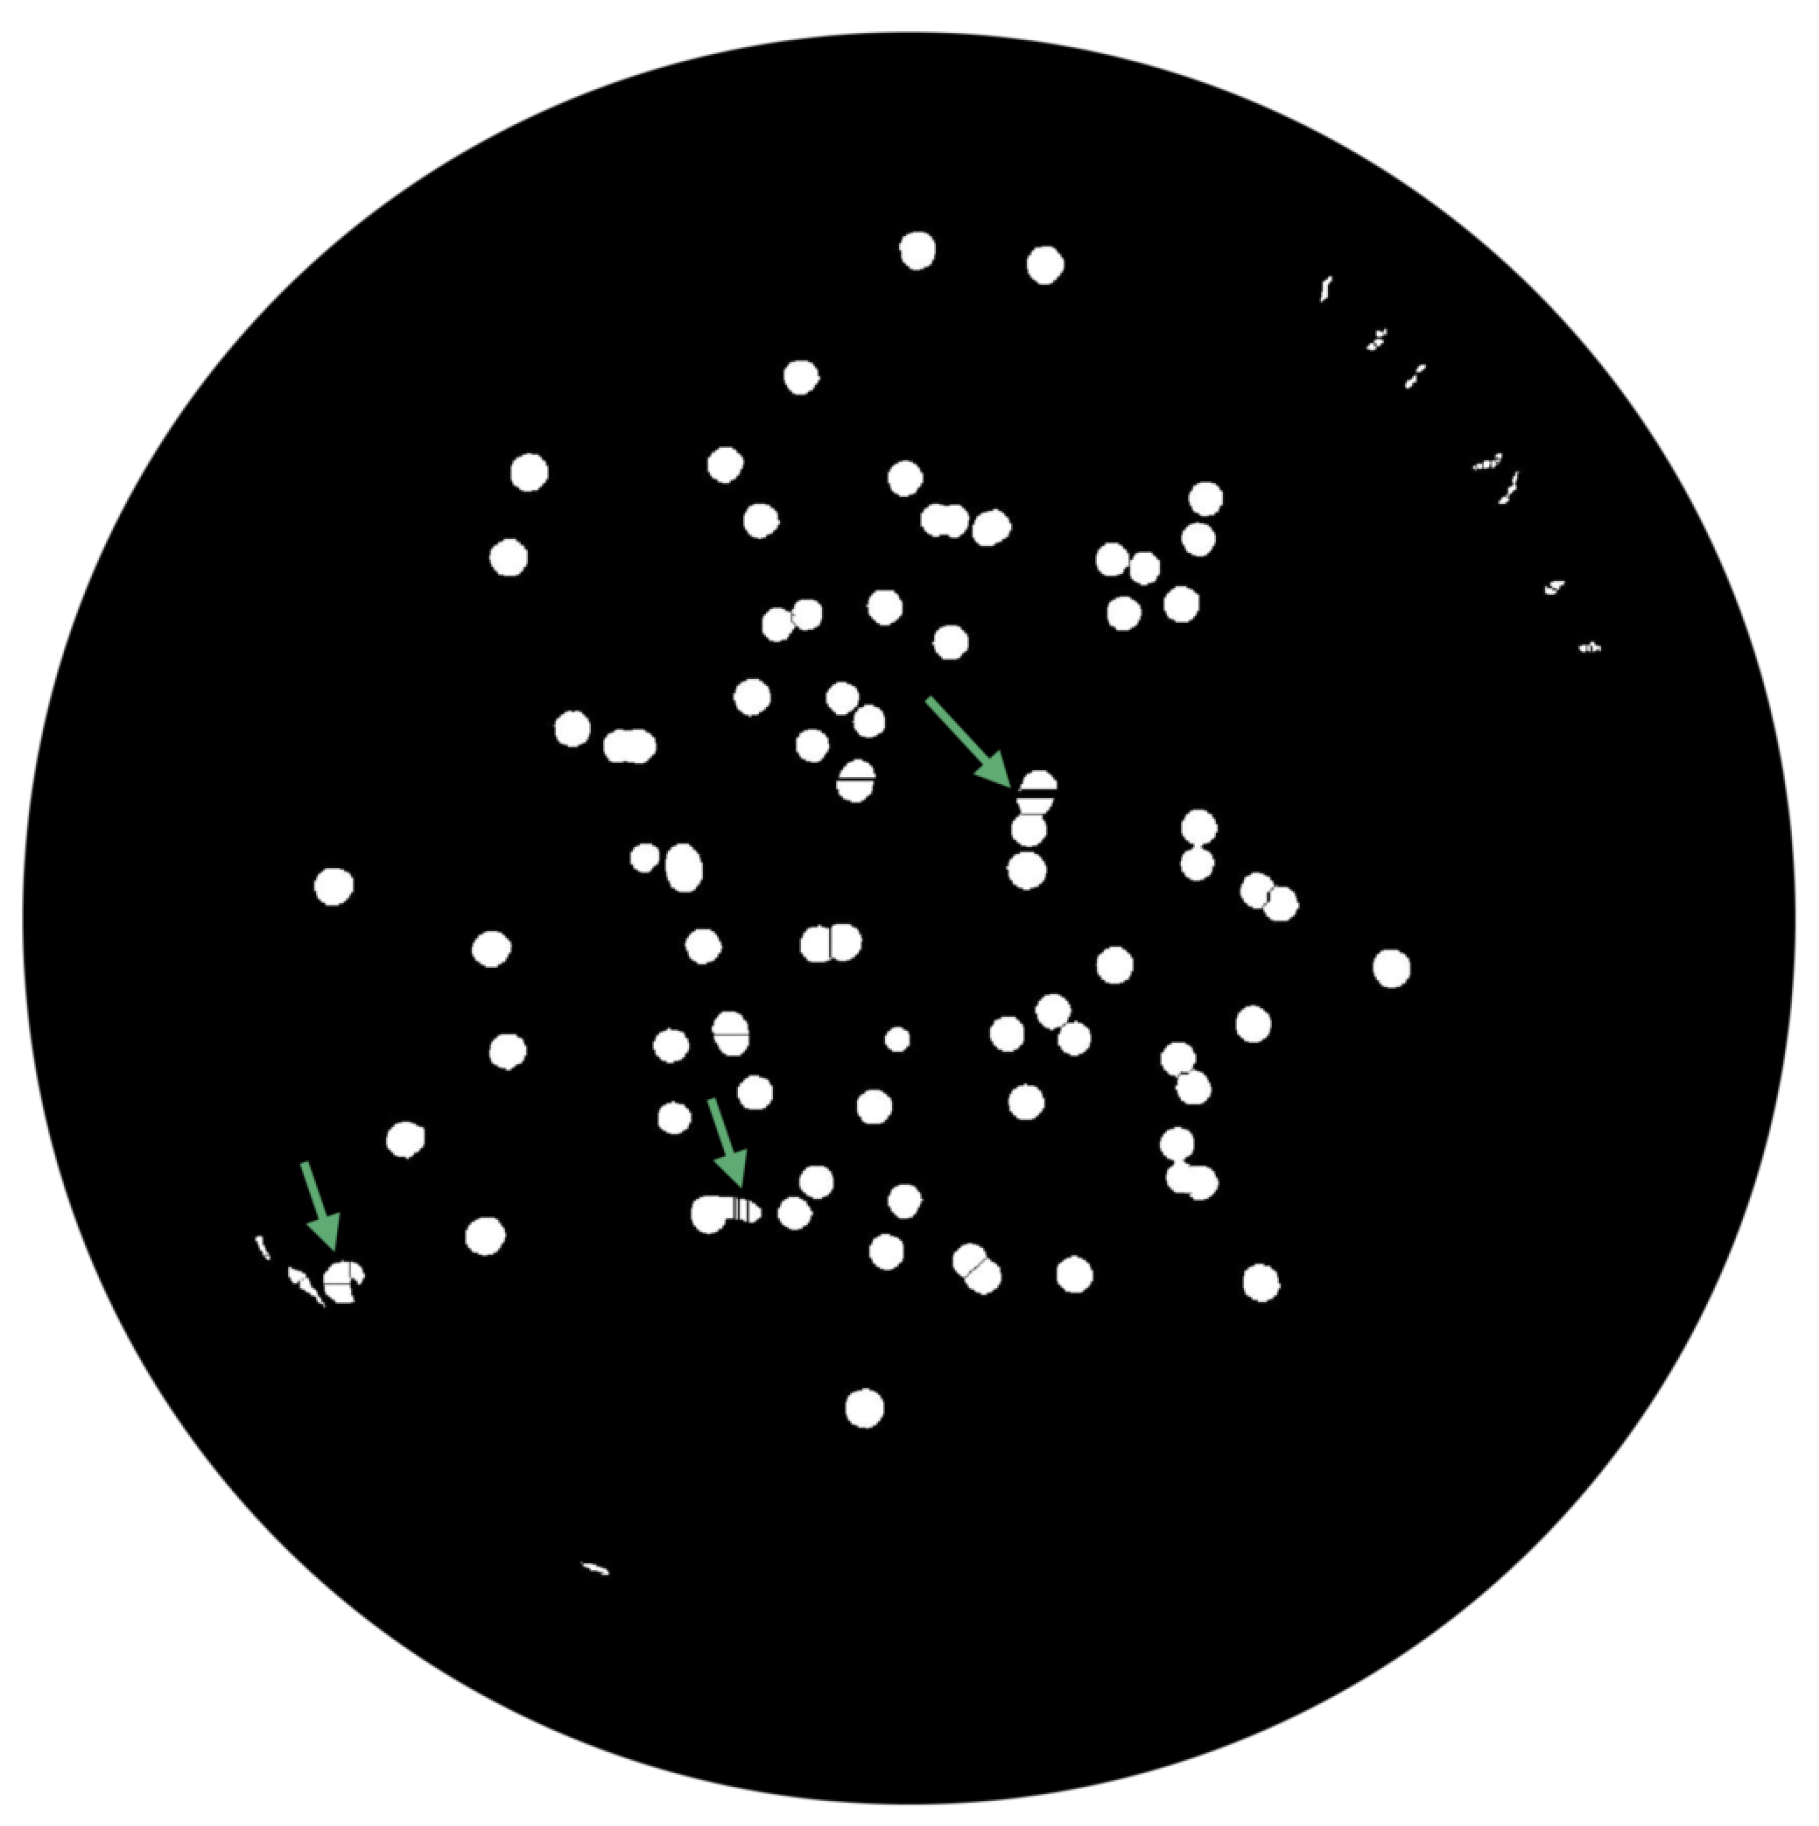
- Watershed Method:This phase is important as it transforms the previous image into one where the objects are catchment basins—watersheds, to posteriorly being segmented. The watershed transform is only performed at this stage to avoid over-segmentation issues. This process is subdivided in 5 sub-steps: distance transform, watershed ridges, extended-minima transform, minima imposition and finally the watershed transform itself [32].
- -
- Distance TransformAt this step, the distance transform is computed, i.e., the distance from every pixel to the nearest non-zero-valued pixel. However, to turn bright areas into catchment basins and to assign one catchment basin to each object, the distance transform has to be negated (check the example result in Figure 13).
- -
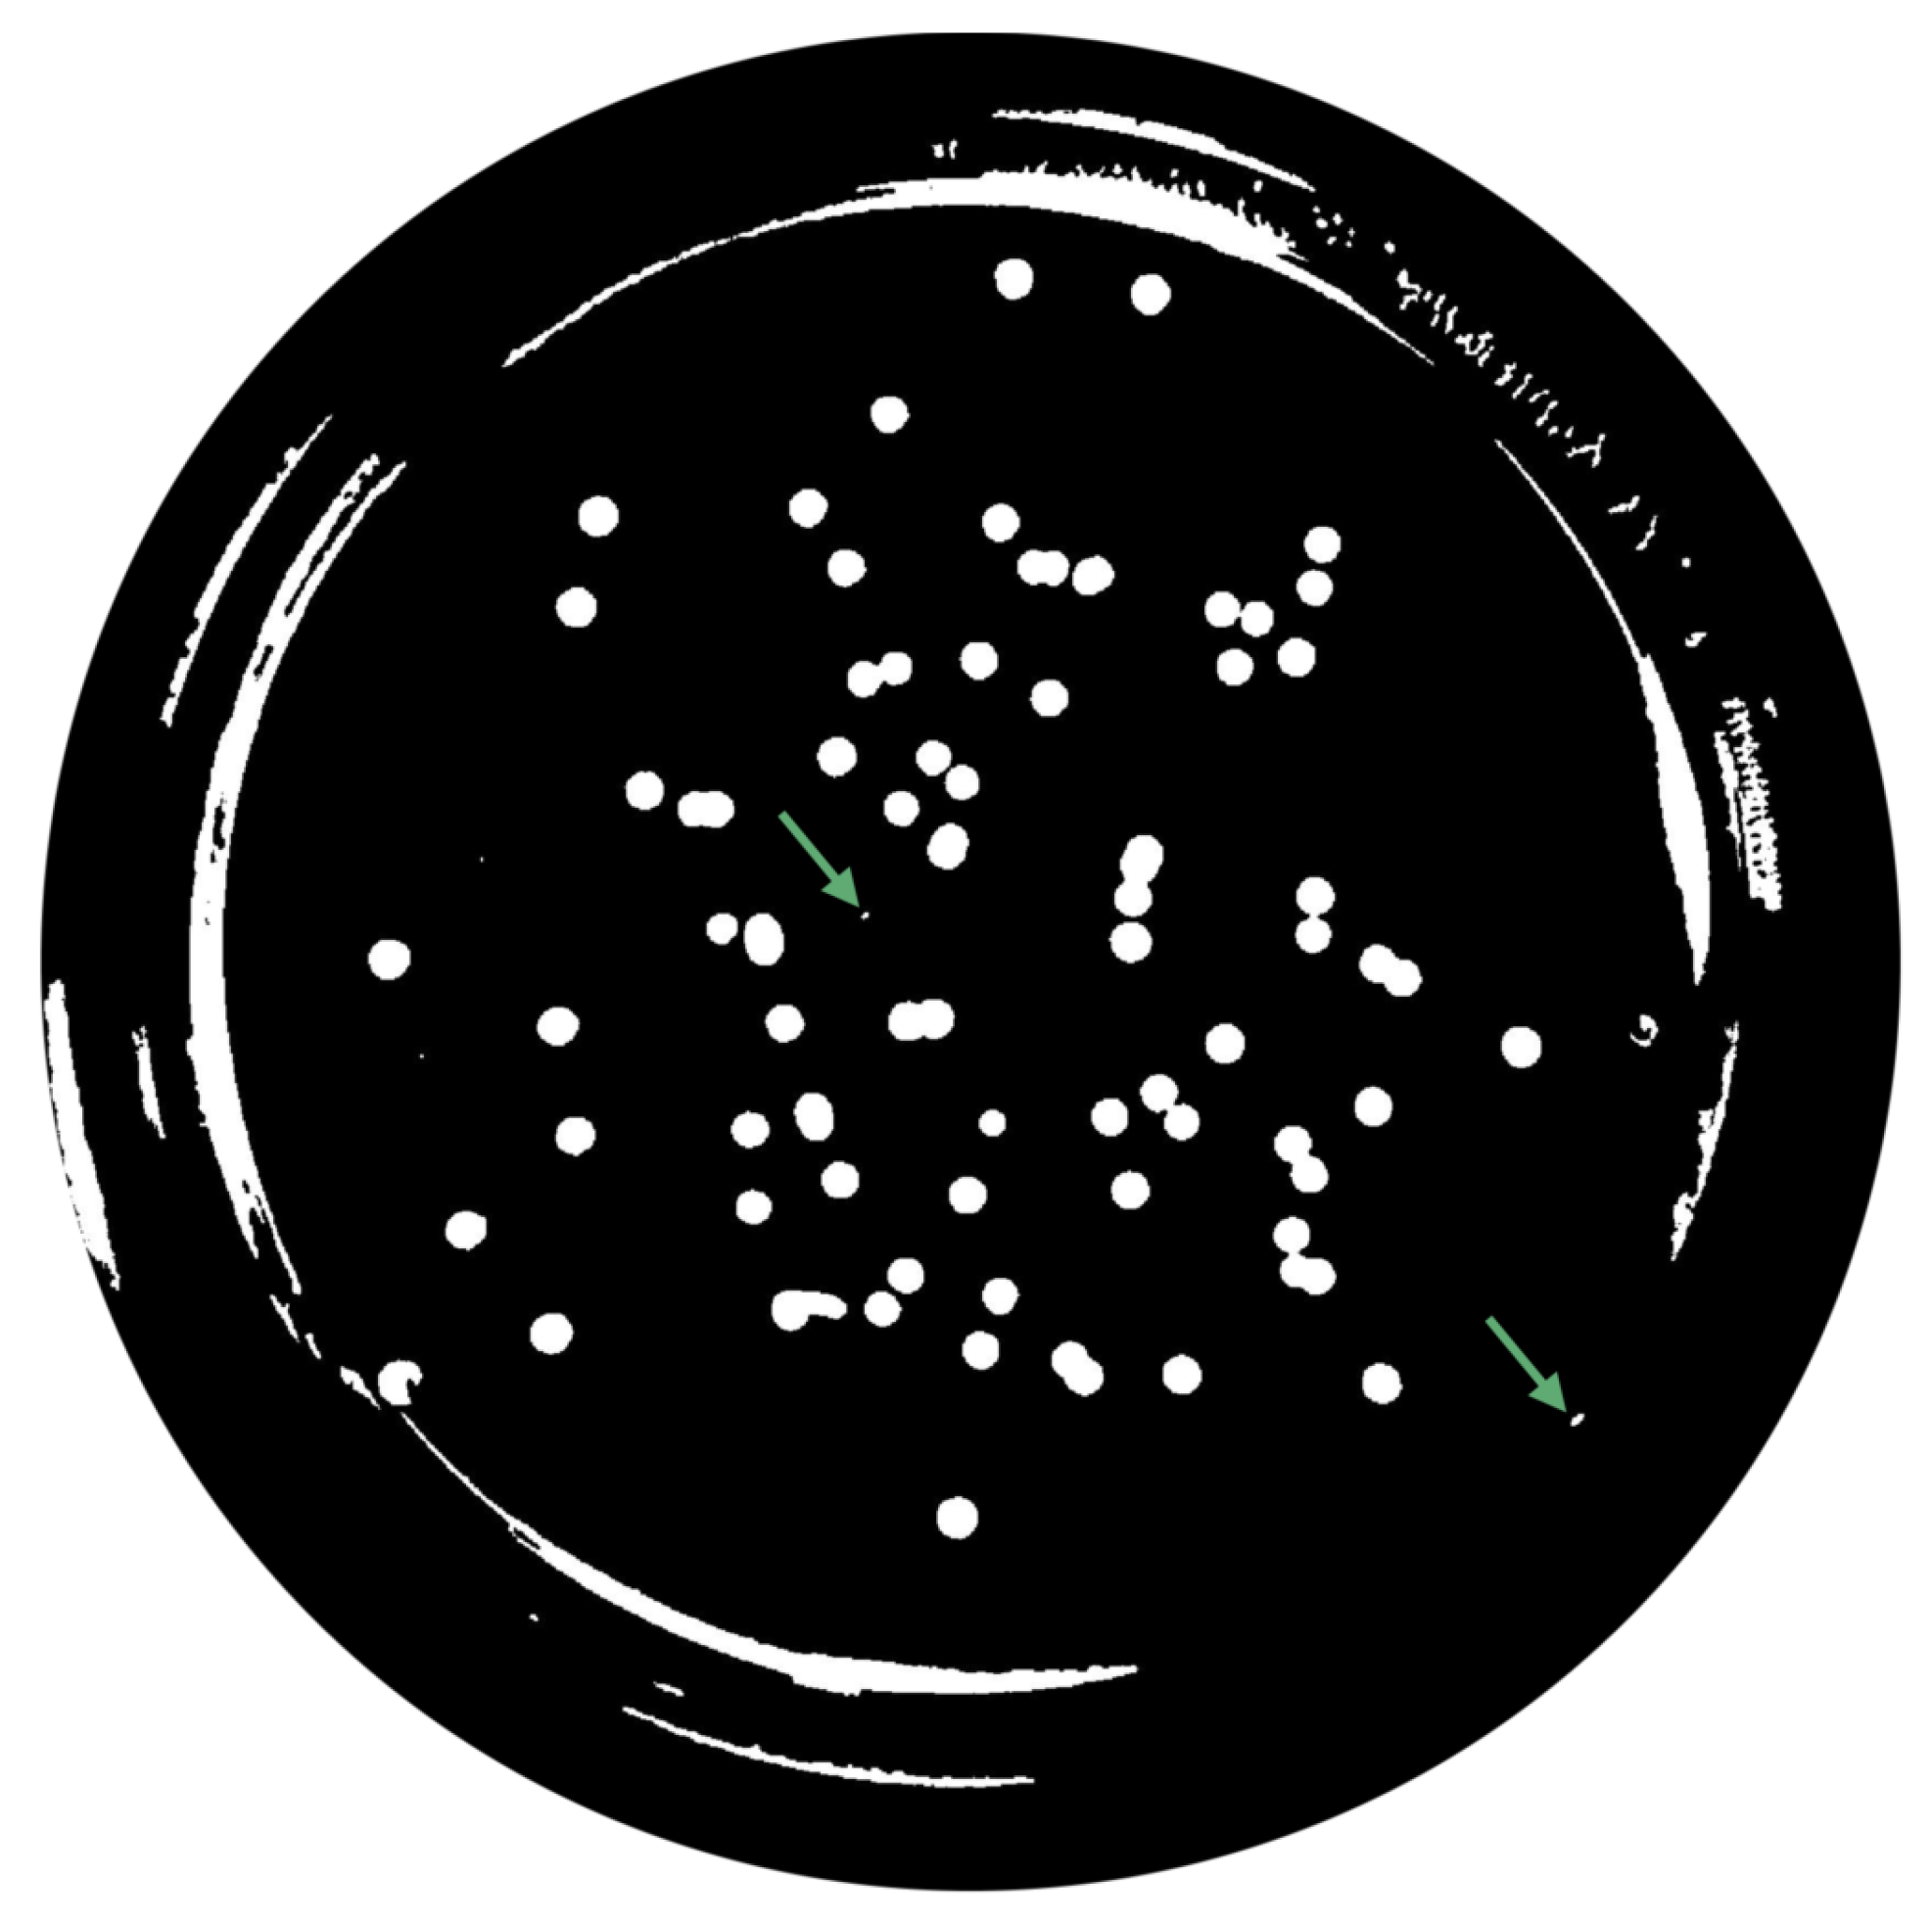
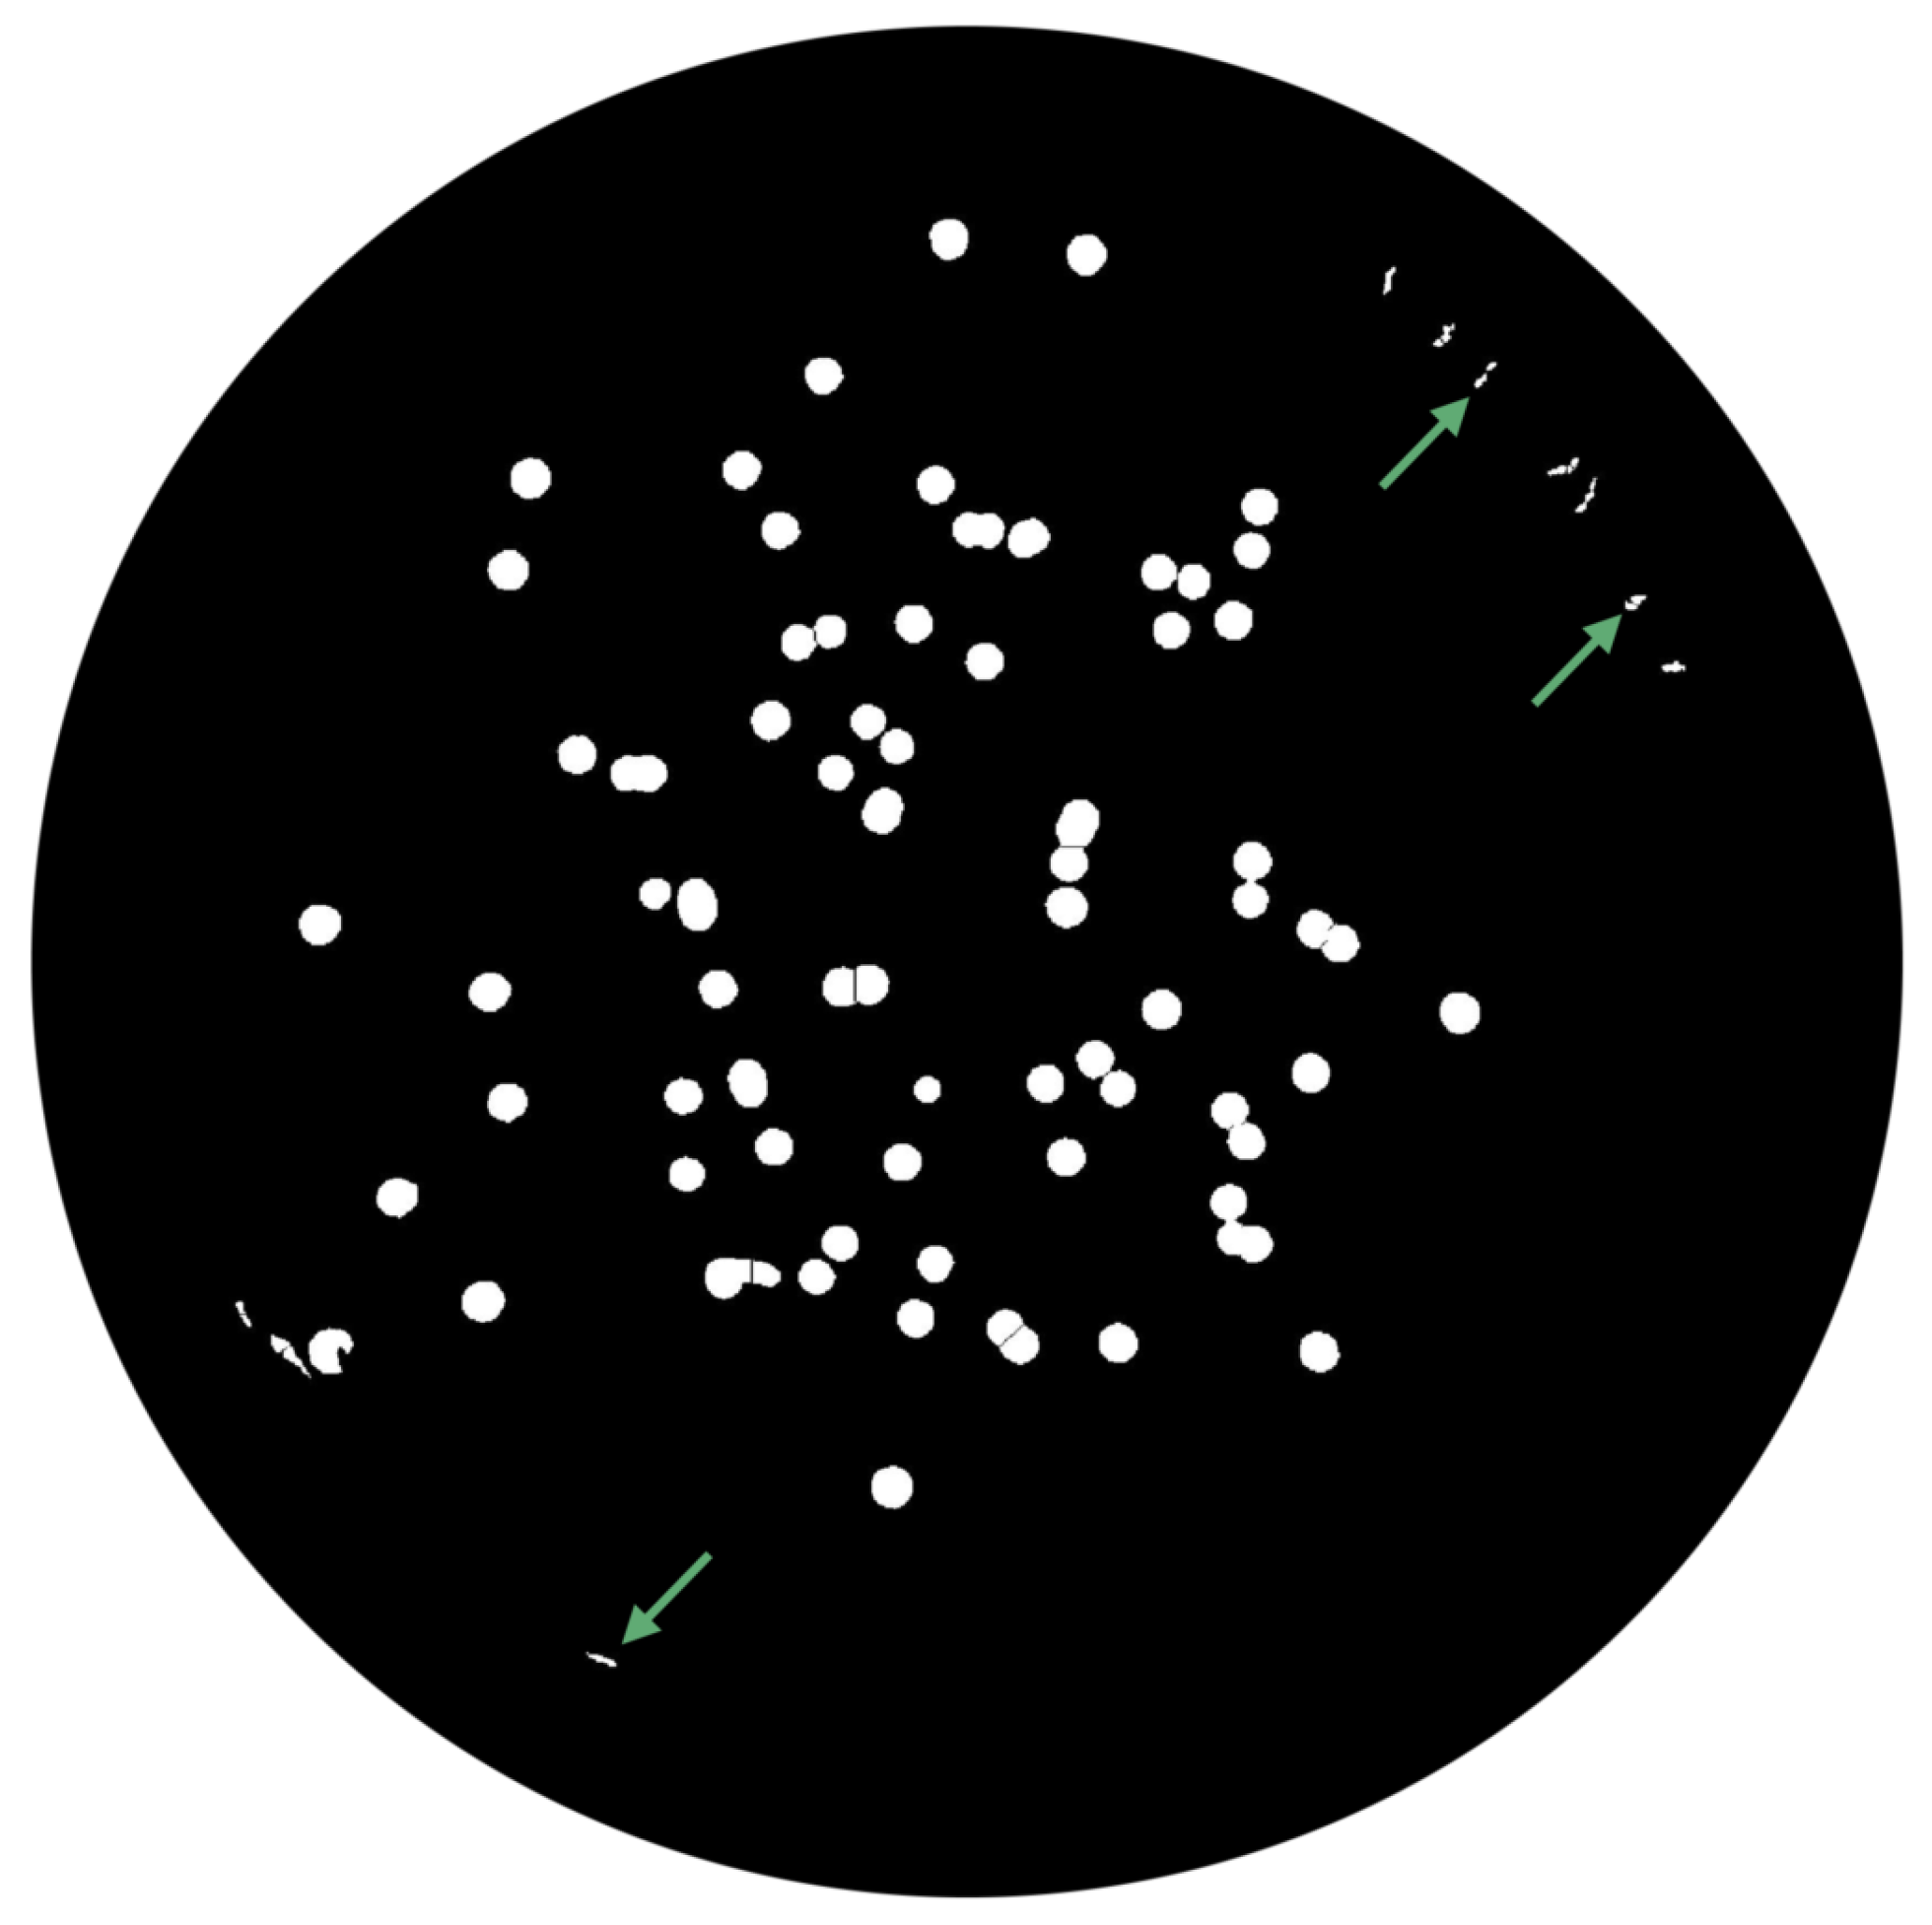
- Watershed ridgesUpon performing, the following operation is intended to segment the colonies using the watershed ridges, and these values correspond, in fact, to zero; thus, if zero is assigned to those values, they become background pixels and subsequently split the colonies. The effects that the aforementioned operation produces are displayed in Figure 14 and identified by green arrows.
- -
- Extended-Minima Transform
- -
- Minima impositionThe marker image can be defined for each pixel p, as follows,The minima imposition of the input image is then performed in two steps: (1) the pointwise minimum between the input image and the marker image is computed: . Through the latest, minima are created at locations corresponding to the markers. Moreover, two distinct minima to impose may fall within a minimum of f at level 0; therefore it is necessary to consider rather than ; (2) morphological reconstruction by erosion of () from the marker image :the extended transform is then changed in a way that no minima occur in the previously filtered locations. The output of this step is displayed in Figure 16 [33].
- -
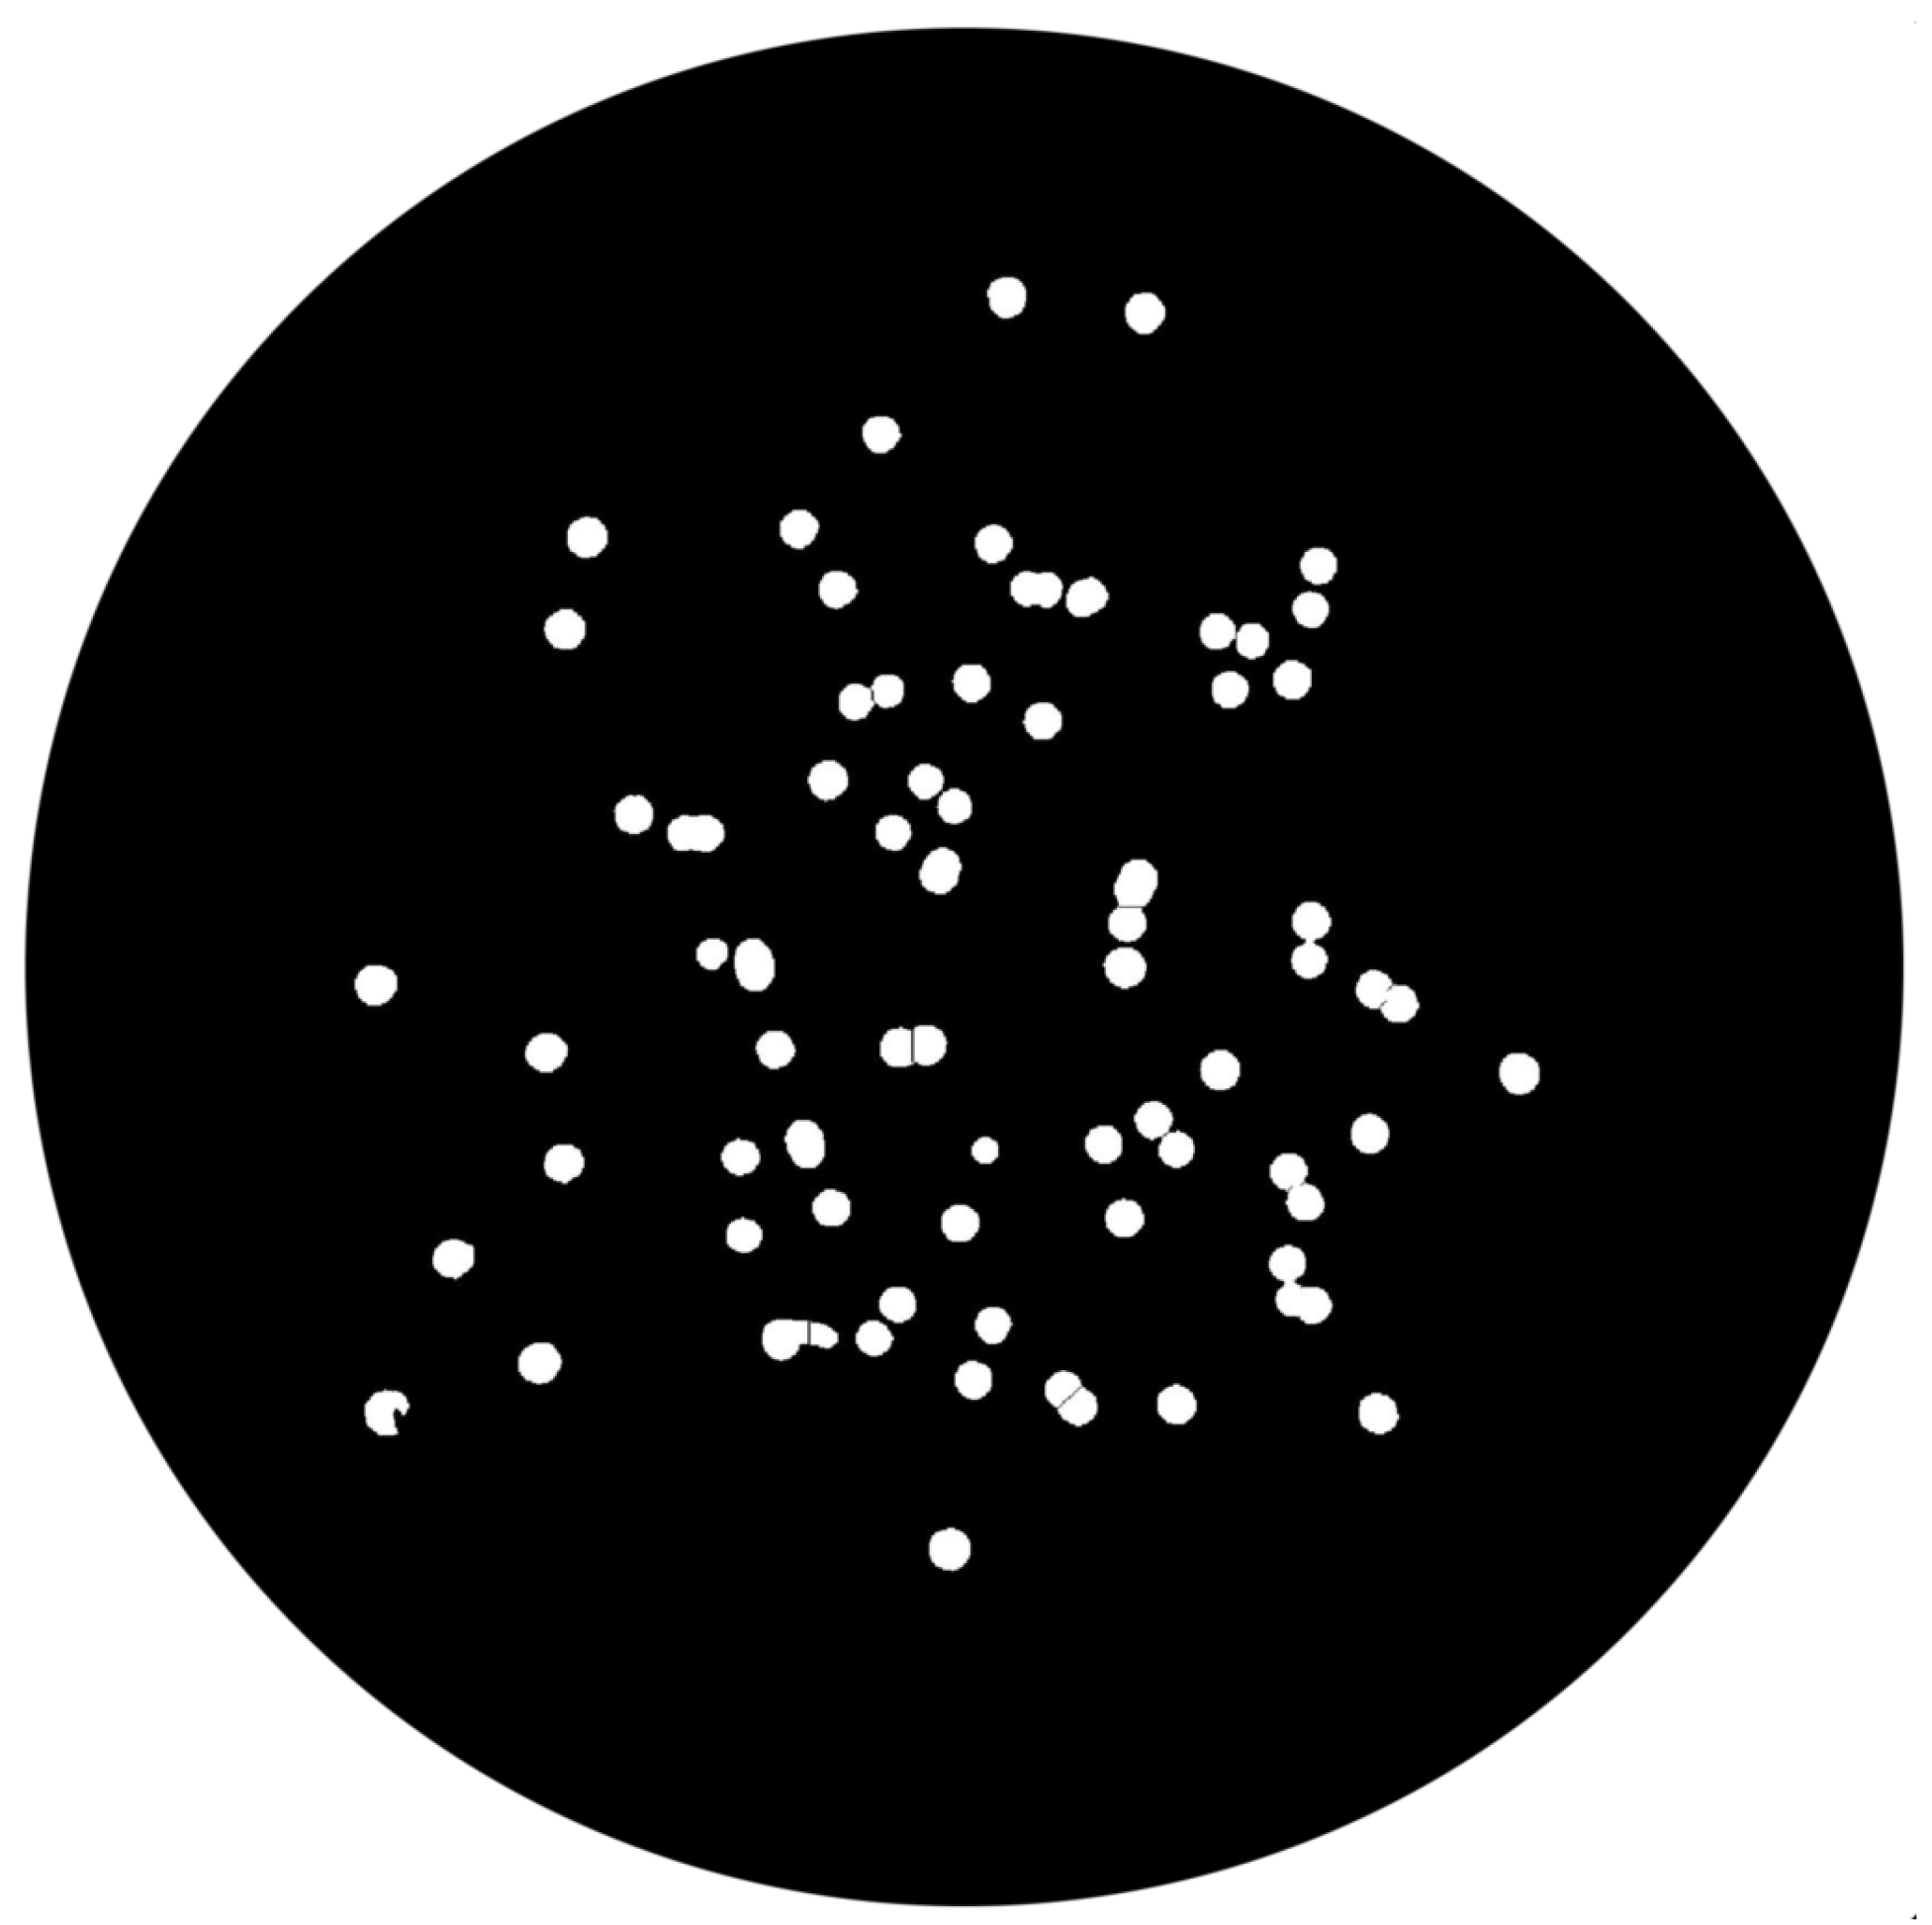
- Watershed TransformFinally, the watershed transform is performed using the watershed function, and an image with the segmented colonies is exhibited (Figure 17).
- -
- Area Filtering
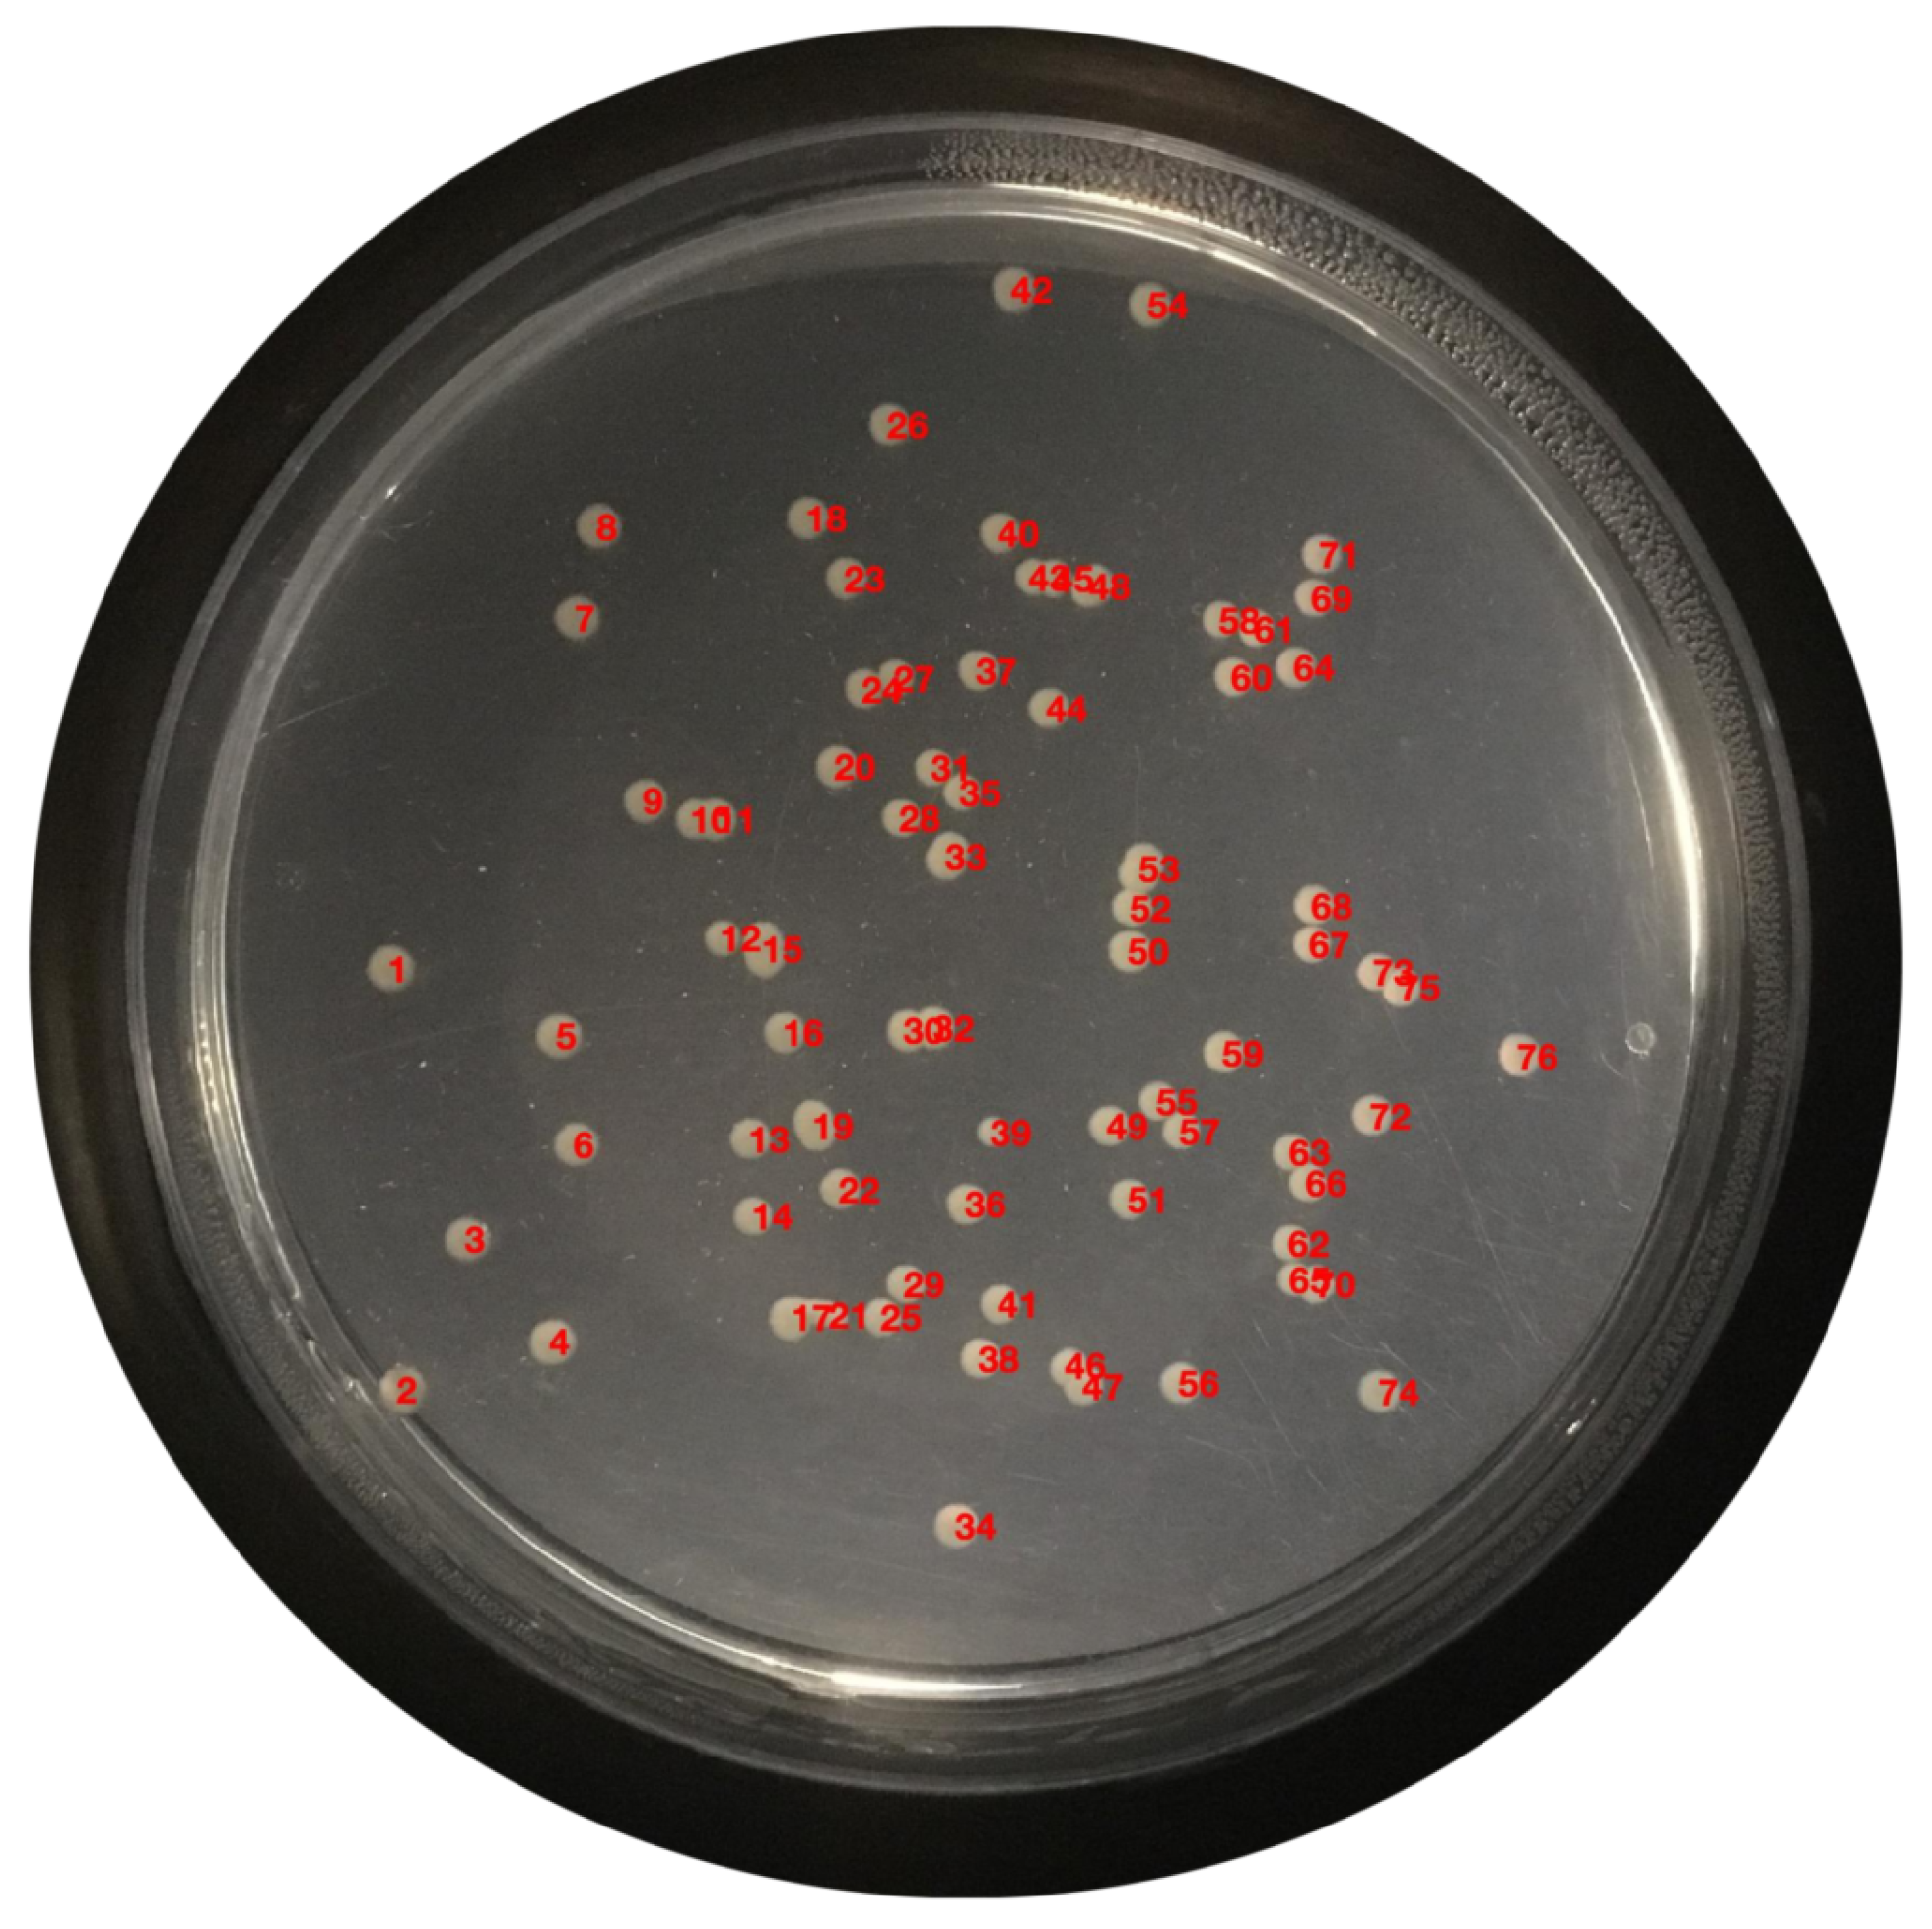
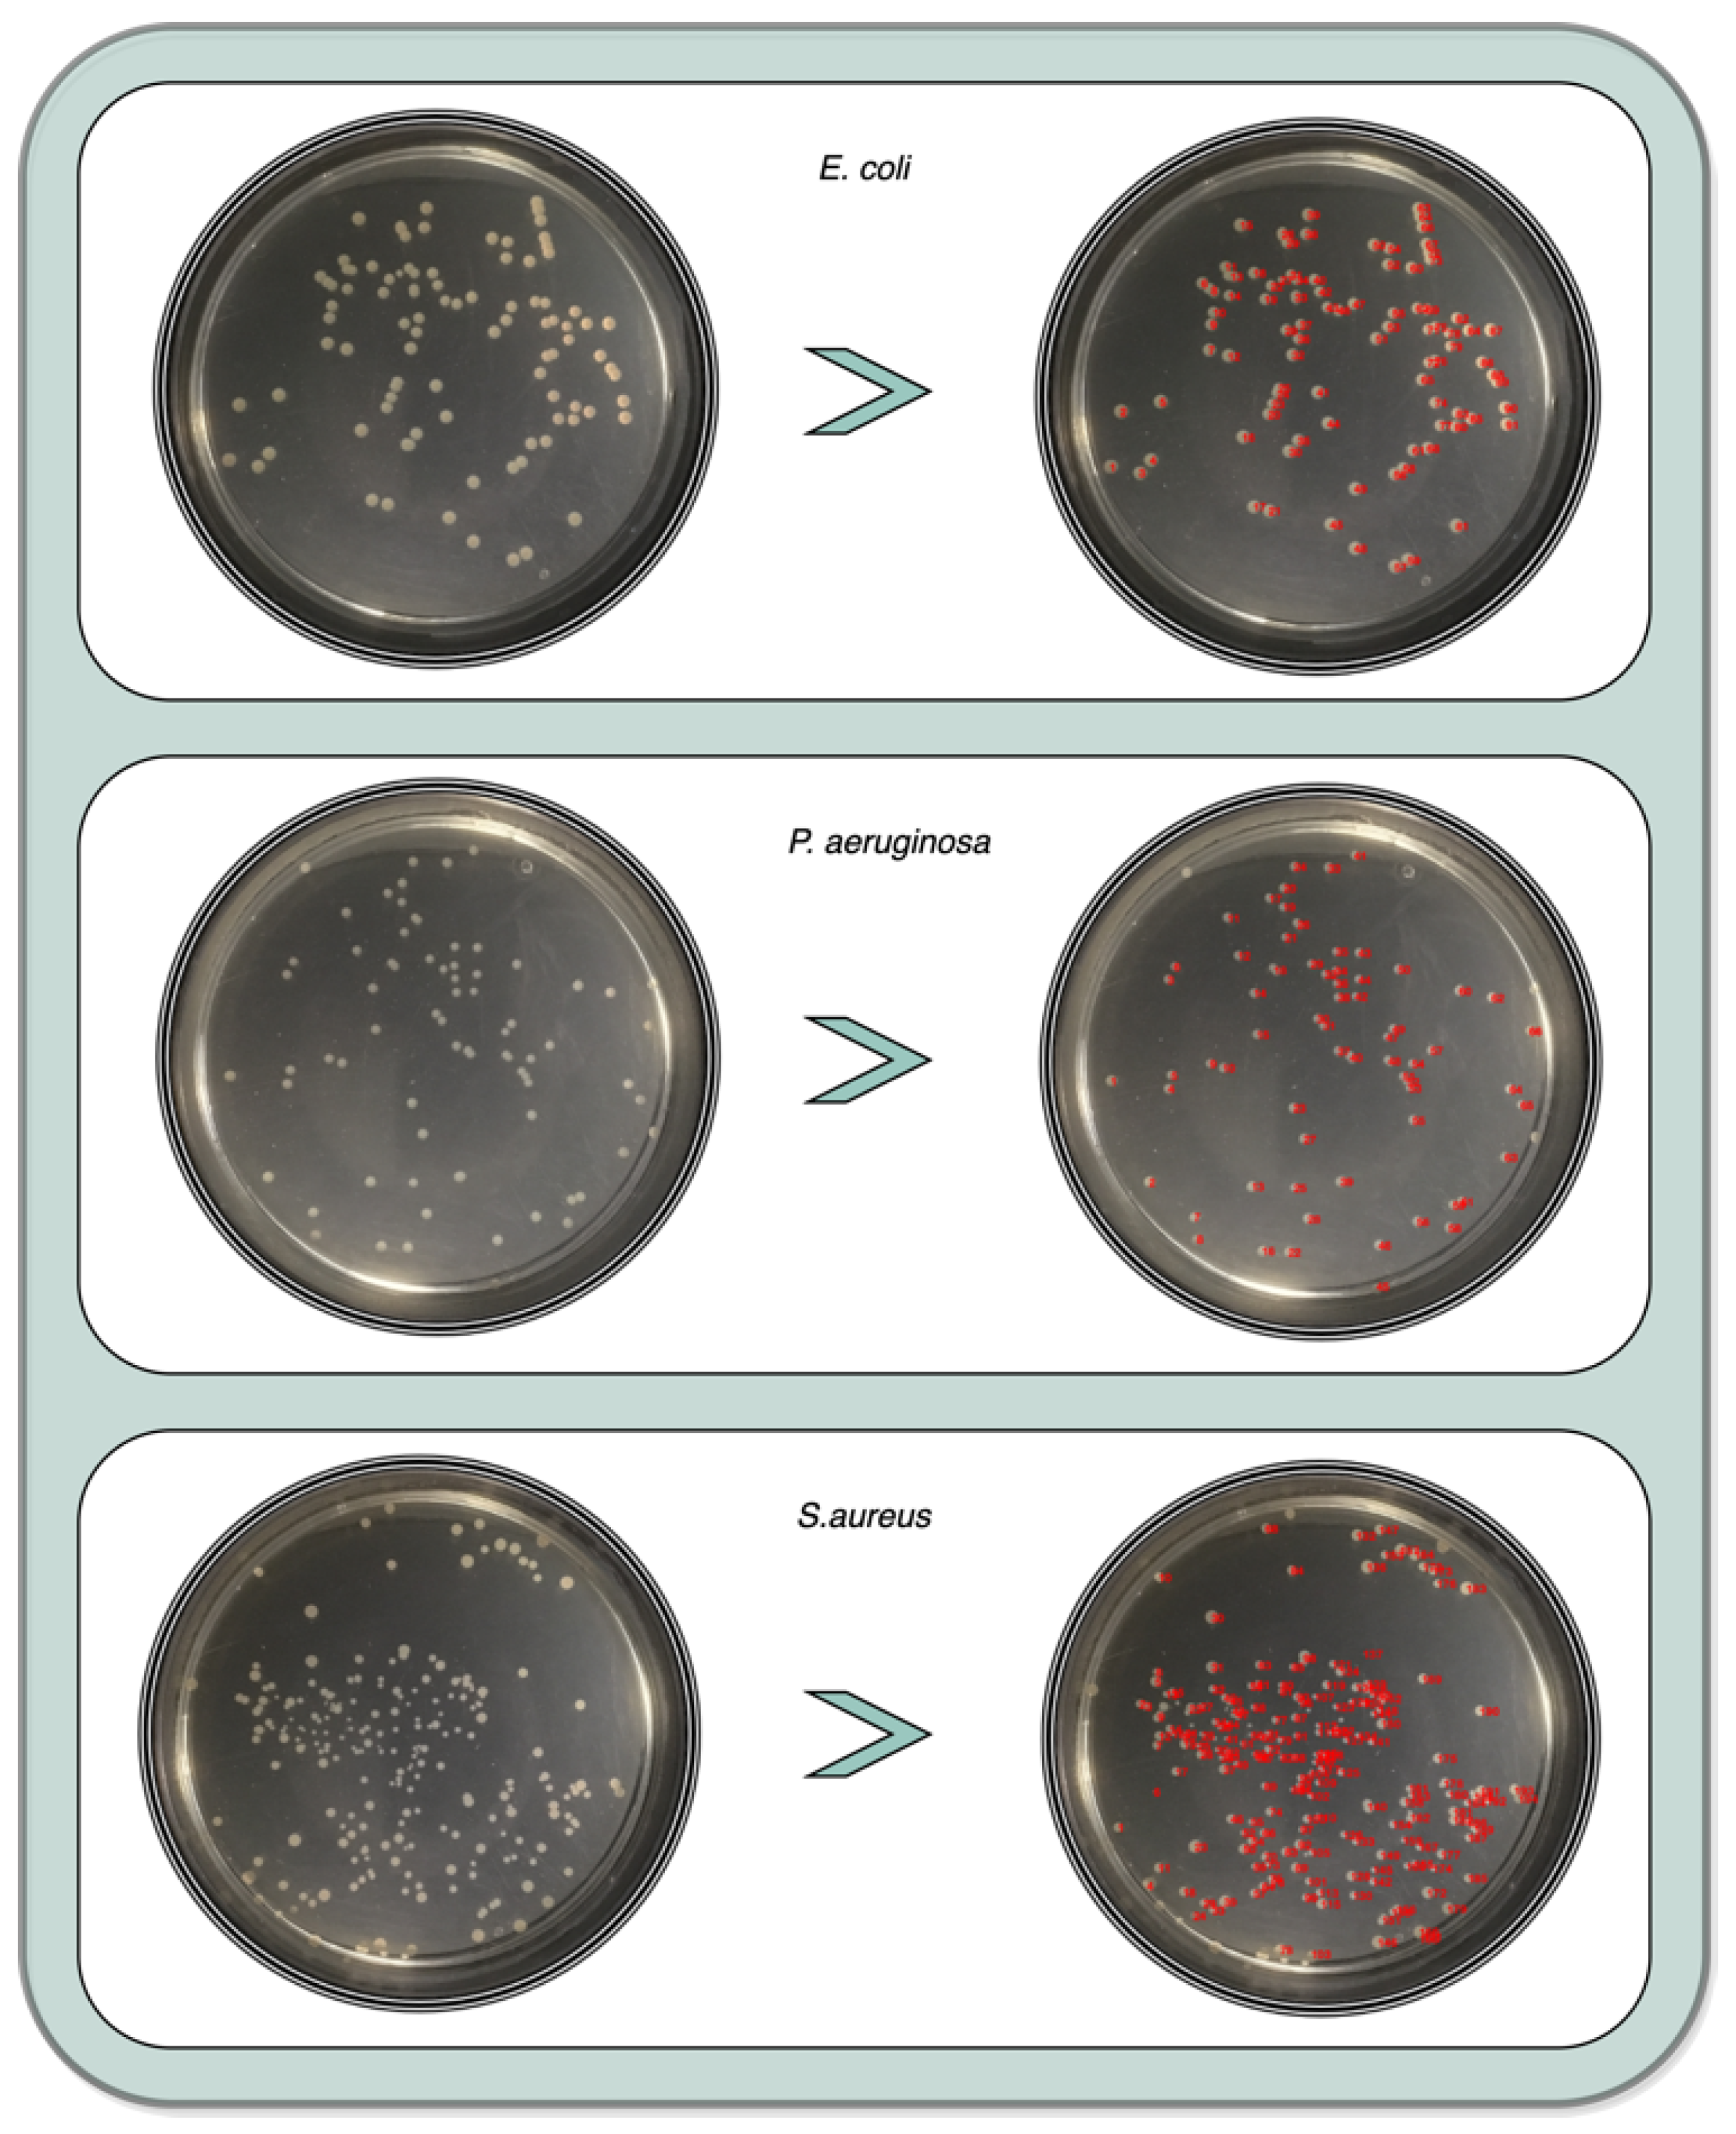
2.5. Enumeration
2.6. Classification Measurements
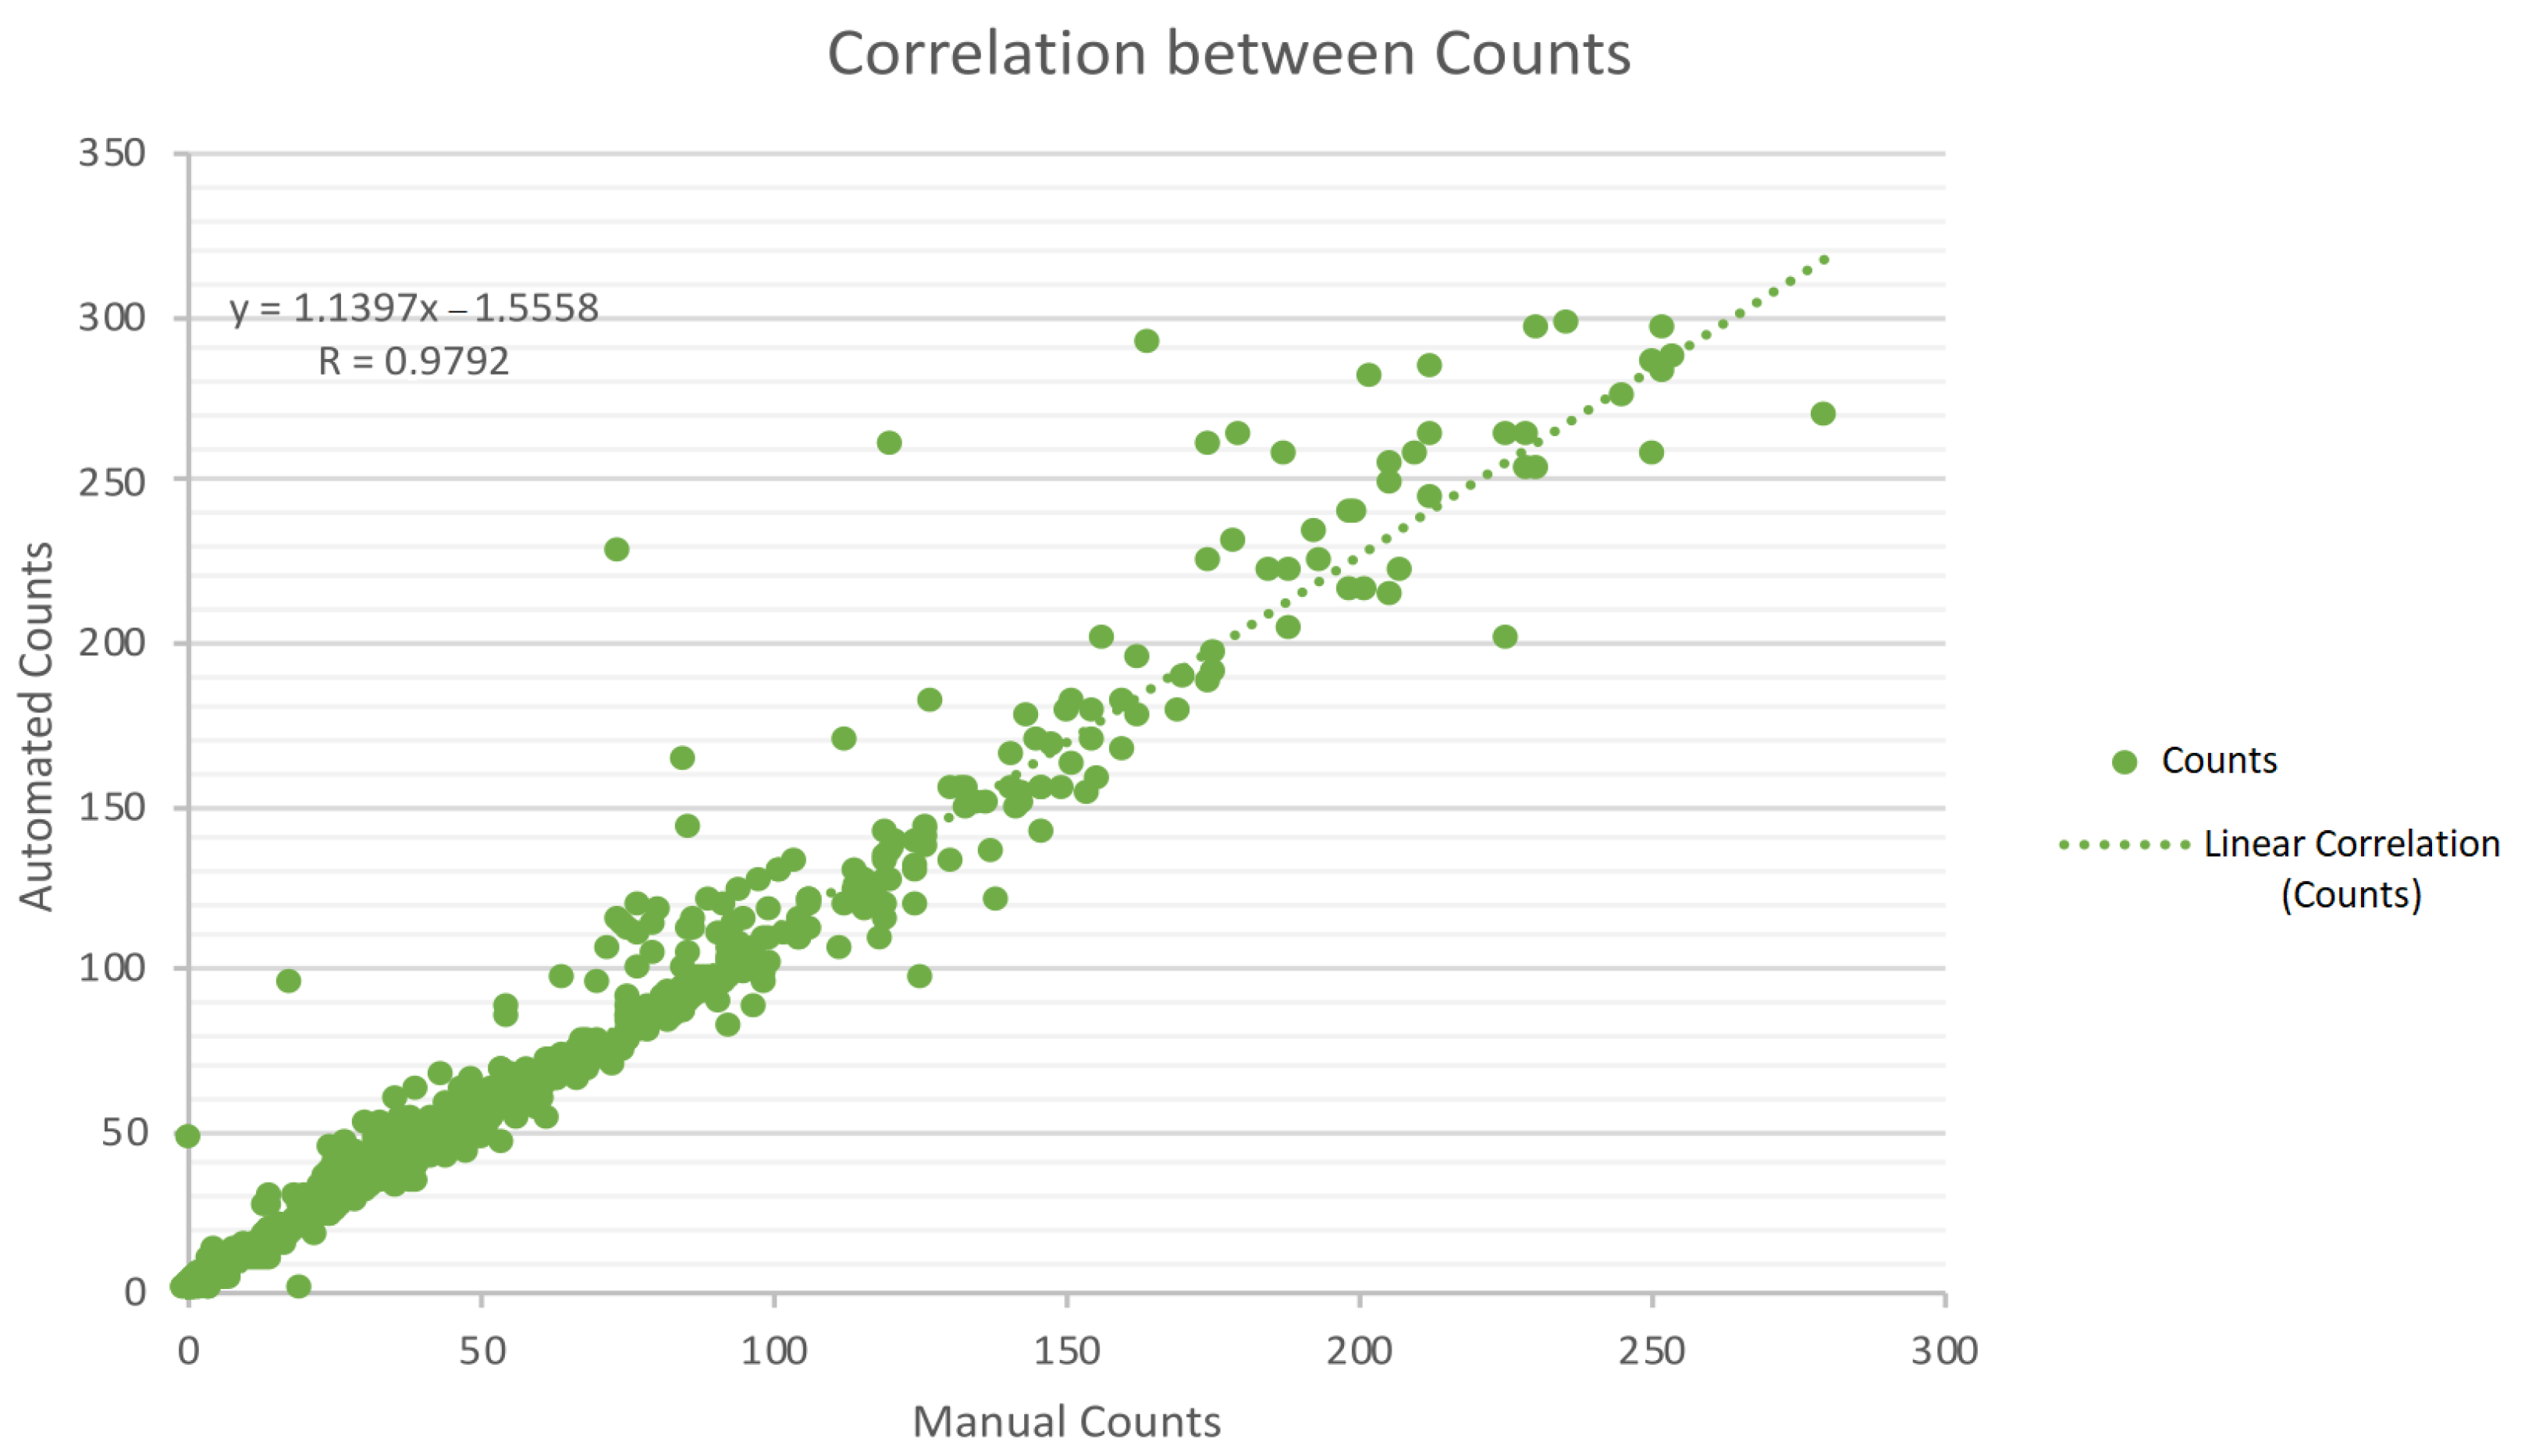
3. Results and Discussion
4. Conclusions
Author Contributions
Funding
Institutional Review Board Statement
Informed Consent Statement
Data Availability Statement
Conflicts of Interest
References
- Clarke, M.L.; Burton, R.L.; Hill, A.N.; Litorja, M.; Nahm, M.H.; Hwang, J. Low-cost, high-throughput, automated counting of bacterial colonies. Cytom. Part A 2010, 77A, 790–797. [Google Scholar] [CrossRef] [PubMed] [Green Version]
- Hogekamp, L.; Hogekamp, S.H.; Stahl, M.R. Experimental setup and image processing method for automatic enumeration of bacterial colonies on agar plates. PLoS ONE 2020, 15, e0232869. [Google Scholar] [CrossRef] [PubMed]
- Puchkov, E. Image Analysis in Microbiology: A Review. J. Comput. Commun. 2016, 4, 8–32. [Google Scholar] [CrossRef] [Green Version]
- Niyazi, M.; Niyazi, I.; Belka, C. Counting colonies of clonogenic assays by using densitometric software. Radiat. Oncol. 2007, 2. [Google Scholar] [CrossRef] [Green Version]
- Zhang, C.; Chen, W.B.; Liu, W.L.; Chen, C.B. An Automated Bacterial Colony Counting System. In Proceedings of the 2008 IEEE International Conference on Sensor Networks, Ubiquitous, and Trustworthy Computing (SUTC 2008), Taichung, Taiwan, 11–13 June 2008. [Google Scholar] [CrossRef]
- Brugger, S.D.; Baumberger, C.; Jost, M.; Jenni, W.; Brugger, U.; Mühlemann, K. Automated Counting of Bacterial Colony Forming Units on Agar Plates. PLoS ONE 2012, 7, e33695. [Google Scholar] [CrossRef] [Green Version]
- Martinez-Espinosa, J.C.; Cordova-Fraga, T.; Vargas-Luna, M.; Ortiz-Alvarado, J.D.; Pablo, A.I.R.; Cisneros, M.T.; Guzmán-Cabrera, R.; Aguilar, J.F.; Diaz-Medina, O. Nondestructive technique for bacterial count based on image processing. Biol. Eng. Med. 2016, 12, 15. [Google Scholar] [CrossRef]
- Geissmann, Q. OpenCFU, a New Free and Open-Source Software to Count Cell Colonies and Other Circular Objects. PLoS ONE 2013, 8, e54072. [Google Scholar] [CrossRef] [Green Version]
- Chiang, P.J.; Tseng, M.J.; He, Z.S.; Li, C.H. Automated counting of bacterial colonies by image analysis. J. Microbiol. Methods 2015, 108, 74–82. [Google Scholar] [CrossRef]
- Bernard, R.; Kanduser, M.; Pernus, F. Model-based automated detection of mammalian cell colonies. Phys. Med. Biol. 2001, 46, 3061–3072. [Google Scholar] [CrossRef]
- Barber, P.R.; Vojnovic, B.; Kelly, J.; Mayes, C.R.; Boulton, P.; Woodcock, M.; Joiner, M.C. Automated counting of mammalian cell colonies. Phys. Med. Biol. 2000, 46, 63–76. [Google Scholar] [CrossRef]
- Swinnen, I. Predictive modelling of the microbial lag phase: A review. Int. J. Food Microbiol. 2004, 94, 137–159. [Google Scholar] [CrossRef] [PubMed]
- Pham, D.L.; Xu, C.; Prince, J.L. Current Methods in Medical Image Segmentation. Annu. Rev. Biomed. Eng. 2000, 2, 315–337. [Google Scholar] [CrossRef] [PubMed]
- Mehdi, A.; Vu, K.N.; Lambert, F. Pytri: A multi-weight detection system for biological entities. bioRxiv 2022, 1–6. [Google Scholar] [CrossRef]
- Colwell, R.R. Bacterial Death Revisited. In Nonculturable Microorganisms in the Environment; Springer: New York, NY, USA, 2000; pp. 325–342. [Google Scholar] [CrossRef]
- Trüper, H.G.; Schleifer, K.H. Prokaryote Characterization and Identification. In The Prokaryotes; Springer: New York, NY, USA, 2006; pp. 58–79. [Google Scholar] [CrossRef]
- Sousa, A.M.; Machado, I.; Nicolau, A.; Pereira, M.O. Improvements on colony morphology identification towards bacterial profiling. J. Microbiol. Methods 2013, 95, 327–335. [Google Scholar] [CrossRef] [Green Version]
- Payasi, Y.; Patidar, S. Diagnosis and counting of tuberculosis bacilli using digital image processing. In Proceedings of the 2017 International Conference on Information, Communication, Instrumentation and Control (ICICIC), Indore, India, 17–19 August 2017. [Google Scholar] [CrossRef]
- Austerjost, J.; Marquard, D.; Raddatz, L.; Geier, D.; Becker, T.; Scheper, T.; Lindner, P.; Beutel, S. A smart device application for the automated determination of E. coli colonies on agar plates. Eng. Life Sci. 2017, 17, 959–966. [Google Scholar] [CrossRef] [Green Version]
- Siqueira, A.A.; de Carvalho, P.G.S. MicroCount: Free Software For Automated Microorganism Colony Counting By Computer. IEEE Lat. Am. Trans. 2017, 15, 2006–2011. [Google Scholar] [CrossRef]
- Chun Foong, W.; Yeo, J.; Gan, S.K.E. APD Colony Counter App: Using Watershed Algorithm for improved colony counting. Nat. Methods 2016, 1–3. [Google Scholar] [CrossRef]
- Alves, G.; Cruvinel, P. Customized computer vision and sensor system for colony recognition andlive bacteria counting in agriculture. Sens. Transducers 2016, 6, 65. [Google Scholar]
- Chen, W.B.; Zhang, C. Bacteria Colony Enumeration and Classification for Clonogenic Assay. In Proceedings of the 2008 Tenth IEEE International Symposium on Multimedia, Berkeley, CA, USA, 15–17 December 2008. [Google Scholar] [CrossRef]
- Kan, L. Quick Quantification System for Bacteria Number in Fresh Milk. Master’s Thesis, Huazhong University of Science & Technology, Wuhan, China, 2008. [Google Scholar]
- Ferrari, A.; Lombardi, S.; Signoroni, A. Bacterial colony counting by Convolutional Neural Networks. In Proceedings of the 2015 37th Annual International Conference of the IEEE Engineering in Medicine and Biology Society (EMBC), Milano, Italy, 25–29 August 2015. [Google Scholar] [CrossRef]
- Ferrari, A.; Lombardi, S.; Signoroni, A. Bacterial colony counting with Convolutional Neural Networks in Digital Microbiology Imaging. Pattern Recognit. 2017, 61, 629–640. [Google Scholar] [CrossRef]
- Andreini, P.; Bonechi, S.; Bianchini, M.; Mecocci, A.; Massa, V.D. Automatic Image Analysis and Classification for Urinary Bacteria Infection Screening. In Image Analysis and Processing—ICIAP 2015; Springer: Berlin/Heidelberg, Germany, 2015; pp. 635–646. [Google Scholar] [CrossRef] [Green Version]
- Devi, K.G.; Balasubramanian, K.; Ngoc, L.A. Machine Learning and Deep Learning Techniques for Medical Science; Taylor & Francis Group: Abingdon, UK, 2022. [Google Scholar]
- Jayaraman, S. Digital Image Processing; Tata McGraw-Hill Education: New Delhi, India, 2022. [Google Scholar]
- Russ, J.C. The Image Processing Handbook, 5th ed.; CRC Press: Boca Raton, FL, USA, 2007. [Google Scholar]
- Tyagi, V. Understanding Digital Image Processing; CRC Press: Boca Raton, FL, USA, 2022. [Google Scholar]
- Solomon, C.; Breckon, T. Fundamentals of Digital Image Processing; Wiley-Blackwell: Oxford, UK, 2011. [Google Scholar]
- Gonzalez, R.; Woods, R. Digital Image Processing; Pearson: New York, NY, USA, 2018. [Google Scholar]
- Stehman, S.V. Selecting and interpreting measures of thematic classification accuracy. Remote Sens. Environ. 1997, 62, 77–89. [Google Scholar] [CrossRef]
- Breed, R.S.; Dotterrer, W.D. The Number of Colonies Allowable on Satisfactory Agar Plates. J. Bacteriol. 1916, 1, 321–331. [Google Scholar] [CrossRef] [PubMed] [Green Version]


| Microorganism Type | Pre-Processing | Segmentation | Accuracy | Work |
|---|---|---|---|---|
| Bacteria | HSI color space processing | Thresholding | 90% | [18] |
| Bacteria | - | Iterative thresholding and Hough Transform | 86.76% | [19] |
| Bacteria | Median Filter | Thresholding, Canny Operator and Hough Transform | 92.31% | [20] |
| Bacteria | Laplacian Filtering | Watershed and Distance Transform | 90.30% | [21] |
| Bacteria | Laplacian Filtering and Hough transform | Otsu thresholding | 90% | [22] |
| Bacteria | - | Watershed | 80% | [23] |
| Bacteria | Median Filter | Distance Transform and Watershed | 86.5% | [24] |
| Bacteria | Contrast limited adaptive histogram equalization | Watershed | 92.1% | [25] |
| Bacteria | - | Thresholding | 92.8% | [26] |
| Bacteria | Morphological filter | Random Hough circle transform and thresholding | 92.1% | [27] |
| Interval | Accuracy | Recall | F-Measure |
|---|---|---|---|
| 0–50 | 90% | 91% | 0.91 |
| 51–100 | 92% | 93% | 0.93 |
| 101–150 | 87% | 89% | 0.88 |
| 151–200 | 88% | 90% | 0.89 |
| 201–250 | 84% | 87% | 0.85 |
| 251–300 | 81% | 86% | 0.82 |
| More than 300 | 94% | − | − |
| Others | 74% | 80% | 0.77 |
| Group | Accuracy | Recall | F-Measure |
|---|---|---|---|
| 0–100 | 91% | 92% | 0.92 |
| 101–200 | 88% | 90% | 0.89 |
| 201–300 | 82% | 86% | 0.84 |
| More than 300 | 94% | − | − |
| Bacteria | Accuracy | Recall | F-measure | |
|---|---|---|---|---|
| 0–300 | More than 300 | 0–300 | 0–300 | |
| E. coli | 95% | 96% | 95% | 0.95 |
| P. aeruginosa | 90% | 93% | 91% | 0.90 |
| S. aureus | 84% | 94% | 86% | 0.85 |
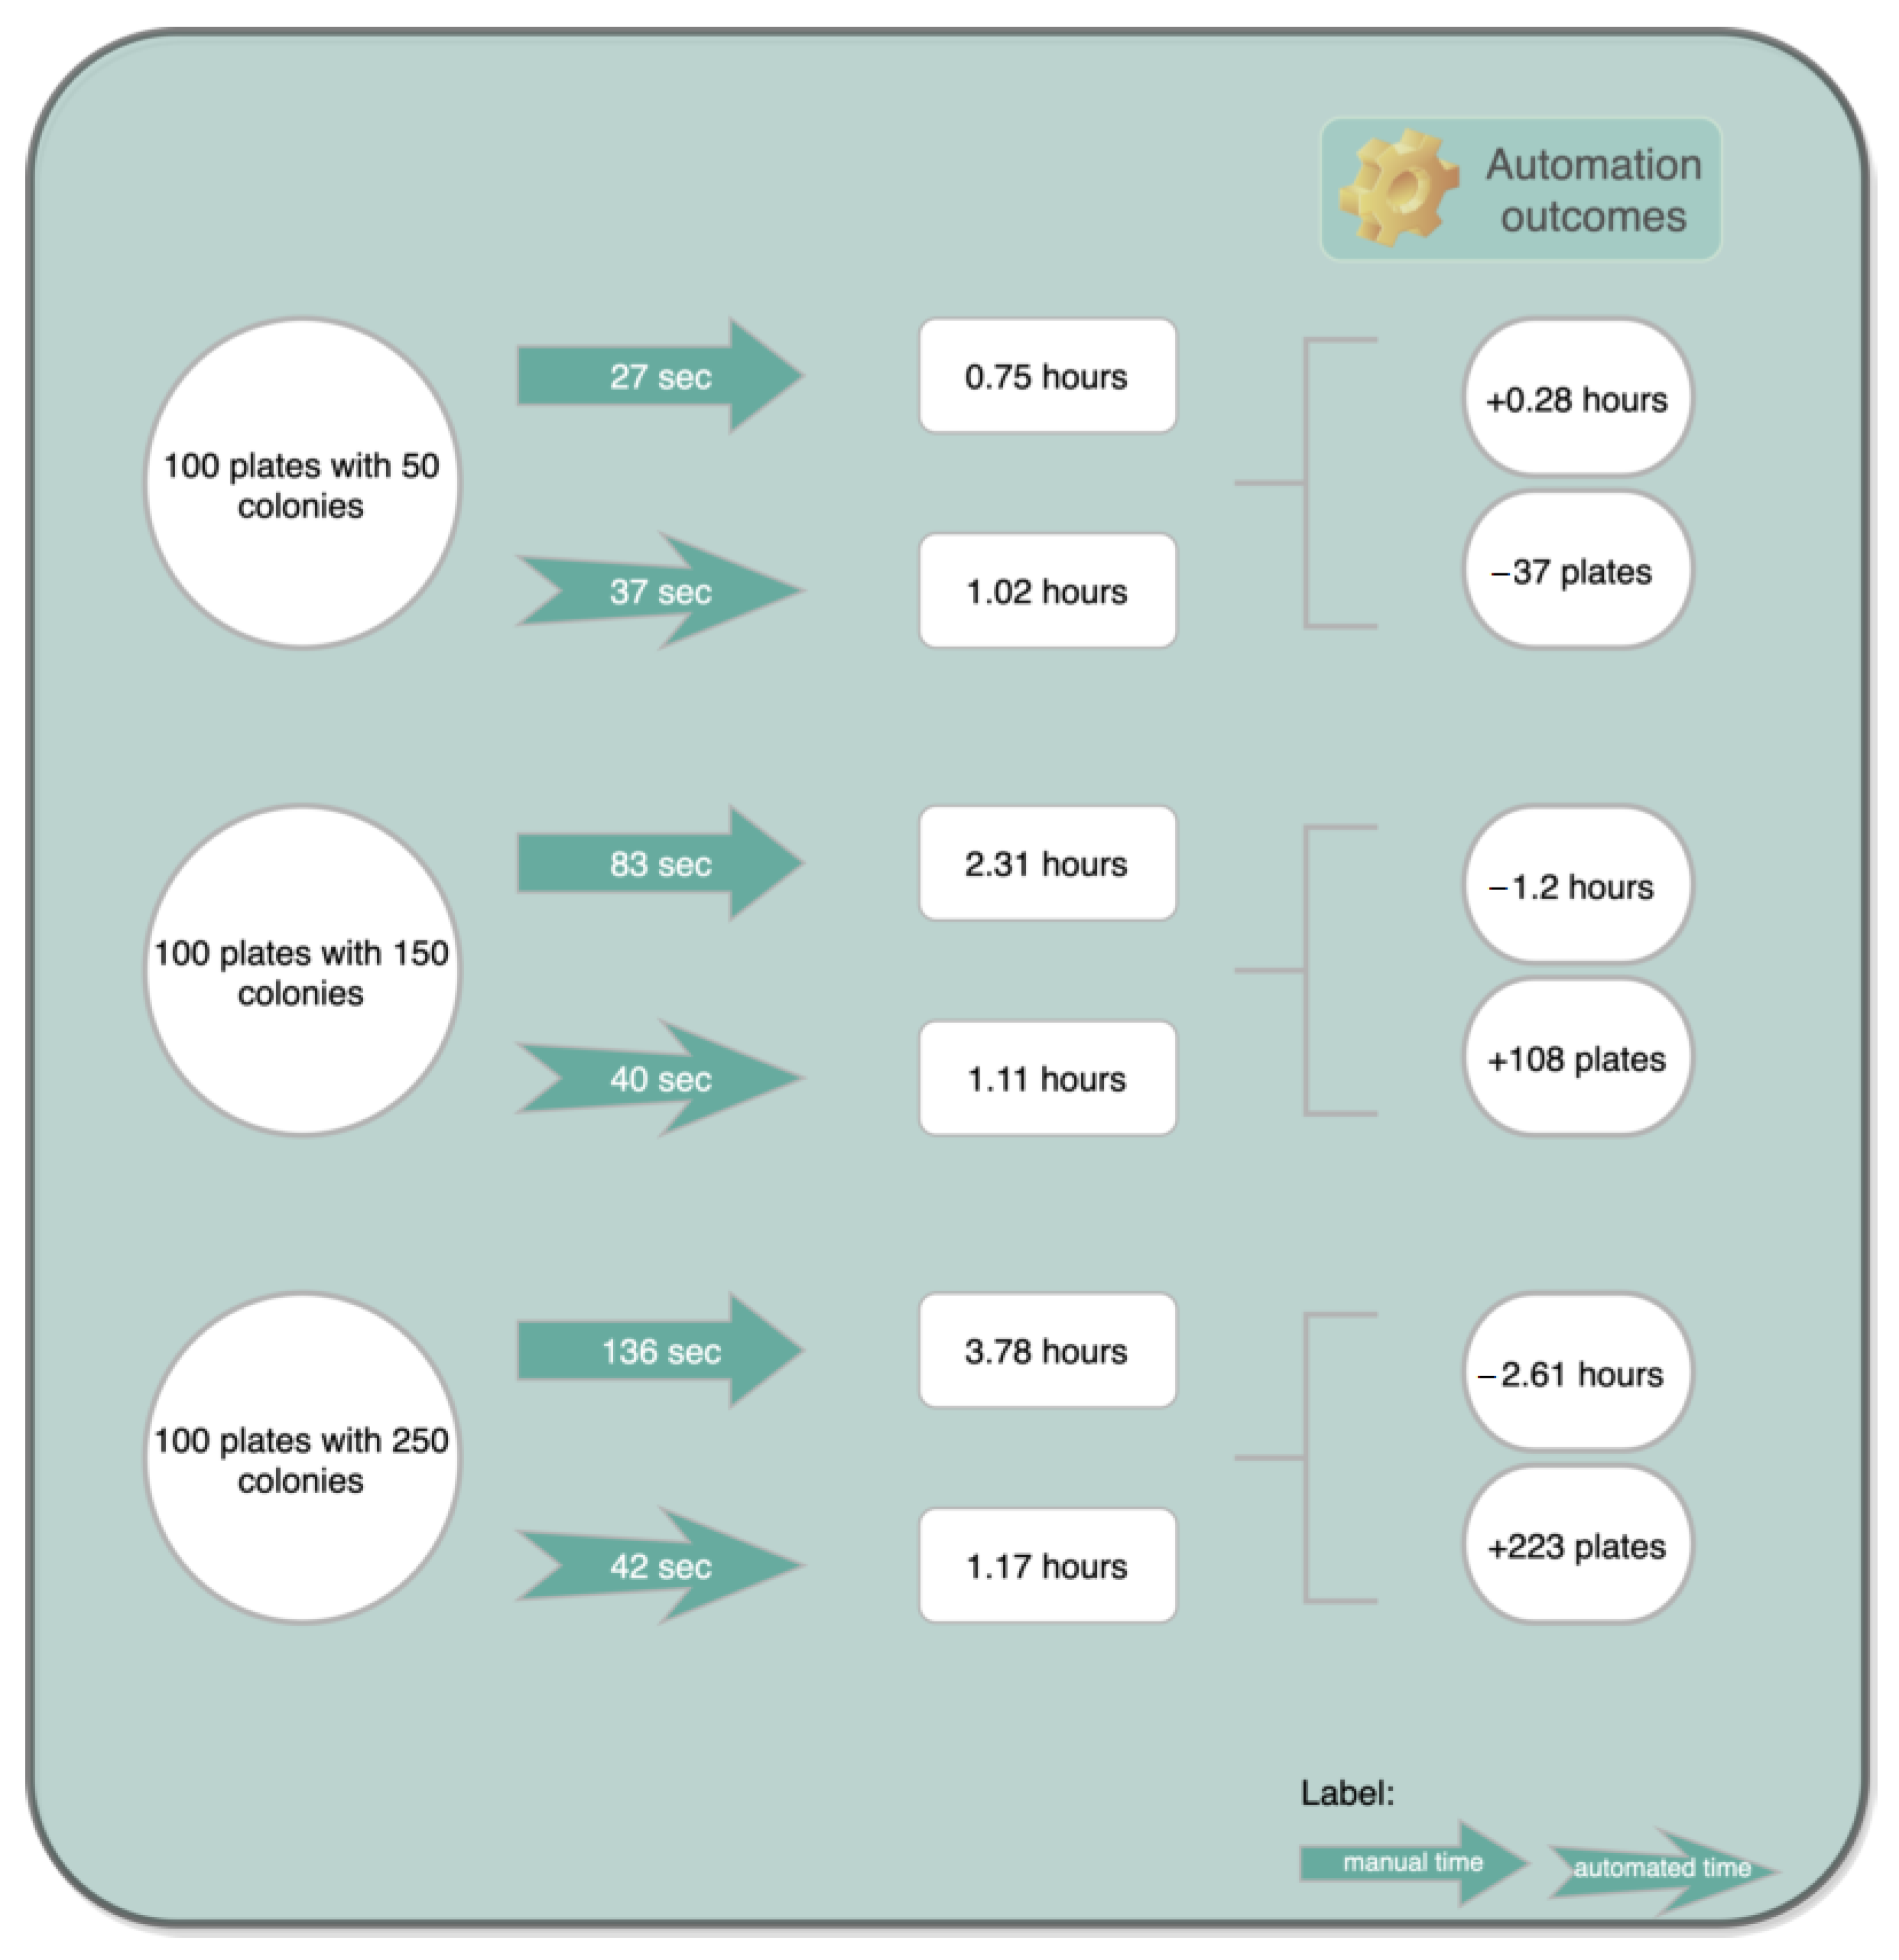
| # Colonies | tmanual (s) | talgorithm (s) |
|---|---|---|
| 30 | 20 | 36 |
| 50 | 27 | 37 |
| 100 | 58 | 38 |
| 150 | 83 | 40 |
| 200 | 109 | 41 |
| 250 | 136 | 42 |
| 300 | 162 | 44 |
Publisher’s Note: MDPI stays neutral with regard to jurisdictional claims in published maps and institutional affiliations. |
© 2022 by the authors. Licensee MDPI, Basel, Switzerland. This article is an open access article distributed under the terms and conditions of the Creative Commons Attribution (CC BY) license (https://creativecommons.org/licenses/by/4.0/).
Share and Cite
Rodrigues, P.M.; Luís, J.; Tavaria, F.K. Image Analysis Semi-Automatic System for Colony-Forming-Unit Counting. Bioengineering 2022, 9, 271. https://doi.org/10.3390/bioengineering9070271
Rodrigues PM, Luís J, Tavaria FK. Image Analysis Semi-Automatic System for Colony-Forming-Unit Counting. Bioengineering. 2022; 9(7):271. https://doi.org/10.3390/bioengineering9070271
Chicago/Turabian StyleRodrigues, Pedro Miguel, Jorge Luís, and Freni Kekhasharú Tavaria. 2022. "Image Analysis Semi-Automatic System for Colony-Forming-Unit Counting" Bioengineering 9, no. 7: 271. https://doi.org/10.3390/bioengineering9070271
APA StyleRodrigues, P. M., Luís, J., & Tavaria, F. K. (2022). Image Analysis Semi-Automatic System for Colony-Forming-Unit Counting. Bioengineering, 9(7), 271. https://doi.org/10.3390/bioengineering9070271