


Reference Values for 3D Spinal Posture Based on Videorasterstereographic Analyses of Healthy Adults
 , ,
, ,
Abstract
1. Introduction
2. Materials and Methods
2.1. Participants
2.2. Experimental Setup and Data Capture
2.3. Data Analysis
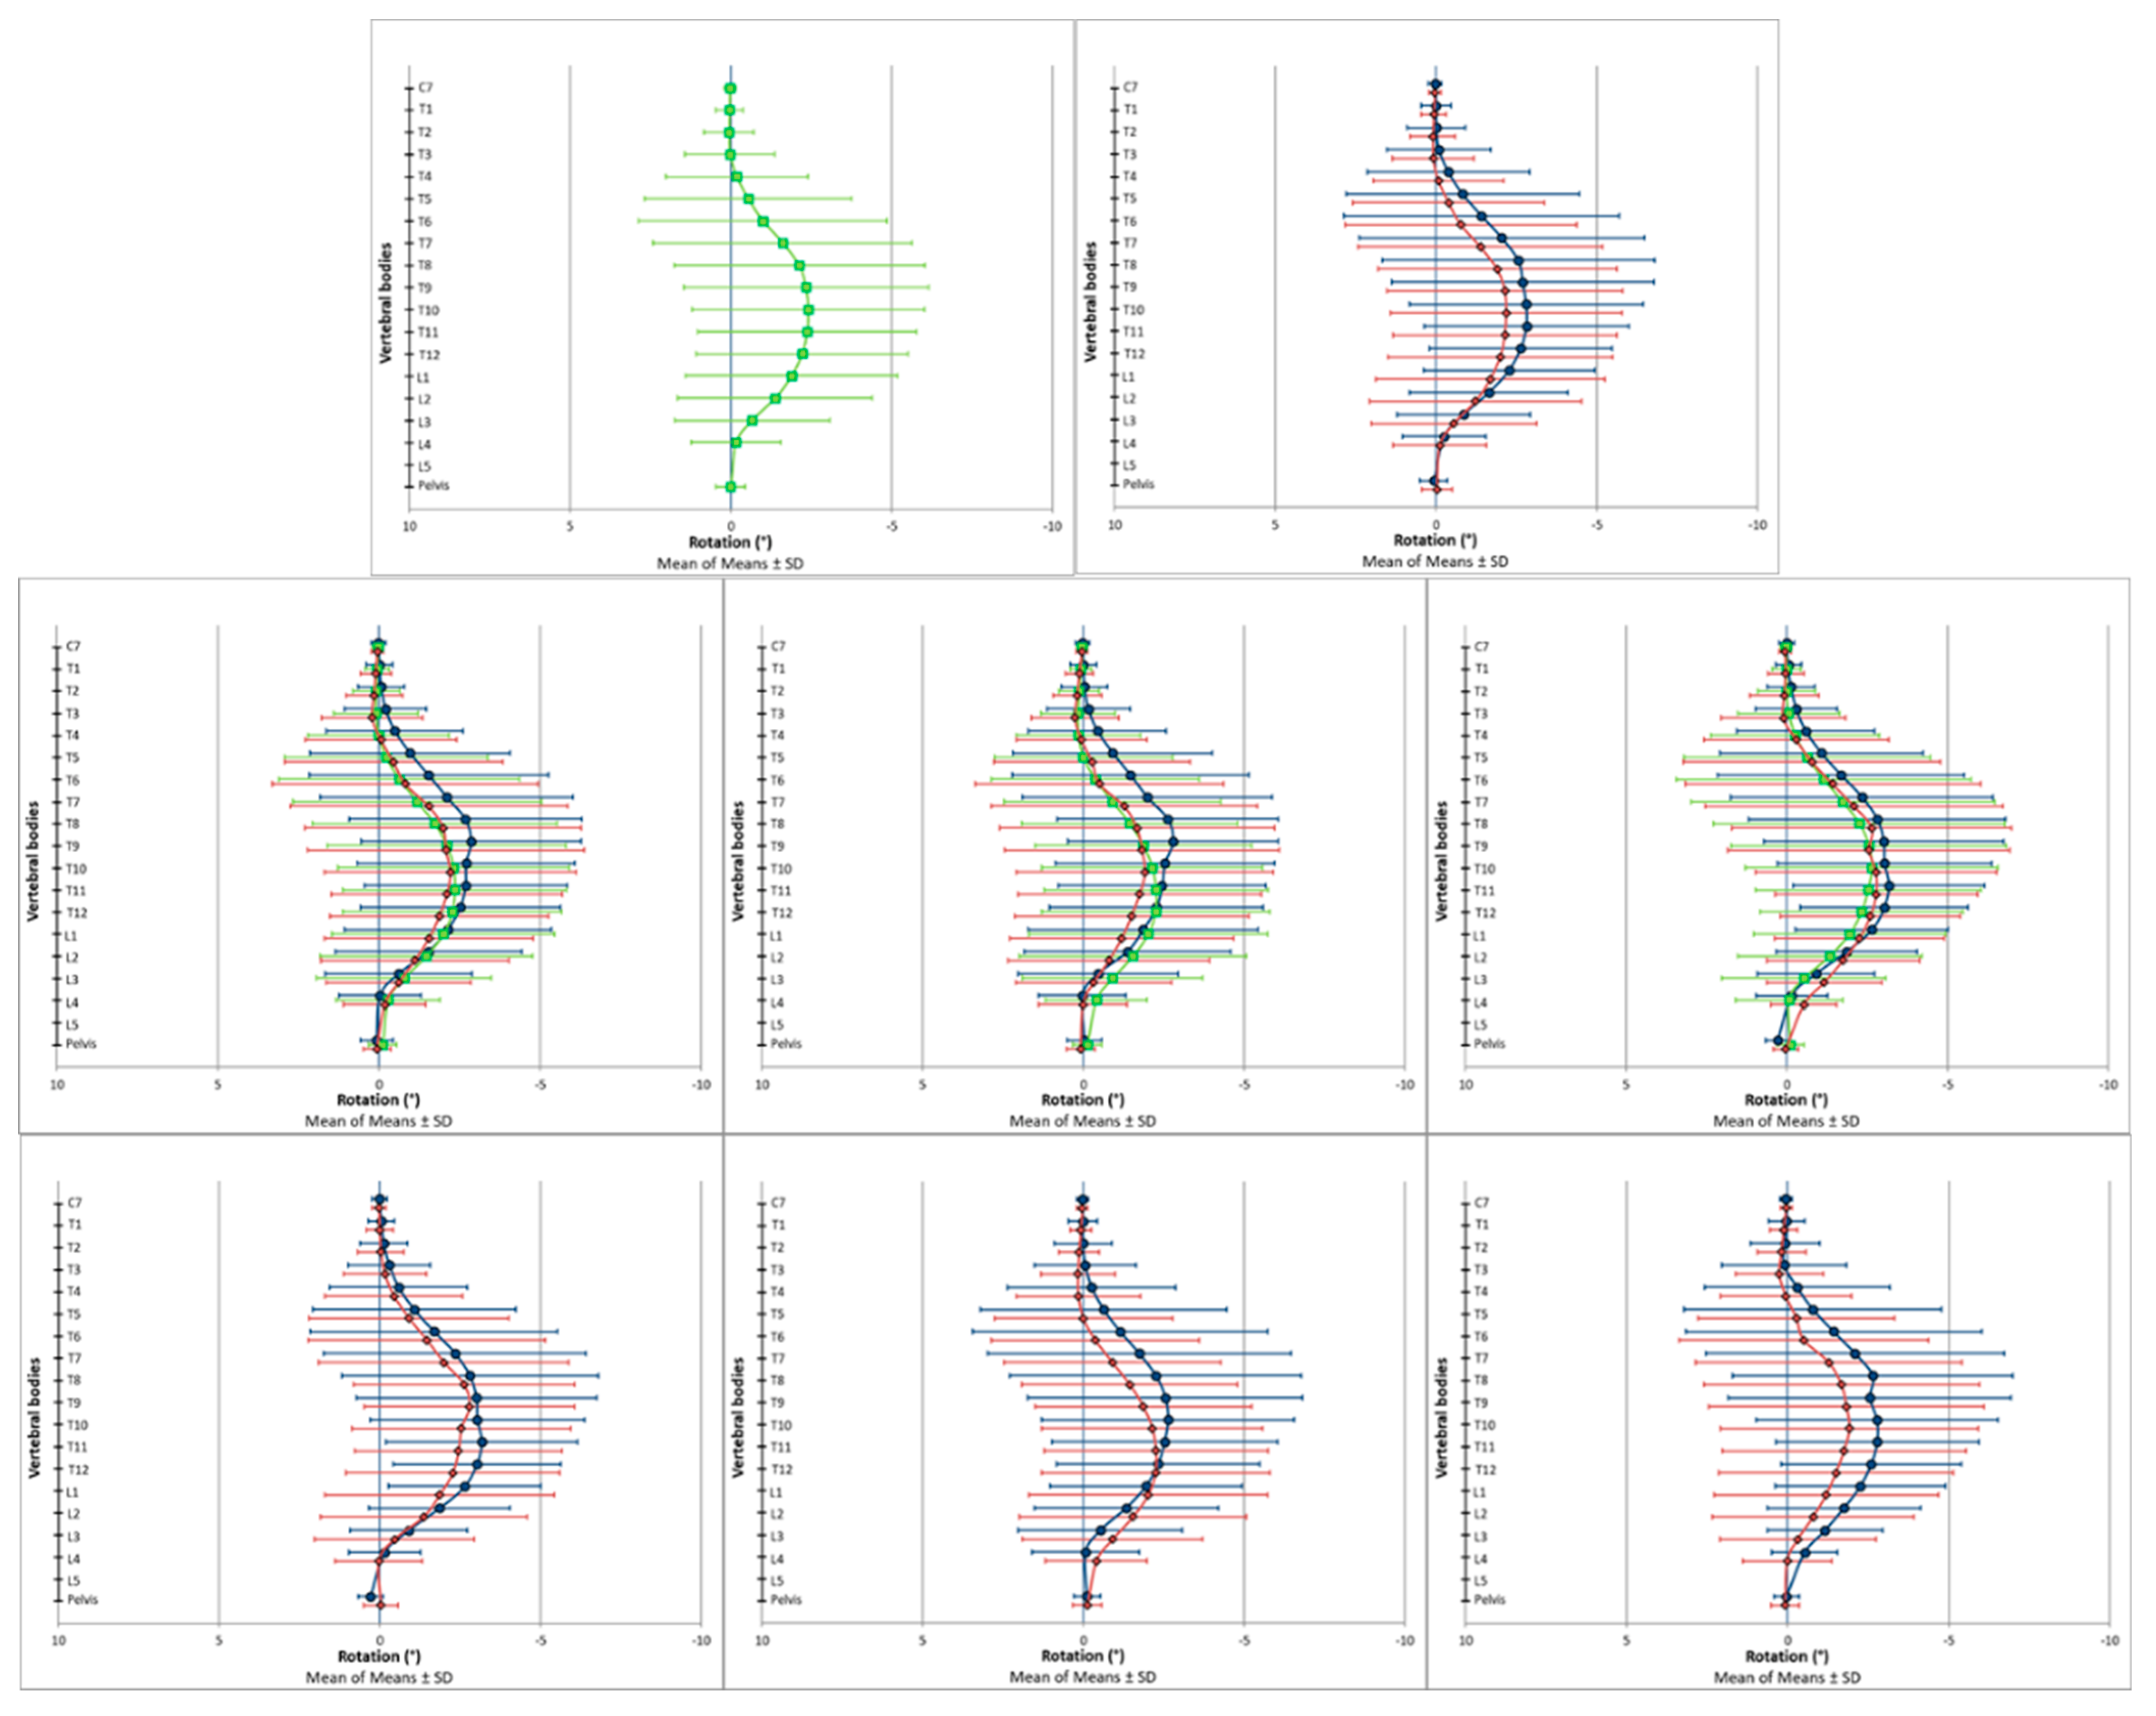
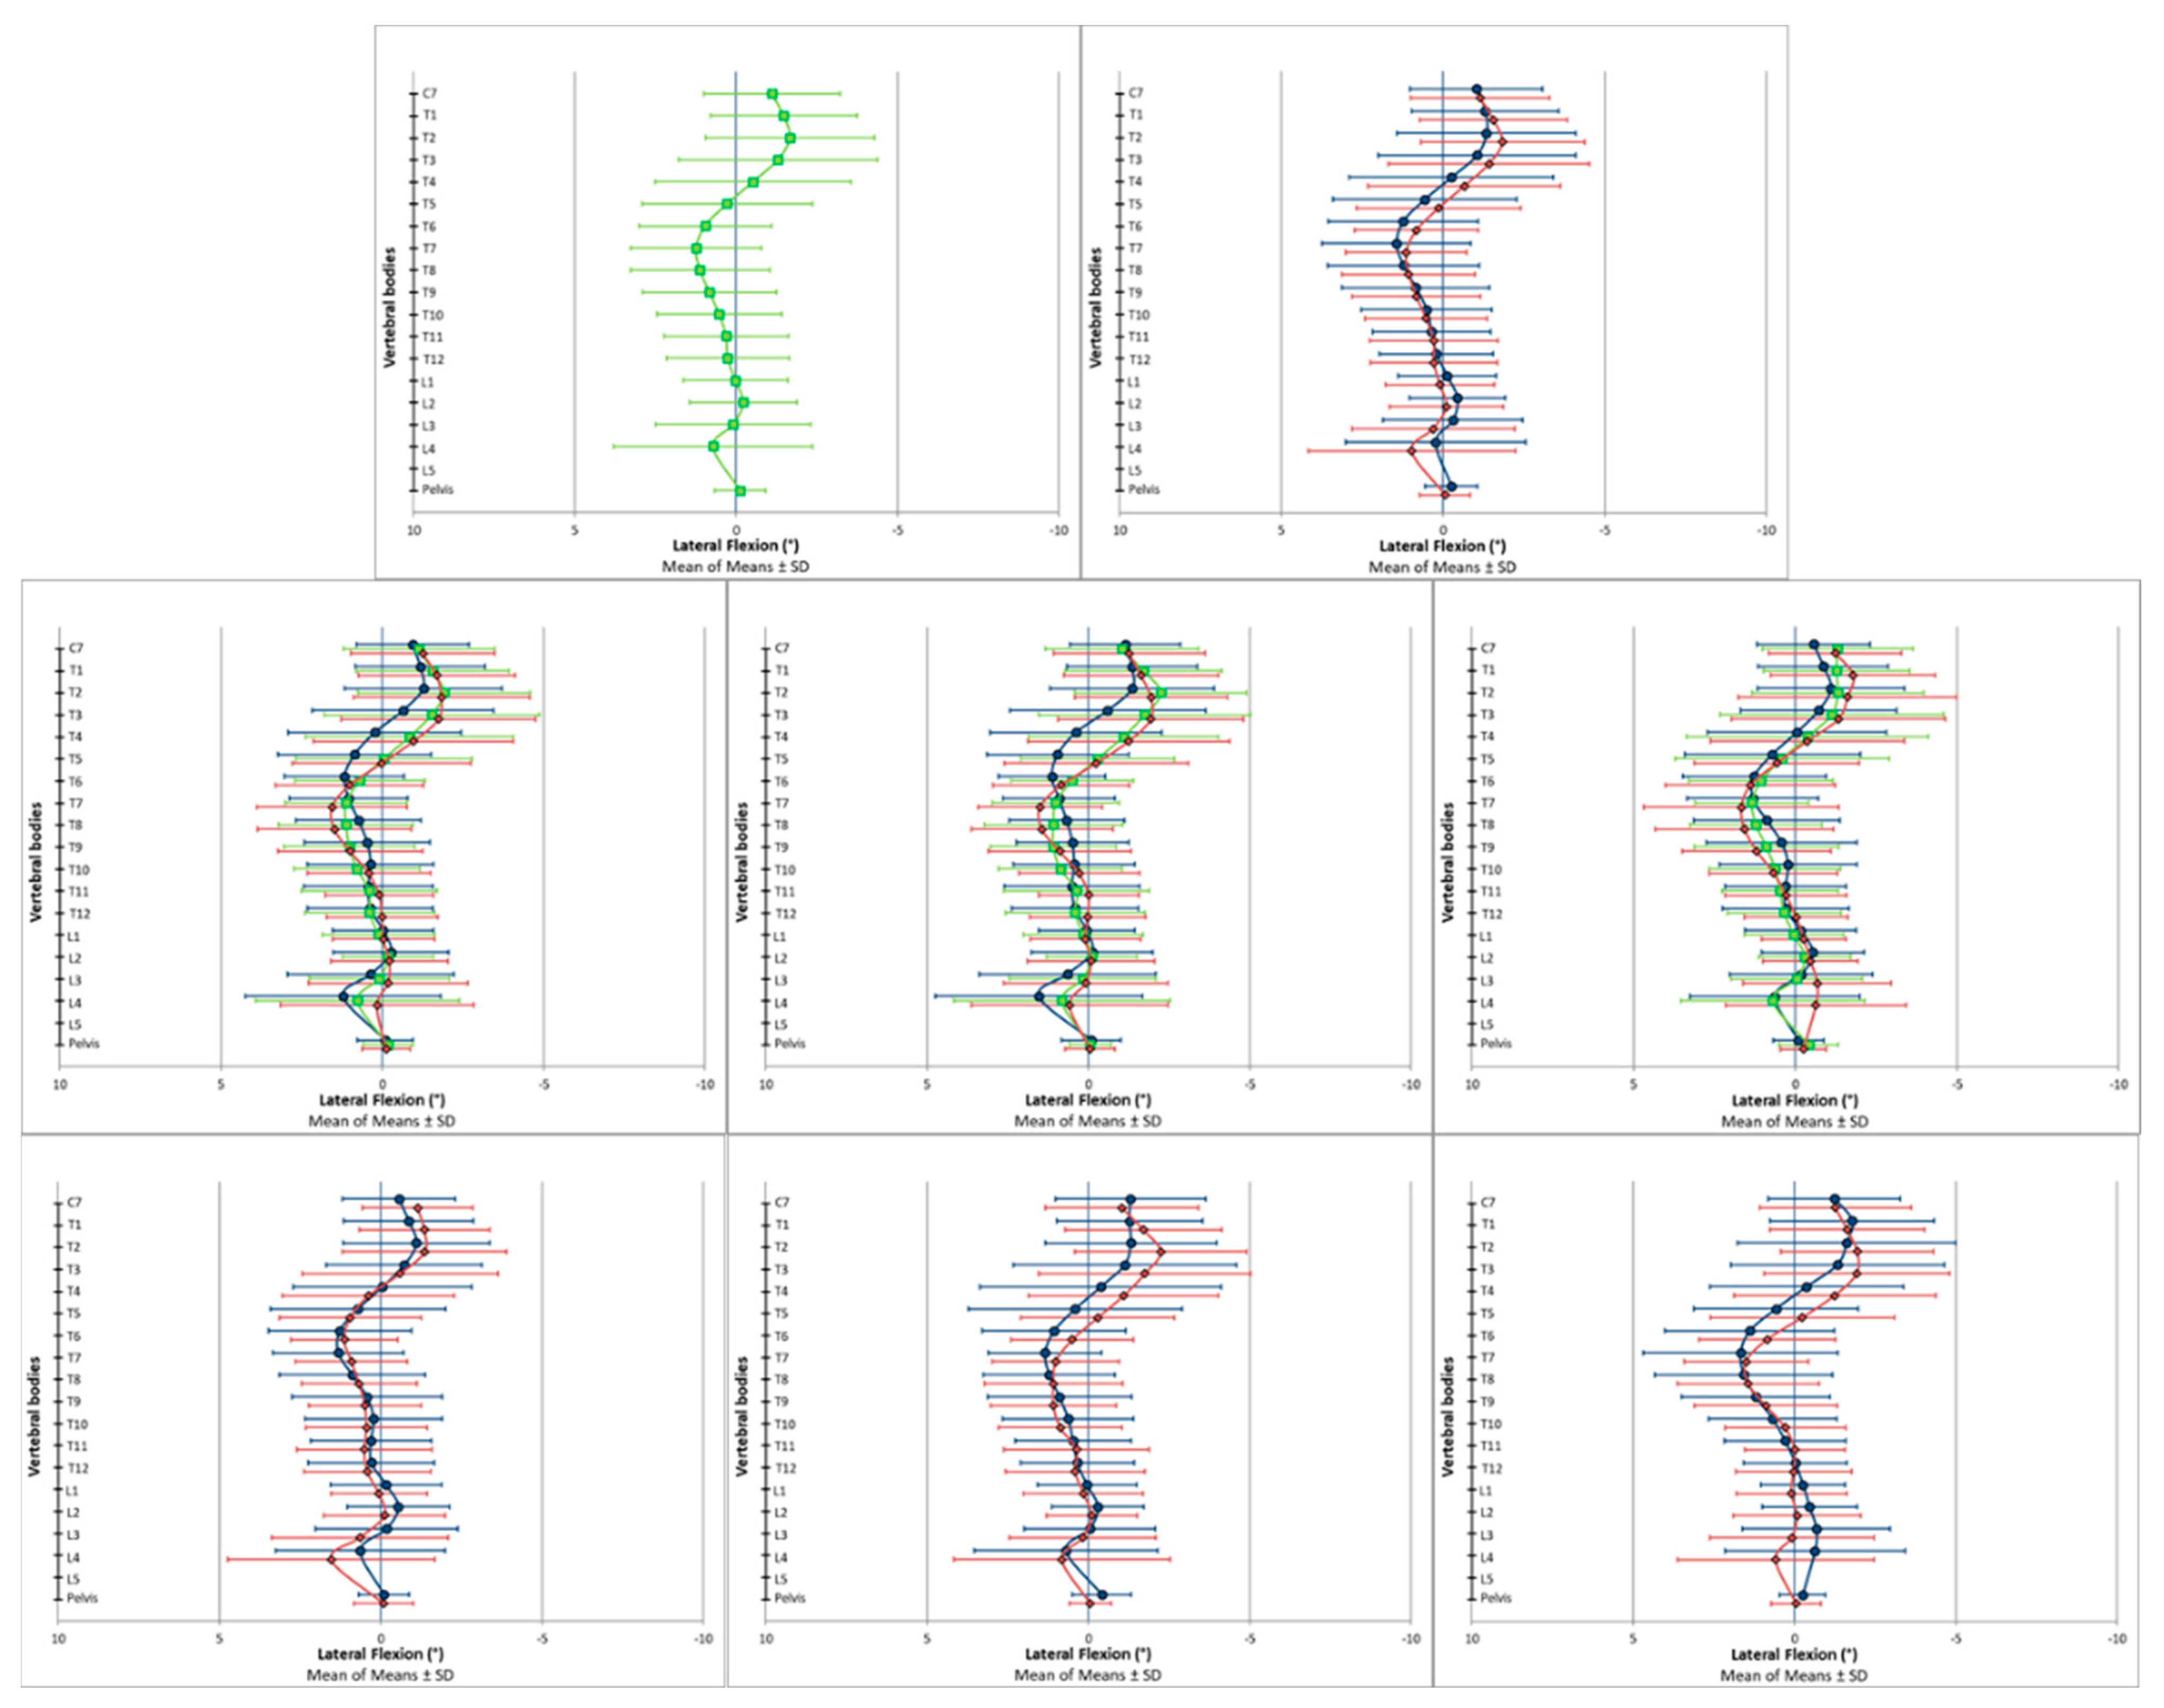
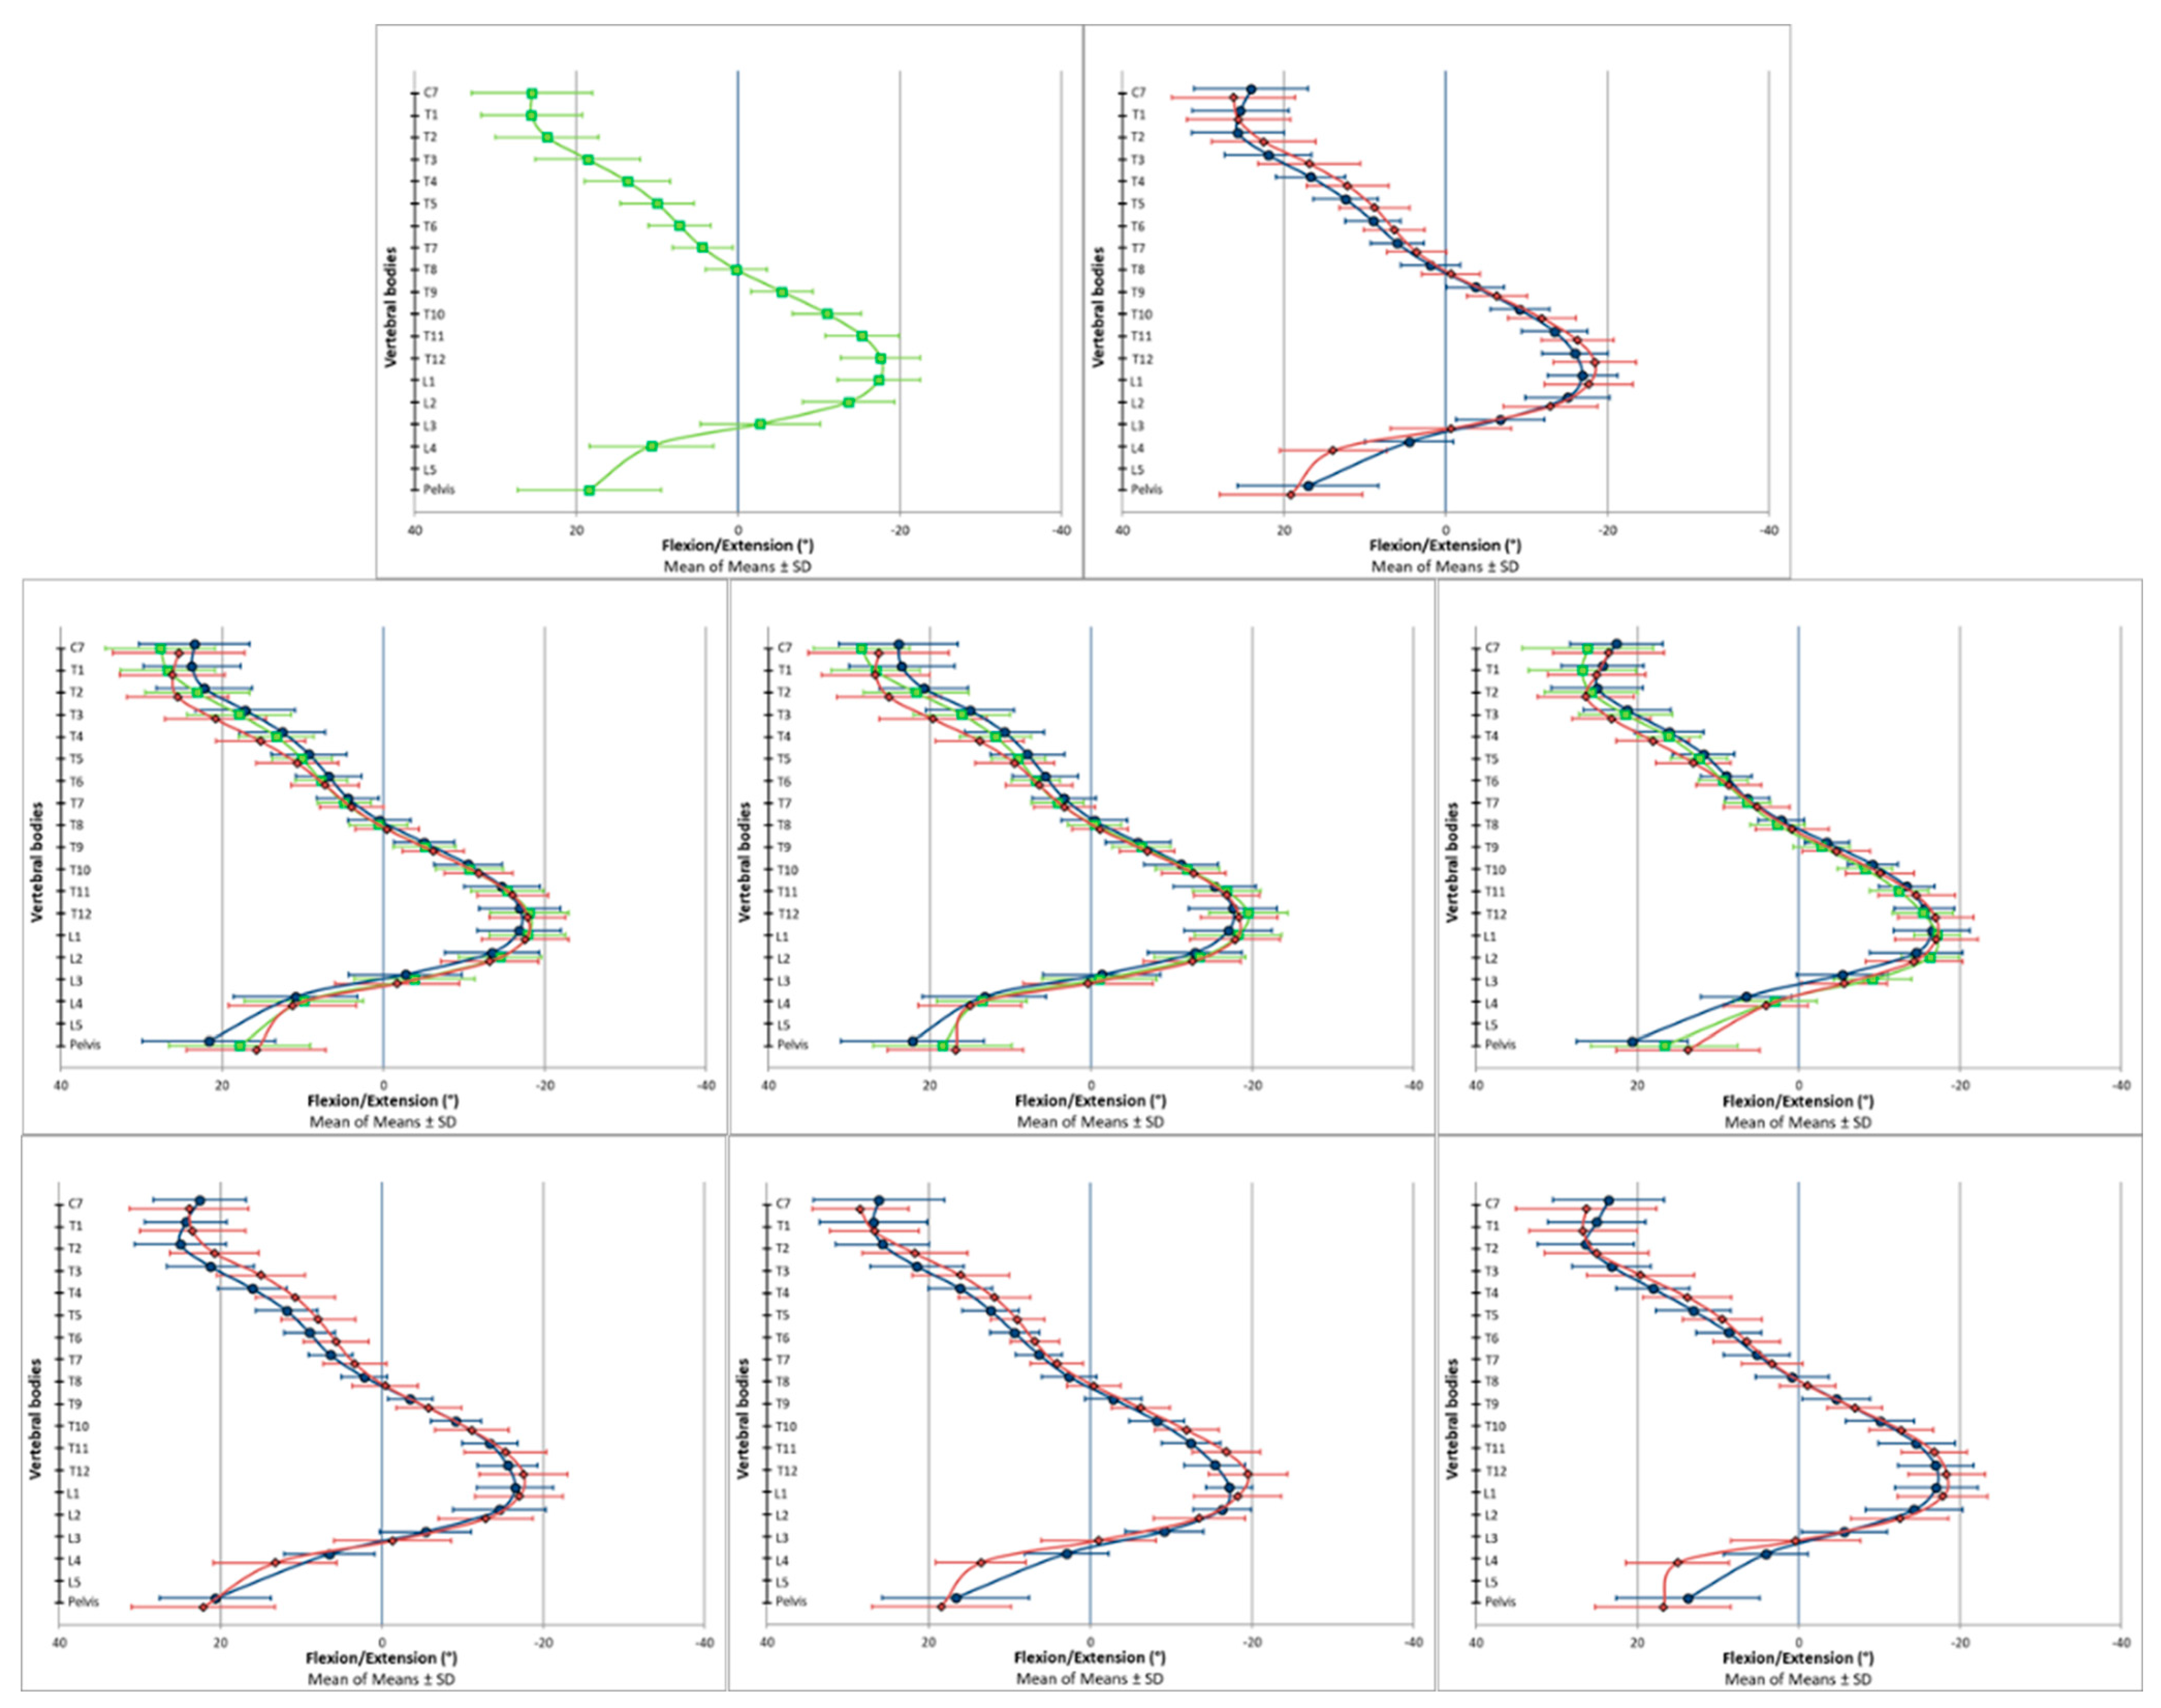
3. Results
3.1. Participants
3.2. Data Analysis
3.2.1. Descriptive Data Analysis
3.2.2. Explorative Data Analysis
3.3. Literature Comparison
4. Discussion
4.1. Global Spine Parameters
4.2. Specific Spine Parameters
4.3. Limitations
5. Conclusions
Author Contributions
Funding
Institutional Review Board Statement
Informed Consent Statement
Data Availability Statement
Acknowledgments
Conflicts of Interest
References
- Dindorf, C.; Konradi, J.; Wolf, C.; Taetz, B.; Bleser, G.; Huthwelker, J.; Werthmann, F.; Drees, P.; Fröhlich, M.; Betz, U. Machine learning techniques demonstrating individual movement patterns of the vertebral column: The fingerprint of spinal motion. Comput. Methods Biomech. Biomed. Eng. 2021, 25, 821–831. [Google Scholar] [CrossRef] [PubMed]
- Bundesärztekammer; Bundesvereinigung, K.; der Wissenschaftlichen, A.; Fachgesellschaften, M. Nationale VersorgungsLeitlinie Nicht-spezifischer Kreuzschmerz—Langfassung, 2nd ed.; Version 1; 2017; Available online: http://www.leitlinien.de/themen/kreuzschmerz (accessed on 11 December 2022). [CrossRef]
- Fedorak, C.; Ashworth, N.; Marshall, J.; Paull, H. Reliability of the visual assessment of cervical and lumbar lordosis: How good are we? Spine 2003, 28, 1857–1859. [Google Scholar] [CrossRef] [PubMed]
- Takatalo, J.; Ylinen, J.; Pienimäki, T.; Häkkinen, A. Intra- and inter-rater reliability of thoracic spine mobility and posture assessments in subjects with thoracic spine pain. BMC Musculoskelet. Disord. 2020, 21, 529. [Google Scholar] [CrossRef] [PubMed]
- Mangone, M.; Paoloni, M.; Procopio, S.; Venditto, T.; Zucchi, B.; Santilli, V.; Paolucci, T.; Agostini, F.; Bernetti, A. Sagittal spinal alignment in patients with ankylosing spondylitis by rasterstereographic back shape analysis: An observational retrospective study. Eur. J. Phys. Rehabil. Med. 2020, 56, 191–196. [Google Scholar] [CrossRef] [PubMed]
- Applebaum, A.; Ference, R.; Cho, W. Evaluating the role of surface topography in the surveillance of scoliosis. Spine Deform. 2020, 8, 397–404. [Google Scholar] [CrossRef] [PubMed]
- Betsch, M.; Wild, M.; Rath, B.; Tingart, M.; Schulze, A.; Quack, V. Radiation-free diagnosis of scoliosis: An overview of the surface and spine topography. Orthopade 2015, 44, 845–851. [Google Scholar] [CrossRef] [PubMed]
- Krott, N.L.; Wild, M.; Betsch, M. Meta-analysis of the validity and reliability of rasterstereographic measurements of spinal posture. Eur. Spine J. 2020, 29, 2392–2401. [Google Scholar] [CrossRef]
- Drerup, B.; Hierholzer, E. Evaluation of frontal radiographs of scoliotic spines—Part I measurement of position and orientation of vertebrae and assessment of clinical shape parameters. J. Biomech. 1992, 25, 1357–1362. [Google Scholar] [CrossRef]
- Drerup, B.; Hierholzer, E. Evaluation of frontal radiographs of scoliotic spines—Part II: Relations between lateral deviation, lateral tilt and axial rotation of vertebrae. J. Biomech. 1992, 25, 1443–1450. [Google Scholar] [CrossRef]
- Drerup, B.; Hierholzer, E. Back shape measurement using video rasterstereography and three-dimensional reconstruction of spinal shape. Clin. Biomech. 1994, 9, 28–36. [Google Scholar] [CrossRef]
- Drerup, B.; Ellger, B.; Meyer zu Bentrup, F.M.; Hierholzer, E. Functional rasterstereographic images. A new method for biomechanical analysis of skeletal geometry. Orthopade 2001, 30, 242–250. [Google Scholar] [CrossRef] [PubMed]
- Drerup, B. Rasterstereographic measurement of scoliotic deformity. Scoliosis 2014, 9, 22. [Google Scholar] [CrossRef] [PubMed]
- Mohokum, M.; Mendoza, S.; Udo, W.; Sitter, H.; Paletta, J.R.; Skwara, A. Reproducibility of rasterstereography for kyphotic and lordotic angles, trunk length, and trunk inclination: A reliability study. Spine 2010, 35, 1353–1358. [Google Scholar] [PubMed]
- Mohokum, M.; Schülein, S.; Skwara, A. The validity of rasterstereography: A systematic review. Orthop. Rev. 2015, 7, 68–73. [Google Scholar] [CrossRef]
- Schulte, T.L.; Hierholzer, E.; Boerke, A.; Lerner, T.; Liljenqvist, U.; Bullmann, V.; Hackenberg, L. Raster stereography versus radiography in the long-term follow-up of idiopathic scoliosis. J. Spinal Disord Tech. 2008, 21, 23–28. [Google Scholar] [CrossRef]
- Tabard-Fougere, A.; Bonnefoy-Mazure, A.; Hanquinet, S.; Lascombes, P.; Armand, S.; Dayer, R. Validity and Reliability of Spine Rasterstereography in Patients With Adolescent Idiopathic Scoliosis. Spine 2017, 42, 98–105. [Google Scholar] [CrossRef]
- Furian, T.C.; Rapp, W.; Eckert, S.; Wild, M.; Betsch, M. Spinal posture and pelvic position in three hundred forty-five elementary school children: A rasterstereographic pilot study. Orthop. Rev. 2013, 5, e7. [Google Scholar] [CrossRef][Green Version]
- Michalik, R.; Hamm, J.; Quack, V.; Eschweiler, J.; Gatz, M.; Betsch, M. Dynamic spinal posture and pelvic position analysis using a rasterstereographic device. J. Orthop. Surg. Res. 2020, 15, 389. [Google Scholar] [CrossRef]
- Schröder, J.; Stiller, T.; Mattes, K. Reference data for spine shape analysis. Approaching a majority norm and deviations for unspecific low back pain. Man. Med. 2011, 49, 161–166. [Google Scholar] [CrossRef]
- Schröder, J.; Braumann, K.M.; Reer, R. Wirbelsäulenform- und Funktionsprofile. Orthopäde 2014, 43, 841–849. [Google Scholar] [CrossRef]
- Degenhardt, B.F.; Starks, Z.; Bhatia, S.; Franklin, G.-A. Appraisal of the DIERS method for calculating postural measurements: An observational study. Scoliosis Spinal Disord. 2017, 12, 28. [Google Scholar] [CrossRef] [PubMed]
- Degenhardt, B.F.; Starks, Z.; Bhatia, S. Reliability of the DIERS Formetric 4D Spine Shape Parameters in Adults without Postural Deformities. Biomed. Res. Int. 2020, 2020, 1796247. [Google Scholar] [CrossRef] [PubMed]
- Wolf, C.; Betz, U.; Huthwelker, J.; Konradi, J.; Westphal, R.S.; Cerpa, M.; Lenke, L.; Drees, P. Evaluation of 3D vertebral and pelvic position by surface topography in asymptomatic females: Presentation of normative reference data. J. Orthop. Surg. Res. 2021, 16, 703. [Google Scholar] [CrossRef] [PubMed]
- Bischoff, H.A.; Stahelin, H.B.; Monsch, A.U.; Iversen, M.D.; Weyh, A.; von Dechend, M.; Akos, R.; Conzelmann, M.; Dick, W.; Theiler, R. Identifying a cut-off point for normal mobility: A comparison of the timed ‘up and go’ test in community-dwelling and institutionalised elderly women. Age Ageing 2003, 32, 315–320. [Google Scholar] [CrossRef]
- Bohannon, R.W.; Wang, Y.C.; Gershon, R.C. Two-minute walk test performance by adults 18 to 85 years: Normative values, reliability, and responsiveness. Arch. Phys. Med. Rehabil. 2015, 96, 472–477. [Google Scholar] [CrossRef]
- Myklebust, M.; Magnussen, L.; Inger Strand, L. Back Performance Scale scores in people without back pain: Normative data. Adv. Physiother. 2009, 9, 2–9. [Google Scholar] [CrossRef]
- Perry, J.; Burnfield, J.M. Gait Analysis—Normal and Pathological Function, 2nd ed.; SLACK Incorporated: Thorofare, NJ, USA, 2010. [Google Scholar]
- Betsch, M.; Michalik, R.; Graber, M.; Wild, M.; Krauspe, R.; Zilkens, C. Influence of leg length inequalities on pelvis and spine in patients with total hip arthroplasty. PLoS ONE 2019, 14, e0221695. [Google Scholar] [CrossRef]
- Schroeder, J.; Schaar, H.; Mattes, K. Spinal alignment in low back pain patients and age-related side effects: A multivariate cross-sectional analysis of video rasterstereography back shape reconstruction data. Eur. Spine J. 2013, 22, 1979–1985. [Google Scholar] [CrossRef]
- Schulte, T.L.; Liljenqvist, U.; Hierholzer, E.; Bullmann, V.; Halm, H.F.; Lauber, S.; Hackenberg, L. Spontaneous correction and derotation of secondary curves after selective anterior fusion of idiopathic scoliosis. Spine 2006, 31, 315–321. [Google Scholar] [CrossRef]
- Arshad, R.; Pan, F.; Reitmaier, S.; Schmidt, H. Effect of age and sex on lumbar lordosis and the range of motion. A systematic review and meta-analysis. J. Biomech. 2019, 82, 1–19. [Google Scholar] [CrossRef]
- Zappalá, M.; Lightbourne, S.; Heneghan, N.R. The relationship between thoracic kyphosis and age, and normative values across age groups: A systematic review of healthy adults. J. Orthop. Surg. Res. 2021, 16, 447. [Google Scholar] [CrossRef] [PubMed]
- Kouwenhoven, J.W.; Vincken, K.L.; Bartels, L.W.; Castelein, R.M. Analysis of preexistent vertebral rotation in the normal spine. Spine 2006, 31, 1467–1472. [Google Scholar] [CrossRef] [PubMed]
- Kouwenhoven, J.W.; Bartels, L.W.; Vincken, K.L.; Viergever, M.A.; Verbout, A.J.; Delhaas, T.; Castelein, R.M. The relation between organ anatomy and pre-existent vertebral rotation in the normal spine: Magnetic resonance imaging study in humans with situs inversus totalis. Spine 2007, 32, 1123–1128. [Google Scholar] [CrossRef] [PubMed]
- Kilshaw, M.; Baker, R.P.; Gardner, R.; Charosky, S.; Harding, I. Abnormalities of the lumbar spine in the coronal plane on plain abdominal radiographs. Eur. Spine. J. 2011, 20, 429–433. [Google Scholar] [CrossRef] [PubMed]
- Sebaaly, A.; Silvestre, C.; Rizkallah, M.; Grobost, P.; Chevillotte, T.; Kharrat, K.; Roussouly, P. Revisiting thoracic kyphosis: A normative description of the thoracic sagittal curve in an asymptomatic population. Eur. Spine J. 2021, 30, 1184–1189. [Google Scholar] [CrossRef] [PubMed]
- Lafage, R.; Steinberger, J.; Pesenti, S.; Assi, A.; Elysee, J.C.; Iyer, S.; Lenke, L.G.; Schwab, F.J.; Kim, H.J.; Lafage, V. Understanding Thoracic Spine Morphology, Shape, and Proportionality. Spine 2020, 45, 149–157. [Google Scholar] [CrossRef]
- Janssen, M.M.; Drevelle, X.; Humbert, L.; Skalli, W.; Castelein, R.M. Differences in male and female spino-pelvic alignment in asymptomatic young adults: A three-dimensional analysis using upright low-dose digital biplanar X-rays. Spine 2009, 34, E826–E832. [Google Scholar] [CrossRef]
- Dindorf, C.; Konradi, J.; Wolf, C.; Taetz, B.; Bleser, G.; Huthwelker, J.; Drees, P.; Fröhlich, M.; Betz, U. General method for automated feature extraction and selection and its application for gender classification and biomechanical knowledge discovery of sex differences in spinal posture during stance and gait. Comput. Methods Biomech. Biomed. Eng. 2020, 24, 299–307. [Google Scholar] [CrossRef]
- Dindorf, C.; Konradi, J.; Wolf, C.; Taetz, B.; Bleser, G.; Huthwelker, J.; Werthmann, F.; Bartaguiz, E.; Kniepert, J.; Drees, P.; et al. Classification and Automated Interpretation of Spinal Posture Data Using a Pathology-Independent Classifier and Explainable Artificial Intelligence (XAI). Sensors 2021, 21, 6323. [Google Scholar] [CrossRef]
- Cooperstein, R.; Hickey, M. The reliability of palpating the posterior superior iliac spine: A systematic review. J. Can. Chiropr. Assoc. 2016, 60, 36–46. [Google Scholar]
- Póvoa, L.C.; Ferreira, A.P.A.; Zanier, J.F.C.; Silva, J.G. Accuracy of Motion Palpation Flexion-Extension Test in Identifying the Seventh Cervical Spinal Process. J. Chiropr. Med. 2018, 17, 22–29. [Google Scholar] [CrossRef] [PubMed]
- Schülein, S.; Mendoza, S.; Malzkorn, R.; Harms, J.; Skwara, A. Rasterstereographic Evaluation of Interobserver and Intraobserver Reliability in Postsurgical Adolescent Idiopathic Scoliosis Patients. J. Spinal. Disord. Tech. 2013, 26, E143–E149. [Google Scholar] [CrossRef] [PubMed]
- Tabard-Fougere, A.; Bonnefoy-Mazure, A.; Dhouib, A.; Valaikaite, R.; Armand, S.; Dayer, R. Radiation-free measurement tools to evaluate sagittal parameters in AIS patients: A reliability and validity study. Eur. Spine J. 2019, 28, 536–543. [Google Scholar] [CrossRef] [PubMed]


| All Participants | Sex | Age Cohort “Young” | Age Cohort “Middle” | Age Cohort “Old” | |||||||||
|---|---|---|---|---|---|---|---|---|---|---|---|---|---|
| All Females | All Males | All Young Participants | Young Females | Young Males | All Middle Participants | Middle Females | Middle Males | All Old Participants | Old Females | Old Males | |||
| N | 201 | 132 | 69 | 67 | 44 | 23 | 67 | 44 | 23 | 67 | 44 | 23 | |
| Age (years) | Mean | 41.3 | 41.3 | 41.3 | 25.9 | 26.0 | 25.6 | 41.4 | 42.2 | 39.8 | 56.6 | 55.7 | 58.3 |
| SD | 13.4 | 13.0 | 14.3 | 2.9 | 2.7 | 3.3 | 6.4 | 6.5 | 6.2 | 4.3 | 3.9 | 4.5 | |
| BMI (kg/m2) | Mean | 23.5 | 22.9 | 24.6 | 22.7 | 22.0 | 23.9 | 23.7 | 23.0 | 25.0 | 24.1 | 23.6 | 25.0 |
| SD | 2.8 | 2.8 | 2.4 | 2.9 | 2.9 | 2.6 | 2.8 | 2.8 | 2.3 | 2.5 | 2.5 | 2.2 | |
| Specific Parameters | Global Parameters | ||||||||||||||||||||||||
|---|---|---|---|---|---|---|---|---|---|---|---|---|---|---|---|---|---|---|---|---|---|---|---|---|---|
| Sh (°) | C7 (°) | T1 (°) | T2 (°) | T3 (°) | T4 (°) | T5 (°) | T6 (°) | T7 (°) | T8 (°) | T9 (°) | T10 (°) | T11 (°) | T12 (°) | L1 (°) | L2 (°) | L3 (°) | L4 (°) | Pel (°) | Surface Rotation RMS (°) | Surface Rotation MAX (°) | (Right Side) Surface Rotation +Max (°) | (Left Side) Surface Rotation −Max (°) | |||
| All Participants | N | 198 | 199 | 201 | 200 | 200 | 197 | 197 | 198 | 198 | 198 | 200 | 201 | 201 | 201 | 201 | 200 | 200 | 200 | 200 | 200 | 201 | 198 | 201 | |
| MoM | −0.3 | 0.0 | 0.0 | 0.1 | 0.0 | −0.2 | −0.5 | −1.0 | −1.6 | −2.1 | −2.3 | −2.4 | −2.4 | −2.2 | −1.9 | −1.4 | −0.7 | −0.2 | 0.0 | 2.3 | −1.9 | 1.5 | −3.3 | ||
| SD | 2.0 | 0.2 | 0.4 | 0.8 | 1.4 | 2.2 | 3.2 | 3.9 | 4.0 | 3.9 | 3.8 | 3.6 | 3.4 | 3.3 | 3.3 | 3.0 | 2.4 | 1.4 | 0.5 | 0.9 | 4..0 | 1.4 | 2.3 | ||
| Sex | All Females | N | 130 | 131 | 132 | 131 | 131 | 129 | 129 | 130 | 130 | 130 | 131 | 132 | 132 | 132 | 132 | 131 | 131 | 131 | 132 | 131 | 132 | 130 | 132 |
| MoM | −0.3 | 0.0 | 0.1 | 0.1 | 0.1 | −0.1 | −0.4 | −0.8 | −1.4 | −1.9 | −2.2 | −2.2 | −2.1 | −2.0 | −1.7 | −1.2 | −0.6 | −0.1 | 0.0 | 2.2 | −1.8 | 1.5 | −3.2 | ||
| SD | 2.0 | 0.2 | 0.4 | 0.7 | 1.3 | 2.0 | 3.0 | 3.6 | 3.8 | 3.7 | 3.7 | 3.6 | 3.5 | 3.5 | 3.6 | 3.3 | 2.6 | 1.4 | 0.5 | 0.9 | 4.0 | 1.4 | 2.3 | ||
| All Males | N | 68 | 68 | 69 | 69 | 69 | 68 | 68 | 68 | 68 | 68 | 69 | 69 | 69 | 69 | 69 | 69 | 69 | 69 | 68 | 69 | 69 | 68 | 69 | |
| MoM | −0.3 | 0.0 | 0.0 | 0.0 | −0.1 | −0.4 | −0.8 | −1.4 | −2.1 | −2.6 | −2.7 | −2.8 | −2.8 | −2.6 | −2.3 | −1.6 | −0.9 | −0.2 | 0.1 | 2.3 | −2.1 | 1.7 | −3.6 | ||
| SD | 2.0 | 0.2 | 0.5 | 0.9 | 1.6 | 2.5 | 3.6 | 4.3 | 4.4 | 4.2 | 4.1 | 3.6 | 3.2 | 2.8 | 2.7 | 2.5 | 2.1 | 1.3 | 0.4 | 0.9 | 4.0 | 1.4 | 2.3 | ||
| Age Cohort “Young” | All Young Participants | N | 67 | 67 | 67 | 67 | 67 | 67 | 67 | 67 | 67 | 66 | 66 | 67 | 67 | 67 | 67 | 66 | 66 | 66 | 67 | 67 | 67 | 66 | 67 |
| MoM | −0.1 | 0.0 | 0.0 | −0.1 | −0.2 | −0.5 | −1.0 | −1.5 | −2.1 | −2.7 | −2.9 | −2.7 | −2.7 | −2.5 | −2.1 | −1.5 | −0.6 | 0.0 | 0.1 | 2.3 | −2.3 | 1.4 | −3.5 | ||
| SD | 2.1 | 0.2 | 0.4 | 0.7 | 1.3 | 2.1 | 3.1 | 3.7 | 3.9 | 3.6 | 3.4 | 3.4 | 3.1 | 3.1 | 3.2 | 2.9 | 2.3 | 1.3 | 0.5 | 0.9 | 3.6 | 1.2 | 2.2 | ||
| Young Females | N | 44 | 44 | 44 | 44 | 44 | 44 | 44 | 44 | 44 | 43 | 43 | 44 | 44 | 44 | 44 | 43 | 43 | 43 | 44 | 44 | 44 | 43 | 44 | |
| MoM | 0.1 | 0.0 | 0.0 | 0.0 | −0.2 | −0.4 | −0.9 | −1.5 | −2.0 | −2.6 | −2.8 | −2.5 | −2.4 | −2.3 | −1.9 | −1.4 | −0.5 | 0.0 | 0.0 | 2.4 | −2.4 | 1.3 | −3.5 | ||
| SD | 2.0 | 0.2 | 0.4 | 0.7 | 1.3 | 2.1 | 3.1 | 3.7 | 3.9 | 3.4 | 3.3 | 3.4 | 3.2 | 3.3 | 3.6 | 3.2 | 2.5 | 1.4 | 0.5 | 0.9 | 3.8 | 1.3 | 2.3 | ||
| Young Males | N | 23 | 23 | 23 | 23 | 23 | 23 | 23 | 23 | 23 | 23 | 23 | 23 | 23 | 23 | 23 | 23 | 23 | 23 | 23 | 23 | 23 | 23 | 23 | |
| MoM | −0.4 | 0.0 | 0.0 | −0.1 | −0.3 | −0.6 | −1.1 | −1.7 | −2.3 | −2.8 | −3.0 | −3.0 | −3.2 | −3.0 | −2.6 | −1.9 | −0.9 | −0.2 | 0.3 | 2.2 | −2.3 | 1.7 | −3.6 | ||
| SD | 2.2 | 0.2 | 0.4 | 0.7 | 1.3 | 2.1 | 3.2 | 3.8 | 4.1 | 4.0 | 3.7 | 3.3 | 3.0 | 2.6 | 2.4 | 2.2 | 1.8 | 1.1 | 0.4 | 0.8 | 3.4 | 1.2 | 2.2 | ||
| Age Cohort “Middle” | All Middle Participants | N | 66 | 67 | 67 | 67 | 67 | 67 | 67 | 67 | 67 | 67 | 67 | 67 | 67 | 67 | 67 | 67 | 67 | 67 | 67 | 67 | 67 | 67 | 67 |
| MoM | −0.5 | 0.0 | 0.1 | 0.1 | 0.1 | 0.0 | −0.2 | −0.6 | −1.2 | −1.7 | −2.1 | −2.3 | −2.3 | −2.3 | −2.0 | −1.5 | −0.8 | −0.3 | −0.1 | 2.1 | −2.3 | 1.4 | −3.4 | ||
| SD | 2.1 | 0.2 | 0.4 | 0.7 | 1.3 | 2.2 | 3.2 | 3.7 | 3.9 | 3.8 | 3.7 | 3.6 | 3.5 | 3.4 | 3.5 | 3.3 | 2.7 | 1.6 | 0.4 | 1.0 | 3.6 | 1.4 | 2.2 | ||
| Middle Females | N | 43 | 44 | 44 | 44 | 44 | 44 | 44 | 44 | 44 | 44 | 44 | 44 | 44 | 44 | 44 | 44 | 44 | 44 | 44 | 44 | 44 | 44 | 44 | |
| MoM | −0.4 | 0.0 | 0.1 | 0.1 | 0.2 | 0.2 | 0.0 | −0.4 | −0.9 | −1.4 | −1.9 | −2.1 | −2.3 | −2.2 | −2.0 | −1.5 | −0.9 | −0.4 | −0.1 | 2.0 | −2.2 | 1.3 | −3.3 | ||
| SD | 2.1 | 0.2 | 0.3 | 0.6 | 1.2 | 1.9 | 2.8 | 3.2 | 3.4 | 3.4 | 3.4 | 3.4 | 3.5 | 3.5 | 3.7 | 3.5 | 2.8 | 1.6 | 0.4 | 0.8 | 3.4 | 1.4 | 2.0 | ||
| Middle Males | N | 23 | 23 | 23 | 23 | 23 | 23 | 23 | 23 | 23 | 23 | 23 | 23 | 23 | 23 | 23 | 23 | 23 | 23 | 23 | 23 | 23 | 23 | 23 | |
| MoM | −0.6 | 0.0 | 0.0 | 0.0 | −0.1 | −0.3 | −0.6 | −1.1 | −1.7 | −2.3 | −2.6 | −2.6 | −2.5 | −2.3 | −1.9 | −1.3 | −0.5 | −0.1 | −0.1 | 2.3 | −2.4 | 1.5 | −3.6 | ||
| SD | 2.1 | 0.2 | 0.4 | 0.9 | 1.6 | 2.6 | 3.8 | 4.6 | 4.7 | 4.5 | 4.3 | 3.9 | 3.5 | 3.2 | 3.0 | 2.9 | 2.6 | 1.7 | 0.4 | 1.1 | 3.8 | 1.4 | 2.6 | ||
| Age Cohort “Old” | All Old Participants | N | 65 | 65 | 67 | 66 | 66 | 63 | 63 | 64 | 64 | 65 | 67 | 67 | 67 | 67 | 67 | 67 | 67 | 67 | 66 | 66 | 67 | 65 | 67 |
| MoM | −0.3 | 0.0 | 0.1 | 0.1 | 0.2 | −0.1 | −0.4 | −0.8 | −1.5 | −2.0 | −2.1 | −2.2 | −2.1 | −1.9 | −1.6 | −1.1 | −0.6 | −0.2 | 0.1 | 2.3 | −1.1 | 1.8 | −3.1 | ||
| SD | 2.0 | 0.2 | 0.5 | 0.9 | 1.6 | 2.3 | 3.4 | 4.1 | 4.3 | 4.3 | 4.3 | 3.9 | 3.6 | 3.4 | 3.2 | 2.9 | 2.2 | 1.3 | 0.4 | 0.9 | 4.6 | 1.7 | 2.4 | ||
| Old Females | N | 43 | 43 | 44 | 43 | 43 | 41 | 41 | 42 | 42 | 43 | 44 | 44 | 44 | 44 | 44 | 44 | 44 | 44 | 44 | 43 | 44 | 43 | 44 | |
| MoM | −0.6 | 0.0 | 0.1 | 0.2 | 0.3 | 0.1 | −0.3 | −0.5 | −1.3 | −1.7 | −1.8 | −1.9 | −1.7 | −1.5 | −1.2 | −0.8 | −0.3 | 0.0 | 0.1 | 2.3 | −0.9 | 1.8 | −2.9 | ||
| SD | 2.0 | 0.2 | 0.4 | 0.8 | 1.4 | 2.0 | 3.1 | 3.9 | 4.1 | 4.3 | 4.3 | 4.0 | 3.8 | 3.6 | 3.5 | 3.1 | 2.4 | 1.4 | 0.4 | 0.9 | 4.6 | 1.7 | 2.4 | ||
| Old Males | N | 22 | 22 | 23 | 23 | 23 | 22 | 22 | 22 | 22 | 22 | 23 | 23 | 23 | 23 | 23 | 23 | 23 | 23 | 22 | 23 | 23 | 22 | 23 | |
| MoM | 0.3 | 0.1 | 0.0 | 0.1 | 0.1 | −0.3 | −0.8 | −1.4 | −2.1 | −2.6 | −2.5 | −2.8 | −2.8 | −2.6 | −2.2 | −1.7 | −1.2 | −0.5 | 0.0 | 2.5 | −1.4 | 1.8 | −3.5 | ||
| SD | 1.8 | 0.2 | 0.6 | 1.1 | 1.9 | 2.9 | 4.0 | 4.6 | 4.6 | 4.3 | 4.4 | 3.8 | 3.1 | 2.8 | 2.6 | 2.4 | 1.8 | 1.0 | 0.4 | 0.9 | 4.8 | 1.7 | 2.3 | ||
| Specific Parameters | Global Parameters | ||||||||||||||||||||||||||
|---|---|---|---|---|---|---|---|---|---|---|---|---|---|---|---|---|---|---|---|---|---|---|---|---|---|---|---|
| Sh (°) | C7 (°) | T1 (°) | T2 (°) | T3 (°) | T4 (°) | T5 (°) | T6 (°) | T7 (°) | T8 (°) | T9 (°) | T10 (°) | T11 (°) | T12 (°) | L1 (°) | L2 (°) | L3 (°) | L4 (°) | Pel (°) | Trunk Imbalance VP-DM (°) | Trunk Imbalance VP-DM (mm) | Apical Deviation RMS (mm) | Apical Deviation MAX (mm) | (Right Side) Apical Deviation VP-DM +Max (mm) | (Left Side) Apical Deviation VP-DM −Max (mm) | |||
| All Participants | N | 200 | 197 | 195 | 194 | 199 | 198 | 198 | 198 | 201 | 201 | 200 | 200 | 200 | 199 | 198 | 198 | 198 | 200 | 194 | 194 | 195 | 196 | 201 | 198 | 198 | |
| MoM | −1.1 | −1.1 | −1.5 | −1.7 | −1.3 | −0.5 | 0.3 | 1.0 | 1.2 | 1.1 | 0.8 | 0.5 | 0.3 | 0.3 | 0.0 | −0.2 | 0.1 | 0.7 | −0.1 | −0.2 | −1.7 | 3.6 | −1.8 | 3.2 | −4.9 | ||
| SD | 1.3 | 2.1 | 2.3 | 2.6 | 3.1 | 3.0 | 2.6 | 2.1 | 2.0 | 2.2 | 2.1 | 1.9 | 1.9 | 1.9 | 1.6 | 1.7 | 2.4 | 3.1 | 0.8 | 0.8 | 7.3 | 1.7 | 7.1 | 3.0 | 3.3 | ||
| Sex | All Females | N | 131 | 129 | 128 | 127 | 132 | 131 | 131 | 131 | 132 | 132 | 131 | 131 | 131 | 130 | 129 | 129 | 129 | 131 | 127 | 126 | 128 | 130 | 132 | 131 | 130 |
| MoM | −1.3 | −1.2 | −1.6 | −1.8 | −1.4 | −0.7 | 0.1 | 0.8 | 1.1 | 1.1 | 0.8 | 0.5 | 0.3 | 0.3 | 0.1 | −0.1 | 0.3 | 1.0 | −0.1 | −0.2 | −1.6 | 3.5 | −2.3 | 2.9 | −4.9 | ||
| SD | 1.4 | 2.2 | 2.3 | 2.5 | 3.1 | 3.0 | 2.5 | 1.9 | 1.9 | 2.1 | 2.0 | 1.9 | 2.0 | 2.0 | 1.7 | 1.8 | 2.5 | 3.2 | 0.8 | 0.9 | 7.7 | 1.7 | 6.7 | 2.8 | 3.3 | ||
| All Males | N | 69 | 68 | 67 | 67 | 67 | 67 | 67 | 67 | 69 | 69 | 69 | 69 | 69 | 69 | 69 | 69 | 69 | 69 | 67 | 68 | 67 | 66 | 69 | 67 | 68 | |
| MoM | −0.9 | −1.0 | −1.3 | −1.3 | −1.1 | −0.3 | 0.6 | 1.2 | 1.4 | 1.2 | 0.8 | 0.5 | 0.4 | 0.2 | −0.1 | −0.4 | −0.3 | 0.2 | −0.3 | −0.2 | −2.0 | 3.8 | −0.8 | 3.8 | −4.7 | ||
| SD | 1.3 | 2.1 | 2.3 | 2.8 | 3.1 | 3.2 | 2.8 | 2.3 | 2.3 | 2.4 | 2.3 | 2.0 | 1.8 | 1.8 | 1.5 | 1.5 | 2.2 | 2.8 | 0.8 | 0.8 | 6.6 | 1.6 | 7.7 | 3.4 | 3.2 | ||
| Age Cohort “Young” | All Young Participants | N | 67 | 66 | 66 | 66 | 67 | 66 | 66 | 66 | 67 | 67 | 67 | 67 | 67 | 67 | 67 | 67 | 66 | 66 | 64 | 66 | 66 | 65 | 67 | 66 | 66 |
| MoM | −1.0 | −0.9 | −1.2 | −1.3 | −0.6 | 0.2 | 0.9 | 1.2 | 1.0 | 0.7 | 0.5 | 0.4 | 0.4 | 0.4 | 0.0 | −0.3 | 0.4 | 1.2 | −0.1 | −0.3 | −2.5 | 3.5 | −0.9 | 3.3 | −4.4 | ||
| SD | 1.2 | 1.7 | 2.0 | 2.4 | 2.8 | 2.7 | 2.4 | 1.9 | 1.8 | 1.9 | 1.9 | 2.0 | 2.0 | 1.9 | 1.6 | 1.8 | 2.6 | 3.0 | 0.9 | 0.8 | 6.5 | 1.6 | 7.0 | 2.9 | 3.1 | ||
| Young Females | N | 44 | 43 | 43 | 43 | 44 | 43 | 43 | 43 | 44 | 44 | 44 | 44 | 44 | 44 | 44 | 44 | 43 | 43 | 42 | 43 | 43 | 42 | 44 | 43 | 43 | |
| MoM | −1.1 | −1.1 | −1.4 | −1.4 | −0.6 | 0.4 | 0.9 | 1.1 | 0.9 | 0.7 | 0.5 | 0.4 | 0.5 | 0.4 | 0.1 | −0.1 | 0.6 | 1.5 | −0.1 | −0.3 | −2.6 | 3.4 | −1.1 | 3.1 | −4.4 | ||
| SD | 1.3 | 1.7 | 2.0 | 2.5 | 3.0 | 2.7 | 2.2 | 1.7 | 1.7 | 1.8 | 1.7 | 1.9 | 2.1 | 2.0 | 1.5 | 1.9 | 2.7 | 3.2 | 0.9 | 0.8 | 6.7 | 1.6 | 7.2 | 2.7 | 3.1 | ||
| Young Males | N | 23 | 23 | 23 | 23 | 23 | 23 | 23 | 23 | 23 | 23 | 23 | 23 | 23 | 23 | 23 | 23 | 23 | 23 | 22 | 23 | 23 | 23 | 23 | 23 | 23 | |
| MoM | −0.7 | −0.6 | −0.9 | −1.1 | −0.7 | 0.0 | 0.7 | 1.3 | 1.3 | 0.9 | 0.4 | 0.2 | 0.3 | 0.3 | −0.2 | −0.5 | −0.2 | 0.6 | −0.1 | −0.2 | −2.3 | 3.6 | −0.4 | 3.8 | −4.4 | ||
| SD | 1.1 | 1.8 | 2.0 | 2.3 | 2.4 | 2.8 | 2.7 | 2.2 | 2.0 | 2.3 | 2.3 | 2.1 | 1.9 | 2.0 | 1.7 | 1.6 | 2.2 | 2.6 | 0.8 | 0.7 | 6.3 | 1.6 | 6.7 | 3.1 | 3.1 | ||
| Age Cohort “Middle” | All Middle Participants | N | 67 | 65 | 63 | 63 | 67 | 67 | 67 | 67 | 67 | 67 | 66 | 66 | 66 | 65 | 66 | 65 | 66 | 67 | 64 | 66 | 66 | 66 | 67 | 66 | 66 |
| MoM | −1.2 | −1.1 | −1.6 | −1.9 | −1.5 | −0.8 | 0.0 | 0.7 | 1.1 | 1.1 | 1.0 | 0.8 | 0.4 | 0.4 | 0.1 | −0.2 | 0.1 | 0.8 | −0.2 | −0.2 | −1.9 | 3.8 | −2.9 | 2.9 | −5.3 | ||
| SD | 1.3 | 2.3 | 2.4 | 2.7 | 3.3 | 3.2 | 2.7 | 2.0 | 1.9 | 2.1 | 2.0 | 1.9 | 2.1 | 2.0 | 1.7 | 1.4 | 2.2 | 3.2 | 0.8 | 0.8 | 7.0 | 1.8 | 7.0 | 3.2 | 3.3 | ||
| Middle Females | N | 44 | 42 | 41 | 41 | 44 | 44 | 44 | 44 | 44 | 44 | 43 | 43 | 43 | 42 | 43 | 42 | 43 | 44 | 41 | 43 | 43 | 44 | 44 | 44 | 43 | |
| MoM | −1.3 | −1.0 | −1.7 | −2.2 | −1.7 | −1.1 | −0.3 | 0.5 | 1.0 | 1.1 | 1.1 | 0.9 | 0.4 | 0.4 | 0.2 | −0.1 | 0.2 | 0.8 | −0.1 | −0.2 | −1.8 | 3.6 | −3.3 | 2.8 | −5.3 | ||
| SD | 1.4 | 2.4 | 2.4 | 2.7 | 3.3 | 2.9 | 2.4 | 1.9 | 2.0 | 2.1 | 1.9 | 1.9 | 2.3 | 2.2 | 1.9 | 1.4 | 2.3 | 3.3 | 0.7 | 0.9 | 7.4 | 1.9 | 6.4 | 2.9 | 3.3 | ||
| Middle Males | N | 23 | 23 | 22 | 22 | 23 | 23 | 23 | 23 | 23 | 23 | 23 | 23 | 23 | 23 | 23 | 23 | 23 | 23 | 23 | 23 | 23 | 22 | 23 | 22 | 23 | |
| MoM | −1.0 | −1.3 | −1.3 | −1.3 | −1.1 | −0.4 | 0.4 | 1.1 | 1.3 | 1.2 | 0.9 | 0.6 | 0.5 | 0.3 | 0.0 | −0.3 | 0.0 | 0.7 | −0.4 | −0.2 | −2.2 | 4.1 | −2.2 | 3.2 | −5.4 | ||
| SD | 1.1 | 2.3 | 2.3 | 2.7 | 3.5 | 3.7 | 3.3 | 2.2 | 1.8 | 2.0 | 2.2 | 2.0 | 1.8 | 1.8 | 1.5 | 1.4 | 2.0 | 2.8 | 0.9 | 0.7 | 6.2 | 1.7 | 8.0 | 3.7 | 3.4 | ||
| Age Cohort “Old” | All Old Participants | N | 66 | 66 | 66 | 65 | 65 | 65 | 65 | 65 | 67 | 67 | 67 | 67 | 67 | 67 | 65 | 66 | 66 | 67 | 66 | 62 | 63 | 65 | 67 | 66 | 66 |
| MoM | −1.2 | −1.3 | −1.7 | −1.8 | −1.7 | −1.0 | 0.0 | 1.0 | 1.6 | 1.5 | 1.0 | 0.4 | 0.1 | 0.0 | 0.0 | −0.2 | −0.2 | 0.2 | −0.1 | −0.1 | −0.8 | 3.6 | −1.5 | 3.3 | −4.8 | ||
| SD | 1.4 | 2.2 | 2.4 | 2.7 | 3.0 | 3.1 | 2.8 | 2.3 | 2.3 | 2.4 | 2.2 | 1.9 | 1.7 | 1.7 | 1.6 | 1.8 | 2.5 | 3.0 | 0.8 | 0.9 | 8.3 | 1.6 | 7.3 | 3.1 | 3.3 | ||
| Old Females | N | 43 | 44 | 44 | 43 | 44 | 44 | 44 | 44 | 44 | 44 | 44 | 44 | 44 | 44 | 42 | 43 | 43 | 44 | 44 | 40 | 42 | 44 | 44 | 44 | 44 | |
| MoM | −1.3 | −1.3 | −1.6 | −1.9 | −1.9 | −1.2 | −0.2 | 0.8 | 1.5 | 1.4 | 0.9 | 0.3 | 0.0 | 0.0 | 0.1 | −0.1 | 0.1 | 0.6 | 0.0 | −0.2 | −0.4 | 3.5 | −2.4 | 2.8 | −5.1 | ||
| SD | 1.3 | 2.3 | 2.4 | 2.4 | 2.9 | 3.1 | 2.9 | 2.1 | 1.9 | 2.2 | 2.2 | 1.9 | 1.6 | 1.8 | 1.7 | 2.0 | 2.5 | 3.0 | 0.8 | 1.0 | 8.8 | 1.7 | 6.5 | 2.7 | 3.5 | ||
| Old Males | N | 23 | 22 | 22 | 22 | 21 | 21 | 21 | 21 | 23 | 23 | 23 | 23 | 23 | 23 | 23 | 23 | 23 | 23 | 22 | 22 | 21 | 21 | 23 | 22 | 22 | |
| MoM | −1.0 | −1.2 | −1.8 | −1.6 | −1.3 | −0.4 | 0.6 | 1.4 | 1.7 | 1.6 | 1.2 | 0.7 | 0.3 | 0.0 | −0.3 | −0.5 | −0.7 | −0.6 | −0.2 | −0.1 | −1.4 | 3.7 | 0.3 | 4.4 | −4.3 | ||
| SD | 1.6 | 2.0 | 2.5 | 3.4 | 3.3 | 3.0 | 2.5 | 2.6 | 3.0 | 2.8 | 2.3 | 2.0 | 1.9 | 1.6 | 1.3 | 1.5 | 2.3 | 2.8 | 0.7 | 0.9 | 7.4 | 1.6 | 8.5 | 3.6 | 3.0 | ||
| Specific Parameters | Global Parameters | ||||||||||||||||||||||||
|---|---|---|---|---|---|---|---|---|---|---|---|---|---|---|---|---|---|---|---|---|---|---|---|---|---|
| Sh (°) | C7 (°) | T1 (°) | T2 (°) | T3 (°) | T4 (°) | T5 (°) | T6 (°) | T7 (°) | T8 (°) | T9 (°) | T10 (°) | T11 (°) | T12 (°) | L1 (°) | L2 (°) | L3 (°) | L4 (°) | Pel (°) | Trunk Inclination (VP-DM) (°) | Trunk Inclination (VP-DM) (mm) | Thoracic Kyphosis (ICT-ITL) (°) | Lumbar Lordosis (ITL-ILS) (°) | |||
| All Participants | N | - | 201 | 201 | 200 | 200 | 199 | 200 | 199 | 200 | 201 | 201 | 201 | 200 | 200 | 200 | 199 | 201 | 201 | 201 | 198 | 198 | 200 | 201 | |
| MoM | - | 25.5 | 25.5 | 23.6 | 18.6 | 13.7 | 10.0 | 7.2 | 4.4 | 0.2 | −5.4 | −11.0 | −15.3 | −17.6 | −17.4 | −13.7 | −2.7 | 10.7 | 18.4 | 3.1 | 26.0 | 49.9 | 40.9 | ||
| SD | - | 7.5 | 6.3 | 6.4 | 6.5 | 5.3 | 4.6 | 3.9 | 3.7 | 3.8 | 3.9 | 4.2 | 4.5 | 4.9 | 5.1 | 5.7 | 7.4 | 7.7 | 8.9 | 2.1 | 17.5 | 8.3 | 9.2 | ||
| Sex | All Females | N | - | 132 | 132 | 131 | 132 | 132 | 132 | 131 | 132 | 132 | 132 | 132 | 131 | 131 | 131 | 130 | 132 | 132 | 132 | 130 | 130 | 131 | 132 |
| MoM | - | 26.2 | 25.6 | 22.5 | 16.9 | 12.1 | 8.8 | 6.3 | 3.6 | −0.6 | −6.3 | −11.9 | −16.3 | −18.5 | −17.7 | −13.0 | −0.6 | 13.9 | 19.1 | 3.1 | 25.6 | 50.1 | 44.0 | ||
| SD | - | 7.6 | 6.4 | 6.4 | 6.3 | 5.1 | 4.4 | 3.8 | 3.7 | 3.6 | 3.7 | 4.2 | 4.5 | 5.1 | 5.5 | 5.8 | 7.5 | 6.6 | 8.9 | 2.1 | 17.6 | 8.2 | 8.5 | ||
| All Males | N | - | 69 | 69 | 69 | 68 | 67 | 68 | 68 | 68 | 69 | 69 | 69 | 69 | 69 | 69 | 69 | 69 | 69 | 69 | 68 | 68 | 69 | 69 | |
| MoM | - | 24.1 | 25.4 | 25.7 | 21.9 | 16.7 | 12.4 | 9.0 | 6.0 | 1.9 | −3.7 | −9.1 | −13.5 | −16.0 | −16.9 | −15.1 | −6.7 | 4.5 | 17.0 | 3.0 | 26.7 | 49.6 | 34.9 | ||
| SD | - | 7.1 | 6.0 | 5.7 | 5.4 | 4.3 | 4.0 | 3.4 | 3.3 | 3.7 | 3.6 | 3.7 | 4.0 | 4.1 | 4.3 | 5.2 | 5.5 | 5.5 | 8.7 | 2.0 | 17.4 | 8.6 | 7.3 | ||
| Age Cohort “Young” | All Young Participants | N | - | 67 | 67 | 66 | 67 | 67 | 67 | 67 | 67 | 67 | 67 | 67 | 67 | 67 | 67 | 67 | 67 | 67 | 67 | 66 | 66 | 66 | 67 |
| MoM | - | 23.4 | 23.7 | 22.2 | 17.1 | 12.5 | 9.2 | 6.8 | 4.4 | 0.5 | −5.0 | −10.5 | −14.7 | −16.9 | −16.8 | −13.4 | −2.7 | 10.9 | 21.6 | 2.9 | 24.8 | 46.5 | 40.1 | ||
| SD | - | 6.9 | 6.0 | 5.9 | 6.2 | 5.3 | 4.7 | 4.0 | 3.8 | 3.9 | 3.8 | 4.2 | 4.7 | 5.0 | 5.2 | 5.8 | 7.0 | 7.7 | 8.3 | 2.2 | 18.4 | 7.1 | 8.9 | ||
| Young Females | N | - | 44 | 44 | 43 | 44 | 44 | 44 | 44 | 44 | 44 | 44 | 44 | 44 | 44 | 44 | 44 | 44 | 44 | 44 | 43 | 43 | 43 | 44 | |
| MoM | - | 23.9 | 23.4 | 20.7 | 15.0 | 10.7 | 7.9 | 5.7 | 3.3 | −0.4 | −5.8 | −11.1 | −15.3 | −17.6 | −17.0 | −12.9 | −1.3 | 13.2 | 22.1 | 2.8 | 22.6 | 46.9 | 43.0 | ||
| SD | - | 7.4 | 6.5 | 5.5 | 5.5 | 4.9 | 4.6 | 4.0 | 3.9 | 4.1 | 4.0 | 4.6 | 5.1 | 5.5 | 5.4 | 5.9 | 7.3 | 7.7 | 8.9 | 2.1 | 17.5 | 6.9 | 8.7 | ||
| Young Males | N | - | 23 | 23 | 23 | 23 | 23 | 23 | 23 | 23 | 23 | 23 | 23 | 23 | 23 | 23 | 23 | 23 | 23 | 23 | 23 | 23 | 23 | 23 | |
| MoM | - | 22.6 | 24.3 | 25.0 | 21.2 | 16.1 | 11.8 | 9.0 | 6.4 | 2.2 | −3.5 | −9.1 | −13.4 | −15.6 | −16.5 | −14.6 | −5.4 | 6.5 | 20.7 | 3.3 | 28.9 | 45.8 | 34.5 | ||
| SD | - | 5.8 | 5.1 | 5.7 | 5.4 | 4.3 | 3.8 | 3.2 | 2.7 | 2.9 | 2.8 | 3.1 | 3.5 | 3.7 | 4.7 | 5.8 | 5.6 | 5.6 | 6.9 | 2.2 | 19.7 | 7.7 | 6.5 | ||
| Age Cohort “Middle” | All Middle Participants | N | - | 67 | 67 | 67 | 67 | 66 | 66 | 66 | 66 | 67 | 67 | 67 | 67 | 67 | 67 | 66 | 67 | 67 | 67 | 67 | 67 | 67 | 67 |
| MoM | - | 27.7 | 26.7 | 23.1 | 17.9 | 13.3 | 10.1 | 7.7 | 4.9 | 0.6 | −5.1 | −10.6 | −15.3 | −18.1 | −17.9 | −14.5 | −3.8 | 9.9 | 17.8 | 3.2 | 27.0 | 49.7 | 41.0 | ||
| SD | - | 6.8 | 5.9 | 6.5 | 6.4 | 4.7 | 3.7 | 3.2 | 3.3 | 3.6 | 3.9 | 4.2 | 4.5 | 4.9 | 4.7 | 5.2 | 7.5 | 7.4 | 8.8 | 2.0 | 17.0 | 7.7 | 9.0 | ||
| Middle Females | N | - | 44 | 44 | 44 | 44 | 44 | 44 | 44 | 44 | 44 | 44 | 44 | 44 | 44 | 44 | 43 | 44 | 44 | 44 | 44 | 44 | 44 | 44 | |
| MoM | - | 28.5 | 26.7 | 21.7 | 16.0 | 11.9 | 9.0 | 6.9 | 4.1 | −0.4 | −6.3 | −11.9 | −16.8 | −19.5 | −18.2 | −13.5 | −1.0 | 13.5 | 18.4 | 3.2 | 26.3 | 49.3 | 43.7 | ||
| SD | - | 6.0 | 5.5 | 6.5 | 6.0 | 4.4 | 3.4 | 3.0 | 3.3 | 3.3 | 3.6 | 4.0 | 4.2 | 4.9 | 5.4 | 5.6 | 7.1 | 5.6 | 8.6 | 2.1 | 17.3 | 7.6 | 9.0 | ||
| Middle Males | N | - | 23 | 23 | 23 | 23 | 22 | 22 | 22 | 22 | 23 | 23 | 23 | 23 | 23 | 23 | 23 | 23 | 23 | 23 | 23 | 23 | 23 | 23 | |
| MoM | - | 26.1 | 26.8 | 25.7 | 21.4 | 16.1 | 12.3 | 9.4 | 6.3 | 2.6 | −2.8 | −8.2 | −12.4 | −15.4 | −17.2 | −16.3 | −9.2 | 3.0 | 16.7 | 3.2 | 28.3 | 50.5 | 35.7 | ||
| SD | - | 8.1 | 6.6 | 5.7 | 5.8 | 3.9 | 3.5 | 3.0 | 2.9 | 3.4 | 3.5 | 3.4 | 3.7 | 3.8 | 2.9 | 3.6 | 4.9 | 5.2 | 9.1 | 1.9 | 16.7 | 7.9 | 6.2 | ||
| Age Cohort “Old” | All Old Participants | N | - | 67 | 67 | 67 | 66 | 66 | 67 | 66 | 67 | 67 | 67 | 67 | 66 | 66 | 66 | 66 | 67 | 67 | 67 | 65 | 65 | 67 | 67 |
| MoM | - | 25.4 | 26.1 | 25.5 | 20.8 | 15.2 | 10.7 | 7.2 | 3.9 | −0.4 | −6.2 | −11.8 | −16.0 | −17.9 | −17.6 | −13.2 | −1.7 | 11.3 | 15.7 | 3.1 | 26.1 | 53.4 | 41.6 | ||
| SD | - | 8.2 | 6.5 | 6.3 | 6.3 | 5.5 | 5.1 | 4.2 | 4.0 | 3.9 | 3.8 | 4.2 | 4.4 | 4.8 | 5.4 | 6.1 | 7.7 | 7.9 | 8.6 | 2.1 | 17.4 | 8.7 | 9.7 | ||
| Old Females | N | - | 44 | 44 | 44 | 44 | 44 | 44 | 43 | 44 | 44 | 44 | 44 | 43 | 43 | 43 | 43 | 44 | 44 | 44 | 43 | 43 | 44 | 44 | |
| MoM | - | 26.3 | 26.7 | 25.0 | 19.6 | 13.8 | 9.5 | 6.5 | 3.3 | −1.1 | −6.9 | −12.7 | −16.8 | −18.3 | −17.8 | −12.6 | 0.4 | 15.0 | 16.8 | 3.4 | 27.8 | 54.0 | 45.3 | ||
| SD | - | 8.7 | 6.7 | 6.5 | 6.7 | 5.5 | 4.9 | 4.1 | 3.8 | 3.4 | 3.4 | 4.0 | 4.1 | 4.8 | 5.6 | 6.0 | 8.0 | 6.4 | 8.4 | 2.2 | 18.2 | 8.7 | 7.7 | ||
| Old Males | N | - | 23 | 23 | 23 | 22 | 22 | 23 | 23 | 23 | 23 | 23 | 23 | 23 | 23 | 23 | 23 | 23 | 23 | 23 | 22 | 22 | 23 | 23 | |
| MoM | - | 23.5 | 25.0 | 26.4 | 23.2 | 18.1 | 13.0 | 8.7 | 5.2 | 0.8 | −4.7 | −10.1 | −14.6 | −17.0 | −17.1 | −14.3 | −5.7 | 4.1 | 13.7 | 2.6 | 22.8 | 52.4 | 34.4 | ||
| SD | - | 6.9 | 6.1 | 6.0 | 4.9 | 4.5 | 4.7 | 4.1 | 4.1 | 4.5 | 4.2 | 4.2 | 4.8 | 4.7 | 5.1 | 6.0 | 5.3 | 5.2 | 8.9 | 1.8 | 15.5 | 9.0 | 9.1 | ||
| Specific Parameters | Global Parameters | |||||||||||||||||||||||||
|---|---|---|---|---|---|---|---|---|---|---|---|---|---|---|---|---|---|---|---|---|---|---|---|---|---|---|
| Transversal Plane | ||||||||||||||||||||||||||
| Sh (°) | C7 (°) | T1 (°) | T2 (°) | T3 (°) | T4 (°) | T5 (°) | T6 (°) | T7 (°) | T8 (°) | T9 (°) | T10 (°) | T11 (°) | T12 (°) | L1 (°) | L2 (°) | L3 (°) | L4 (°) | Pel (°) | Surface Rotation RMS (°) | Surface Rotation MAX (°) | (Right Side) Surface Rotation +Max (°) | (Left Side) Surface Rotation −Max (°) | ||||
| AP vs. HM = 0 (One-Sample Wilcoxon Signed Rank Test) | Observed Median | −0.12 | 0.06 | 0.15 | 0.06 | −0.04 | −0.27 | −0.73 | −1.03 | −1.60 | −2.21 | −2.56 | −2.60 | −2.74 | −2.35 | −1.98 | −1.23 | −0.69 | −0.18 | 0.03 | 2.11 | −2.73 | 1.17 | −3.22 | ||
| Standardized Test Statistic | −1.71 | 2.35 | 1.43 | 0.87 | 0.06 | −1.22 | −2.33 | −3.52 | −5.22 | −6.80 | −7.48 | −7.93 | −8.16 | −7.96 | −7.10 | −5.73 | −3.86 | −1.95 | 0.81 | 12.26 | −6.28 | 11.44 | −12.14 | |||
| p-Value | 0.09 | 0.02 * | 0.15 | 0.39 | 0.96 | 0.22 | 0.02 * | 0.00 * | 0.00 * | 0.00 * | 0.00 * | 0.00 * | 0.00 * | 0.00 * | 0.00 * | 0.00 * | 0.00 * | 0.05 | 0.42 | 0.00 * | 0.00 * | 0.00 * | 0.00 * | |||
| Between-Subject Effects (Two-Way ANOVA) | Sex (Sig) | 0.84 | 0.82 | 0.29 | 0.38 | 0.41 | 0.37 | 0.37 | 0.27 | 0.27 | 0.27 | 0.34 | 0.26 | 0.19 | 0.19 | 0.23 | 0.36 | 0.40 | 0.53 | 0.17 | 0.45 | 0.71 | 0.35 | 0.37 | ||
| Age Cohort (Sig) | 0.50 | 0.63 | 0.40 | 0.30 | 0.27 | 0.48 | 0.50 | 0.48 | 0.52 | 0.47 | 0.52 | 0.76 | 0.66 | 0.60 | 0.67 | 0.82 | 0.99 | 0.71 | 0.01 * | 0.45 | 0.17 | 0.25 | 0.69 | |||
| Sex *Age Cohort (Sig) | 0.15 | 0.92 | 0.97 | 0.99 | 0.98 | 0.94 | 0.92 | 0.87 | 0.93 | 0.85 | 0.92 | 0.95 | 0.83 | 0.69 | 0.62 | 0.57 | 0.37 | 0.23 | 0.06 | 0.49 | 0.94 | 0.71 | 0.84 | |||
| Young vs. Old (Sig) | 0.87 | 0.77 | 0.43 | 0.34 | 0.26 | 0.63 | 0.74 | 0.63 | 0.82 | 0.68 | 0.56 | 0.71 | 0.57 | 0.49 | 0.57 | 0.81 | 1.00 | 0.92 | 1.00 | 1.00 | 0.16 | 0.33 | 0.56 | |||
| Young vs. Middle (Sig) | 0.52 | 0.94 | 0.92 | 0.72 | 0.54 | 0.48 | 0.44 | 0.44 | 0.47 | 0.41 | 0.58 | 0.80 | 0.83 | 0.89 | 0.97 | 1.00 | 0.97 | 0.67 | 0.05 * | 0.55 | 1.00 | 0.99 | 0.97 | |||
| Middle vs. Old (Sig) | 0.93 | 0.97 | 1.00 | 1.00 | 0.95 | 1.00 | 0.97 | 0.99 | 0.94 | 0.97 | 1.00 | 0.99 | 0.91 | 0.77 | 0.73 | 0.88 | 0.97 | 0.96 | 0.07 | 0.47 | 0.18 | 0.22 | 0.71 | |||
| Coronal Plane | ||||||||||||||||||||||||||
| Sh (°) | C7 (°) | T1 (°) | T2 (°) | T3 (°) | T4 (°) | T5 (°) | T6 (°) | T7 (°) | T8 (°) | T9 (°) | T10 (°) | T11 (°) | T12 (°) | L1 (°) | L2 (°) | L3 (°) | L4 (°) | Pel (°) | Trunk Imbalance (VP-DM) (°) | Trunk Imbalance (VP-DM) (mm) | Apical Deviation RMS (mm) | Apical Deviation MAX (mm) | (Right Side) Apical Deviation (VP-DM) +max (mm) | (Left Side) Apical Deviation (VP-DM) −max (mm) | ||
| AP vs. HM = 0 (One-Sample Wilcoxon Signed Rank Test) | Observed Median | −1.08 | −1.11 | −1.55 | −1.68 | −1.38 | −0.73 | 0.11 | 0.93 | 1.23 | 1.30 | 1.02 | 0.68 | 0.43 | 0.21 | 0.05 | −0.29 | 0.04 | 0.51 | −0.07 | −0.24 | −2.35 | 3.19 | −3.30 | 2.70 | −4.52 |
| Standardized Test Statistic | −9.52 | −6.77 | −7.89 | −7.80 | −5.52 | −2.30 | 1.22 | 5.92 | 7.62 | 6.61 | 5.15 | 3.74 | 2.41 | 1.97 | 0.22 | −1.82 | 0.38 | 2.91 | −1.70 | −3.54 | −3.39 | 12.14 | −3.54 | 11.34 | −12.11 | |
| p-Value | 0.00 * | 0.00 * | 0.00 * | 0.00 * | 0.00 * | 0.02 * | 0.22 | 0.00 * | 0.00 * | 0.00 * | 0.00 * | 0.00 * | 0.02 * | 0.05 * | 0.83 | 0.07 | 0.70 | 0.00 * | 0.09 | 0.00 * | 0.00 * | 0.00 * | 0.00 * | 0.00 * | 0.00 * | |
| Between-Subject Effects (two-way ANOVA) | Sex (Sig) | 0.08 | 0.72 | 0.47 | 0.20 | 0.43 | 0.40 | 0.29 | 0.18 | 0.32 | 0.61 | 0.95 | 0.94 | 0.81 | 0.78 | 0.35 | 0.19 | 0.09 | 0.10 | 0.11 | 0.75 | 0.76 | 0.23 | 0.16 | 0.04 * | 0.61 |
| Age Cohort (Sig) | 0.47 | 0.56 | 0.35 | 0.42 | 0.19 | 0.15 | 0.23 | 0.51 | 0.38 | 0.18 | 0.24 | 0.49 | 0.67 | 0.49 | 0.81 | 0.91 | 0.47 | 0.13 | 0.62 | 0.58 | 0.53 | 0.48 | 0.26 | 0.58 | 0.25 | |
| Sex *Age Cohort (Sig) | 1.00 | 0.55 | 0.70 | 0.76 | 0.75 | 0.44 | 0.49 | 0.81 | 0.95 | 0.99 | 0.80 | 0.60 | 0.77 | 0.99 | 0.92 | 0.92 | 0.76 | 0.60 | 0.49 | 0.93 | 0.88 | 0.88 | 0.72 | 0.55 | 0.79 | |
| Young vs. Old (Sig) | 0.63 | 0.78 | 0.50 | 0.53 | 0.12 | 0.07 | 0.19 | 0.96 | 0.44 | 0.12 | 0.38 | 1.00 | 0.67 | 0.62 | 1.00 | 1.00 | 0.40 | 0.14 | 1.00 | 0.86 | 0.54 | 0.95 | 0.88 | 1.00 | 0.70 | |
| Young vs. Middle (Sig) | 0.57 | 0.94 | 0.73 | 0.41 | 0.26 | 0.12 | 0.14 | 0.45 | 1.00 | 0.56 | 0.34 | 0.52 | 1.00 | 1.00 | 0.95 | 0.98 | 0.82 | 0.79 | 0.88 | 1.00 | 1.00 | 0.60 | 0.23 | 0.74 | 0.20 | |
| Middle vs. Old (Sig) | 1.00 | 0.98 | 0.98 | 1.00 | 0.97 | 0.99 | 1.00 | 0.75 | 0.66 | 0.61 | 1.00 | 0.63 | 0.73 | 0.59 | 0.94 | 1.00 | 0.78 | 0.57 | 0.95 | 1.00 | 1.00 | 0.90 | 0.48 | 0.77 | 0.64 | |
| Sagittal Plane | ||||||||||||||||||||||||||
| Sh (°) | C7 (°) | T1 (°) | T2 (°) | T3 (°) | T4 (°) | T5 (°) | T6 (°) | T7 (°) | T8 (°) | T9 (°) | T10 (°) | T11 (°) | T12 (°) | L1 (°) | L2 (°) | L3 (°) | L4 (°) | Pel (°) | Trunk Inclination (VP-DM) (°) | Trunk Inclination (VP-DM) (mm) | Thoracic Kyphosis (ICT-ITL) (°) | Lumbar Lordosis (ITL-ILS) (°) | ||||
| AP vs. HM = 0 (One-Sample Wilcoxon Signed Rank Test) | Observed Median | - | 25.01 | 25.24 | 23.95 | 19.04 | 13.65 | 10.36 | 7.91 | 4.83 | 0.23 | −5.69 | −10.98 | −15.07 | −17.42 | −17.61 | −14.08 | −3.58 | 10.52 | 18.40 | 2.98 | 26.15 | 50.54 | 40.98 | ||
| Standardized Test Statistic | - | 12.29 | 12.29 | 12.26 | 12.26 | 12.23 | 12.25 | 12.15 | 10.91 | 0.89 | −11.74 | −12.29 | −12.26 | −12.26 | −12.26 | −12.23 | −4.97 | 11.74 | 12.27 | 11.84 | 11.84 | 12.26 | 12.29 | |||
| p-Value | - | 0.00 * | 0.00 * | 0.00 * | 0.00 * | 0.00 * | 0.00 * | 0.00 * | 0.00 * | 0.38 | 0.00 * | 0.00 * | 0.00 * | 0.00 * | 0.00 * | 0.00 * | 0.00 * | 0.00 * | 0.00 * | 0.00 * | 0.00 * | 0.00 * | 0.00 * | |||
| Between-Subject Effects (two-way ANOVA) | Sex (Sig) | - | 0.05 * | 0.80 | 0.00 * | 0.00 * | 0.00 * | 0.00 * | 0.00 * | 0.00 * | 0.00 * | 0.00 * | 0.00 * | 0.00 * | 0.00 * | 0.32 | 0.01 * | 0.00 * | 0.00 * | 0.10 | 0.74 | 0.68 | 0.66 | 0.00 * | ||
| Age Cohort (Sig) | - | 0.01 * | 0.03 * | 0.03 * | 0.01 * | 0.01 * | 0.19 | 0.47 | 0.30 | 0.14 | 0.11 | 0.13 | 0.20 | 0.42 | 0.59 | 0.33 | 0.13 | 0.31 | 0.00 * | 0.85 | 0.80 | 0.00 * | 0.70 | |||
| Sex *Age Cohort (Sig) | - | 0.84 | 0.50 | 0.35 | 0.44 | 0.77 | 0.93 | 0.70 | 0.67 | 0.70 | 0.62 | 0.49 | 0.24 | 0.26 | 0.95 | 0.84 | 0.26 | 0.12 | 0.86 | 0.24 | 0.22 | 0.60 | 0.58 | |||
| Young vs. Old (Sig) | - | 0.38 | 0.07 | 0.01 * | 0.00 * | 0.00 * | 0.15 | 1.00 | 0.84 | 0.30 | 0.16 | 0.13 | 0.20 | 0.56 | 0.80 | 0.99 | 1.00 | 0.94 | 0.00 * | 0.96 | 0.96 | 0.00 * | 0.52 | |||
| Young vs. Middle (Sig) | - | 0.00 * | 0.02 * | 0.80 | 0.84 | 0.75 | 0.70 | 0.47 | 0.82 | 0.98 | 1.00 | 0.96 | 0.78 | 0.38 | 0.58 | 0.66 | 1.00 | 0.60 | 0.03 * | 0.88 | 0.84 | 0.06 | 0.80 | |||
| Middle vs. Old (Sig) | - | 0.21 | 0.84 | 0.06 | 0.01 * | 0.06 | 1.00 | 1.00 | 0.34 | 0.21 | 0.20 | 0.22 | 0.71 | 0.99 | 0.98 | 0.46 | 0.22 | 0.40 | 0.34 | 0.99 | 0.99 | 0.02 * | 0.89 | |||
| Transversal Plane | Coronal Plane | Sagittal Plane | |||||||||||||||
|---|---|---|---|---|---|---|---|---|---|---|---|---|---|---|---|---|---|
| Surface Rotation RMS (°) | Surface Rotation MAX (°) | (Right Side) Surface Rotation +Max (°) | (Left Side) Surface Rotation −Max (°) | Trunk Imbalance (VP-DM) (°) | Trunk Imbalance (VP-DM) (mm) | Apical Deviation RMS (mm) | Apical Deviation MAX (mm) | (Right Side) Apical Deviation (VP-DM) +Max (mm) | (Left Side) Apical Deviation (VP-DM) −Max (mm) | Trunk Inclination (VP-DM) (°) | Trunk Inclination (VP-DM) (mm) | Thoracic Kyphosis (ICT-ITL) (°) | Lumbar Lordosis (ITL-ILS) (°) | ||||
| Current Study | All Participants | MoM | 2.3 | −1.9 | 1.5 | −3.3 | −0.2 | −1.7 | 3.6 | −1.8 | 3.2 | −4.9 | 3.1 | 26.0 | 49.9 | 40.9 | |
| SD | 0.9 | 4.0 | 1.4 | 2.3 | 0.8 | 7.3 | 1.7 | 7.1 | 3.0 | 3.3 | 2.1 | 17.5 | 8.3 | 9.2 | |||
| Sex | All Females | MoM | 2.2 | −1.8 | 1.5 | −3.2 | −0.2 | −1.6 | 3.5 | −2.3 | 2.9 | −4.9 | 3.1 | 25.6 | 50.1 | 44.0 | |
| SD | 0.9 | 4.0 | 1.4 | 2.3 | 0.9 | 7.7 | 1.7 | 6.7 | 2.8 | 3.3 | 2.1 | 17.6 | 8.2 | 8.5 | |||
| All Males | MoM | 2.3 | −2.1 | 1.7 | −3.6 | −0.2 | −2.0 | 3.8 | −0.8 | 3.8 | −4.7 | 3.0 | 26.7 | 49.6 | 34.9 | ||
| SD | 0.9 | 4.0 | 1.4 | 2.3 | 0.8 | 6.6 | 1.6 | 7.7 | 3.4 | 3.2 | 2.0 | 17.4 | 8.6 | 7.3 | |||
| Age Cohort “Young” | All Young Participants | MoM | 2.3 | −2.3 | 1.4 | −3.5 | −0.3 | −2.5 | 3.5 | −0.9 | 3.3 | −4.4 | 2.9 | 24.8 | 46.5 | 40.1 | |
| SD | 0.9 | 3.6 | 1.2 | 2.2 | 0.8 | 6.5 | 1.6 | 7.0 | 2.9 | 3.1 | 2.2 | 18.4 | 7.1 | 8.9 | |||
| Young Females | MoM | 2.4 | −2.4 | 1.3 | −3.5 | −0.3 | −2.6 | 3.4 | −1.1 | 3.1 | −4.4 | 2.8 | 22.6 | 46.9 | 43.0 | ||
| SD | 0.9 | 3.8 | 1.3 | 2.3 | 0.8 | 6.7 | 1.6 | 7.2 | 2.7 | 3.1 | 2.1 | 17.5 | 6.9 | 8.7 | |||
| Young Males | MoM | 2.2 | −2.3 | 1.7 | −3.6 | −0.2 | −2.3 | 3.6 | −0.4 | 3.8 | −4.4 | 3.3 | 28.9 | 45.8 | 34.5 | ||
| SD | 0.8 | 3.4 | 1.2 | 2.2 | 0.7 | 6.3 | 1.6 | 6.7 | 3.1 | 3.1 | 2.2 | 19.7 | 7.7 | 6.5 | |||
| Age Cohort “Middle” | All Middle Participants | MoM | 2.1 | −2.3 | 1.4 | −3.4 | −0.2 | −1.9 | 3.8 | −2.9 | 2.9 | −5.3 | 3.2 | 27.0 | 49.7 | 41.0 | |
| SD | 1.0 | 3.6 | 1.4 | 2.2 | 0.8 | 7.0 | 1.8 | 7.0 | 3.2 | 3.3 | 2.0 | 17.0 | 7.7 | 9.0 | |||
| Middle Females | MoM | 2.0 | −2.2 | 1.3 | −3.3 | −0.2 | −1.8 | 3.6 | −3.3 | 2.8 | −5.3 | 3.2 | 26.3 | 49.3 | 43.7 | ||
| SD | 0.8 | 3.4 | 1.4 | 2.0 | 0.9 | 7.4 | 1.9 | 6.4 | 2.9 | 3.3 | 2.1 | 17.3 | 7.6 | 9.0 | |||
| Middle Males | MoM | 2.3 | −2.4 | 1.5 | −3.6 | −0.2 | −2.2 | 4.1 | −2.2 | 3.2 | −5.4 | 3.2 | 28.3 | 50.5 | 35.7 | ||
| SD | 1.1 | 3.8 | 1.4 | 2.6 | 0.7 | 6.2 | 1.7 | 8.0 | 3.7 | 3.4 | 1.9 | 16.7 | 7.9 | 6.2 | |||
| Age Cohort “Old” | All Old Participants | MoM | 2.3 | −1.1 | 1.8 | −3.1 | −0.1 | −0.8 | 3.6 | −1.5 | 3.3 | −4.8 | 3.1 | 26.1 | 53.4 | 41.6 | |
| SD | 0.9 | 4.6 | 1.7 | 2.4 | 0.9 | 8.3 | 1.6 | 7.3 | 3.1 | 3.3 | 2.1 | 17.4 | 8.7 | 9.7 | |||
| Old Females | MoM | 2.3 | −0.9 | 1.8 | −2.9 | −0.2 | −0.4 | 3.5 | −2.4 | 2.8 | −5.1 | 3.4 | 27.8 | 54.0 | 45.3 | ||
| SD | 0.9 | 4.6 | 1.7 | 2.4 | 1.0 | 8.8 | 1.7 | 6.5 | 2.7 | 3.5 | 2.2 | 18.2 | 8.7 | 7.7 | |||
| Old Males | MoM | 2.5 | −1.4 | 1.8 | −3.5 | −0.1 | −1.4 | 3.7 | 0.3 | 4.4 | −4.3 | 2.6 | 22.8 | 52.4 | 34.4 | ||
| SD | 0.9 | 4.8 | 1.7 | 2.3 | 0.9 | 7.4 | 1.6 | 8.5 | 3.6 | 3.0 | 1.8 | 15.5 | 9.0 | 9.1 | |||
| Literature Comparison | Degenhardt et al., 2017 [22] | Young-Middle Participants | Mean | 3.8 | 1.8 | 5.6 | −4.6 | 0.1 | 1.0 | 5.6 | 3.6 ‡ | 7.9 | −5.0 | 3.1 | 26.0 | 48.1 | 35.6 |
| SD | 1.4 | 7.2 | 3.4 | 2.9 | 0.8 | 7.2 | 3.0 | 10.3 ‡ | 5.8 | 4.1 | 2.3 | 18.7 | 9.1 | 8.4 | |||
| Degenhardt et al., 2020 [23] | Young-Middle Participants | Mean | 3.8 | 2.0 | 5.7 | −4.5 | 0.2 | 1.3 | 5.4 | 4.3 | 8.0 | −4.6 | 3.2 | 26.2 | 48.5 | 35.4 | |
| SD | 1.0 | 6.0 | 2.8 | 2.4 | 0.7 | 5.6 | 2.5 | 8.7 | 5.1 | 2.9 | 2.2 | 17.7 | 8.3 | 7.6 | |||
| Michalik et al., 2020 [19] | Young Females | Mean | 3.6 | - | - | - | −0.1 | - | 5.6 | - | - | - | 2.1 | - | 44.0 † | 37.4 † | |
| SD | 1.6 | - | - | - | 0.9 | - | 2.3 | - | - | - | 2.4 | - | 8.6 † | 9.8 † | |||
| Young Males | Mean | 3.5 | - | - | - | −0.1 | - | 5.1 | - | - | - | 1.9 | - | 44.6 † | 29.0 † | ||
| SD | 1.6 | - | - | - | 1.0 | - | 2.1 | - | - | - | 1.9 | - | 7.8 † | 7.7 † | |||
| Schröder et al., 2011 [20] | Young Females | Mean | 3.6 | - | - | - | - | 6.9 | 5.5 | - | - | - | - | 12.3 | 47.1 | 42.7 | |
| SD | 1.8 | - | - | - | - | 4.6 | 2.3 | - | - | - | - | 17.9 | 8.6 | 8.2 | |||
| Young Males | Mean | 3.1 | - | - | - | - | 7.7 | 5.8 | - | - | - | - | 10.3 | 49.2 | 35.8 | ||
| SD | 1.5 | - | - | - | - | 7.2 | 2.5 | - | - | - | - | 16.4 | 9.3 | 6.6 | |||
| Schröder et al., 2014 [21] | Young Females | Mean | 3.4 | - | - | - | - | 7.7 | 4.2 | - | - | - | 16.6 * | - | 45.4 | 44.0 | |
| SD | 1.7 | - | - | - | - | 4.6 | 2.0 | - | - | - | 15.5 * | - | 8.1 | 9.4 | |||
| Young Males | Mean | 3.6 | - | - | - | - | 6.9 | 4.5 | - | - | - | 20.8 * | - | 47.2 | 35.9 | ||
| SD | 1.4 | - | - | - | - | 4.6 | 2.1 | - | - | - | 15.2 * | - | 7.3 | 8.2 | |||
| Furian et al., 2013 [18] | Girls | Mean | - | - | - | - | - | 5.7 | - | 4.9 ‡ | - | - | - | 2.6 * | 47.1 †∆ | 42.1 †∆ | |
| SD | - | - | - | - | - | 0.7 | - | 0.7 ‡ | - | - | - | 0.7 * | |||||
| Boys | Mean | - | - | - | - | - | 7.4 | - | 4.7 ‡ | - | - | - | 3.0 * | 7.5 †∆ | 9.9 †∆ | ||
| SD | - | - | - | - | - | 0.8 | - | 0.4 ‡ | - | - | - | 0.2 * | |||||
Publisher’s Note: MDPI stays neutral with regard to jurisdictional claims in published maps and institutional affiliations. |
© 2022 by the authors. Licensee MDPI, Basel, Switzerland. This article is an open access article distributed under the terms and conditions of the Creative Commons Attribution (CC BY) license (https://creativecommons.org/licenses/by/4.0/).
Share and Cite
Huthwelker, J.; Konradi, J.; Wolf, C.; Westphal, R.; Schmidtmann, I.; Drees, P.; Betz, U. Reference Values for 3D Spinal Posture Based on Videorasterstereographic Analyses of Healthy Adults. Bioengineering 2022, 9, 809. https://doi.org/10.3390/bioengineering9120809
Huthwelker J, Konradi J, Wolf C, Westphal R, Schmidtmann I, Drees P, Betz U. Reference Values for 3D Spinal Posture Based on Videorasterstereographic Analyses of Healthy Adults. Bioengineering. 2022; 9(12):809. https://doi.org/10.3390/bioengineering9120809
Chicago/Turabian StyleHuthwelker, Janine, Jürgen Konradi, Claudia Wolf, Ruben Westphal, Irene Schmidtmann, Philipp Drees, and Ulrich Betz. 2022. "Reference Values for 3D Spinal Posture Based on Videorasterstereographic Analyses of Healthy Adults" Bioengineering 9, no. 12: 809. https://doi.org/10.3390/bioengineering9120809
APA StyleHuthwelker, J., Konradi, J., Wolf, C., Westphal, R., Schmidtmann, I., Drees, P., & Betz, U. (2022). Reference Values for 3D Spinal Posture Based on Videorasterstereographic Analyses of Healthy Adults. Bioengineering, 9(12), 809. https://doi.org/10.3390/bioengineering9120809