
Expression of E-Cadherin in Epithelial Cancer Cells Increases Cell Motility and Directionality through the Localization of ZO-1 during Collective Cell Migration

 , , ,
, , ,  and
and 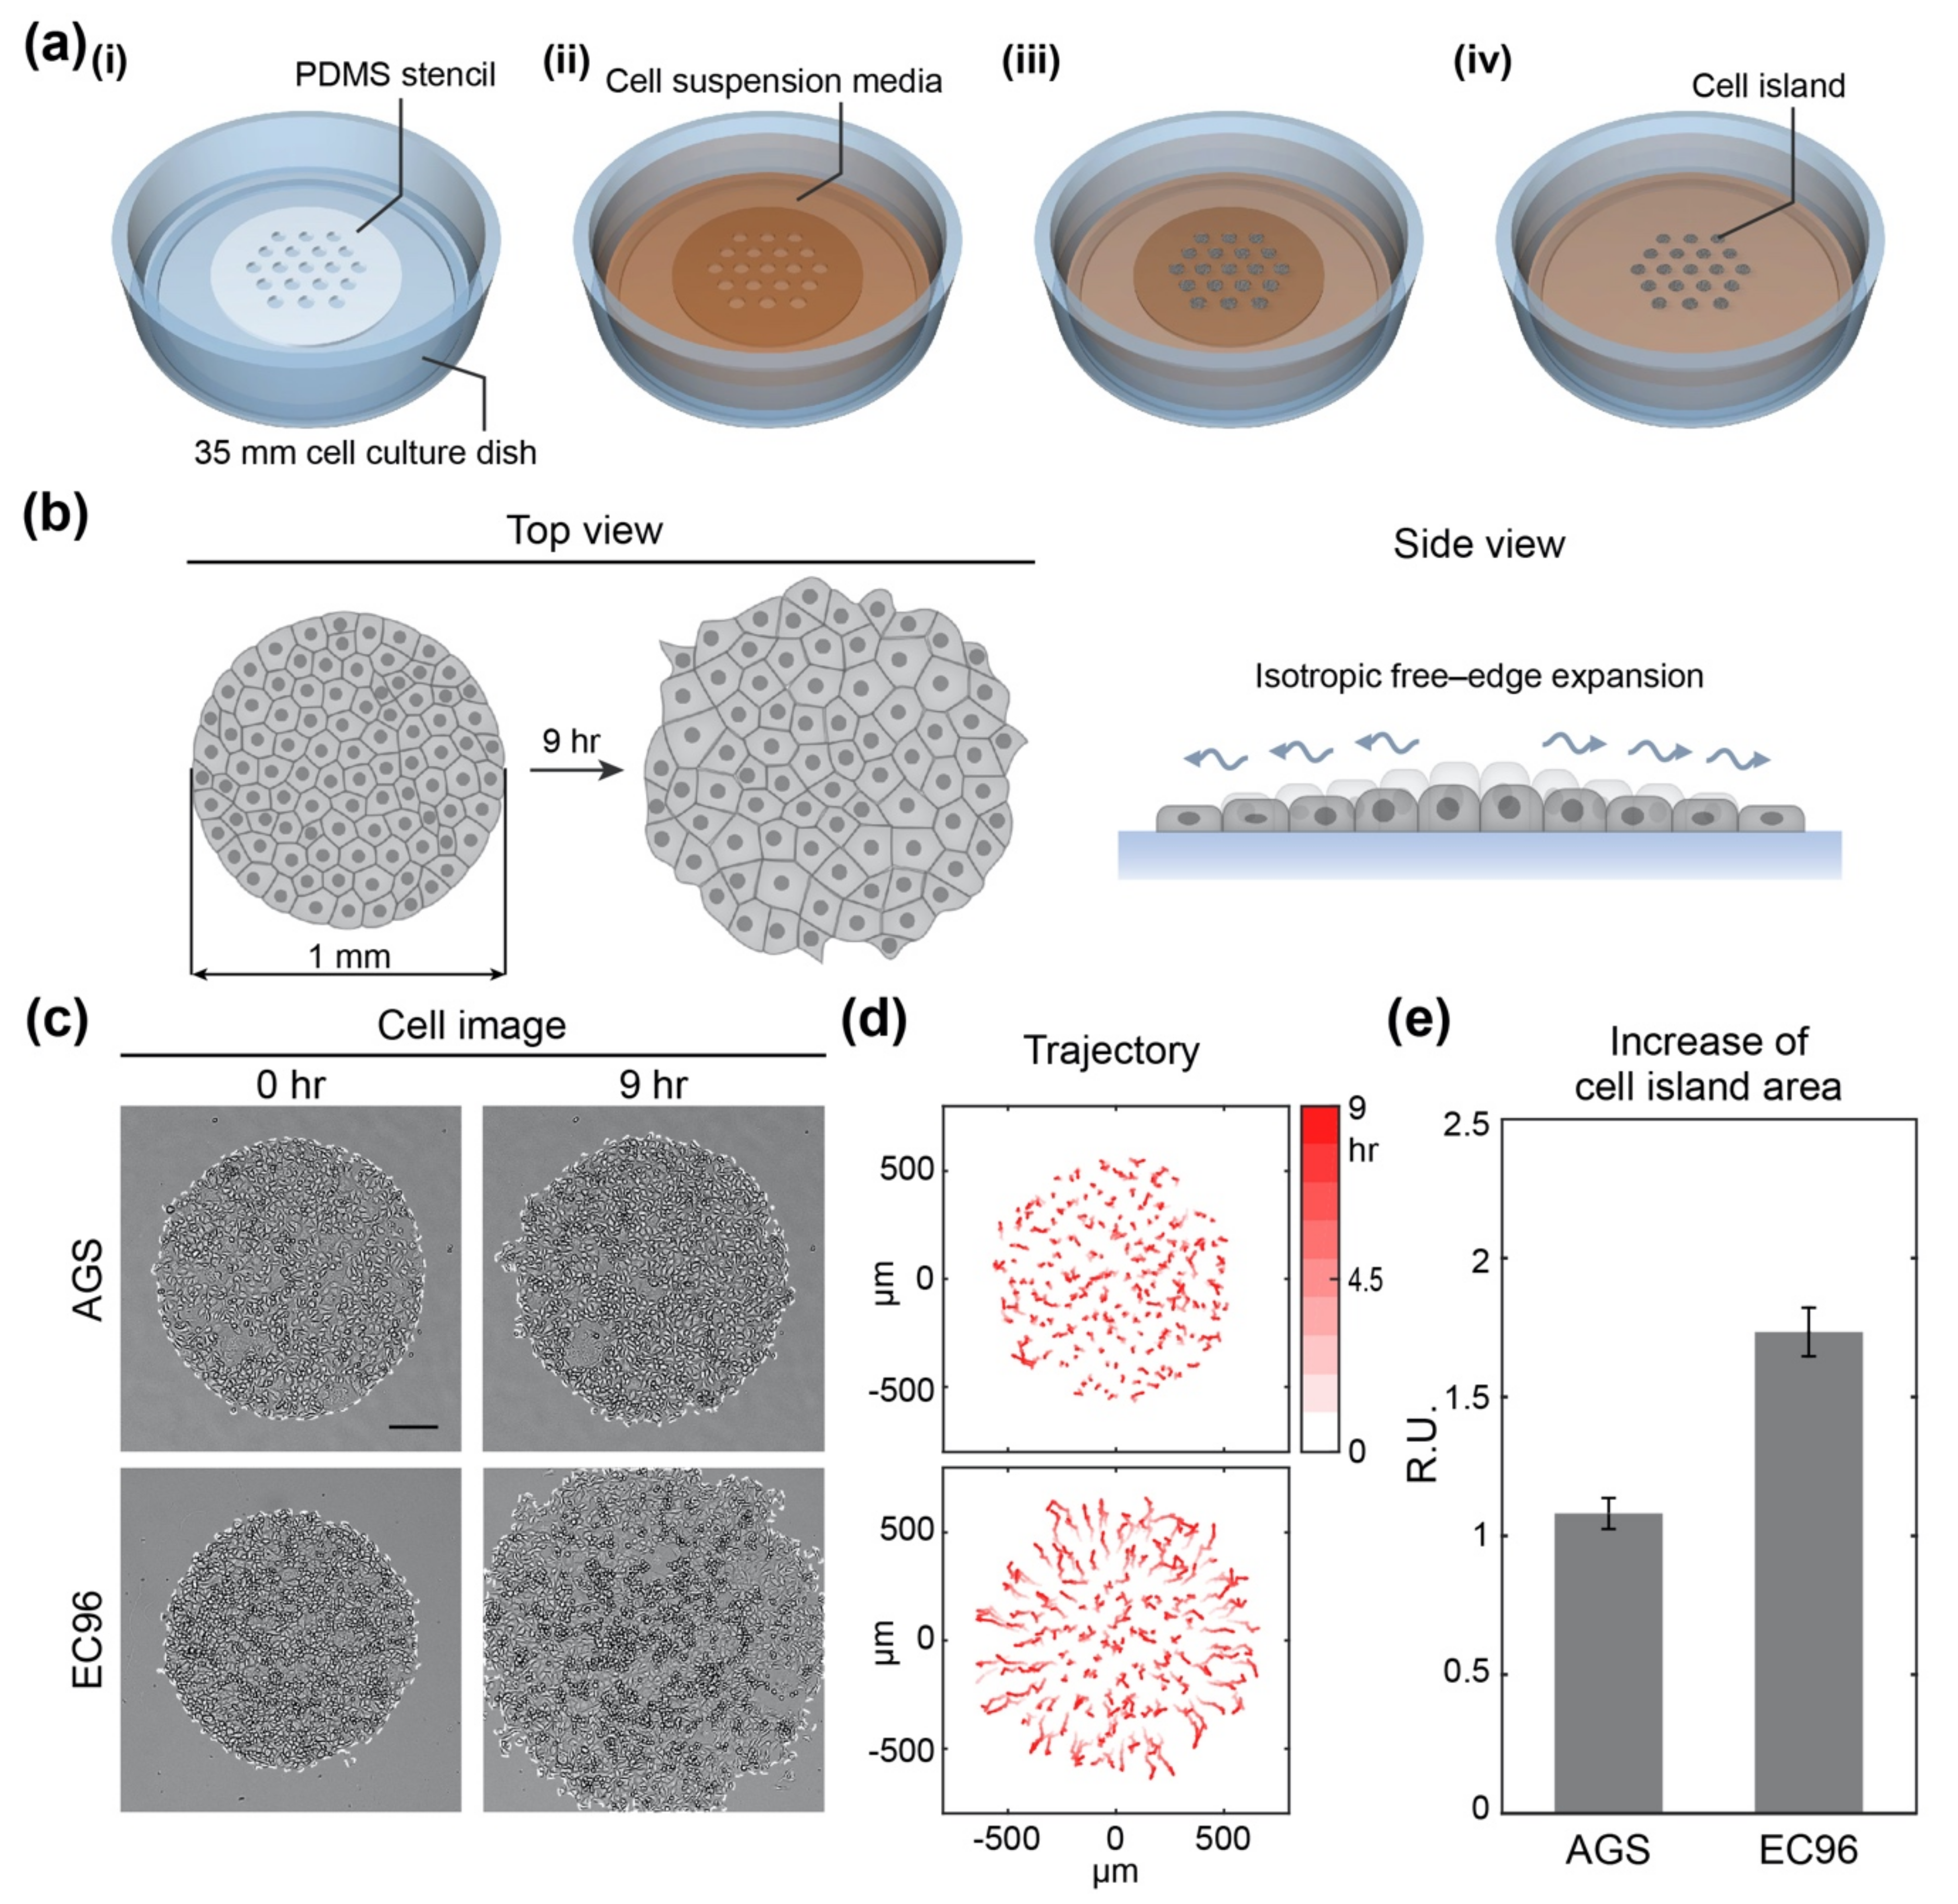
Abstract
1. Introduction
2. Materials and Methods
2.1. Cell Culture
2.2. Transient Transfection with siRNAs and Stable Knockdown Cell Line Generation
2.3. Fabrication of Polydimethylsiloxane (PDMS) Stencils
2.4. Micropatterning of Cell Islands
2.5. Live Cell Image Acquisition: Time-Lapse Microscopy
2.6. Cell Velocities and Trajectories
2.7. Path Length and Directional Persistence
2.8. Differentiation of Low or High Migratory Cells
2.9. Immunoblotting
2.10. In Vitro Wound Healing Assay
2.11. Quantitative RT-PCR
2.12. Immunofluorescence Staining
3. Results
3.1. E-Cadherin Re-Expression in AGS Gastric Cancer Cells Increases Cell Migration
3.2. E-Cadherin Re-Expression in AGS Gastric Cancer Cells Increases Fast and Straightforward Cell Migration
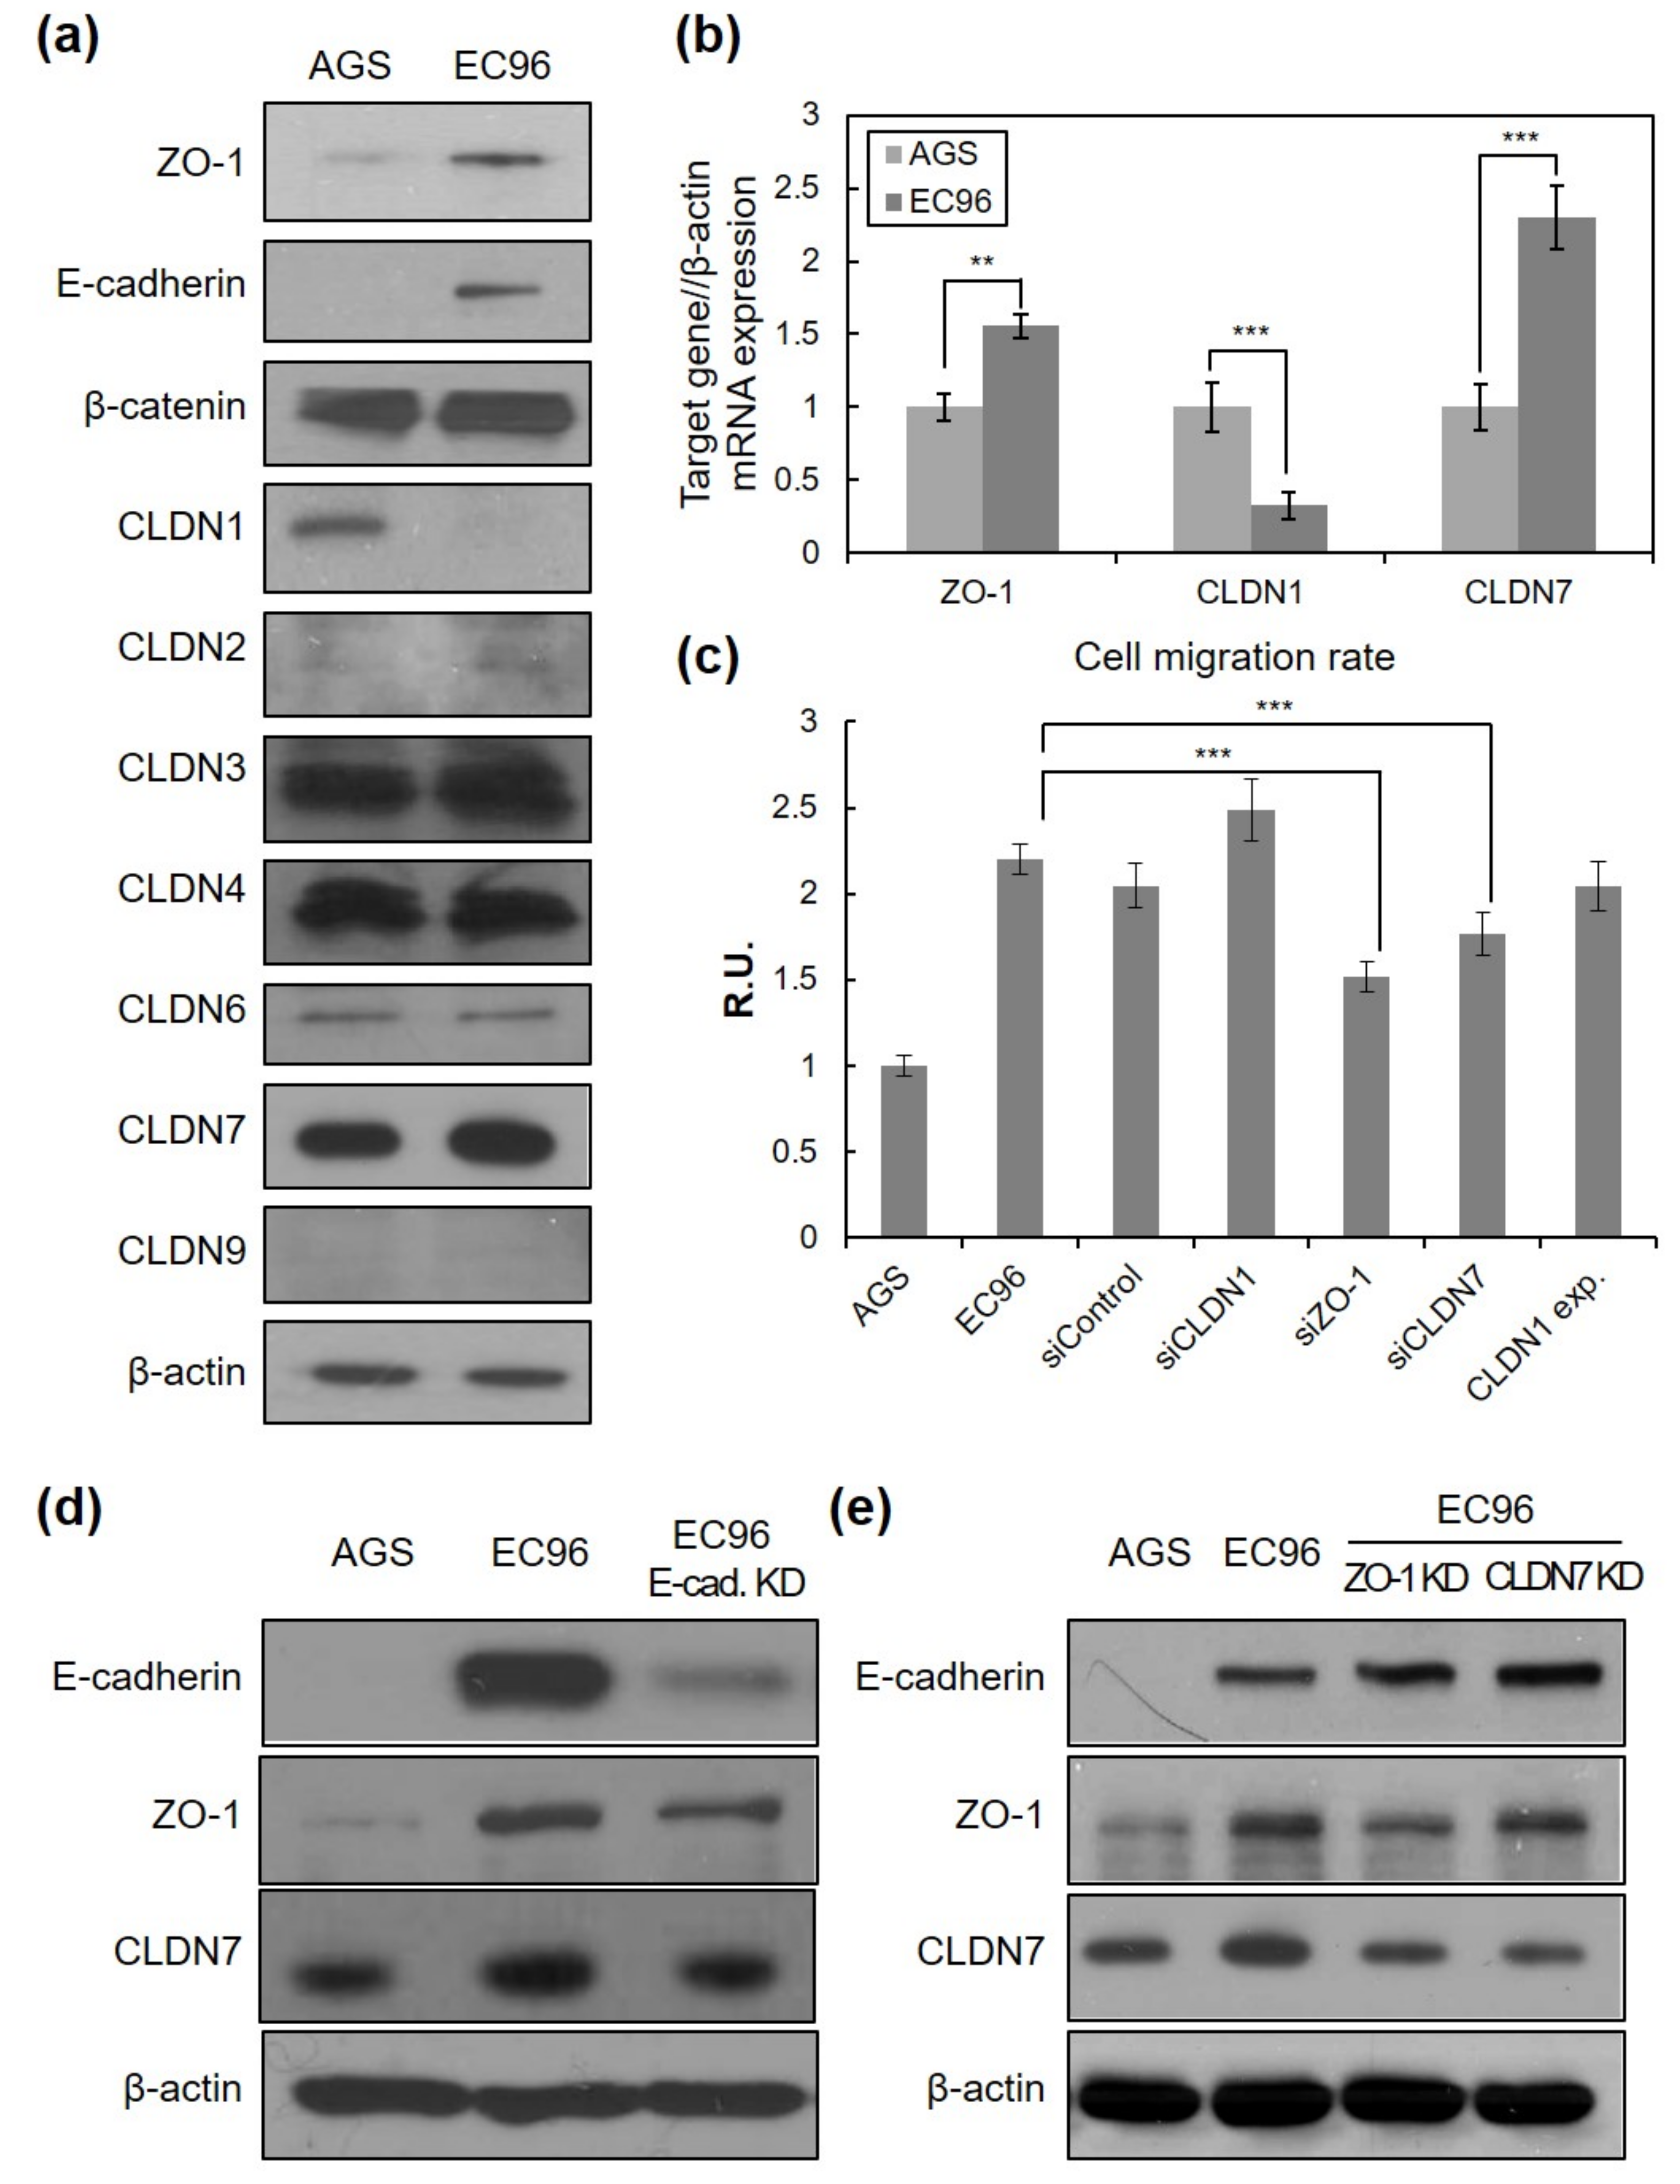
3.3. E-Cadherin Expression Regulates TJ Protein Expression and Cell Migration

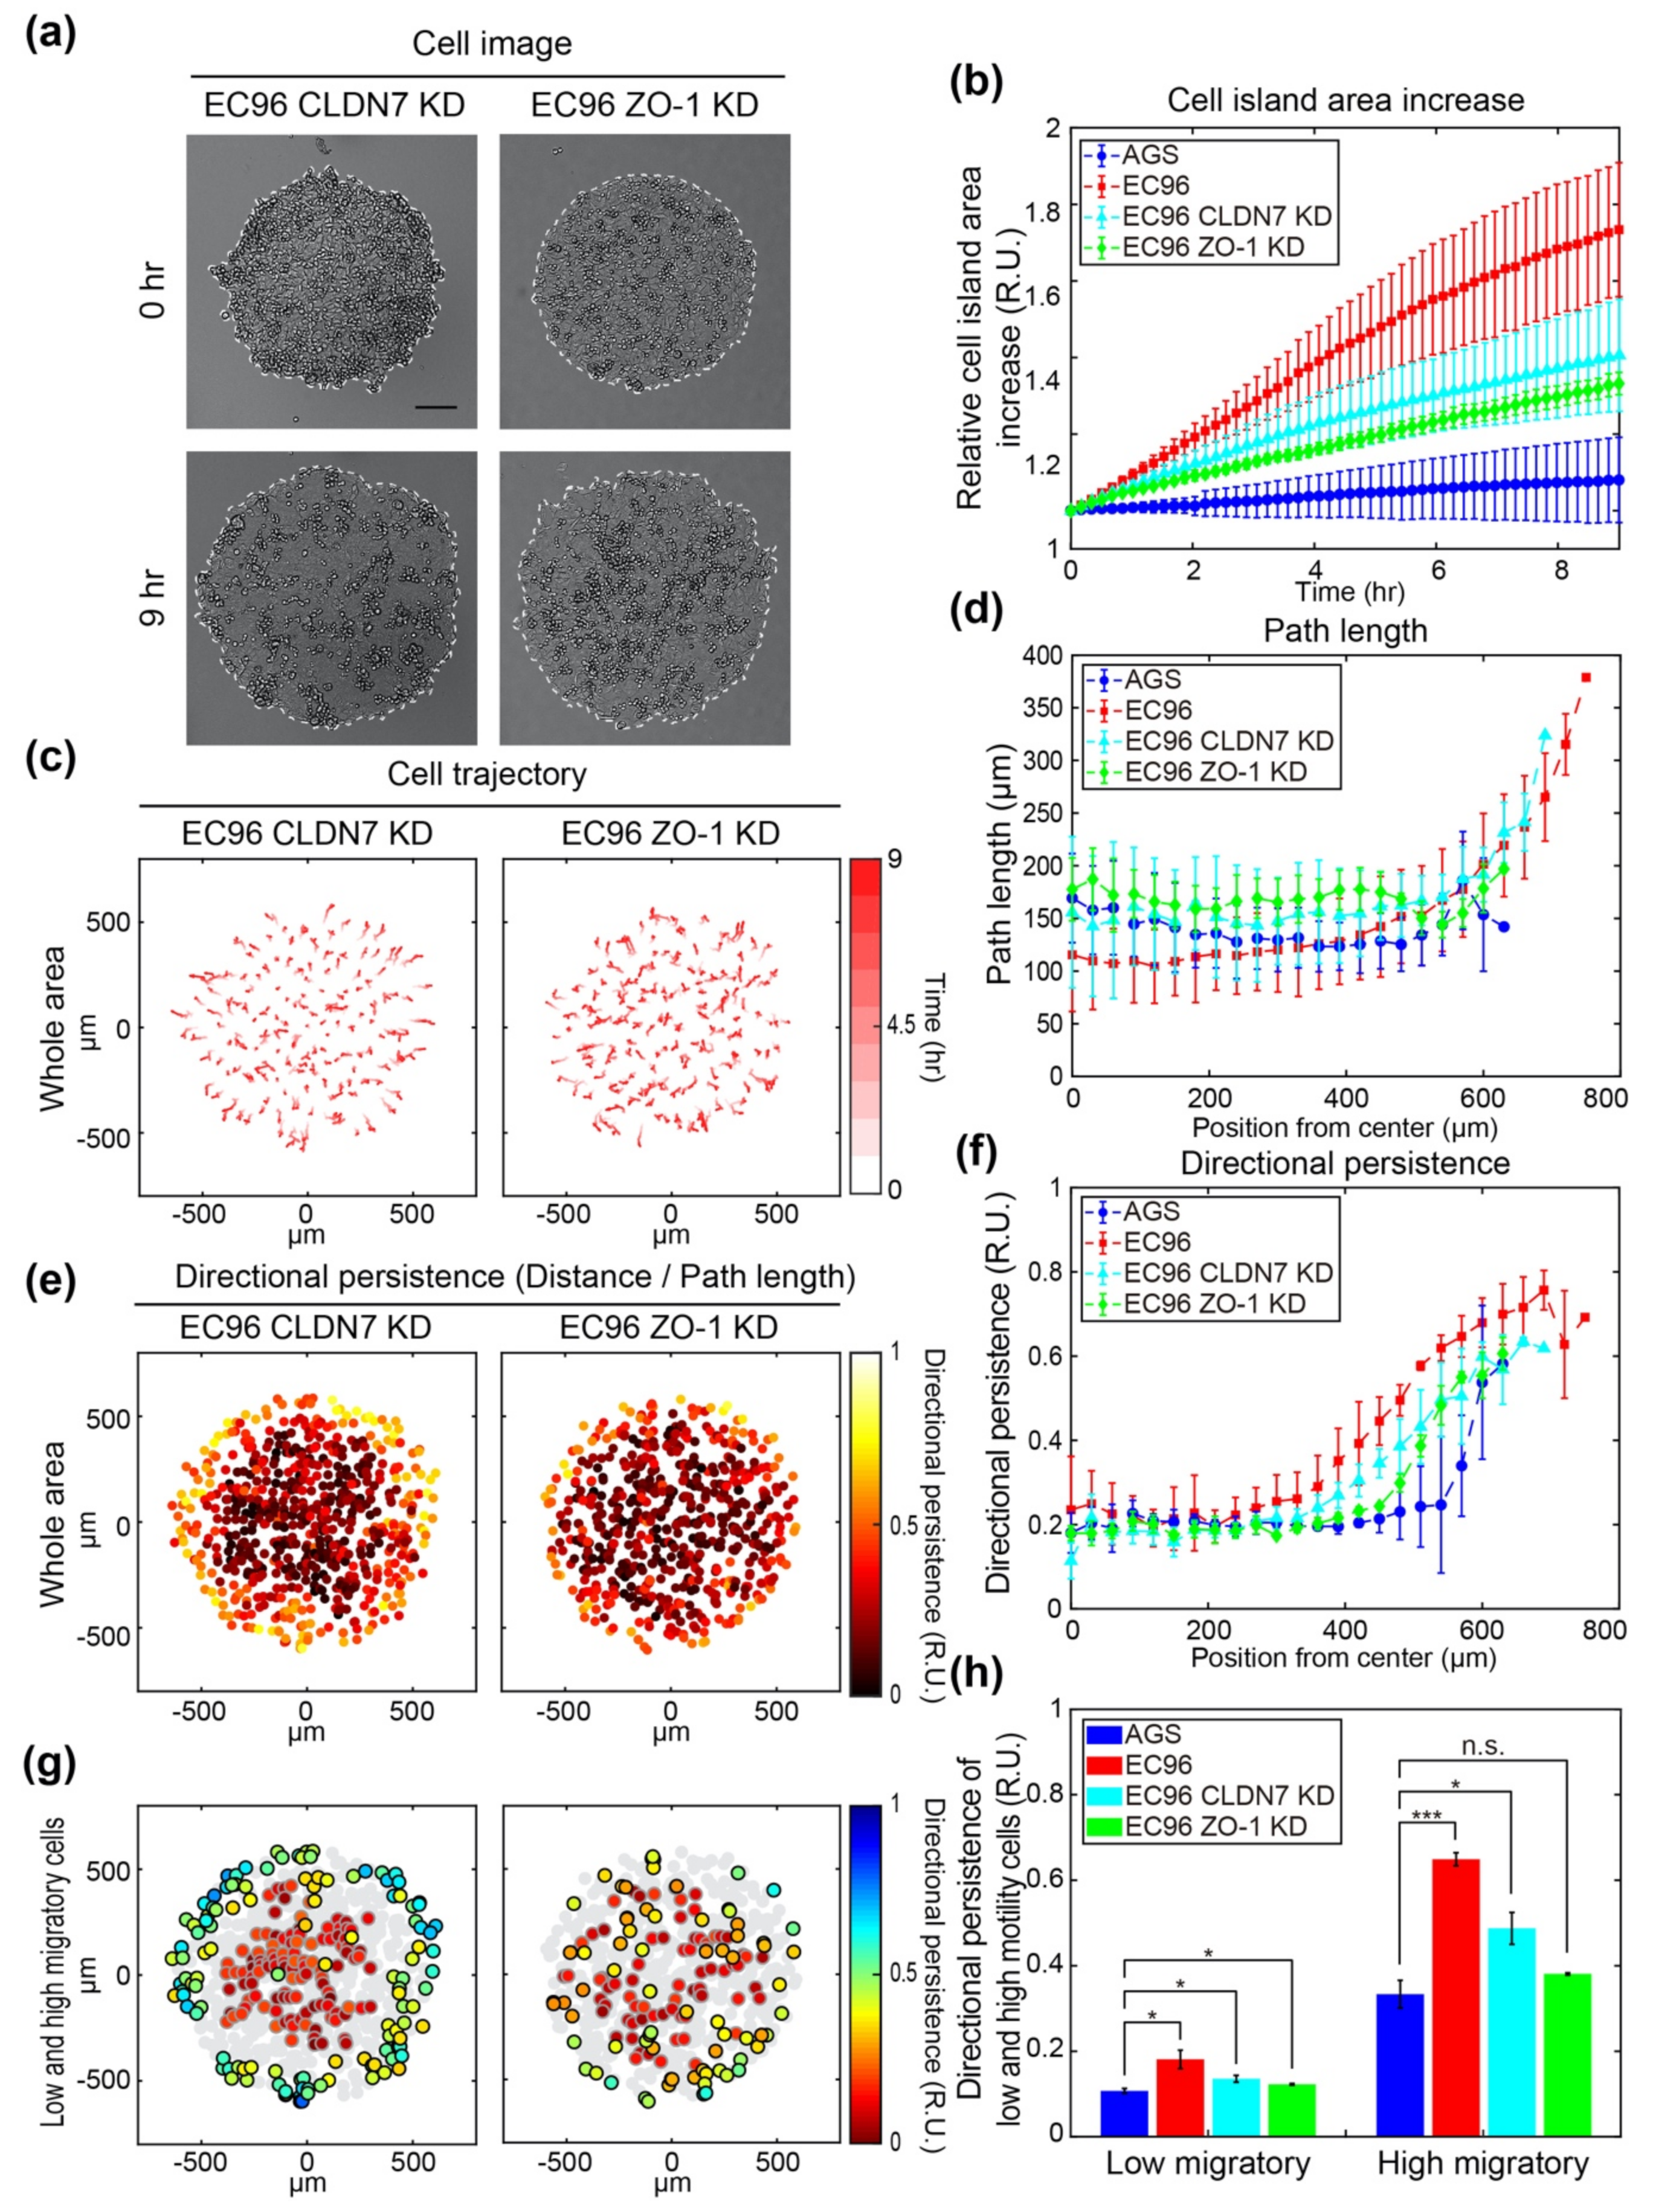
3.4. ZO-1 Is Involved in Regulation of Cell Migration
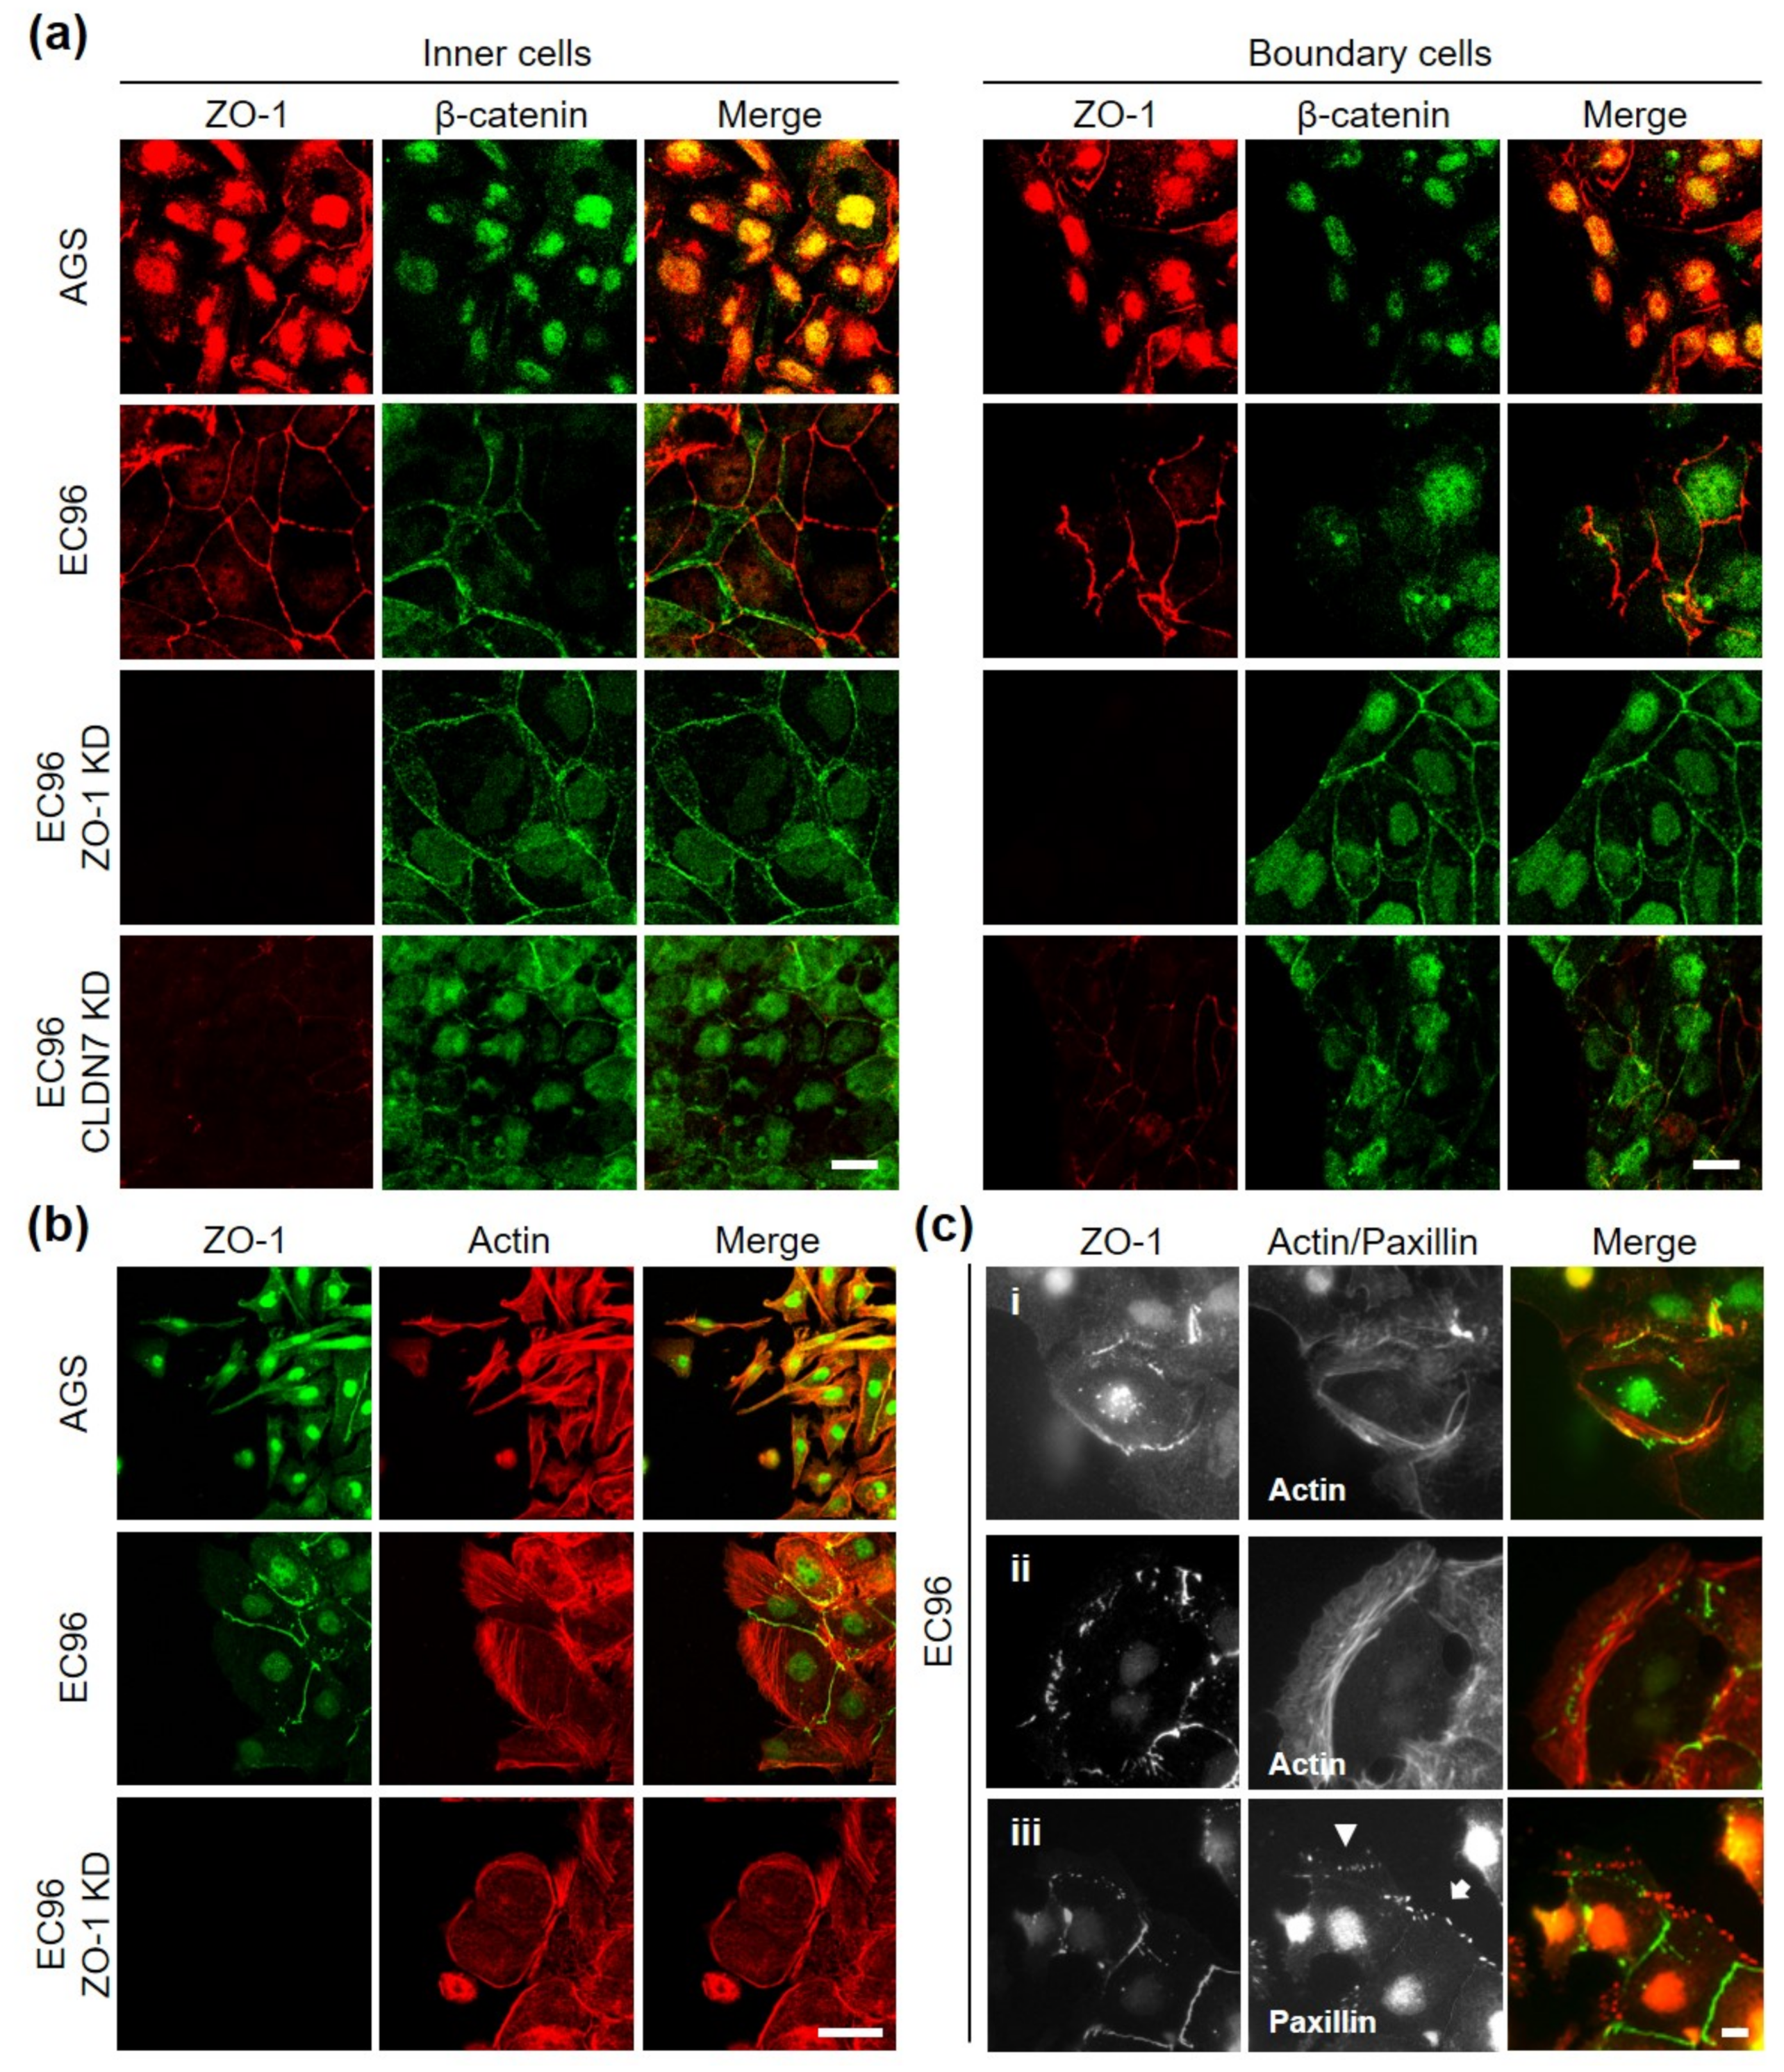
3.5. ZO-1 Regulates Directional Movement of Cells
4. Discussion
5. Conclusions
Supplementary Materials
Author Contributions
Funding
Institutional Review Board Statement
Informed Consent Statement
Data Availability Statement
Conflicts of Interest
References
- Halin, C.; Mora, J.R.; Sumen, C.; von Andrian, U.H. In vivo imaging of lymphocyte trafficking. Annu. Rev. Cell Dev. Biol. 2005, 21, 581–603. [Google Scholar] [CrossRef] [PubMed]
- Friedl, P.; Hegerfeldt, Y.; Tusch, M. Collective cell migration in morphogenesis and cancer. Int. J. Dev. Biol. 2004, 48, 441–449. [Google Scholar] [CrossRef] [PubMed]
- Christiansen, J.J.; Rajasekaran, A.K. Reassessing epithelial to mesenchymal transition as a prerequisite for carcinoma invasion and metastasis. Cancer Res. 2006, 66, 8319–8326. [Google Scholar] [CrossRef] [PubMed]
- Mattila, P.K.; Lappalainen, P. Filopodia: Molecular architecture and cellular functions. Nat. Rev. Mol. Cell Biol. 2008, 9, 446–454. [Google Scholar] [CrossRef]
- Shook, D.; Keller, R. Mechanisms, mechanics and function of epithelial-mesenchymal transitions in early development. Mech. Dev. 2003, 120, 1351–1383. [Google Scholar] [CrossRef]
- Thiery, J.P.; Sleeman, J.P. Complex networks orchestrate epithelial-mesenchymal transitions. Nat. Rev. Mol. Cell Biol. 2006, 7, 131–142. [Google Scholar] [CrossRef]
- Thiery, J.P.; Acloque, H.; Huang, R.Y.; Nieto, M.A. Epithelial-mesenchymal transitions in development and disease. Cell 2009, 139, 871–890. [Google Scholar] [CrossRef]
- Harjunpaa, H.; Llort Asens, M.; Guenther, C.; Fagerholm, S.C. Cell Adhesion Molecules and Their Roles and Regulation in the Immune and Tumor Microenvironment. Front. Immunol. 2019, 10, 1078. [Google Scholar] [CrossRef]
- Pignatelli, M.; Vessey, C.J. Adhesion molecules: Novel molecular tools in tumor pathology. Hum. Pathol. 1994, 25, 849–856. [Google Scholar] [CrossRef]
- Le Bras, G.F.; Taubenslag, K.J.; Andl, C.D. The regulation of cell-cell adhesion during epithelial-mesenchymal transition, motility and tumor progression. Cell Adh. Migr. 2012, 6, 365–373. [Google Scholar] [CrossRef]
- Janiszewska, M.; Primi, M.C.; Izard, T. Cell adhesion in cancer: Beyond the migration of single cells. J. Biol. Chem. 2020, 295, 2495–2505. [Google Scholar] [CrossRef]
- Pecina-Slaus, N. Tumor suppressor gene E-cadherin and its role in normal and malignant cells. Cancer Cell Int. 2003, 3, 17. [Google Scholar] [CrossRef]
- Bukholm, I.K.; Nesland, J.M.; Borresen-Dale, A.L. Re-expression of E-cadherin, alpha-catenin and beta-catenin, but not of gamma-catenin, in metastatic tissue from breast cancer patients [seecomments]. J. Pathol. 2000, 190, 15–19. [Google Scholar] [CrossRef]
- Wells, A.; Yates, C.; Shepard, C.R. E-cadherin as an indicator of mesenchymal to epithelial reverting transitions during the metastatic seeding of disseminated carcinomas. Clin. Exp. Metastasis. 2008, 25, 621–628. [Google Scholar] [CrossRef]
- Chao, Y.L.; Shepard, C.R.; Wells, A. Breast carcinoma cells re-express E-cadherin during mesenchymal to epithelial reverting transition. Mol. Cancer 2010, 9, 179. [Google Scholar] [CrossRef]
- Brandner, J.M.; Zorn-Kruppa, M.; Yoshida, T.; Moll, I.; Beck, L.A.; De Benedetto, A. Epidermal tight junctions in health and disease. Tissue Barriers 2015, 3, e974451. [Google Scholar] [CrossRef]
- Martin, T.A.; Jiang, W.G. Loss of tight junction barrier function and its role in cancer metastasis. Biochim. Biophys. Acta. 2009, 1788, 872–891. [Google Scholar] [CrossRef]
- Tornavaca, O.; Chia, M.; Dufton, N.; Almagro, L.O.; Conway, D.E.; Randi, A.M.; Schwartz, M.A.; Matter, K.; Balda, M.S. ZO-1 controls endothelial adherens junctions, cell-cell tension, angiogenesis, and barrier formation. J. Cell Biol. 2015, 208, 821–838. [Google Scholar] [CrossRef]
- Itoh, M.; Nagafuchi, A.; Moroi, S.; Tsukita, S. Involvement of ZO-1 in cadherin-based cell adhesion through its direct binding to alpha catenin and actin filaments. J. Cell Biol. 1997, 138, 181–192. [Google Scholar] [CrossRef]
- Gonzalez-Mariscal, L.; Tapia, R.; Chamorro, D. Crosstalk of tight junction components with signaling pathways. Biochim. Biophys. Acta 2008, 1778, 729–756. [Google Scholar] [CrossRef]
- Balda, M.S.; Garrett, M.D.; Matter, K. The ZO-1-associated Y-box factor ZONAB regulates epithelial cell proliferation and cell density. J. Cell Biol. 2003, 160, 423–432. [Google Scholar] [CrossRef] [PubMed]
- Georgiadis, A.; Tschernutter, M.; Bainbridge, J.W.; Balaggan, K.S.; Mowat, F.; West, E.L.; Munro, P.M.; Thrasher, A.J.; Matter, K.; Balda, M.S.; et al. The tight junction associated signalling proteins ZO-1 and ZONAB regulate retinal pigment epithelium homeostasis in mice. PLoS ONE 2010, 5, e15730. [Google Scholar] [CrossRef] [PubMed]
- Poujade, M.; Grasland-Mongrain, E.; Hertzog, A.; Jouanneau, J.; Chavrier, P.; Ladoux, B.; Buguin, A.; Silberzan, P. Collective migration of an epithelial monolayer in response to a model wound. Proc. Natl. Acad. Sci. USA 2007, 104, 15988–15993. [Google Scholar] [CrossRef] [PubMed]
- Jang, H.; Notbohm, J.; Gweon, B.; Cho, Y.; Park, C.Y.; Kee, S.H.; Fredberg, J.J.; Shin, J.H.; Park, Y. Homogenizing cellular tension by hepatocyte growth factor in expanding epithelial monolayer. Sci. Rep. 2017, 8, 45844. [Google Scholar] [CrossRef]
- Jang, H.; Kim, J.; Shin, J.H.; Fredberg, J.J.; Park, C.Y.; Park, Y. Traction microscopy with integrated microfluidics: Responses of the multi-cellular island to gradients of HGF. Lab Chip 2019, 19, 1579–1588. [Google Scholar] [CrossRef]
- Kim, S.M.; Kim, R.; Ryu, J.H.; Jho, E.H.; Song, K.J.; Jang, S.I.; Kee, S.H. Multinuclear giant cell formation is enhanced by down-regulation of Wnt signaling in gastric cancer cell line, AGS. Exp. Cell Res. 2005, 308, 18–28. [Google Scholar] [CrossRef]
- Park, S.Y.; Shin, J.H.; Kee, S.H. E-cadherin expression increases cell proliferation by regulating energy metabolism through nuclear factor-kappaB in AGS cells. Cancer Sci. 2017, 108, 1769–1777. [Google Scholar] [CrossRef]
- Liu, X.; Huang, H.; Remmers, N.; Hollingsworth, M.A. Loss of E-cadherin and epithelial to mesenchymal transition is not required for cell motility in tissues or for metastasis. Tissue Barriers 2014, 2, e969112. [Google Scholar] [CrossRef]
- Padmanaban, V.; Krol, I.; Suhail, Y.; Szczerba, B.M.; Aceto, N.; Bader, J.S.; Ewald, A.J. E-cadherin is required for metastasis in multiple models of breast cancer. Nature 2019, 573, 439–444. [Google Scholar] [CrossRef]
- Gheldof, A.; Berx, G. Cadherins and epithelial-to-mesenchymal transition. Prog. Mol. Biol. Transl. Sci. 2013, 116, 317–336. [Google Scholar] [CrossRef]
- Li, S.; Qin, X.; Chai, S.; Qu, C.; Wang, X.; Zhang, H. Modulation of E-cadherin expression promotes migration ability of esophageal cancer cells. Sci. Rep. 2016, 6, 21713. [Google Scholar] [CrossRef]
- Lamouille, S.; Xu, J.; Derynck, R. Molecular mechanisms of epithelial-mesenchymal transition. Nat. Rev. Mol. Cell Biol. 2014, 15, 178–196. [Google Scholar] [CrossRef]
- Haraguchi, M.; Fukushige, T.; Kanekura, T.; Ozawa, M. E-cadherin loss in RMG-1cells inhibits cell migration and its regulation by Rho GTPases. Biochem. Biophys. Rep. 2019, 18, 100650. [Google Scholar] [CrossRef]
- Wang, M.; Liu, Y.; Qian, X.; Wei, N.; Tang, Y.; Yang, J. Downregulation of occludin affects the proliferation, apoptosis and metastatic properties of human lung carcinoma. Oncol. Rep. 2018, 40, 454–462. [Google Scholar] [CrossRef]
- Schneeberger, E.E.; Lynch, R.D. The tight junction: A multifunctional complex. Am. J. Physiol. Cell Physiol. 2004, 286, C1213–C1228. [Google Scholar] [CrossRef]
- Furuse, M.; Itoh, M.; Hirase, T.; Nagafuchi, A.; Yonemura, S.; Tsukita, S.; Tsukita, S. Direct association of occludin with ZO-1 and its possible involvement in the localization of occludin at tight junctions. J. Cell Biol. 1994, 127, 1617–1626. [Google Scholar] [CrossRef]
- Fanning, A.S.; Jameson, B.J.; Jesaitis, L.A.; Anderson, J.M. The tight junction protein ZO-1 establishes a link between the transmembrane protein occludin and the actin cytoskeleton. J. Biol. Chem. 1998, 273, 29745–29753. [Google Scholar] [CrossRef]
- Bazzoni, G.; Martinez-Estrada, O.M.; Orsenigo, F.; Cordenonsi, M.; Citi, S.; Dejana, E. Interaction of junctional adhesion molecule with the tight junction components ZO-1, cingulin, and occludin. J. Biol. Chem. 2000, 275, 20520–20526. [Google Scholar] [CrossRef]
- Itoh, M.; Sasaki, H.; Furuse, M.; Ozaki, H.; Kita, T.; Tsukita, S. Junctional adhesion molecule (JAM) binds to PAR-3: A possible mechanism for the recruitment of PAR-3 to tight junctions. J. Cell Biol. 2001, 154, 491–497. [Google Scholar] [CrossRef]
- Furuse, M.; Hirase, T.; Itoh, M.; Nagafuchi, A.; Yonemura, S.; Tsukita, S.; Tsukita, S. Occludin: A novel integral membrane protein localizing at tight junctions. J. Cell Biol. 1993, 123, 1777–1788. [Google Scholar] [CrossRef]
- Gumbiner, B.; Stevenson, B.; Grimaldi, A. The role of the cell adhesion molecule uvomorulin in the formation and maintenance of the epithelial junctional complex. J. Cell Biol. 1988, 107, 1575–1587. [Google Scholar] [CrossRef] [PubMed]
- Huo, L.; Wen, W.; Wang, R.; Kam, C.; Xia, J.; Feng, W.; Zhang, M. Cdc42-dependent formation of the ZO-1/MRCKbeta complex at the leading edge controls cell migration. EMBO J. 2011, 30, 665–678. [Google Scholar] [CrossRef] [PubMed]
- Cai, D.; Chen, S.C.; Prasad, M.; He, L.; Wang, X.; Choesmel-Cadamuro, V.; Sawyer, J.K.; Danuser, G.; Montell, D.J. Mechanical feedback through E-cadherin promotes direction sensing during collective cell migration. Cell 2014, 157, 1146–1159. [Google Scholar] [CrossRef] [PubMed]
- Kim, D.H.; Lu, Q.; Chen, Y.H. Claudin-7 modulates cell-matrix adhesion that controls cell migration, invasion and attachment of human HCC827 lung cancer cells. Oncol. Lett. 2019, 17, 2890–2896. [Google Scholar] [CrossRef]
- Smalley, K.S.; Brafford, P.; Haass, N.K.; Brandner, J.M.; Brown, E.; Herlyn, M. Up-regulated expression of zonula occludens protein-1 in human melanoma associates with N-cadherin and contributes to invasion and adhesion. Am. J. Pathol. 2005, 166, 1541–1554. [Google Scholar] [CrossRef]
- Mayor, R.; Etienne-Manneville, S. The front and rear of collective cell migration. Nat. Rev. Mol. Cell Biol. 2016, 17, 97–109. [Google Scholar] [CrossRef]
- Zhang, J.; Goliwas, K.F.; Wang, W.; Taufalele, P.V.; Bordeleau, F.; Reinhart-King, C.A. Energetic regulation of coordinated leader-follower dynamics during collective invasion of breast cancer cells. Proc. Natl. Acad. Sci. USA 2019, 116, 7867–7872. [Google Scholar] [CrossRef]
- Odenwald, M.A.; Choi, W.; Buckley, A.; Shashikanth, N.; Joseph, N.E.; Wang, Y.; Warren, M.H.; Buschmann, M.M.; Pavlyuk, R.; Hildebrand, J.; et al. ZO-1 interactions with F-actin and occludin direct epithelial polarization and single lumen specification in 3D culture. J. Cell Sci. 2017, 130, 243–259. [Google Scholar] [CrossRef]
- Belardi, B.; Hamkins-Indik, T.; Harris, A.R.; Kim, J.; Xu, K.; Fletcher, D.A. A Weak Link with Actin Organizes Tight Junctions to Control Epithelial Permeability. Dev. Cell 2020, 54, 792–804. [Google Scholar] [CrossRef]


Publisher’s Note: MDPI stays neutral with regard to jurisdictional claims in published maps and institutional affiliations. |
© 2021 by the authors. Licensee MDPI, Basel, Switzerland. This article is an open access article distributed under the terms and conditions of the Creative Commons Attribution (CC BY) license (https://creativecommons.org/licenses/by/4.0/).
Share and Cite
Park, S.-Y.; Jang, H.; Kim, S.-Y.; Kim, D.; Park, Y.; Kee, S.-H. Expression of E-Cadherin in Epithelial Cancer Cells Increases Cell Motility and Directionality through the Localization of ZO-1 during Collective Cell Migration. Bioengineering 2021, 8, 65. https://doi.org/10.3390/bioengineering8050065
Park S-Y, Jang H, Kim S-Y, Kim D, Park Y, Kee S-H. Expression of E-Cadherin in Epithelial Cancer Cells Increases Cell Motility and Directionality through the Localization of ZO-1 during Collective Cell Migration. Bioengineering. 2021; 8(5):65. https://doi.org/10.3390/bioengineering8050065
Chicago/Turabian StylePark, Song-Yi, Hwanseok Jang, Seon-Young Kim, Dasarang Kim, Yongdoo Park, and Sun-Ho Kee. 2021. "Expression of E-Cadherin in Epithelial Cancer Cells Increases Cell Motility and Directionality through the Localization of ZO-1 during Collective Cell Migration" Bioengineering 8, no. 5: 65. https://doi.org/10.3390/bioengineering8050065
APA StylePark, S.-Y., Jang, H., Kim, S.-Y., Kim, D., Park, Y., & Kee, S.-H. (2021). Expression of E-Cadherin in Epithelial Cancer Cells Increases Cell Motility and Directionality through the Localization of ZO-1 during Collective Cell Migration. Bioengineering, 8(5), 65. https://doi.org/10.3390/bioengineering8050065