The Goldilocks Approach: A Review of Employing Design of Experiments in Prokaryotic Recombinant Protein Production


Abstract
1. Introduction
2. Production of Recombinant Proteins in a Prokaryotic Expression System
2.1. Factors that Inform the Choice of Expression System
2.2. Factors that Influence Media Composition and Culture Conditions in an Expression System
2.3. Enhancing the Production of Recombinant Proteins in a Prokaryotic Expression System by DoE
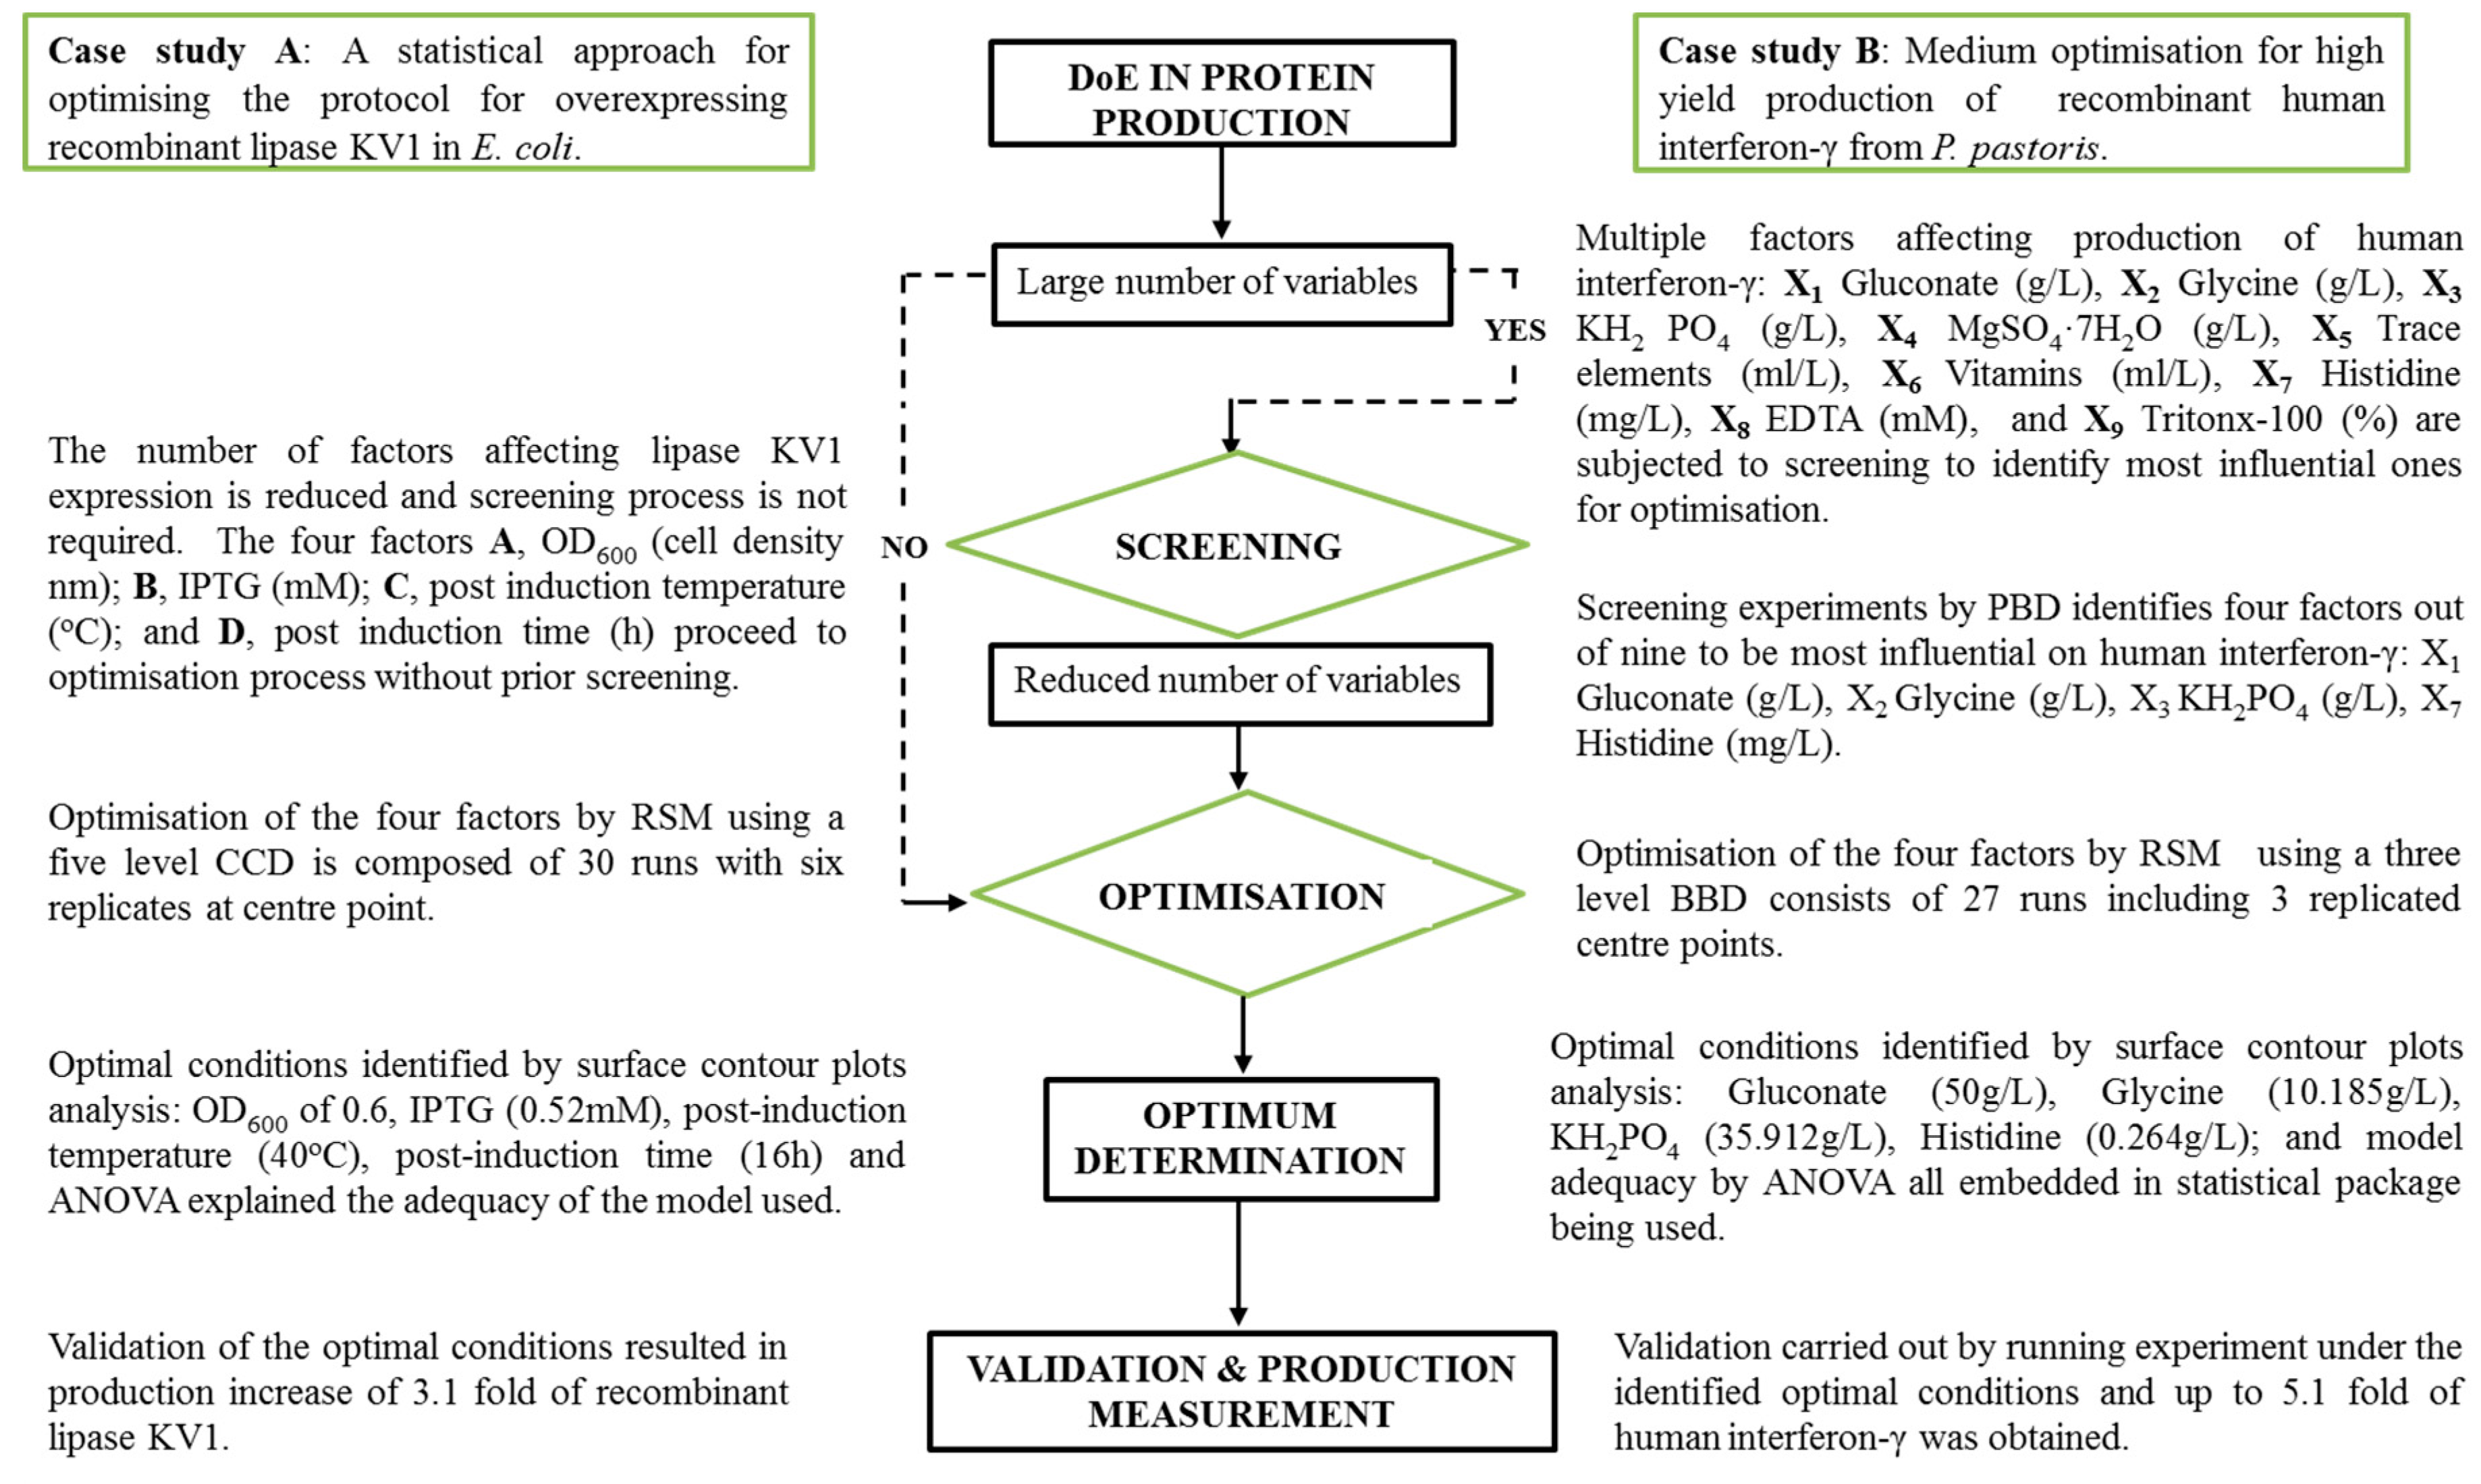
- Stage 1. The first stage of the process is to compile a list of factors that can influence protein expression. These are usually such factors as; induction temperature, induction duration, pH, media components (carbon source, nitrogen source, micronutrients).
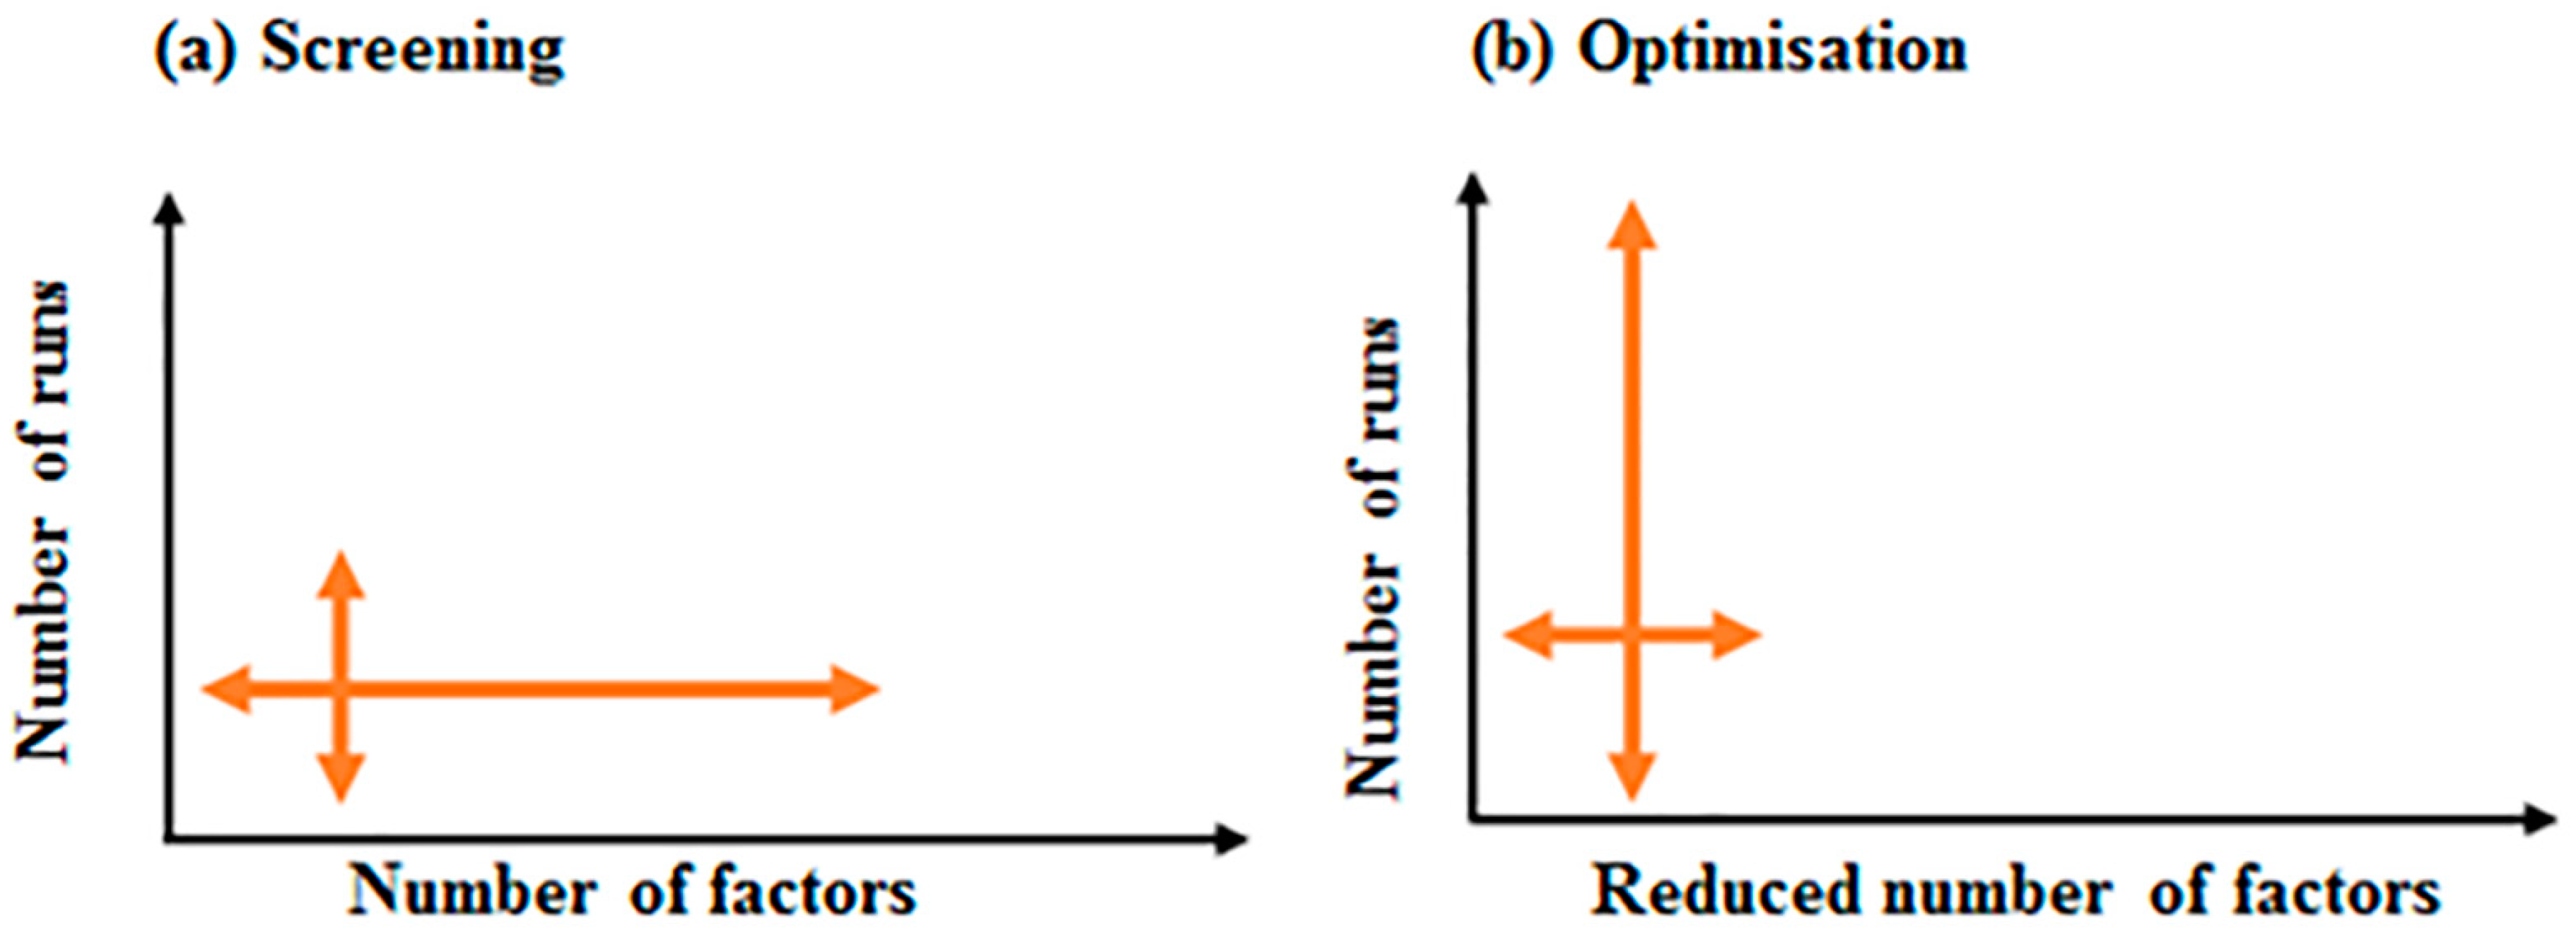
- Stage 2. At this stage, a suitable software package such as MINITAB, JMP or Design Experts will be acquired for the statistical analysis. The second stage of DoE aims to reduce the number of factors to a smaller subset, these being the most important factors (i.e. those with the greatest impact on expression). This process is known as screening. Having a smaller set of significant factors greatly simplifies the statistical process. Sometimes, if the number of factors is small (between 2 and 4) there is no need to carry out the screening stage. When looking at a factor that influences protein expression the concept of levels is important: temperature, for example, may be examined between 20 °C and 40 °C. These two temperatures represent the lowest and highest “level” of this parameter that will influence expression. For the purposes of modelling these two levels are input into the model for this factor. Similarly, the upper and lower levels are input for all other relevant parameters. It is important to note that the levels are input into the DoE package as +1 (highest value of a parameter) and −1 (lowest value of a parameter). This “coding” is carried out to avoid the use of multiple different measurement units for parameters such as pH, temperature. The software will then suggest a minimal set of experiments to explore the significance of each factor. The design of the experimental matrix can be selected from a range of choices such as Full Factorial Design, Plackett Burman Design or indeed a custom design. The objective is to assess the “main effect” of a factor (its direct effect on a response) as well as its “interaction effects” (the effect on other factors). The suggested experiments are carried out and the results are used to inform the next stage of the process—optimisation.
- Stage 3. The final stage of the process is optimisation and is typically carried out with a set of three to four factors. An experimental RSM (Response Surface Methodology) design strategy is selected and experiments are run as for the screening stage. The optimisation process expresses the response surface as a polynomial and uses the input data to estimate its coefficients. The derivative of this polynomial is used to obtain inflection points corresponding to maxima or minima in the model. The model can be evaluated by looking at the goodness of fit between the model and experimental data. Finally, experiments using the optimum conditions predicted by the model are carried out to validate the model.
3. Design of Experiments (DoE) to Optimise Recombinant Protein Production
3.1. DoE; a Brief Overview
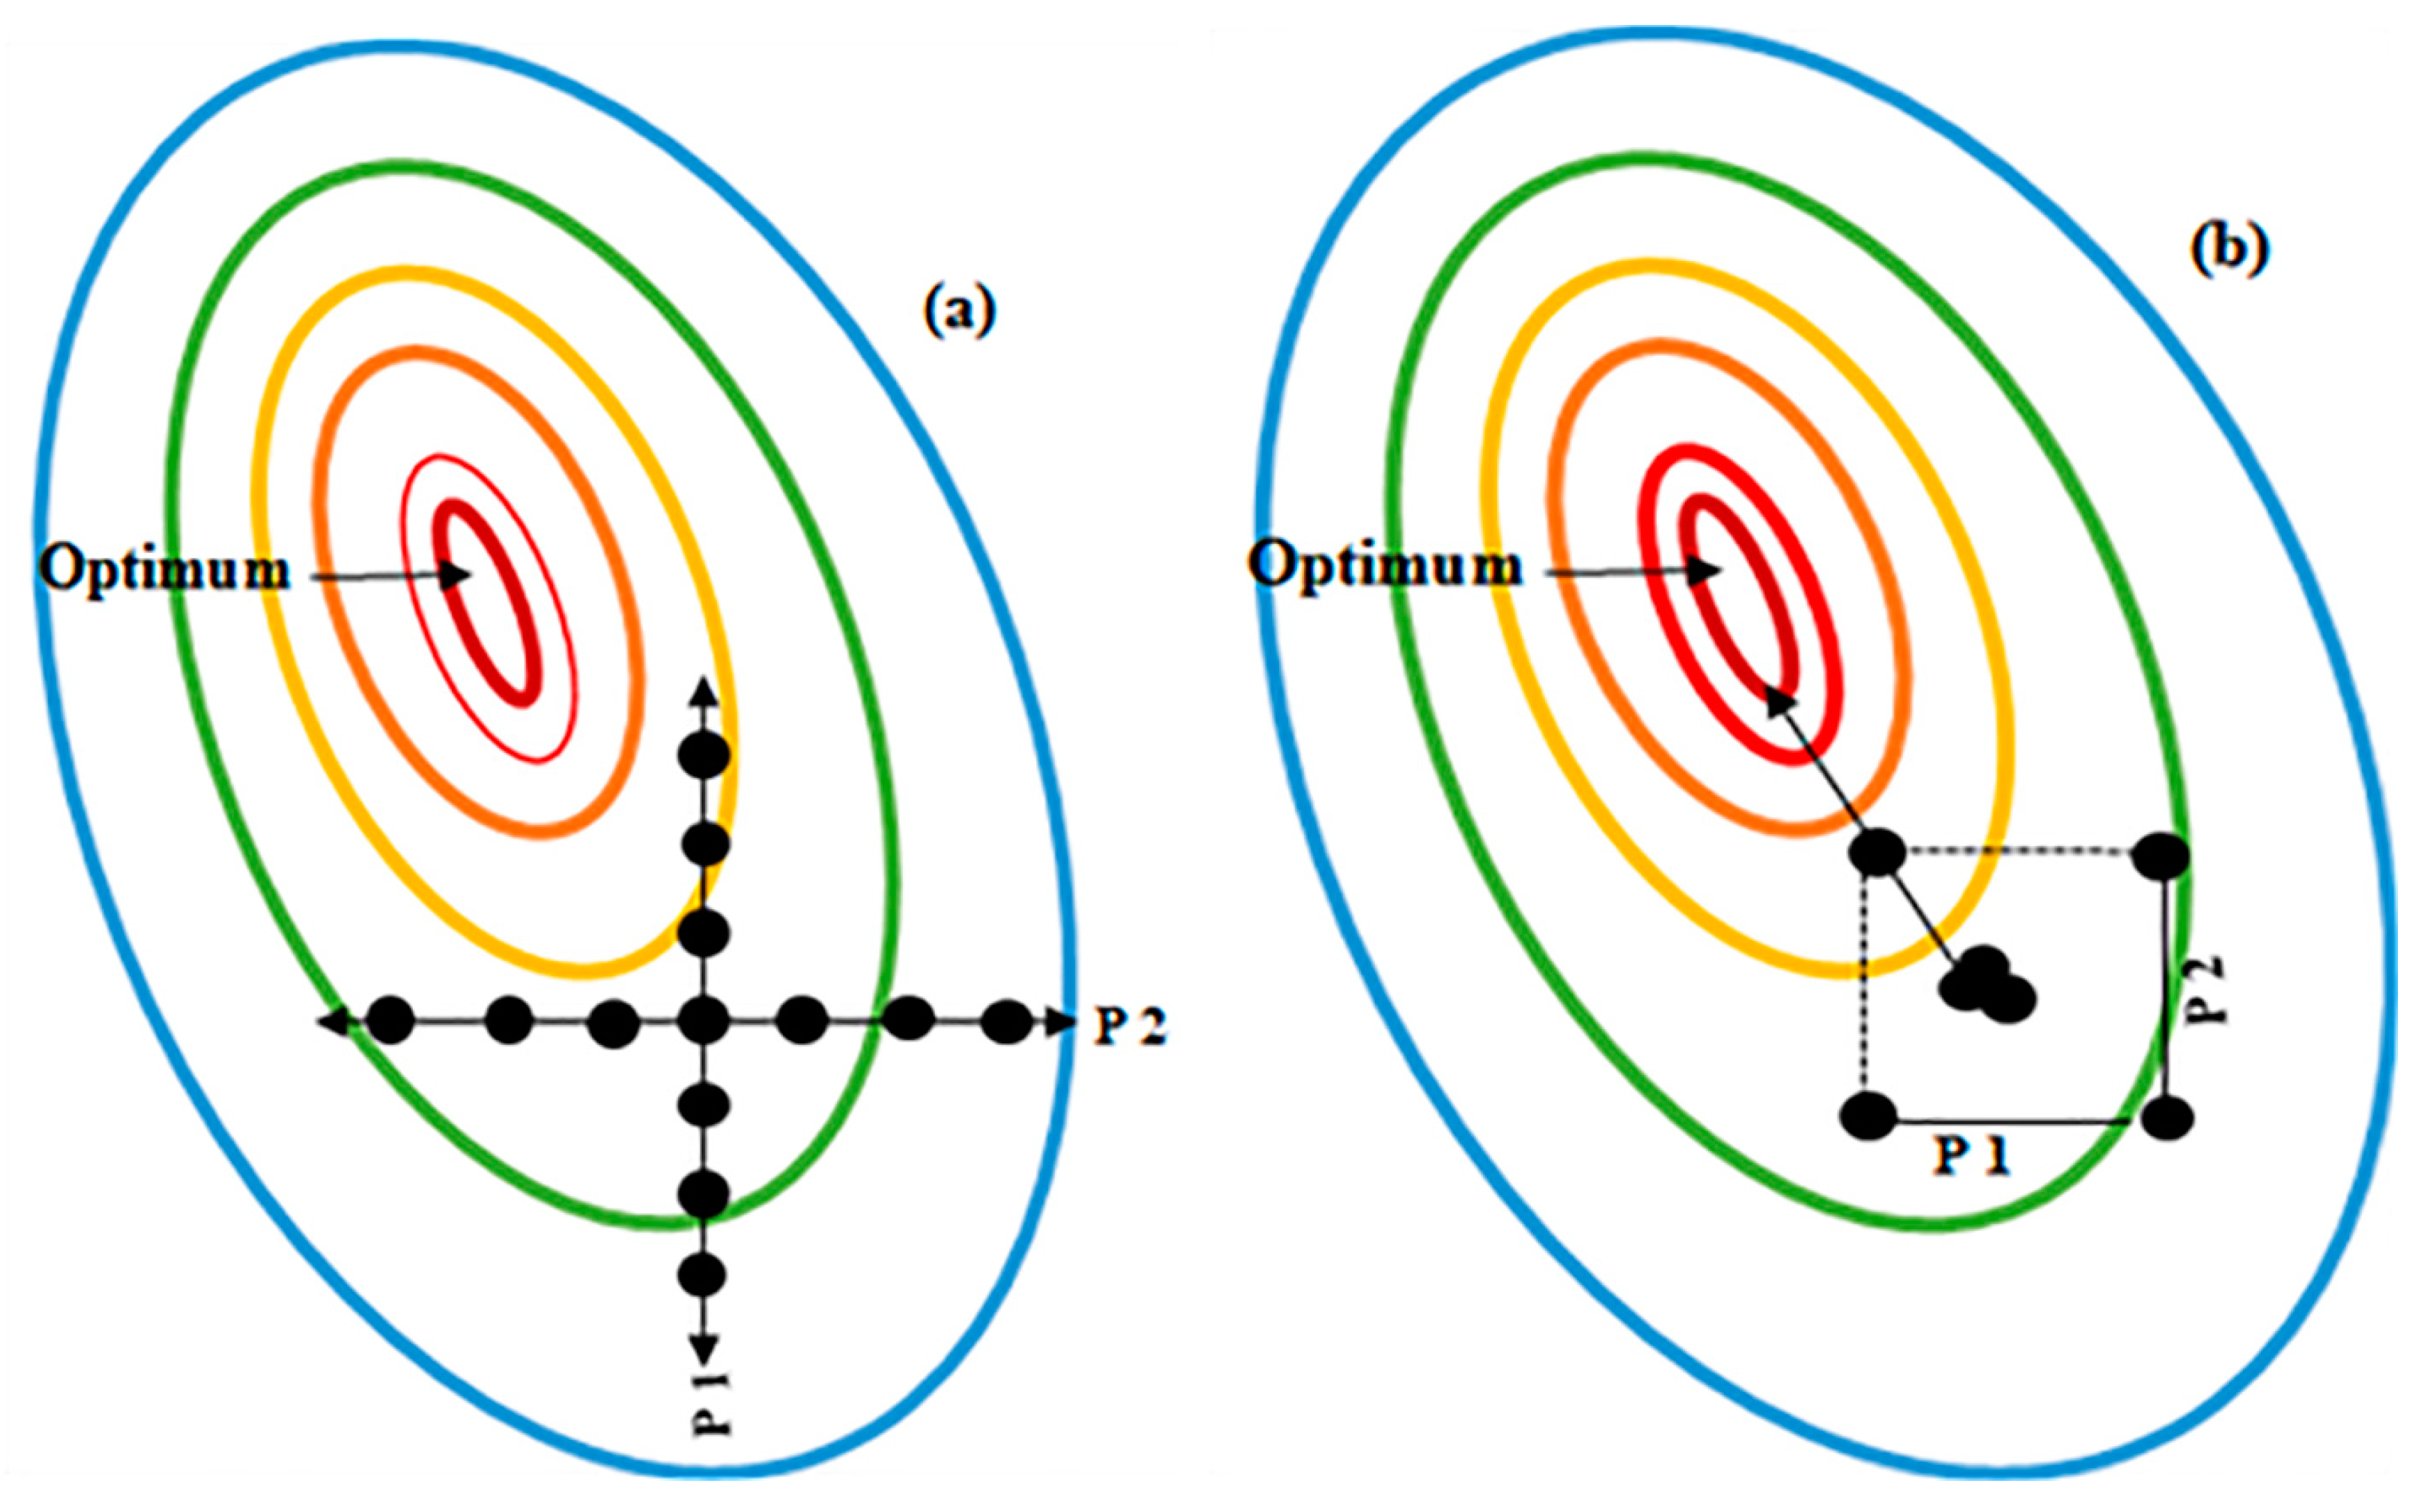
3.2. DoE Versus One-Factor-At-a-Time (OFAT)
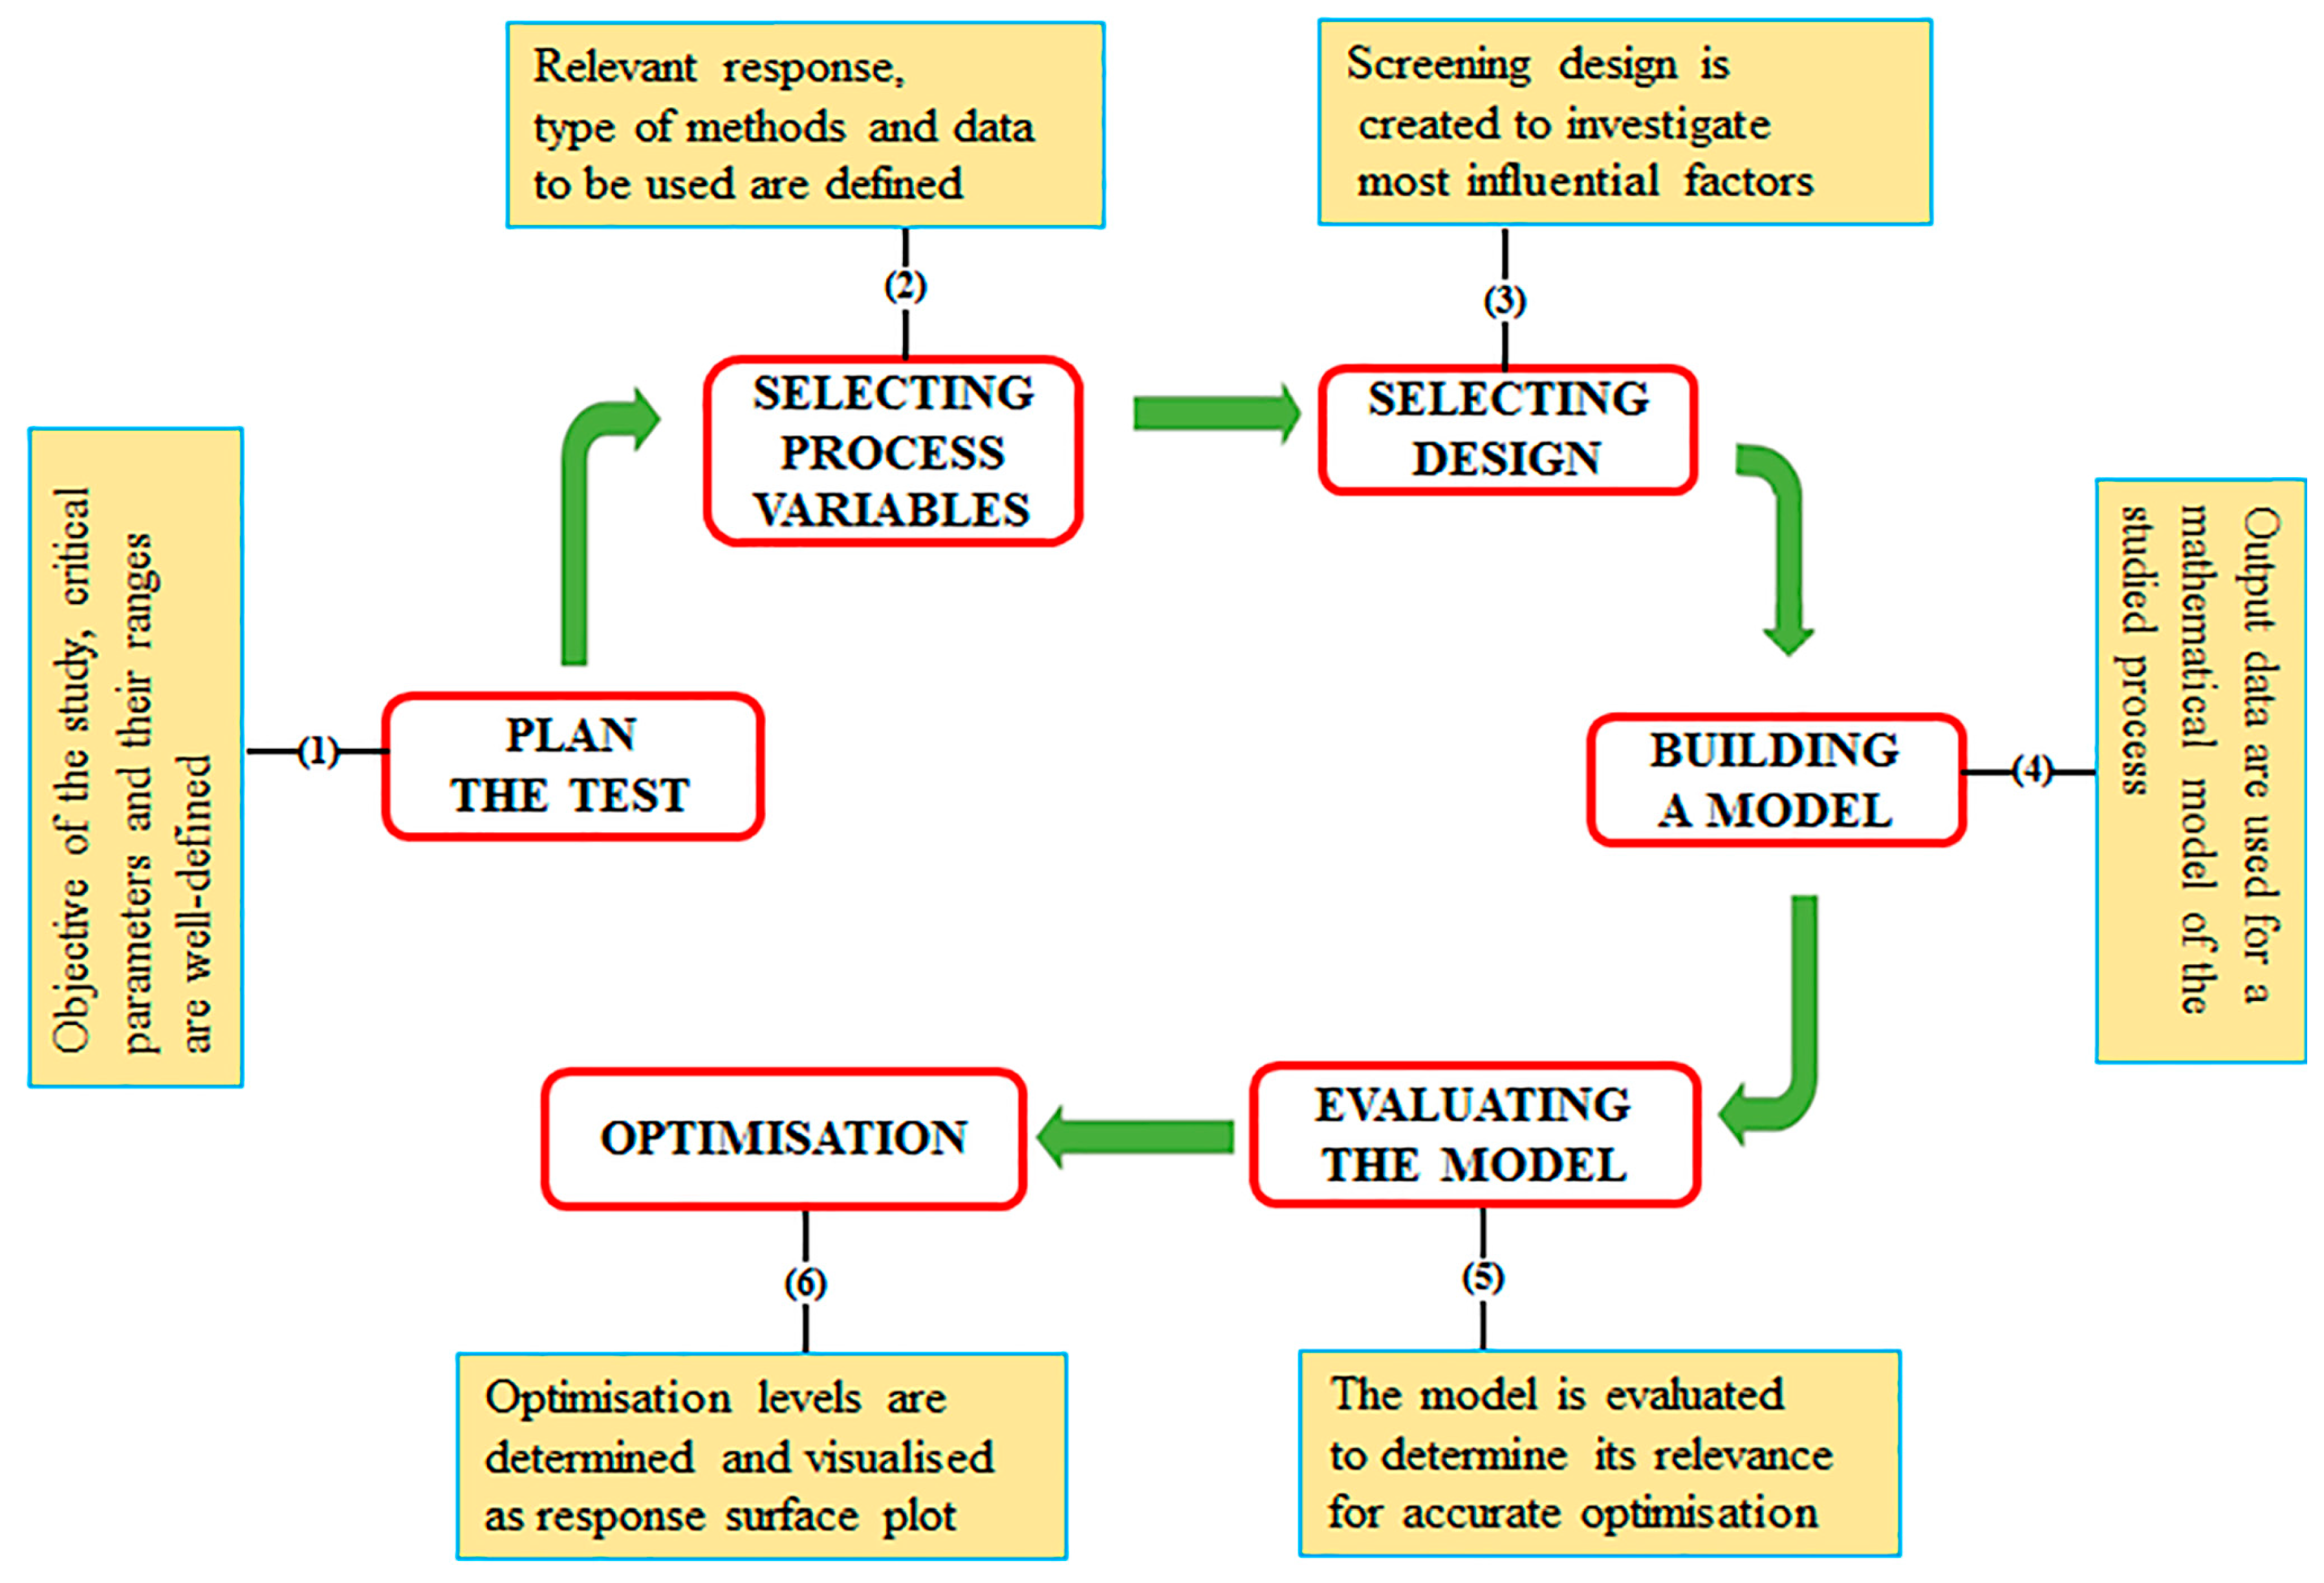
4. Defining a DoE Workflow to Optimise Recombinant Protein Production
5. A Suggested DoE Workflow for Recombinant Protein Production
5.1. Planning the Test; Selection of Factors and Associated Levels Influencing Recombinant Protein Production
5.2. Screening Designs to Identify Factors that Significantly Affect Recombinant Protein Expression
5.2.1. Full Factorial Design
5.2.2. Fractional Factorial Design (FFD)
5.2.3. Plackett-Burman Designs (PBD)
5.2.4. Definitive Screening Design (DSD) and Custom Design (CD)
5.3. Optimisation Designs to Maximise Recombinant Protein Production in Prokaryotic Systems
5.3.1. Central Composite Design (CCD)
5.3.2. Box Behnken Design (BBD)
5.3.3. Summary and Choice of Optimisation Methods
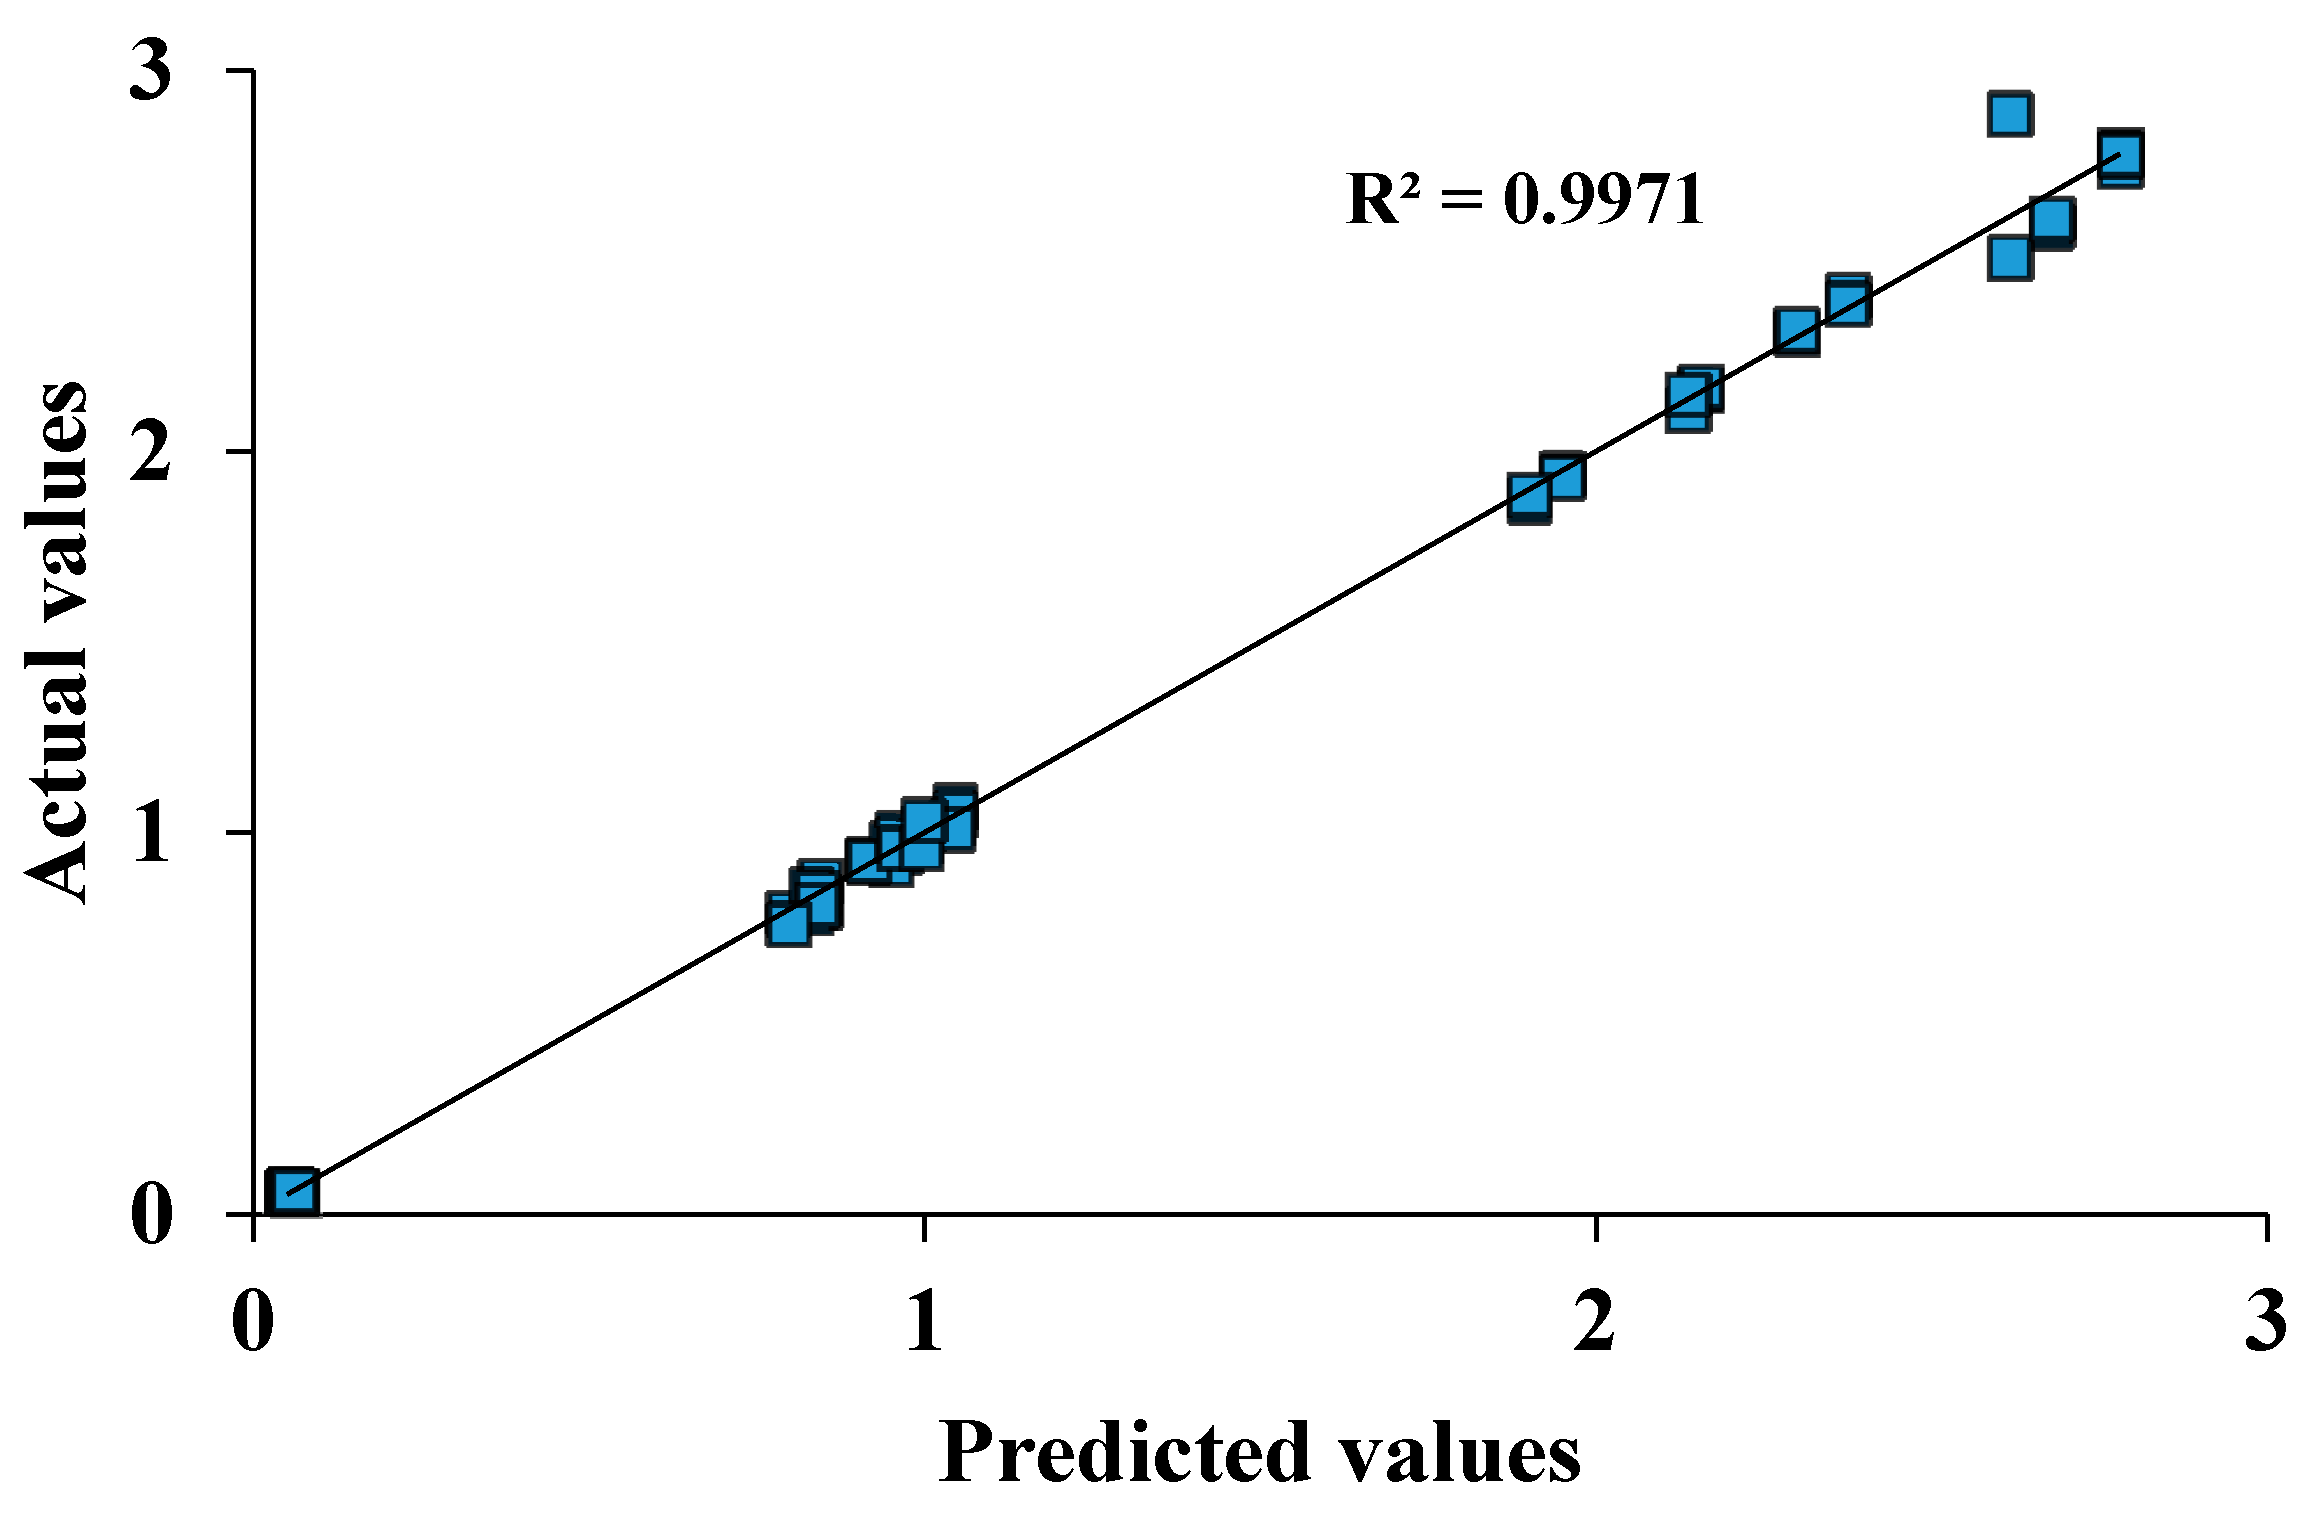
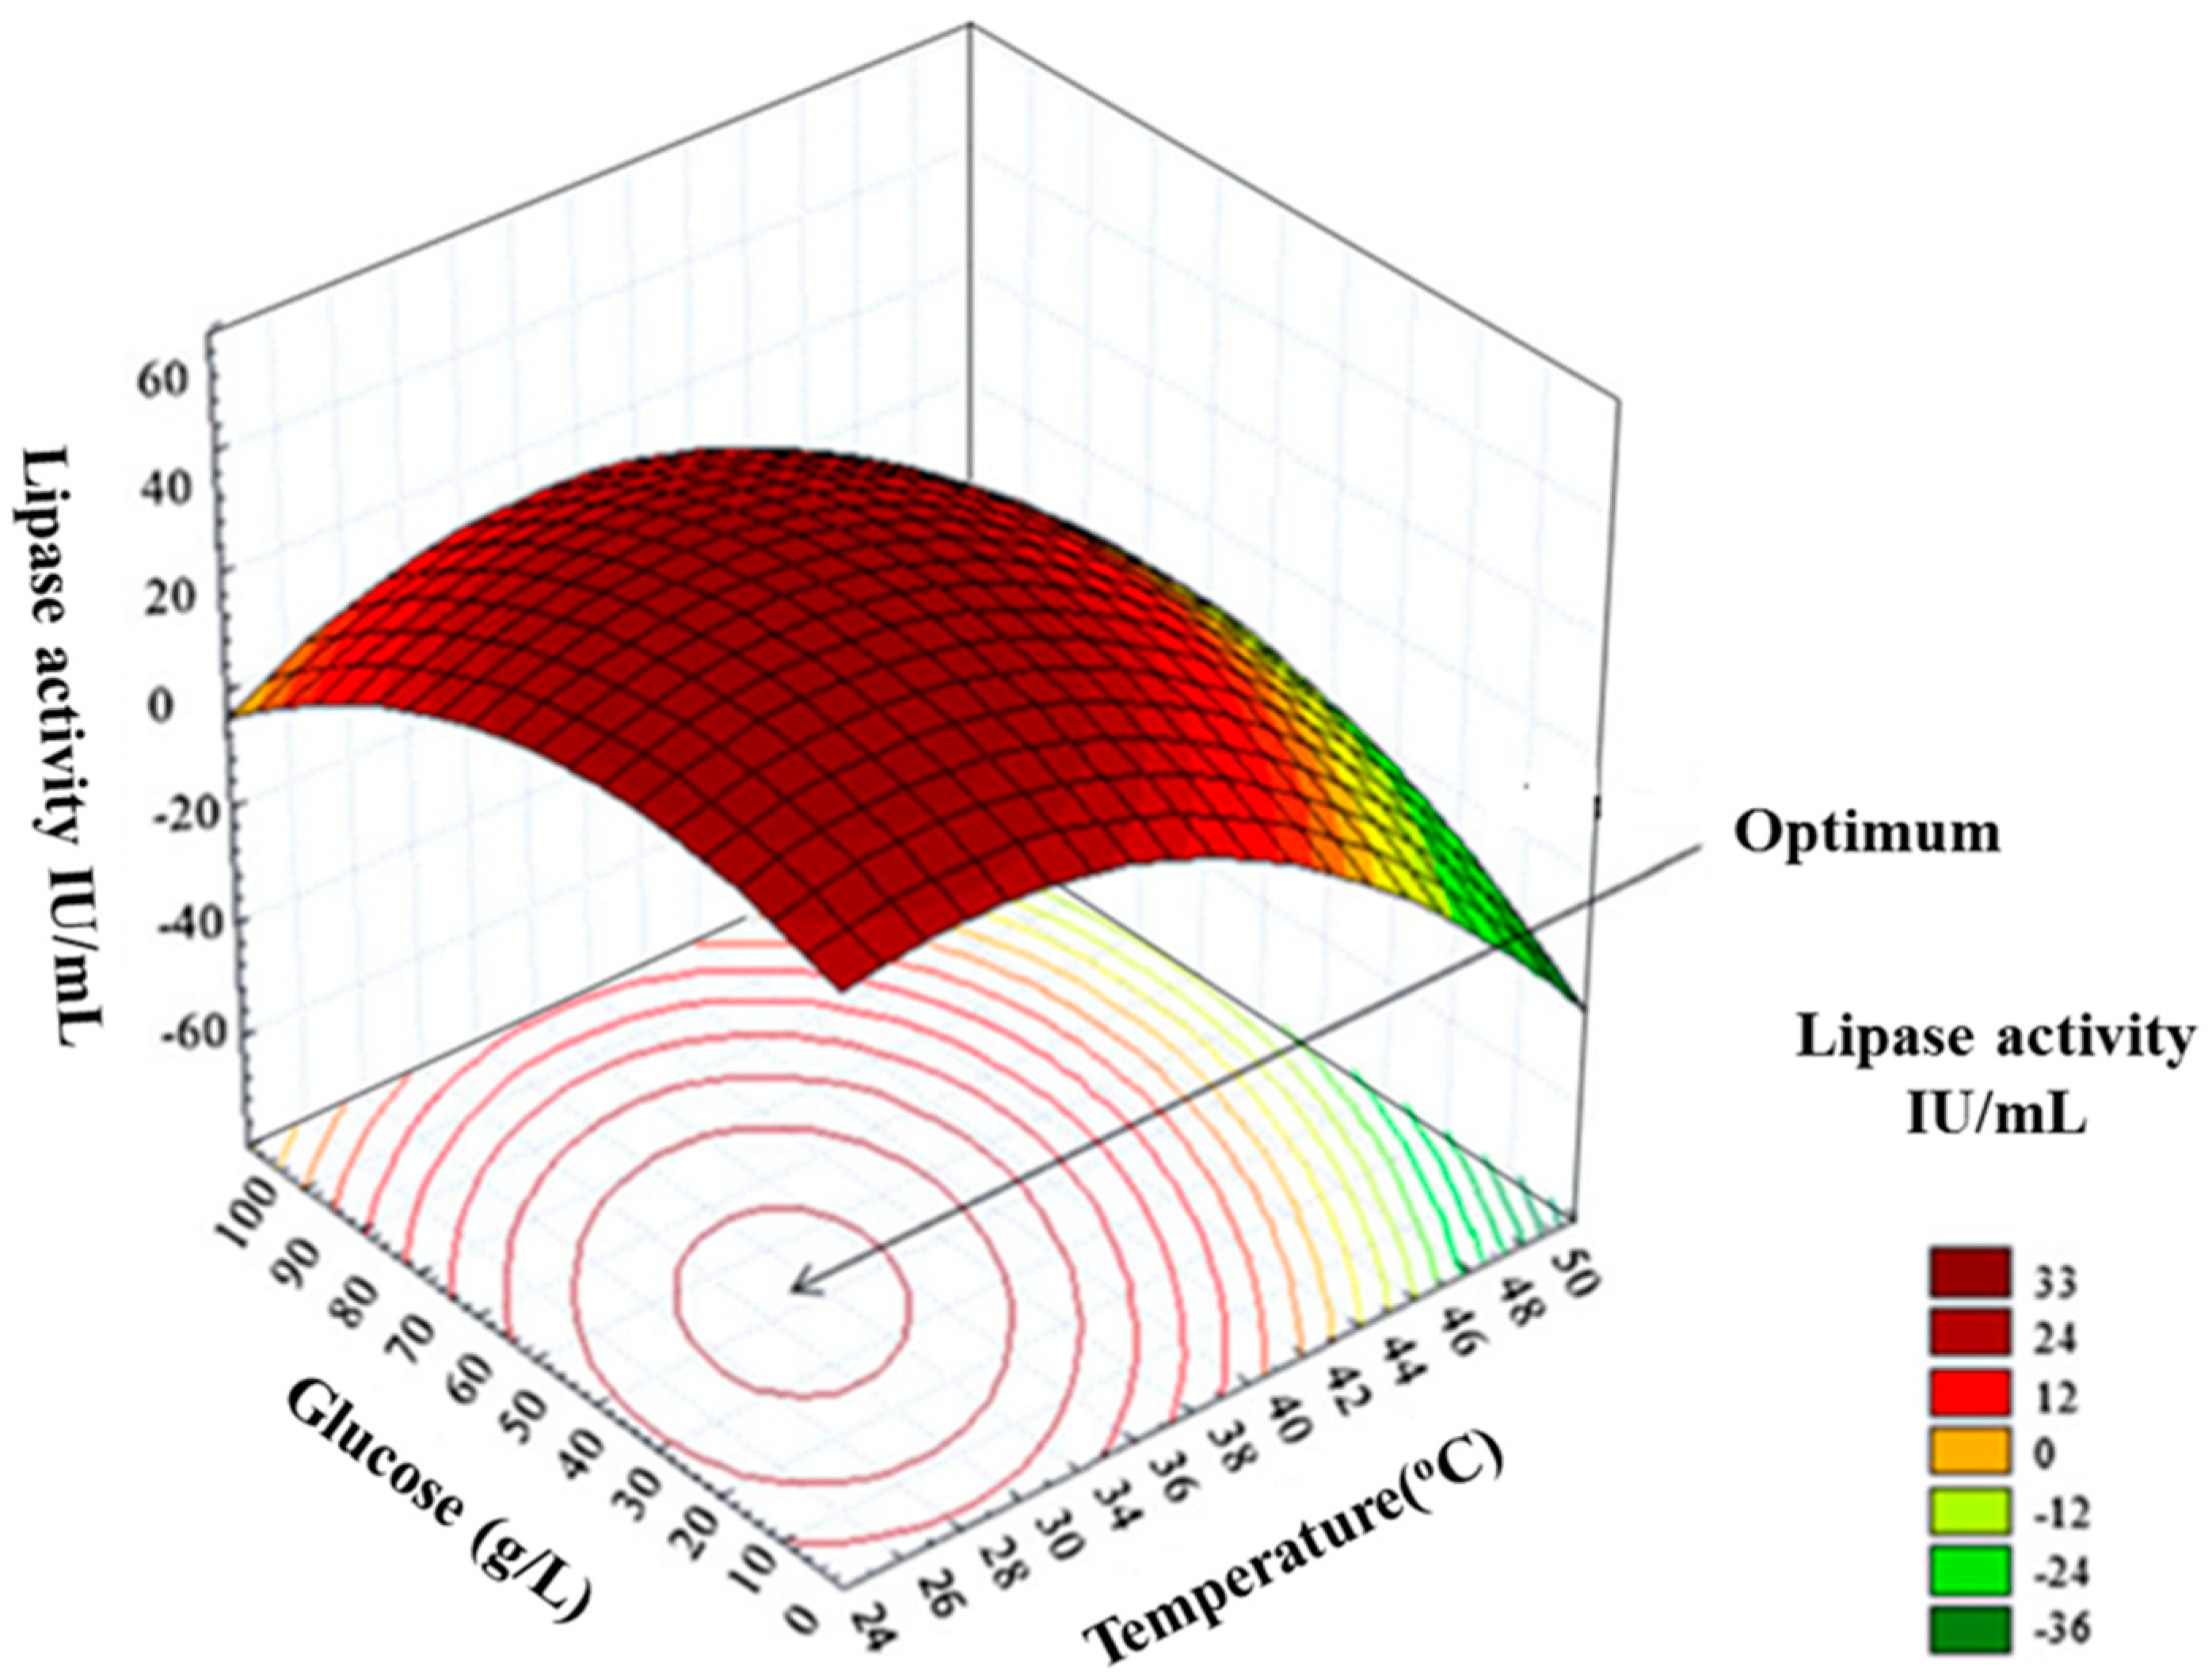
5.4. Analysis and Interpretation of Optimisation Data
Evaluation of Experimental Design and Predictive Model Validation
5.5. Optimum Determination
6. Conclusions; Getting It ‘Just Right’
Author Contributions
Funding
Conflicts of Interest
References
- Adrio, J.L.; Demain, A.L. Recombinant organisms for production of industrial products. Bioeng. Bugs 2010, 1, 116–131. [Google Scholar] [CrossRef] [PubMed]
- Mitragotri, S.; Burke, P.A.; Langer, R. Overcoming the challenges in administering biopharmaceuticals: Formulation and delivery strategies. Nat. Rev. Drug Discov. 2014, 13, 655–672. [Google Scholar] [CrossRef] [PubMed]
- Manning, M.C.; Chou, D.K.; Murphy, B.M.; Payne, R.W.; Katayama, D.S. Stability of protein pharmaceuticals: An update. Pharm. Res. 2010, 27, 544–575. [Google Scholar] [CrossRef] [PubMed]
- Ferrer-miralles, N.; Villaverde, A. Bacterial Cell Factories for Recombinant Protein Production; expanding the catalogue. Microb. Cell Fac. 2013, 12, 133. [Google Scholar] [CrossRef] [PubMed]
- Papaneophytou, C.; Kontopidis, G.A. Optimization of TNF-α overexpression in Escherichia coli using response surface methodology: Purification of the protein and oligomerization studies. Protein Expr. Purif. 2012, 86, 35–44. [Google Scholar] [CrossRef] [PubMed]
- Marini, G.; Luchese, M.D.; Argondizzo, A.P.C.; de Góes, A.M.; Galler, R.; Alves, T.L.M. Experimental design approach in recombinant protein expression: Determining medium composition and induction conditions for expression of pneumolysin from Streptococcus pneumoniae in Escherichia coli and preliminary purification process. BMC Biotechnol. 2014, 14, 1. [Google Scholar] [CrossRef] [PubMed]
- Rosano, G.L.; Ceccarelli, E.A. Recombinant protein expression in Escherichia coli: Advances and challenges. Front. Microbiol. 2014, 5, 1–17. [Google Scholar] [CrossRef] [PubMed]
- Fakruddin, M.; Mohammad Mazumdar, R.; Bin Mannan, K.S.; Chowdhury, A.; Hossain, M.N. Critical Factors Affecting the Success of Cloning, Expression, and Mass Production of Enzymes by Recombinant E. coli. ISRN Biotechnol. 2013, 3, 1–7. [Google Scholar] [CrossRef] [PubMed]
- Lambertz, C.; Garvey, M.; Klinger, J.; Heesel, D.; Klose, H.; Fischer, R. Challenges and advances in the heterologous expression of cellulolytic enzymes: A review. Biotechnol. Biofuels 2014, 7, 1–15. [Google Scholar] [CrossRef] [PubMed]
- Choi, J.H.; Keum, K.C.; Lee, S.Y. Production of recombinant proteins by high cell density culture of Escherichia coli. Chem. Eng. Sci. 2006, 61, 876–885. [Google Scholar] [CrossRef]
- Berlec, A.; Štrukelj, B. Current state and recent advances in biopharmaceutical production in Escherichia coli, yeasts and mammalian cells. J. Ind. Microbiol. Biotechnol. 2013, 40, 257–274. [Google Scholar] [CrossRef] [PubMed]
- Yang, Z.; Zhang, L.; Zhang, Y.; Zhang, T.; Feng, Y.; Lu, X. Highly efficient production of soluble proteins from insoluble inclusion bodies by a Two-Step-Denaturing and refolding method. PLoS ONE 2011, 6, 1–9. [Google Scholar] [CrossRef] [PubMed]
- Sørensen, H.P.; Mortensen, K.K. Soluble expression of recombinant proteins in the cytoplasm of Escherichia coli. Microb. Cell Fact. 2005, 8, 1–8. [Google Scholar] [CrossRef] [PubMed]
- Papaneophytou, C.P.; Kontopidis, G. Statistical approaches to maximize recombinant protein expression in Escherichia coli: A general review. Protein Expr. Purif. 2014, 94, 22–32. [Google Scholar] [CrossRef] [PubMed]
- Makino, T.; Skretas, G.; Georgiou, G. Strain engineering for improved expression of recombinant proteins in bacteria. Microb. Cell. Fact. 2011, 10, 32. [Google Scholar] [CrossRef] [PubMed]
- Jiang, S.; Liu, M.; Wang, B.; Jiang, K.; Wang, L. Statistical optimization of medium composition and culture condition for the production of recombinant anti-lipopolysaccharide factor of Eriocheir sinensis in Escherichia coli. Chin. J. Oceanol. Limnol. 2011, 29, 1249–1259. [Google Scholar] [CrossRef]
- Xu, Y.; Li, Y.; Xu, S.; Liu, Y.; Wang, X.; Tang, J. Improvement of xylanase production by Aspergillus niger XY-1 using response surface methodology for optimizing the medium composition. J. Zhejiang Univ. Sci. B 2008, 9, 558–566. [Google Scholar] [CrossRef] [PubMed]
- Shafiee, F.; Rabbani, M.; Jahanian-Najafabadi, A. Optimization of the Expression of DT386-BR2 Fusion Protein in Escherichia coli using Response Surface Methodology. Adv. Biomed. Res. 2017, 6, 22. [Google Scholar] [CrossRef] [PubMed]
- Akbarzadeh, A.; Dehnavi, E.; Aghaeepoor, M.; Amani, J. Optimization of recombinant expression of synthetic bacterial phytase in Pichia pastoris using response surface methodology. Jundishapur J. Microbiol. 2015, 8, e27553. [Google Scholar] [CrossRef] [PubMed]
- Maharjan, S.; Singh, B.; Bok, J.D.; Kim, J.I.; Jiang, T.; Cho, C.S. Exploring codon optimization and response surface methodology to express biologically active transmembrane RANKL in E. Coli. PLoS ONE 2014, 9, e96259. [Google Scholar] [CrossRef] [PubMed]
- Larentis, A.L.; Nicolau, J.F.M.Q.; Esteves, G.D.S.; Vareschini, D.T.; de Almeida, F.V.R.; dos Reis, M.G. Evaluation of pre-induction temperature, cell growth at induction and IPTG concentration on the expression of a leptospiral protein in E. coli using shaking flasks and microbioreactor. BMC Res. Notes 2014, 7, 671. [Google Scholar] [CrossRef] [PubMed]
- Beigi, L.; Karbalaei-Heidari, H.R.; Kharrati-Kopaei, M. Optimization of an extracellular zinc-metalloprotease (SVP2) expression in Escherichia coli BL21 (DE3) using response surface methodology. Protein Expr. Purif. 2012, 84, 161–166. [Google Scholar] [CrossRef] [PubMed]
- Chen, Q.; Ruan, H.; Zhang, H.; Ni, H.; He, G. Enhanced production of elastase by Bacillus licheniformis ZJUEL31410: Optimization of cultivation conditions using response surface methodology. J. Zhejiang Univ. Sci. B 2007, 8, 845–852. [Google Scholar] [CrossRef] [PubMed]
- Zhou, W.W.; He, Y.L.; Niu, T.G.; Zhong, J.J. Optimization of fermentation conditions for production of anti-TMV extracellular ribonuclease by Bacillus cereus using response surface methodology. Bioprocess Biosyst. Eng. 2010, 33, 657–663. [Google Scholar] [CrossRef] [PubMed]
- Zhou, Y.; Sun, Y.B.; He, H.W.; Feng, J.T.; Zhang, X.; Han, L.R. Optimization of medium compositions to improve a novel glycoprotein production by Streptomyces kanasenisi ZX01. AMB Express 2017, 7, 6. [Google Scholar] [CrossRef] [PubMed]
- Altekar, M.; Homon, C.A.; Kashem, M.; Mason, S.W.; Nelson, R.M.; Patnaude, L.A. Assay Optimization: A Statistical Design of Experiments Approach. Clin. Lab. Med. 2007, 27, 139–154. [Google Scholar] [CrossRef] [PubMed]
- Samaei-Nouroozi, A.; Rezaei, S.; Khoshnevis, N.; Doosti, M.; Hajihoseini, R.; Khoshayand, M.R. Medium-based optimization of an organic solvent-tolerant extracellular lipase from the isolated halophilic Alkalibacillus Salilacus. Extremophiles 2015, 19, 933–947. [Google Scholar] [CrossRef] [PubMed]
- Gangadharan, D.; Sivaramakrishnan, S.; Nampoothiri, K.M.; Sukumaran, R.K.; Pandey, A. Response surface methodology for the optimization of alpha amylase production by Bacillus Amyloliquefaciens. Bioresour. Technol. 2008, 99, 4597–4602. [Google Scholar] [CrossRef] [PubMed]
- Setiawan, D.; Fadhlillah, M.; Pertiwi, W.; Gaffar, S.; Subroto, T. Optimization of The Expression of Recombinant Universal Infleunza vaccine Candidate in Escherichia coli Using Response Surface Methodology. IOSR J. Pharm. 2018, 8, 53–60. [Google Scholar]
- Demain, A.L.; Vaishnav, P. Production of Recombinant Proteins by Microbes and Higher Organisms. Biotechnol. Adv. 2009, 27, 297–306. [Google Scholar] [CrossRef] [PubMed]
- Kim, Y.; Babnigg, G.; Jedrzejczak, R.; Eschenfeldt, W.H.; Li, H.; Maltseva, N. High-throughput protein purification and quality assessment for crystallization. Methods 2011, 55, 12–28. [Google Scholar] [CrossRef] [PubMed]
- Mondal, S.; Shet, D. High yield expression of proteins in E. coli for NMR studies. Adv. Biosci. 2013, 4, 751–767. [Google Scholar] [CrossRef]
- Li, S.; Yang, X.; Yang, S.; Zhu, M.; Wang, X. Technology Prospecting on Enzymes: Application, Marketing and Engineering Abstract: Enzymes are protein molecules functioning as specialized catalysts for chemical reactions. They have contributed greatly to the traditional and modern chemical industr. Comput. Struct. Biotechnol. J. 2012, 2, e201209017. [Google Scholar] [CrossRef] [PubMed]
- Dubey, A.A.; Singh, M.I.; Jain, V. Rapid and Robust PCR-Based All-Recombinant Cloning Methodology. PLoS ONE 2016, 11, 1–11. [Google Scholar] [CrossRef] [PubMed]
- Barnes, H.; Arlotto, M.P.; Waterman, M.R. Expression and enzymatic activity of recombinant cytochrome P450 17 alpha-hydroxylase in Escherichia coli. Proc. Natl. Acad. Sci. USA 1991, 88, 5597–5601. [Google Scholar] [CrossRef] [PubMed]
- Han, M.; Yu, X. Enhanced expression of heterologous proteins in yeast cells via the modification of N-glycosylation sites. Bioengineered 2015, 6, 115–118. [Google Scholar] [CrossRef] [PubMed]
- Araki, Y.; Hamafuji, T.; Noguchi, C.; Shimizu, N. Efficient recombinant production in mammalian cells using a novel IR/MAR gene amplification method. PLoS ONE 2012, 7, 1–10. [Google Scholar] [CrossRef] [PubMed]
- Durocher, Y. High-level and high-throughput recombinant protein production by transient transfection of suspension-growing human 293-EBNA1 cells. Nucleic Acids Res. 2002, 30, 1–11. [Google Scholar] [CrossRef]
- Zimran, A.; Brill-almon, E.; Chertkoff, R.; Petakov, M.; Blanco-favela, F.; Muñoz, T.; Solorio-Meza, S.E.; Amato, D.; Duran, G.; Giona, F.; et al. Pivotal trial with plant cell-expressed recombinant glucocerebrosidase, taliglucerase alfa, a novel enzyme replacement therapy for Gaucher disease. Blood 2011, 118, 5767–5773. [Google Scholar] [CrossRef] [PubMed]
- Bleckmann, M.; Schmelz, S.; Schinkowski, C.; Scrima, A.; van den Heuvel, J. Fast plasmid based protein expression analysis in insect cells using an automated SplitGFP screen. Biotechnol. Bioeng. 2016, 113, 1975–1983. [Google Scholar] [CrossRef] [PubMed]
- Khow, O.; Suntrarachun, S. Strategies for production of active eukaryotic proteins in bacterial expression system. Asian Pac. J. Trop. Biomed. 2012, 2, 159–162. [Google Scholar] [CrossRef]
- Tanimura, K.; Takashima, S.; Matsumoto, T.; Tanaka, T.; Kondo, A. 2,3-Butanediol production from cellobiose using exogenous beta-glucosidase-expressing Bacillus Subtilis. Appl. Microbiol. Biotechnol. 2016, 100, 5781–5789. [Google Scholar] [CrossRef] [PubMed]
- Fontani, S.; Niccolai, A.; Kapat, A.; Olivieri, R. Studies on the maximization of recombinant Helicobacter pylori neutrophil-activating protein production in Escherichia coli: Application of Taguchi robust design and response surface methodology for process optimization. World J. Microbiol. Biotechnol. 2003, 19, 711–717. [Google Scholar] [CrossRef]
- Adrio, J.L.; Demain, A.L. Microbial enzymes: Tools for biotechnological processes. Biomolecules 2014, 4, 117–139. [Google Scholar] [CrossRef] [PubMed]
- Gopal, G.J.; Kumar, A. Strategies for the production of recombinant protein in Escherichia coli. Protein J. 2013, 32, 419–425. [Google Scholar] [CrossRef] [PubMed]
- Gurung, P.; Lukens, J.R.; Kanneganti, T. Overview of the puification of recombinant proteins. HHS Public Access 2016, 3, 193–201. [Google Scholar]
- El-Helow, E.R.; Abdel-Fattah, Y.R.; Ghanem, K.M.; Mohamad, E. Application of the response surface methodology for optimizing the activity of an aprE-driven gene expression system in Bacillus Subtilis. Appl. Microbiol. Biotechnol. 2000, 54, 515–520. [Google Scholar] [CrossRef] [PubMed]
- Li, R.F.; Wang, B.; Liu, S.; Chen, S.H.; Yu, G.H.; Yang, S.Y. Optimization of the Expression Conditions of CGA-N46 in Bacillus subtilis DB1342(p-3N46) by Response Surface Methodology. Interdiscip. Sci. Comput. Life Sci. 2016, 8, 277–283. [Google Scholar] [CrossRef] [PubMed]
- Mohammadi, H.S.; Mostafavi, S.S.; Soleimanib, S.; Bozorgian, S.; Pooraskari, M.; Kianmehr, A. Response surface methodology to optimize partition and purification of two recombinant oxidoreductase enzymes, glucose dehydrogenase and D-galactose dehydrogenase in aqueous two-phase systems. Protein Expr. Purif. 2015, 108, 41–47. [Google Scholar] [CrossRef] [PubMed]
- Murashima, K.; Chen, C.; Kosugi, A.; Tamaru, Y.; Doi, R.H.; Wong, S. Heterologous Production of Clostridium cellulovorans engB, Using Protease-Deficient Bacillus subtilis, and Preparation of Active Recombinant Cellulosomes. J. Bacteriol. 2002, 184, 76–81. [Google Scholar] [CrossRef] [PubMed]
- Berrow, N.S.; Büssow, K.; Coutard, B.; Diprose, J.; Ekberg, M.; Folkers, G.E. Recombinant protein expression and solubility screening in Escherichia coli: A comparative study. Acta Crystallogr. Sect. D Biol. Crystallogr. 2006, 62, 1218–1226. [Google Scholar] [CrossRef] [PubMed]
- de Marco, A. Strategies for successful recombinant expression of disulfide bond-dependent proteins in Escherichia coli. Microb. Cell Fact. 2009, 8, 1–26. [Google Scholar] [CrossRef] [PubMed]
- Oliveira, C.; Guimarães, P.M.R.; Domingues, L. Recombinant microbial systems for improved β-galactosidase production and biotechnological applications. Biotechnol. Adv. 2011, 29, 600–609. [Google Scholar] [CrossRef] [PubMed]
- Peti, W.; Page, R. Strategies to maximize heterologous protein expression in Escherichia coli with minimal cost. Protein Expr. Purif. 2007, 51, 1–10. [Google Scholar] [CrossRef] [PubMed]
- Baweja, M.; Nain, L.; Kawarabayasi, Y.; Shukla, P. Current technological improvements in enzymes toward their biotechnological applications. Front. Microbiol. 2016, 7, 1–13. [Google Scholar] [CrossRef] [PubMed]
- Jarmander, J.; Janoschek, L.; Lundh, S.; Larsson, G.; Gustavsson, M. Process optimization for increased yield of surface-expressed protein in Escherichia coli. Bioprocess Biosyst. Eng. 2014, 37, 1685–1693. [Google Scholar] [CrossRef] [PubMed]
- Mahalik, S.; Sharma, A.K.; Mukherjee, K.J. Genome engineering for improved recombinant protein expression in Escherichia coli. Microb. Cell Fact. 2014, 13, 177. [Google Scholar] [CrossRef] [PubMed]
- Zhang, L.; Fu, Q.; Li, W.; Wang, B.; Yin, X.; Liu, S. Identification and characterization of a novel β-glucosidase via metagenomic analysis of Bursaphelenchus xylophilus and its microbial flora. Sci. Rep. 2017, 7, 1–11. [Google Scholar] [CrossRef] [PubMed]
- Jana, S.; Deb, J.K. Strategies for efficient production of heterologous proteins in Escherichia coli. Appl. Microbiol. Biotechnol. 2005, 67, 289–298. [Google Scholar] [CrossRef] [PubMed]
- Khan, S.; Pozzo, T.; Megyeri, M.; Lindahl, S.; Sundin, A.; Turner, C. Aglycone specificity of Thermotoga neapolitana β-glucosidase 1A modified by mutagenesis, leading to increased catalytic efficiency in quercetin-3-glucoside hydrolysis. BMC Biochem. 2011, 12, 1–11. [Google Scholar] [CrossRef] [PubMed]
- Khushoo, A.; Pal, Y.; Singh, B.N.; Mukherjee, K.J. Extracellular expression and single step purification of recombinant Escherichia coli l-asparaginase II. Protein Expr. Purif. 2004, 38, 29–36. [Google Scholar] [CrossRef] [PubMed]
- Volontè, F.; Marinelli, F.; Gastaldo, L.; Sacchi, S.; Pilone, M.S.; Pollegioni, L. Optimization of glutaryl-7-aminocephalosporanic acid acylase expression in E. Coli. Protein Expr. Purif. 2008, 61, 131–137. [Google Scholar] [CrossRef] [PubMed]
- Zelena, K.; Eisele, N.; Berger, R.G. Escherichia coli as a production host for novel enzymes from basidiomycota. Biotechnol. Adv. 2014, 32, 1382–1395. [Google Scholar] [CrossRef] [PubMed]
- Costa, S.; Almeida, A.; Castro, A.; Domingues, L. Fusion tags for protein solubility, purification, and immunogenicity in Escherichia coli: The novel Fh8 system. Front. Microbiol. 2014, 5, 1–20. [Google Scholar] [CrossRef] [PubMed]
- Dickson, J.M.J.; Lee, W.; Shepherd, P.R.; Buchanan, C.M. Enzyme activity effects of N-terminal His-tag attached to catalytic sub-unit of phosphoinositide-3-kinase. Biosci. Rep. 2013, 33, 857–863. [Google Scholar] [CrossRef] [PubMed]
- Zhang, H.; Fu, G.; Zhang, D. Cloning, Characterization, and production of a novel lysozyme by different expression hosts. J. Microbiol. Biotechnol. 2014, 24, 1405–1412. [Google Scholar] [CrossRef] [PubMed]
- Deng, Y.; Nie, Y.; Zhang, Y.; Wang, Y.; Xu, Y. Improved inducible expression of Bacillus naganoensis pullulanase from recombinant Bacillus subtilis by enhancer regulation. Protein Expr. Purif. 2018, 148, 9–15. [Google Scholar] [CrossRef] [PubMed]
- Song, Y.; Nikoloff, J.M.; Zhang, D. Improving protein production on the level of regulation of both expression and secretion pathways in Bacillus Subtilis. J. Microbiol. Biotechnol. 2015, 25, 963–977. [Google Scholar] [CrossRef] [PubMed]
- Song, W.; Nie, Y.; Mu, X.Q.; Xu, Y. Enhancement of extracellular expression of Bacillus naganoensis pullulanase from recombinant Bacillus subtilis: Effects of promoter and host. Protein Expr. Purif. 2016, 124, 23–31. [Google Scholar] [CrossRef] [PubMed]
- Thuy, L.A.T.; Schumann, W. A novel cold-inducible expression system for Bacillus Subtilis. Protein Expr. Purif. 2007, 53, 264–269. [Google Scholar] [CrossRef] [PubMed]
- Gomes, L.C.; Mergulh, F.J. Effects of antibiotic concentration and nutrient medium composition on Escherichia coli biofilm formation and green fluorescent protein expression. FEMS Microbiol. Lett. 2018, 364, 1–8. [Google Scholar] [CrossRef] [PubMed]
- Jia, B.; Jeon, C.O. High-throughput recombinant protein expression in Escherichia coli: Current status and future perspectives. Open Biol. 2016, 6, 1–17. [Google Scholar] [CrossRef] [PubMed]
- Chhetri, G.; Kalita, P.; Tripathi, T. An efficient protocol to enhance recombinant protein expression using ethanol in Escherichia coli. MethodsX 2015, 2, 385–391. [Google Scholar] [CrossRef] [PubMed]
- Ryan, B.J.; O’Fágáin, C. Effects of single mutations on the stability of horseradish peroxidase to hydrogen peroxide. Biochimie 2007, 89, 1029–1032. [Google Scholar] [CrossRef] [PubMed]
- Deller, M.C.; Kong, L.; Rupp, B. Protein stability: A crystallographer’s perspective. Acta Crystallogr. Sect. Struct. Biol. Commun. 2016, 72, 72–95. [Google Scholar] [CrossRef] [PubMed]
- Vincentelli, R.; Cimino, A.; Geerlof, A.; Kubo, A.; Satou, Y.; Cambillau, C. High-throughput protein expression screening and purification in Escherichia coli. Methods 2011, 55, 65–72. [Google Scholar] [CrossRef] [PubMed]
- Lee, K.M.; Rhee, C.H.; Kang, C.K.; Kim, J.H. Sequential and Simultaneous Statistical Optimization by Dynamic Design of Experiment for Peptide Overexpression in Recombinant Escherichia coli. Appl. Biochem. Biotechnol. 2006, 135, 59–80. [Google Scholar] [CrossRef]
- Lebendiker, M.; Danieli, T. Production of prone-to-aggregate proteins. FEBS Lett. 2014, 588, 236–246. [Google Scholar] [CrossRef] [PubMed]
- Malik, A.; Alsenaidy, A.M.; Elrobh, M.; Khan, W.; Alanazi, M.S.; Bazzi, M.D. Optimization of expression and purification of HSPA6 protein from Camelus dromedarius in E. coli. Saudi J. Biol. Sci. 2016, 23, 410–419. [Google Scholar] [CrossRef] [PubMed]
- Ou, J.; Wang, L.; Ding, X.; Du, J.; Zhang, Y.; Chen, H. Stationary phase protein overproduction is a fundamental capability of Escherichia coli. Biochem. Biophys. Res. Commun. 2004, 314, 174–180. [Google Scholar] [CrossRef] [PubMed]
- Papaneophytou, C.P.; Rinotas, V.; Douni, E.; Kontopidis, G. A statistical approach for optimization of RANKL overexpression in Escherichia coli: Purification and characterization of the protein. Protein Expr. Purif. 2013, 90, 9–19. [Google Scholar] [CrossRef] [PubMed]
- Mandenius, C.; Brundin, A. Review: Biocatalysts and Bioreactor Design Optimization, Bioprocess Methodology, Using Design-of-experiments. Biotechnol. Progr. 2008, 24, 1191–1203. [Google Scholar] [CrossRef] [PubMed]
- Hajihassan, Z.; Biroonro, N. Enhanced expression of recombinant activin a in Escherichia coli by optimization of induction parameters. J. Sci. Islam Repub. Iran 2018, 29, 105–111. [Google Scholar]
- Batumalaie, K.; Khalili, E.; Mahat, N.A.; Huyop, F.Z.; Wahab, R.A. A statistical approach for optimizing the protocol for overexpressing lipase KV1 in Escherichia coli: Purification and characterization. Biotechnol. Biotechnol. Equip. 2018, 32, 69–87. [Google Scholar]
- Prabhu, A.A.; Mandal, B.; Dasu, V.V. Medium optimization for high yield production of extracellular human interferon-γ from Pichia pastoris: A statistical optimization and neural network-based approach. Korean J. Chem. Eng. 2017, 34, 1109–1121. [Google Scholar] [CrossRef]
- Aghaeepoor, M.; Kobarfard, F.; Akbari Eidgahi, M.R.; Shabani, A.; Dehnavi, E.; Ahmadi, M. Optimization of culture media for extracellular expression of streptokinase in Escherichia coli using response surface methodology in combination with plackett-burman design. Trop. J. Pharm. Res. 2017, 16, 2567–2576. [Google Scholar] [CrossRef]
- Puri, M.; Kaur, A.; Singh, R.S.; Singh, A. Response surface optimization of medium components for naringinase production from staphylococcus xylosus MAK2. Appl. Biochem. Biotechnol. 2010, 162, 181–191. [Google Scholar] [CrossRef] [PubMed]
- Pandey, R.K.; Senthil, P.; Boriwal, L.; Malviya, A. Experimental investigation on influence of ECM process parameters on responses using full factorial design. Mater. Today Proc. 2017, 4, 3666–3671. [Google Scholar] [CrossRef]
- Nam, S.H.; Park, J.; Jun, W.; Kim, D.; Ko, J.A.; Abd El-Aty, A.M. Transglycosylation of gallic acid by using Leuconostoc glucansucrase and its characterization as a functional cosmetic agent. AMB Express 2017, 7, 224. [Google Scholar] [CrossRef] [PubMed]
- Wahid, Z.; Nadir, N. Improvement of one factor at a time through design of experiments. World Appl. Sci. J. 2013, 21, 56–61. [Google Scholar]
- Anbu, P.; Annadurai, G.; Hur, B. Production of alkaline protease from a newly isolated Exiguobacterium profundum BK-P23 evaluated using the response surface methodology. Biologia 2013, 68, 186–193. [Google Scholar] [CrossRef]
- Roohi, M.K. Statistical optimization of cold-active chitinase production by mutagenized cells of multi-enzyme producing Bacillus cereus GA6. Rend Lincei. 2015, 26, 271–280. [Google Scholar] [CrossRef]
- Mahajan, P.M.; Gokhale, S.V.; Lele, S.S. Production of Nattokinase Using Bacillus natto NRRL 3666: Media optimization, scale Up, and kinetic modeling. Food Sci. Biotechnol. 2010, 9, 1593–1603. [Google Scholar] [CrossRef]
- Purama, R.K.; Goyal, A. Application of response surface methodology for maximizing dextransucrase production from leuconostoc mesenteroides NRRL B-640 in a bioreactor. Appl. Biochem. Biotechnol. 2008, 151, 182–192. [Google Scholar] [CrossRef] [PubMed]
- Haider, M.A.; Pakshirajan, K. Screening and optimization of media constituents for enhancing lipolytic activity by a soil microorganism using statistically designed experiments. Appl. Biochem. Biotechnol. 2007, 141, 377–390. [Google Scholar] [CrossRef] [PubMed]
- Samarin, Z.E.; Abolghasemi, S.; Dehnavi, E.; Akbarzadeh, A.; Hadian, A.; Khodabandeh, M. Response Surface Optimization of the Expression Conditions for Synthetic Human Interferon α -2b Gene in Escherichia coli. Indian J. Pharm. Sci. 2018, 80, 470–479. [Google Scholar] [CrossRef]
- Saravanan, P.; Muthuvelayudham, R.; Rajesh Kannan, R.; Viruthagiri, T. Optimization of cellulase production using Trichoderma reesei by RSM and comparison with genetic algorithm. Front. Chem. Sci. Eng. 2012, 6, 443–452. [Google Scholar] [CrossRef]
- Graslund, S.; Nordlund, P.; Weigelt, J.; Hallberg, B.M.; Bray, J.; Gileadi, O.; Knapp, S. Protein production and purification. Nat. Methods 2008, 5, 135–146. [Google Scholar] [CrossRef] [PubMed]
- Naili, B.; Sahnoun, M.; Bejar, S.; Kammoun, R. Optimization of submerged Aspergillus oryzae S2 α-amylase production. Food Sci. Biotechnol. 2016, 25, 185–192. [Google Scholar] [CrossRef] [PubMed]
- Goswami, R.; Mukherjee, S.; Chakraborty, A.K.; Balachandran, S.; Sinha Babu, S.P.; Chaudhury, S. Optimization of growth determinants of a potent cellulolytic bacterium isolated from lignocellulosic biomass for enhancing biogas production. Clean Technol. Environ. Policy 2016, 18, 1565–1583. [Google Scholar] [CrossRef]
- Zhao, Y.; Liang, Y.; Liu, L.; Cheng, J.; Yuan, Y. Medium Optimization for Antifungal Active Substance Production from Streptomyces Lydicus Using Response Surface Methodology. Trans. Tianjin Univ. 2017, 23, 78–86. [Google Scholar] [CrossRef]
- Manivasagan, P.; Sivasankar, P.; Venkatesan, J.; Sivakumar, K.; Kim, S.K. Optimization, production and characterization of glycolipid biosurfactant from the marine actinobacterium, Streptomyces sp. MAB36. Bioprocess Biosyst. Eng. 2014, 37, 783–797. [Google Scholar] [CrossRef] [PubMed]
- Ramadas, N.V.; Soccol, C.R.; Pandey, A. A statistical approach for optimization of polyhydroxybutyrate production by Bacillus sphaericus NCIM 5149 under submerged fermentation using central composite design. Appl. Biochem. Biotechnol. 2010, 162, 996–1007. [Google Scholar] [CrossRef] [PubMed]
- Kandasamy, S.; Muthusamy, G.; Balakrishnan, S.; Duraisamy, S.; Thangasamy, S.; Seralathan, K.K. Optimization of protease production from surface-modified coffee pulp waste and corncobs using Bacillus sp. by SSF. 3 Biotech 2016, 6, 1–11. [Google Scholar] [CrossRef] [PubMed]
- Jones, B.; Nachtsheim, C.J. A Class of Three-Level Designs for Definitive Screening in the Presence of Second-Order Effects. J. Qual. Technol. 2011, 43, 1–15. [Google Scholar] [CrossRef]
- Lee, C.W.; Wang, H.J.; Hwang, J.K.; Tseng, C.P. Protein thermal stability enhancement by designing salt bridges: A combined computational and experimental study. PLoS ONE 2014, 9, e112751. [Google Scholar] [CrossRef] [PubMed]
- Mittal, D.; Srivatsava, A.; Govindasamy, S.; Chandrasekaran, M. Optimization of Critical Medium Components for Protein Production by Nostoc ellipsosporum Using Response Surface Methodology. Arab. J. Sci. Eng. 2015, 40, 875–880. [Google Scholar] [CrossRef]
- Adinarayana, K.; Ellaiah, P. Response surface optimization of the critical medium components for the production of alkaline protease by a newly isolated Bacillus Sp. J. Pharm. Pharm. Sci. 2002, 5, 272–278. [Google Scholar] [PubMed]
- Bhagwat, P.K.; Jhample, S.B.; Dandge, P.B. Statistical medium optimization for the production of collagenolytic protease by Pseudomonas sp. SUK using response surface methodology. Microbiology 2015, 84, 520–530. [Google Scholar] [CrossRef]
- Chandel, M.; Azmi, W. Bioresource Technology Optimization of process parameters for the production of tyrosine phenol lyase by Citrobacter freundii MTCC 2424. Bioresour. Technol. 2009, 100, 1840–1846. [Google Scholar] [CrossRef] [PubMed]
- Gao, H.; Liu, M.; Liu, J.; Dai, H.; Zhou, X.; Liu, X. Medium optimization for the production of avermectin B1a by Streptomyces avermitilis 14-12A using response surface methodology. Bioresour. Technol. 2009, 100, 4012–4016. [Google Scholar] [CrossRef] [PubMed]
- El-Ahmady El-Naggar, N.; Moawad, H.; Abdelwahed, N.A.M. Optimization of fermentation conditions for enhancing extracellular production of L-asparaginase, an anti-leukemic agent, by newly isolated Streptomyces brollosae NEAE-115 using solid state fermentation. Ann. Microbiol. 2017, 67, 1–15. [Google Scholar] [CrossRef]
- Wass, J. First Steps in Experimental Design–The Screening Experiment. J. Valid. Technol. 2010, 49–57. [Google Scholar]
- Pham, P.; Taillandier, P.; Delmas, M.; Strehaiano, P. Optimization of a culture medium for xylanase production by Bacillus sp. using statistical experimental designs. World J. Microbiol. Biotechnol. 1998, 14, 185–190. [Google Scholar] [CrossRef]
- Vijayaraghavan, P.; Vincent, S.G.P. Statistical optimization of fibrinolytic enzyme production by Pseudoalteromonas sp. IND11 using cow dung substrate by response surface methodology. Springerplus 2014, 3, 60. [Google Scholar] [CrossRef] [PubMed]
- Liu, C.L.; Lin, T.H.; Juang, R.S. Optimization of recombinant hexaoligochitin-producing chitinase production with response surface methodology. Int. J. Biol. Macromol. 2013, 62, 518–522. [Google Scholar] [CrossRef] [PubMed]
- Zhu, C.H.; Lu, F.P.; He, Y.N.; Zhang, J.K.; Du, L.X. Statistical optimization of medium components for avilamycin production by Streptomyces viridochromogenes Tü57-1 using response surface methodology. J. Ind. Microbiol. Biotechnol. 2007, 34, 271–278. [Google Scholar] [CrossRef] [PubMed]
- Jia, B.; Jin, Z.H.; Mei, L.H. Medium optimization based on statistical methodologies for pristinamycins production by Streptomyces Pristinaespiralis. Appl. Biochem. Biotechnol. 2008, 144, 133–143. [Google Scholar] [CrossRef] [PubMed]
- Kammoun, R.; Naili, B.; Bejar, S. Application of a statistical design to the optimization of parameters and culture medium for α-amylase production by Aspergillus oryzae CBS 819.72 grown on gruel (wheat grinding by-product). Bioresour. Technol. 2008, 99, 5602–5609. [Google Scholar] [CrossRef] [PubMed]
- Niladevi, K.N.; Sukumaran, R.K.; Jacob, N.; Anisha, G.S.; Prema, P. Optimization of laccase production from a novel strain-Streptomyces psammoticus using response surface methodology. Microbiol. Res. 2009, 164, 105–113. [Google Scholar] [CrossRef] [PubMed]
- Sai-Ut, S.; Benjakul, S.; Sumpavapol, P.; Kishimura, H. Optimization of gelatinolytic enzyme production by B. amyloliquefaciens sp. H11 through Plackett-Burman design and response surface methodology. Int. Aquat. Res. 2014, 6, 59. [Google Scholar] [CrossRef]
- Thenmozhi, C.; Sankar, R.; Karuppiah, V.; Sampathkumar, P. L-asparaginase production by mangrove derived Bacillus cereus MAB5: Optimization by response surface methodology. Asian Pac. J. Trop. Med. 2011, 4, 486–491. [Google Scholar] [CrossRef]
- Jones, B.; Nachtsheim, C.J. Definitive screening designs with added two-level categorical factors. J. Qual. Technol. 2013, 45, 121–129. [Google Scholar] [CrossRef]
- Swalley, S.E.; Fulghum, J.R.; Chambers, S.P. Screening factors effecting a response in soluble protein expression: Formalized approach using design of experiments. Anal. Biochem. 2006, 351, 122–127. [Google Scholar] [CrossRef] [PubMed]
- Cao, W.; Li, H.; Zhang, J.; Li, D.; Acheampong, D.O.; Chen, Z. Periplasmic expression optimization of VEGFR2 D3 adopting response surface methodology: Antiangiogenic activity study. Protein Expr. Purif. 2013, 90, 55–66. [Google Scholar] [CrossRef] [PubMed]
- Abdel-Fattah, Y.R.; Olama, Z.A. L-asparaginase production by Pseudomonas aeruginosa in solid-state culture: Evaluation and optimization of culture conditions using factorial designs. Process Biochem. 2002, 38, 115–122. [Google Scholar] [CrossRef]
- Meriem, G.; Mahmoud, K. Optimization of chitinase production by a new Streptomyces griseorubens C9 isolate using response surface methodology. Ann. Microbiol. 2017, 67, 175–183. [Google Scholar] [CrossRef]
- Ghosh, S.; Murthy, S.; Govindasamy, S.; Chandrasekaran, M. Optimization of L-asparaginase production by Serratia marcescens (NCIM 2919) under solid state fermentation using coconut oil cake. Sustain. Chem. Process 2013, 1, 9. [Google Scholar] [CrossRef]
- Woods, D.C.; Lewis, S.M. Design of Experiments for Screening. In Handbook of Uncertainty Quantification; Springer: Cham, Switzerland, 2015; pp. 1–43. [Google Scholar]
- Dey, S.S.; Dora, K.C. Optimization of the production of shrimp waste protein hydrolysate using microbial proteases adopting response surface methodology. J. Food Sci. Technol. 2014, 51, 16–24. [Google Scholar] [CrossRef] [PubMed]
- Myers, R.; Montgomery, D.; Vining, G.G.; Borror, C.; Kowalski, S. Response Surface Methodology: A Retrospective and Literature Survey. J. Qual. Technol. 2004, 36, 53–77. [Google Scholar] [CrossRef]
- Dadzie, R.G.; Ma, H.; Abano, E.E.; Qu, W.; Mao, S. Optimization of process conditions for production of angiotensin I-converting enzyme (ACE) inhibitory peptides from vital wheat gluten using response surface methodology. Food Sci. Biotechnol. 2013, 22, 1531–1537. [Google Scholar] [CrossRef]
- Thakkar, A.; Saraf, M. Application of Statistically Based Experimental Designs to Optimize Cellulase Production and Identification of Gene. Nat. Prod. Bioprospect. 2014, 4, 341–351. [Google Scholar] [CrossRef] [PubMed]
- Garai, D.; Kumar, V. Response surface optimization for xylanase with high volumetric productivity by indigenous alkali tolerant Aspergillus candidus under submerged cultivation. 3 Biotech 2012, 3, 127–136. [Google Scholar] [CrossRef] [PubMed]
- Khurana, S.; Kapoor, M.; Gupta, S.; Kuhad, R.C. Statistical optimization of alkaline xylanase production from Streptomyces violaceoruber under submerged fermentation using response surface methodology. Indian J. Microbiol. 2007, 47, 144–152. [Google Scholar] [CrossRef] [PubMed]
- Morowvat, M.H.; Memari, H.R. Optimization of Fermentation Conditions for Recombinant Human Interferon Beta Production by Escherichia coli Using the Response Surface Methodology. Jundishapur J. Microbiol. 2015, 8, 1–8. [Google Scholar] [CrossRef]
- Tabandeh, F.; Khodabandeh, M.; Yakhchali, B.; Habib-Ghomi, H.; Shariati, P. Response surface methodology for optimizing the induction conditions of recombinant interferon beta during high cell density culture. Chem. Eng. Sci. 2008, 63, 2477–2483. [Google Scholar] [CrossRef]
- Anderson-Cook, C.M.; Borror, C.M.; Montgomery, D.C. Response surface design evaluation and comparison. J. Stat. Plan. Inference 2009, 139, 629–641. [Google Scholar] [CrossRef]
- Liu, C.; Sun, Z.T.; Du, J.H.; Wang, J. Response surface optimization of fermentation conditions for producing xylanase by Aspergillus niger SL-05. J. Ind. Microbiol. Biotechnol. 2008, 35, 703–711. [Google Scholar] [CrossRef] [PubMed]
- Behera, S.K.; Meena, H.; Chakraborty, S.; Meikap, B.C. Application of response surface methodology (RSM) for optimization of leaching parameters for ash reduction from low-grade coal. Int. J. Min. Sci. Technol. 2018, 28, 621–629. [Google Scholar] [CrossRef]
- Rani, V.; Dash, S.; Nain, L.; Arora, A. Expression of novel glucose tolerant β-glucosidase on cell surface by Rhodotorula glutinis isolate. Biocatal. Agric. Biotechnol. 2015, 4, 380–387. [Google Scholar] [CrossRef]
- Wang, Y.; Wang, Q.; Wang, Y.; Han, H.; Hou, Y.; Shi, Y. Statistical optimization for the production of recombinant cold-adapted superoxide dismutase in E. coli using response surface methodology. Bioengineered 2017, 5979, 1–7. [Google Scholar]
- Maldonado, L.P.; Hernández, V.E.B.; Rivero, E.M.; Barba de la Rosa, A.P.; Flores, J.L.F.; Acevedo, L.G.O. Optimization of culture conditions for a synthetic gene expression in Escherichia coli using response surface methodology: The case of human interferon beta. Biomol. Eng. 2007, 24, 217–222. [Google Scholar] [CrossRef] [PubMed]
- Balderas, H.V.E.; Paz Maldonado, L.M.T.; Rivero, E.M.; Barba de la Rosa, A.P.; Ordoñez Acevedo, L.G.; Rodríguez, A.D.L. Optimization of human interferon gamma production in Escherichia coli by response surface methodology. Biotechnol. Bioprocess Eng. 2008, 13, 7–13. [Google Scholar] [CrossRef]
- Batra, J.; Beri, D.; Mishra, S. Response surface methodology based optimization of β-glucosidase production from Pichia Pastor. Appl. Biochem. Biotechnol. 2014, 172, 380–393. [Google Scholar] [CrossRef] [PubMed]
- Dey, G.; Mitra, A.; Banerjee, R.; Maiti, B.R. Enhanced production of amylase by optimization of nutritional constituents using response surface methodology. Biochem. Eng. J. 2001, 7, 227–231. [Google Scholar] [CrossRef]
- Tanyildizi, M.S.; Özer, D.; Elibol, M. Optimization of α-amylase production by Bacillus sp. using response surface methodology. Process Biochem. 2005, 40, 2291–2296. [Google Scholar] [CrossRef]
- Low, K.O.; Muhammad Mahadi, N.; Abdul Rahim, R.; Rabu, A.; Abu Bakar, F.D.; Murad, A.M.A. An effective extracellular protein secretion by an ABC transporter system in Escherichia coli: Statistical modeling and optimization of cyclodextrin glucanotransferase secretory production. J. Ind. Microbiol. Biotechnol. 2011, 38, 1587–1597. [Google Scholar] [CrossRef] [PubMed]
- Hao, D.C.; Zhu, P.H.; Yang, S.L.; Yang, L. Optimization of recombinant cytochrome P450 2C9 protein production in Escherichia coli DH5α by statistically-based experimental design. World J. Microbiol. Biotechnol. 2006, 22, 1169–1176. [Google Scholar] [CrossRef]
- Ghoshoon, M.B.; Berenjian, A.; Hemmati, S.; Dabbagh, F.; Karimi, Z.; Negahdaripour, M. Extracellular Production of Recombinant l-Asparaginase II in Escherichia coli: Medium Optimization Using Response Surface Methodology. Int. J. Pept. Res. Ther. 2015, 21, 487–495. [Google Scholar] [CrossRef]
- Nikerel, I.E.; Toksoy, E.; Kirdar, B.; Yildirim, R. Optimizing medium composition for TaqI endonuclease production by recombinant Escherichia coli cells using response surface methodology. Process Biochem. 2005, 40, 1633–1639. [Google Scholar] [CrossRef]
- Farliahati, M.R.; Ramanan, R.N.; Mohamad, R.; Puspaningsih, N.N.T.; Ariff, A.B. Enhanced production of xylanase by recombinant Escherichia coli DH5α through optimization of medium composition using response surface methodology. Ann. Microbiol. 2010, 60, 279–285. [Google Scholar] [CrossRef]
- Muntari, B.; Amid, A.; Mel, M.; Jami, M.S.; Salleh, H.M. Recombinant bromelain production in Escherichia coli: Process optimization in shake flask culture by response surface methodology. AMB Express 2012, 2. [Google Scholar] [CrossRef] [PubMed]
- Sunitha, K.; Lee, J.K.; Oh, T.K. Optimization of medium components for phytase production by E. coli using response surface methodology. Bioprocess Eng. 1999, 21, 477–481. [Google Scholar] [CrossRef]
- Lee, Y.J.; Kim, H.J.; Gao, W.; Chung, C.H.; Lee, J.W. Statistical optimization for production of carboxymethylcellulase of Bacillus amyloliquefaciens DL-3 by a recombinant Escherichia coli JM109/DL-3 from rice bran using response surface method. Biotechnol. Bioprocess Eng. 2012, 17, 227–235. [Google Scholar] [CrossRef]
- Joshi, S.; Satyanarayana, T. Optimization of heterologous expression of the phytase (PPHY) of Pichia anomala in P. pastoris and its applicability in fractionating allergenic glycinin from soy protein. J. Ind. Microbiol. Biotechnol. 2014, 41, 977–987. [Google Scholar] [PubMed]
- Chen, Y.; Xing, X.H.; Ye, F.; Kuang, Y.; Luo, M. Production of MBP–HepA fusion protein in recombinant Escherichia coli by optimization of culture medium. Biochem. Eng. J. 2007, 34, 114–121. [Google Scholar] [CrossRef]
- Pan, H.; Xie, Z.; Bao, W.; Zhang, J. Optimization of culture conditions to enhance cis-epoxysuccinate hydrolase production in Escherichia coli by response surface methodology. Biochem. Eng. J. 2008, 42, 133–138. [Google Scholar] [CrossRef]
- Karimineghlani, P.; Neghlani, P.K.; Azadmehr, A. Optimization of lead ions adsorption on hydrolyzed polyacrylonitrile fibers using central composite design. Desalination Water Treat. 2017, 83, 133–143. [Google Scholar] [CrossRef]
- Almeida, J.M.; Lima, V.A.; Giloni-Lima, P.C.; Knob, A. Passion fruit peel as novel substrate for enhanced beta-glucosidases production by Penicillium verruculosum: Potential of the crude extract for biomass hydrolysis. Biomass Bioenergy 2015, 72, 216–226. [Google Scholar] [CrossRef]
- Singh, A.K.; Chhatpar, H.S. Optimization of protease production by Streptomyces sp. A6 using statistical approach for reclamation of shellfish waste. World J. Microbiol. Biotechnol. 2010, 26, 1631–1639. [Google Scholar] [CrossRef]
- Khataee, A.R. Application of central composite design for the optimization of photo-destruction of a textile dye using UV/S2O82-process. Pol. J. Chem. Technol. 2009, 11, 38–45. [Google Scholar] [CrossRef]
- Nelofer, R.; Ramanan, R.N.; Rahman, R.A.; Basri, M.; Ariff, A.B. Comparison of the estimation capabilities of response surface methodology and artificial neural network for the optimization of recombinant lipase production by E. coli BL21. J. Ind. Microbiol. Biotechnol. 2012, 39, 243–254. [Google Scholar] [CrossRef] [PubMed]
- Vellanki, R.N.; Potumarthi, R.; Mangamoori, L.N. Constitutive expression and optimization of nutrients for streptokinase production by pichia pastoris using statistical methods. Appl. Biochem. Biotechnol. 2009, 158, 25–40. [Google Scholar] [CrossRef] [PubMed]
- Sharma, L.; Kumar, S.A.; Panda, B.; Mallick, N. Process optimization for poly-β-hydroxybutyrate production in a nitrogen fixing cyanobacterium, Nostoc muscorum using response surface methodology. Bioresour. Technol. 2007, 98, 987–993. [Google Scholar] [CrossRef] [PubMed]
- Tatineni, R.; Doddapaneni, K.K.; Potumarthi, R.C.; Mangamoori, L.N. Optimization of keratinase production and enzyme activity using response surface methodology with streptomyces sp7. Appl. Biochem. Biotechnol. 2007, 141, 187–201. [Google Scholar] [CrossRef] [PubMed]
- Pareek, N.; Ghosh, S.; Singh, R.P.; Vivekanand, V. Mustard oil cake as an inexpensive support for production of chitin deacetylase by Penicillium oxalicum SAEM-51 under solid-state fermentation. Biocatal. Agric. Biotechnol. 2014, 3, 212–217. [Google Scholar] [CrossRef]
- Tavakkoli, M.; Hamidi-Esfahani, Z.; Azizi, M.H. Optimization of Corynebacterium glutamicum Glutamic Acid Production by Response Surface Methodology. Food Bioprocess Technol. 2012, 5, 92–99. [Google Scholar] [CrossRef]
- Almeida, M.; Erthal, R.; Padua, E.; Silveira, L.; Am, L. Response surface methodology (RSM) as a tool for optimization in analytical chemistry. Talanta 2008, 76, 965–977. [Google Scholar]
- Nagar, S.; Gupta, V.K.; Kumar, D.; Kumar, L.; Kuhad, R.C. Production and optimization of cellulase-free, alkali-stable xylanase by Bacillus pumilus SV-85S in submerged fermentation. J. Ind. Microbiol. Biotechnol. 2010, 37, 71–83. [Google Scholar] [CrossRef] [PubMed]
- Li, X.; Xu, T.; Ma, X.; Guo, K.; Kai, L.; Zhao, Y. Optimization of culture conditions for production of cis-epoxysuccinic acid hydrolase using response surface methodology. Bioresour. Technol. 2008, 99, 5391–5396. [Google Scholar] [CrossRef] [PubMed]
- Ray, R.C.; Kar, S. Statistical optimization of [alpha]-amylase production by Bacillus brevis MTCC 7521 in solid-state fermentation using cassava bagasse. Biologia 2009, 64, 864–870. [Google Scholar] [CrossRef]
- Rekha, V.P.B.; Ghosh, M.; Adapa, V.; Oh, S.J.; Pulicherla, K.K.; Sambasiva Rao, K.R.S. Optimization of polygalacturonase production from a newly isolated Thalassospira frigidphilosprofundus to use in pectin hydrolysis: Statistical approach. Biomed Res. Int. 2013. [Google Scholar] [CrossRef] [PubMed]
- Deswal, A.; Deora, N.S.; Mishra, H.N. Optimization of Enzymatic Production Process of Oat Milk Using Response Surface Methodology. Food Bioprocess Technol. 2014, 7, 610–618. [Google Scholar] [CrossRef]
- Halmi, M.I.E.; Abdullah, S.R.S.; Wasoh, H.; Johari, W.L.W.; Ali, M.S.; Shaharuddin, N.A. Optimization and maximization of hexavalent molybdenum reduction to Mo-blue by Serratia sp. strain MIE2 using response surface methodology. Rend. Lincei 2016, 27, 697–709. [Google Scholar] [CrossRef]
- Khoshayand, F.; Goodarzi, S.; Shahverdi, A.R.; Khoshayand, M.R. Optimization of Culture Conditions for Fermentation of Soymilk Using Lactobacillus casei by Response Surface Methodology. Probiotics Antimicrob. Proteins 2011, 3, 159–167. [Google Scholar] [CrossRef] [PubMed]
- Cui, F.; Liu, Z.; Li, Y.; Ping, L.; Ping, L.; Zhang, Z. Production of mycelial biomass and exo-polymer by Hericium erinaceus CZ-2: Optimization of nutrients levels using response surface methodology. Biotechnol. Bioprocess Eng. 2010, 15, 299–2307. [Google Scholar] [CrossRef]
- Partida-Sedas, G.; Montes-García, N.; Carvajal-Zarrabal, O.; López-Zamora, L.; Gómez-Rodríguez, J.; Aguilar-Uscanga, M.G. Optimization of Hydrolysis Process to Obtain Fermentable Sugars from Sweet Sorghum Bagasse Using a Box–Behnken Design. Sugar Tech 2017, 19, 317–325. [Google Scholar] [CrossRef]
- Rajendran, A.; Thangavelu, V. Optimization and Modeling of Process Parameters for Lipase Production by Bacillus Brevis. Food Bioprocess Technol. 2012, 5, 310–322. [Google Scholar] [CrossRef]


| General Advantages | Disadvantages | References | |
|---|---|---|---|
| Most common E. coli strains | Rapid expression, high yield, ease of culture and gene modification, cost effective. | Post translational modification not possible. Inclusion body formation | [41,45,46] |
| BL21, B21-Codonplus (RIL), BL21(DE3), BL21(DE3)pLys S/E, BL21 Star, C41(DE3), C43(DE3), Codon plus (RP), Lemon21(DE3), M15, Origami, Rosetta, SG13009, Shuffle Derivatives of K-12, AD494 and HMS174. | |||
| Most common Bacillus species | |||
| Bacillus brevis, Bacillus megaterium and Bacillus subtilis. | Preferred for homologous expression of some enzymes (e.g., proteases and amylases), Strong secretion, no involvement of intracellular inclusion bodies and ease of manipulation. | Contains proteases, which may hydrolyse recombinant proteins. | [42,47,48,49,50] |
| Factors | Levels | ||
|---|---|---|---|
| Low | High | ||
| Media composition | X1 Yeast Extract | − | + |
| X2 Tryptone | − | + | |
| X3 Glycerol | − | + | |
| X4 NaCl | − | + | |
| Induction condition | X5 Inoculum size | − | + |
| X6 IPTG concentration | − | + | |
| X7 Induction temperature | − | + | |
| X8 Incubation time | − | + | |
| X9 pH | − | + | |
| Factors | |||||||
|---|---|---|---|---|---|---|---|
| Number of Runs | |||||||
| Screening Design | Effect explained by the model | 2 | 3 | 4 | 5 | 6 | 7 |
| Full Factorial Design | Main effect and 2 factor interactions | 4 | 8 | 16 | 32 | 64 | 128 |
| Fractional Factorial Design | Main effect only | - | - | - | 8 | 8 | 8 |
| Main effect and 2 factor interactions | - | 8 | 8 | 16 | 16 | 16 | |
| Main effect and 2 factors interactions | - | - | 16 | 16 | 32 | 64 | |
| Plackett-Burman Design | Main effect only | - | - | - | - | 12 | 12 |
| Definitive Screening Design | Main effect and 2 factor interaction | - | 13 | 13 | 13 | 13 | 17 |
| Main effect, 2 factor interaction and quadratic effects | - | 17 | 17 | 17 | 17 | 22 | |
| Custom Design | Main effect only | ≥3 | ≥4 | ≥5 | ≥6 | ≥7 | ≥8 |
| Host Organism | Protein Involved | Screening Design | Factors Studied | Screened Significant Factors | Reference |
|---|---|---|---|---|---|
| Bacillus I-1018 | Xylanase | Full Factorial Design | Media composition | Xylan, casein hydrolysate, NH4Cl | [114] |
| E. coli | Non-structural protein NS3 | Full Factorial Design | Culture condition | temperature, induction length | [124] |
| Pseudoalteromonas IND11 | Fibrinolytic enzyme | Full Factorial Design | Media composition | pH, maltose and NaH2PO4 | [115] |
| E. coli | Zinc-metalloprotease (SVP2) | Fractional Factorial Design | Media composition and culture condition | IPTG and Ca2+ ion concentration and temperature | [22] |
| E. coli | Soluble pneumolysin | Fractional Factorial Design | Media composition and culture condition | Temperature, tryptone and kanamycin | [6] |
| Bacillus cerius | L-asparaginase | Plackett-Burman | Media composition | Soya bean meal, asparagine, woodchips, NaCl | [122] |
| E. coli | Vascular endothelial growth factor | Plackett-Burman design | Media composition and culture condition | Glycerine, inducing time, peptone | [125] |
| P. aeruginosa | L-asparaginase | Plackett-Burman Design | Culture condition | pH, casein hydrolysate and corn steep liquor | [126] |
| P. pastoris | Human interferon gamma | Plackett-Burman Design | Media composition | Gluconate, glycine, KH2PO2 | [85] |
| S. griseorubens | Chitinase | Plackett–Burman Design | Media composition | Yeast extract and K2HPO4, KH2PO4 | [127] |
| Factor | Effect | Relative Effect | p-Value |
|---|---|---|---|
| X3 | −1.11273 |  | 0.001 |
| X6 | 0.2252 |  | 0.0143 |
| X1 | 0.17492 |  | 0.0296 |
| X4 | 0.06408 |  | 0.2215 |
| X7 | 0.04154 |  | 0.4112 |
| X2 | −0.07970 |  | 0.1421 |
| X5 X5*X1 X3*X7 | 0.00233 0.04153 −0.06405 |    | 0.9664 0.4211 0.2623 |
| Number of Factors | Number of Factorial Points | Number of Axial Points | Number of Central Points | Total Number of Runs |
|---|---|---|---|---|
| 2 | 4 | 4 | 5 | 13 |
| 3 | 8 | 6 | 6 | 20 |
| 4 | 16 | 8 | 7 | 31 |
| 5 | 16 | 10 | 6 | 32 |
| 6 | 32 | 12 | 9 | 53 |
| 7 | 64 | 14 | 14 | 92 |
| Microorganism | Recombinant Protein | RSM Methods | Optimised Factors | Optimised vs. Non-Optimised Yield | Reference |
|---|---|---|---|---|---|
| E. coli BL21 | Superoxide dismutase | Box–Behnken design | Tryptone, tween-80, lactose | Enzyme activity increase by 1.54-fold | [142] |
| E. coli BL21-SI | Human interferon beta | Box–Behnken Design | Temperature, cell density, NaCl | hIFN- β concentration increase by 5-fold | [143] |
| E. coli BL21-SI | Human interferon gamma | Box–Behnken Design | Temperature, biomass concentration, NaCl | hIFN- γ concentration increase by 13-fold | [144] |
| P. pastoris GS115 | β-glucosidase | Box-Behnken Design | Sorbitol, MeOH, pH | Enzyme activity increase by 3.3-fold | [145] |
| Bacillus circulans GRS 313 | Amylase | Central Composite Design | Soybean meal, yeast extract, wheat bran | Enzyme yield increase by 1.25-fold | [146] |
| Bacillus IMG22. | α–amylase | Central Composite Design | Starch, yeast extract, glycerol, peptone | Enzyme activity reached 17.54 IU/mL | [147] |
| E. coli BL21(DE3), Rosetta 2 (DE3), Rosetta blue (DE3), and Rosettagami2(DE3) | Cyclodextrin glucanotransferase | Central composite Design | IPTG, arabinose B, post induction temperature | Enzyme activity increase by 3.45-fold | [148] |
| E. coli DH5α | Cytochrome 2C9 protein | Central Composite Design | Ampicillin, chloramphenicol, IPTG, peptone | Enzyme production increased by 1.05- fold | [149] |
| E. coli BL21 (DE3) | Interferon beta | Central Composite Design | DCW (dry cell weight), IPTG | Production increase more than 3-fold | [137] |
| E. coli BL21 (DE3) | L-Asparaginase | Central Composite Design | Tryptone, yeast extract, peptone, CaCl2 | Enzyme activity reached 17,386 U/L | [150] |
| E. coli BL21 | Peptide T-20 | Central Composite Design | NPK, IPTG, post induction time | Production increase by more than 2-fold | [106] |
| E. coli BL21 (DE3) | TaqI endonuclease | Central Composite Design | Glucose, (NH4)2HPO4, KH2PO4, MgSO4.7H2O | Enzyme yield increase by about 3.6-fold | [151] |
| E. coli DH5α | Xylanase | Central Composite Design | Glucose, (NH4)2HPO4, CK2HPO4, DKH2PO4, MgSO4 | Production increase by 1.7- fold | [152] |
| E. coli BL21 | Bromelain | Central Composite Design | Temperature, inducer concentration, post induction period | Enzyme activity increase by 1.3-fold | [153] |
| E. coli BL21 | Phytase | Central Composite Design | Tryptone, yeast extract, NaCl | Production increase by 2.78-fold | [154] |
| E. coli BL21 (DE3) | Chitinase | Central Composite Design | Temperature, incubation time | Total activity increased by 1.54-fold | [115] |
| E. coli BL21(DE3) | Zinc metalloprotease | Central Composite Design | IPTG, Ca2+, induction time | Production increase by 15-fold | [22] |
| E. coli JM109 | Carboxymethyl-Cellulose | Central Composite Design | Rice bran tryptone and initial pH of medium | Production increase by 3-fold | [155] |
| P. pastoris X33 | Phytase | Central Composite Design | Yeast extract, tween-80, methanol | Specific activity increase by 21.8-fold | [156] |
| E. coli TB1 | MBP-Heparinase | Central Composite Design (Orthogonal) | Yeast extract, glucose, Ca2+, OD600 | Specific activity increase by 2.5-fold | [157] |
| E. coli BL21 | Cis-epoxysuccinate hydrolase | Central Composite Design (Rotatable) | Inoculation level, induction-starting time, lactose, induction temperature, induction time | Enzyme activity increase by 4.6-fold | [158] |
| Coded Values | Responses | ||||||
|---|---|---|---|---|---|---|---|
| Runs | X1 | X2 | X3 | X4 | Actual | Predicted | Residuals |
| 1 | −1 | 1 | −1 | 1 | Experimental response | Predicted response data | Residual data |
| 2 | −1 | −1 | 1 | 1 | |||
| 3 | 0 | 0 | 0 | 0 | |||
| 4 | −1 | 0 | 0 | 0 | |||
| 5 | −1 | 1 | 1 | −1 | |||
| 6 | 1 | 1 | 1 | 1 | |||
| 7 | 1 | 1 | −1 | 1 | |||
| 8 | −1 | 1 | 1 | 1 | |||
| 9 | 1 | −1 | −1 | 1 | |||
| 10 | 0 | −1 | 0 | 0 | |||
| 11 | 1 | 1 | 1 | −1 | |||
| 12 | 0 | 0 | 0 | 0 | |||
| 13 | 0 | 0 | 1 | 0 | |||
| 14 | 0 | 1 | 0 | 0 | |||
| 15 | 1 | 0 | 0 | 0 | |||
| 16 | 0 | 0 | 0 | 1 | |||
| 17 | 1 | 1 | −1 | −1 | |||
| 18 | −1 | 1 | −1 | −1 | |||
| 19 | −1 | −1 | 1 | −1 | |||
| 20 | −1 | −1 | −1 | 1 | |||
| 21 | 1 | −1 | −1 | −1 | |||
| 22 | 0 | 0 | 0 | −1 | |||
| 23 | 1 | −1 | 1 | 1 | |||
| 24 | 0 | 0 | −1 | 0 | |||
| 25 | 1 | −1 | 1 | −1 | |||
| 26 | −1 | −1 | −1 | −1 | |||
| Responses (e.g., actual, predicted and residues) data are utilised during the optimisation analysis to evaluate the validity of the model and determine the optimum. | |||||||
| Source | DF | Adj SS | Adj MS | F-Value | p-Value |
|---|---|---|---|---|---|
| Model | 11 | 40.4149 | 3.67408 | 1255.77 | 0.0001 |
| Linear | 4 | 3.1531 | 0.78828 | 269.43 | 0.0001 |
| Square | 4 | 35.3209 | 8.83022 | 3018.09 | 0.0001 |
| Interaction | 3 | 1.9409 | 0.64697 | 221.13 | 0.0001 |
| Residues | 40 | 0.117 | 0.00293 | ||
| Lack-of-fit | 13 | 0.00369 | 0.00284 | 0.96 | 0.515 |
| Pure error | 27 | 0.0802 | 0.00297 | ||
| Total | 51 | 40.532 | |||
| R2= 99.71%, Adj-R2 = 99.63%, Pred-R2 = 99.48% | |||||
© 2018 by the authors. Licensee MDPI, Basel, Switzerland. This article is an open access article distributed under the terms and conditions of the Creative Commons Attribution (CC BY) license (http://creativecommons.org/licenses/by/4.0/).
Share and Cite
Uhoraningoga, A.; Kinsella, G.K.; Henehan, G.T.; Ryan, B.J. The Goldilocks Approach: A Review of Employing Design of Experiments in Prokaryotic Recombinant Protein Production. Bioengineering 2018, 5, 89. https://doi.org/10.3390/bioengineering5040089
Uhoraningoga A, Kinsella GK, Henehan GT, Ryan BJ. The Goldilocks Approach: A Review of Employing Design of Experiments in Prokaryotic Recombinant Protein Production. Bioengineering. 2018; 5(4):89. https://doi.org/10.3390/bioengineering5040089
Chicago/Turabian StyleUhoraningoga, Albert, Gemma K. Kinsella, Gary T. Henehan, and Barry J. Ryan. 2018. "The Goldilocks Approach: A Review of Employing Design of Experiments in Prokaryotic Recombinant Protein Production" Bioengineering 5, no. 4: 89. https://doi.org/10.3390/bioengineering5040089
APA StyleUhoraningoga, A., Kinsella, G. K., Henehan, G. T., & Ryan, B. J. (2018). The Goldilocks Approach: A Review of Employing Design of Experiments in Prokaryotic Recombinant Protein Production. Bioengineering, 5(4), 89. https://doi.org/10.3390/bioengineering5040089