
Deep Learning for Comprehensive Analysis of Retinal Fundus Images: Detection of Systemic and Ocular Conditions

 , , , and
Abstract
1. Introduction
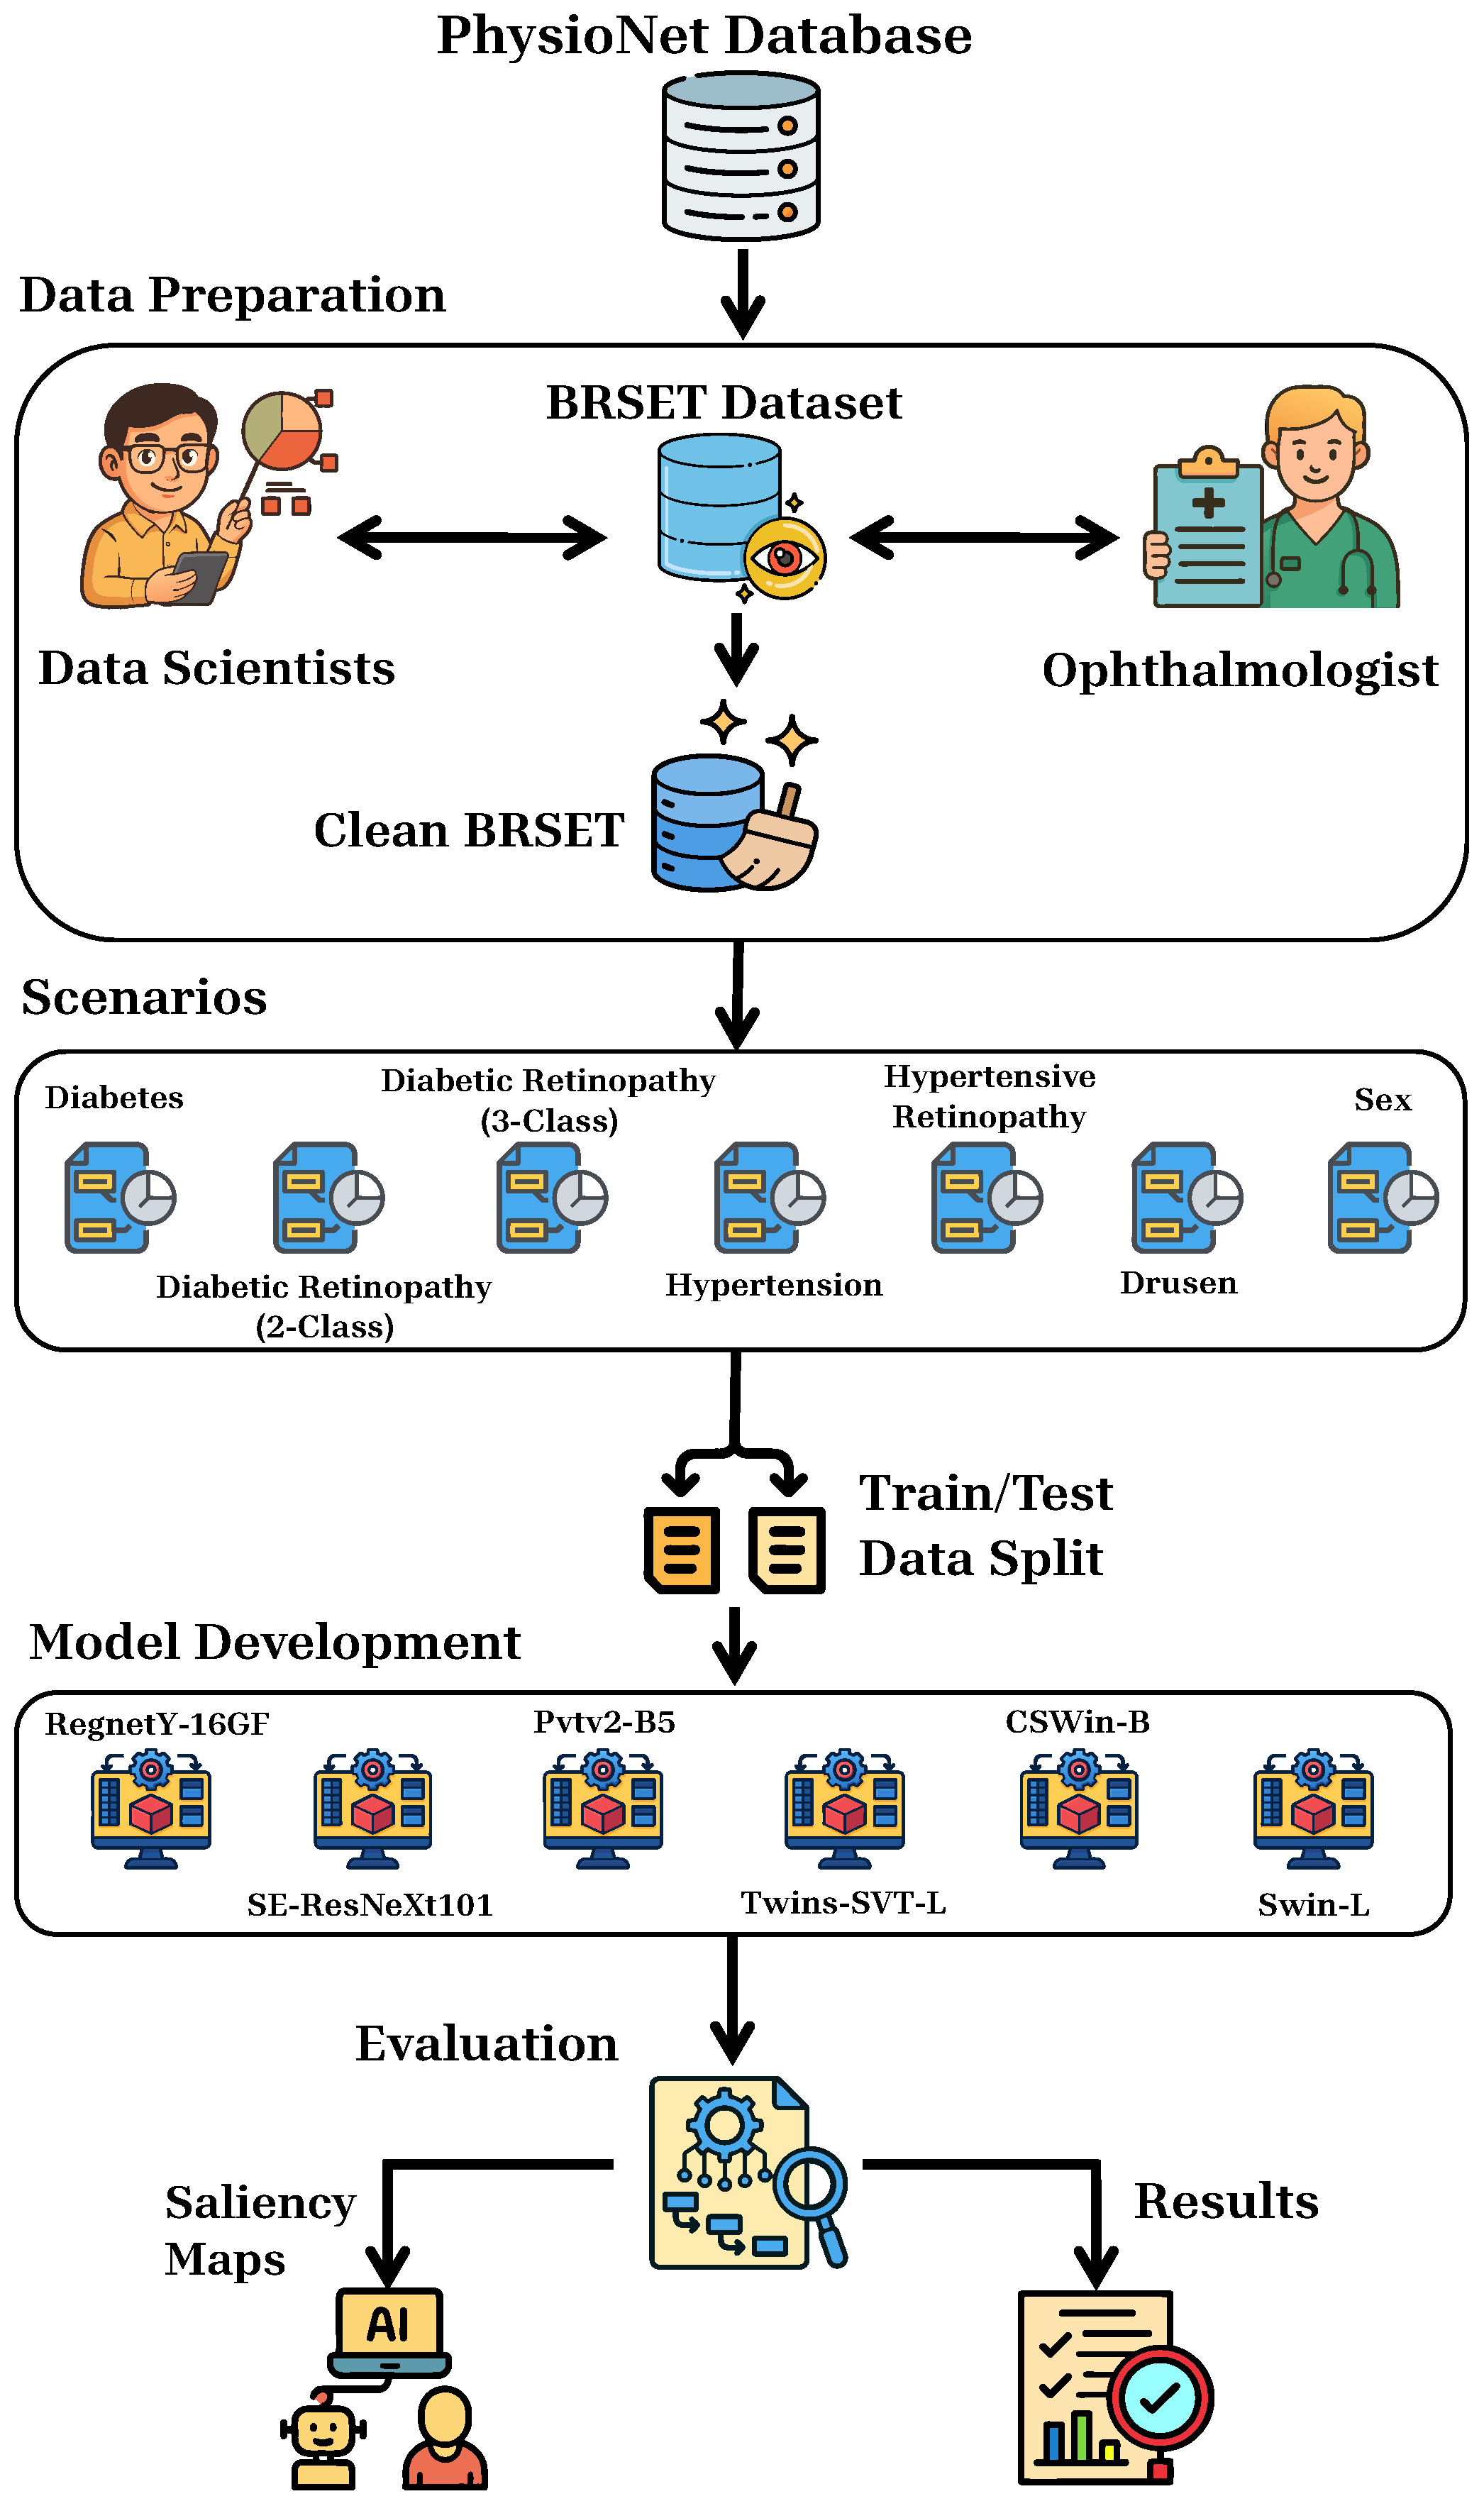
2. Materials and Methods
2.1. Dataset and Preprocessing
2.2. Scenarios
2.3. Models Development

| Model | Architecture Type | Key Features | FLOPs (Billion) | Params (Million) |
|---|---|---|---|---|
| RegNetY-16GF [33] | CNN | Simple stage-wise design (width/depth design space) + SE channel blocks | 15.9 | 83.6 |
| SE-ResNeXt101-32×8d [32] | CNN | Incorporates SE blocks for channel attention; improved feature recalibration | 16.5 | 93.6 |
| PVTv2-B5 [37] | Pyramid ViT | Linear-attention (reduced tokens); overlapping patch embedding; conv-FFN | 11.8 | 82 |
| Twins-SVT-L [35] | Pyramid ViT | Separable local/global attention (LSA + GSA); positional encoding | 15.1 | 99.2 |
| CSWin-B [36] | Hierarchical ViT | Cross-shaped window attention (horizontal + vertical stripes); Locally-enhanced PE | 15 | 78 |
| Swin-L [34] | Hierarchical ViT | Shifted local window self-attention; multi-stage/pyramid | 34.5 | 197 |
2.4. Performance Metrics
2.5. Explainability
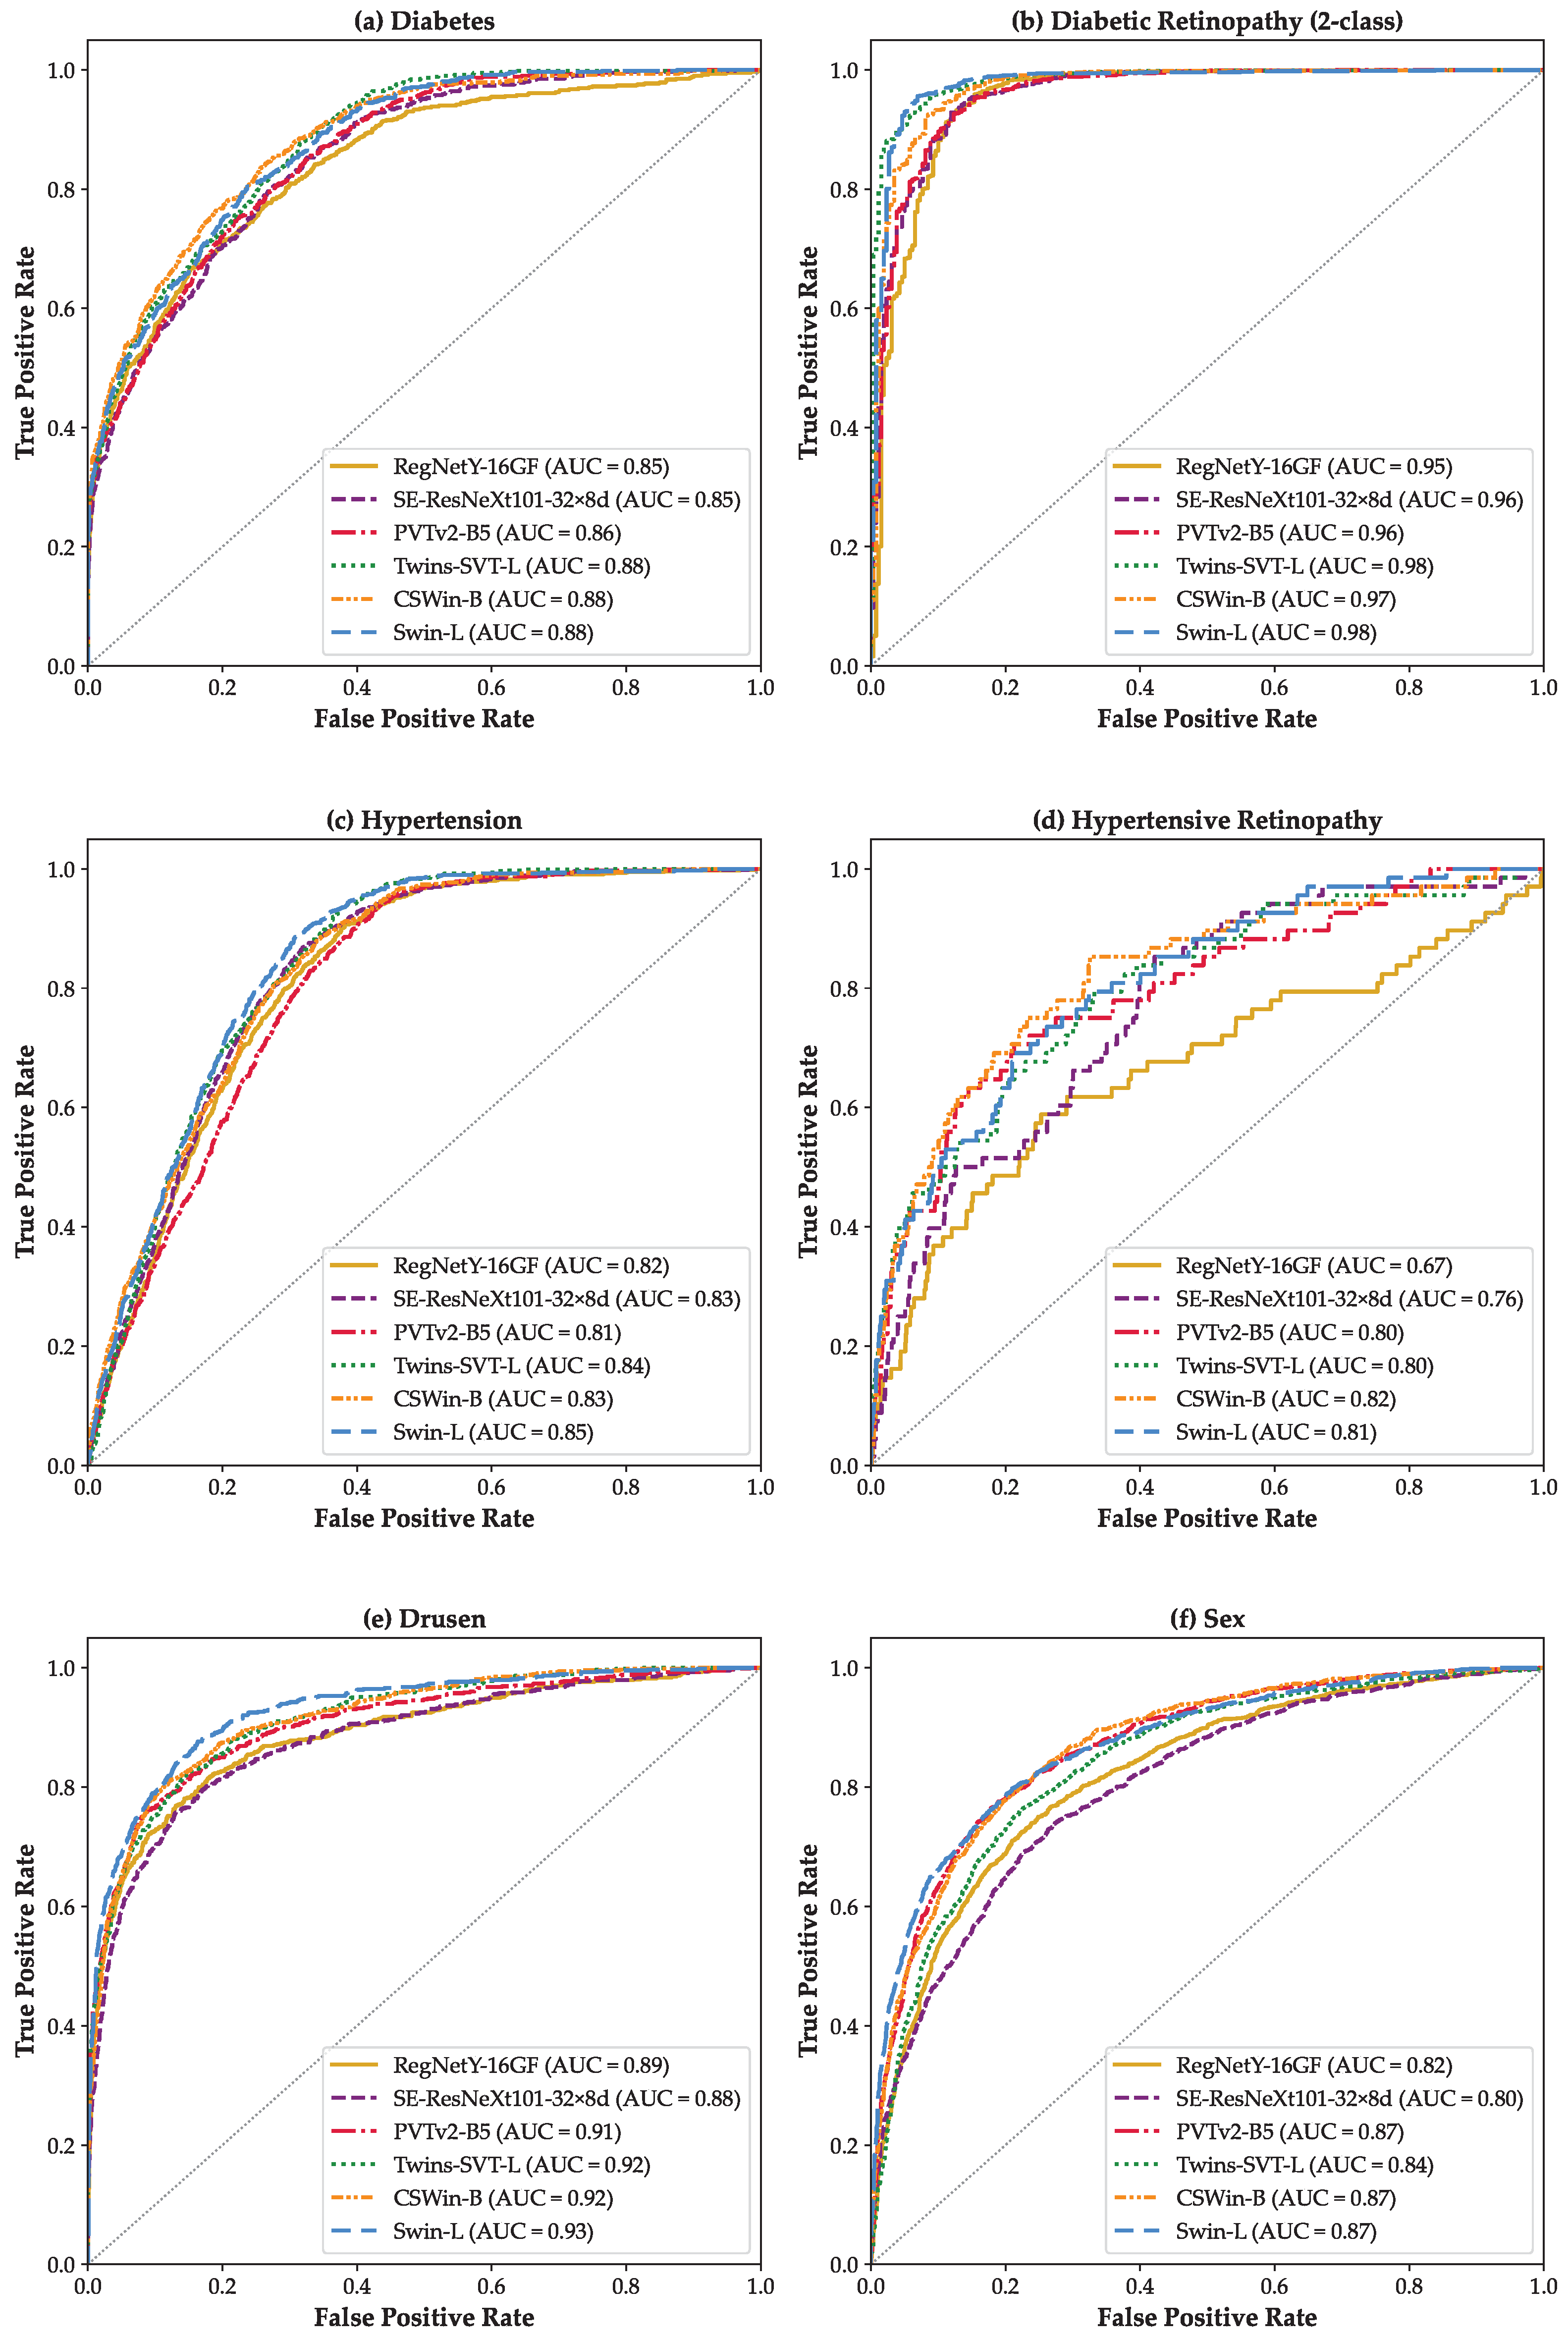
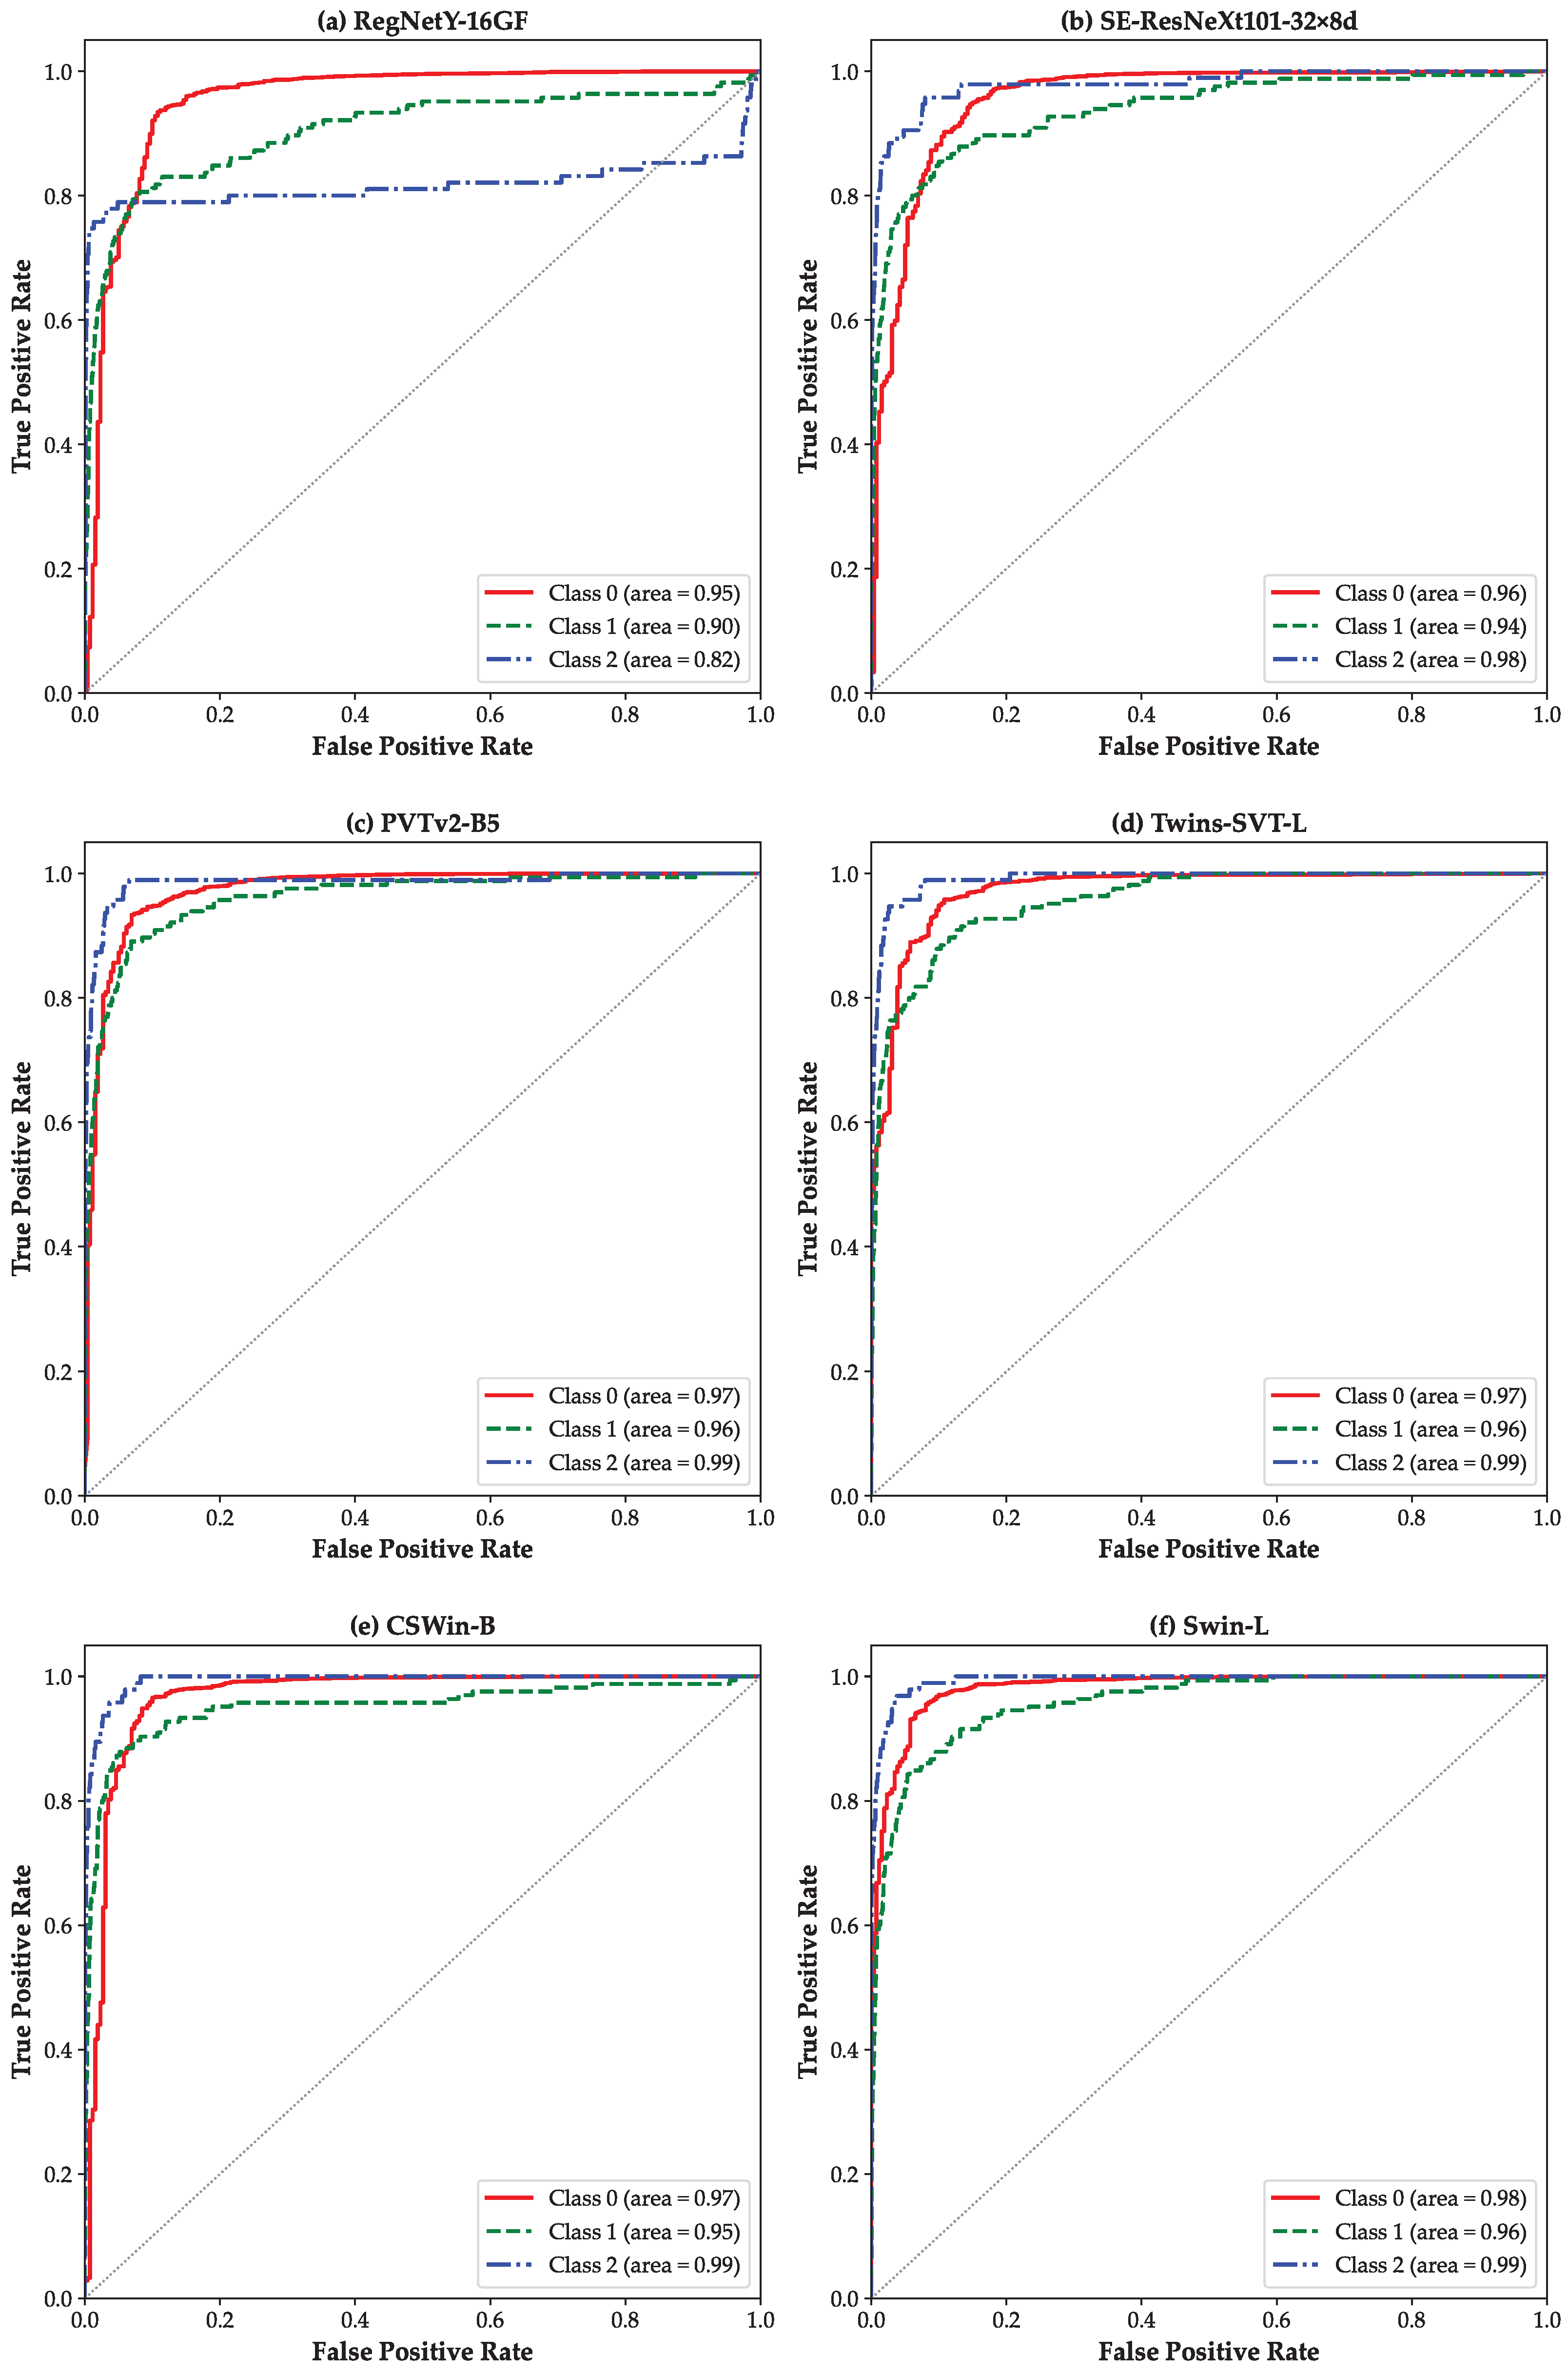
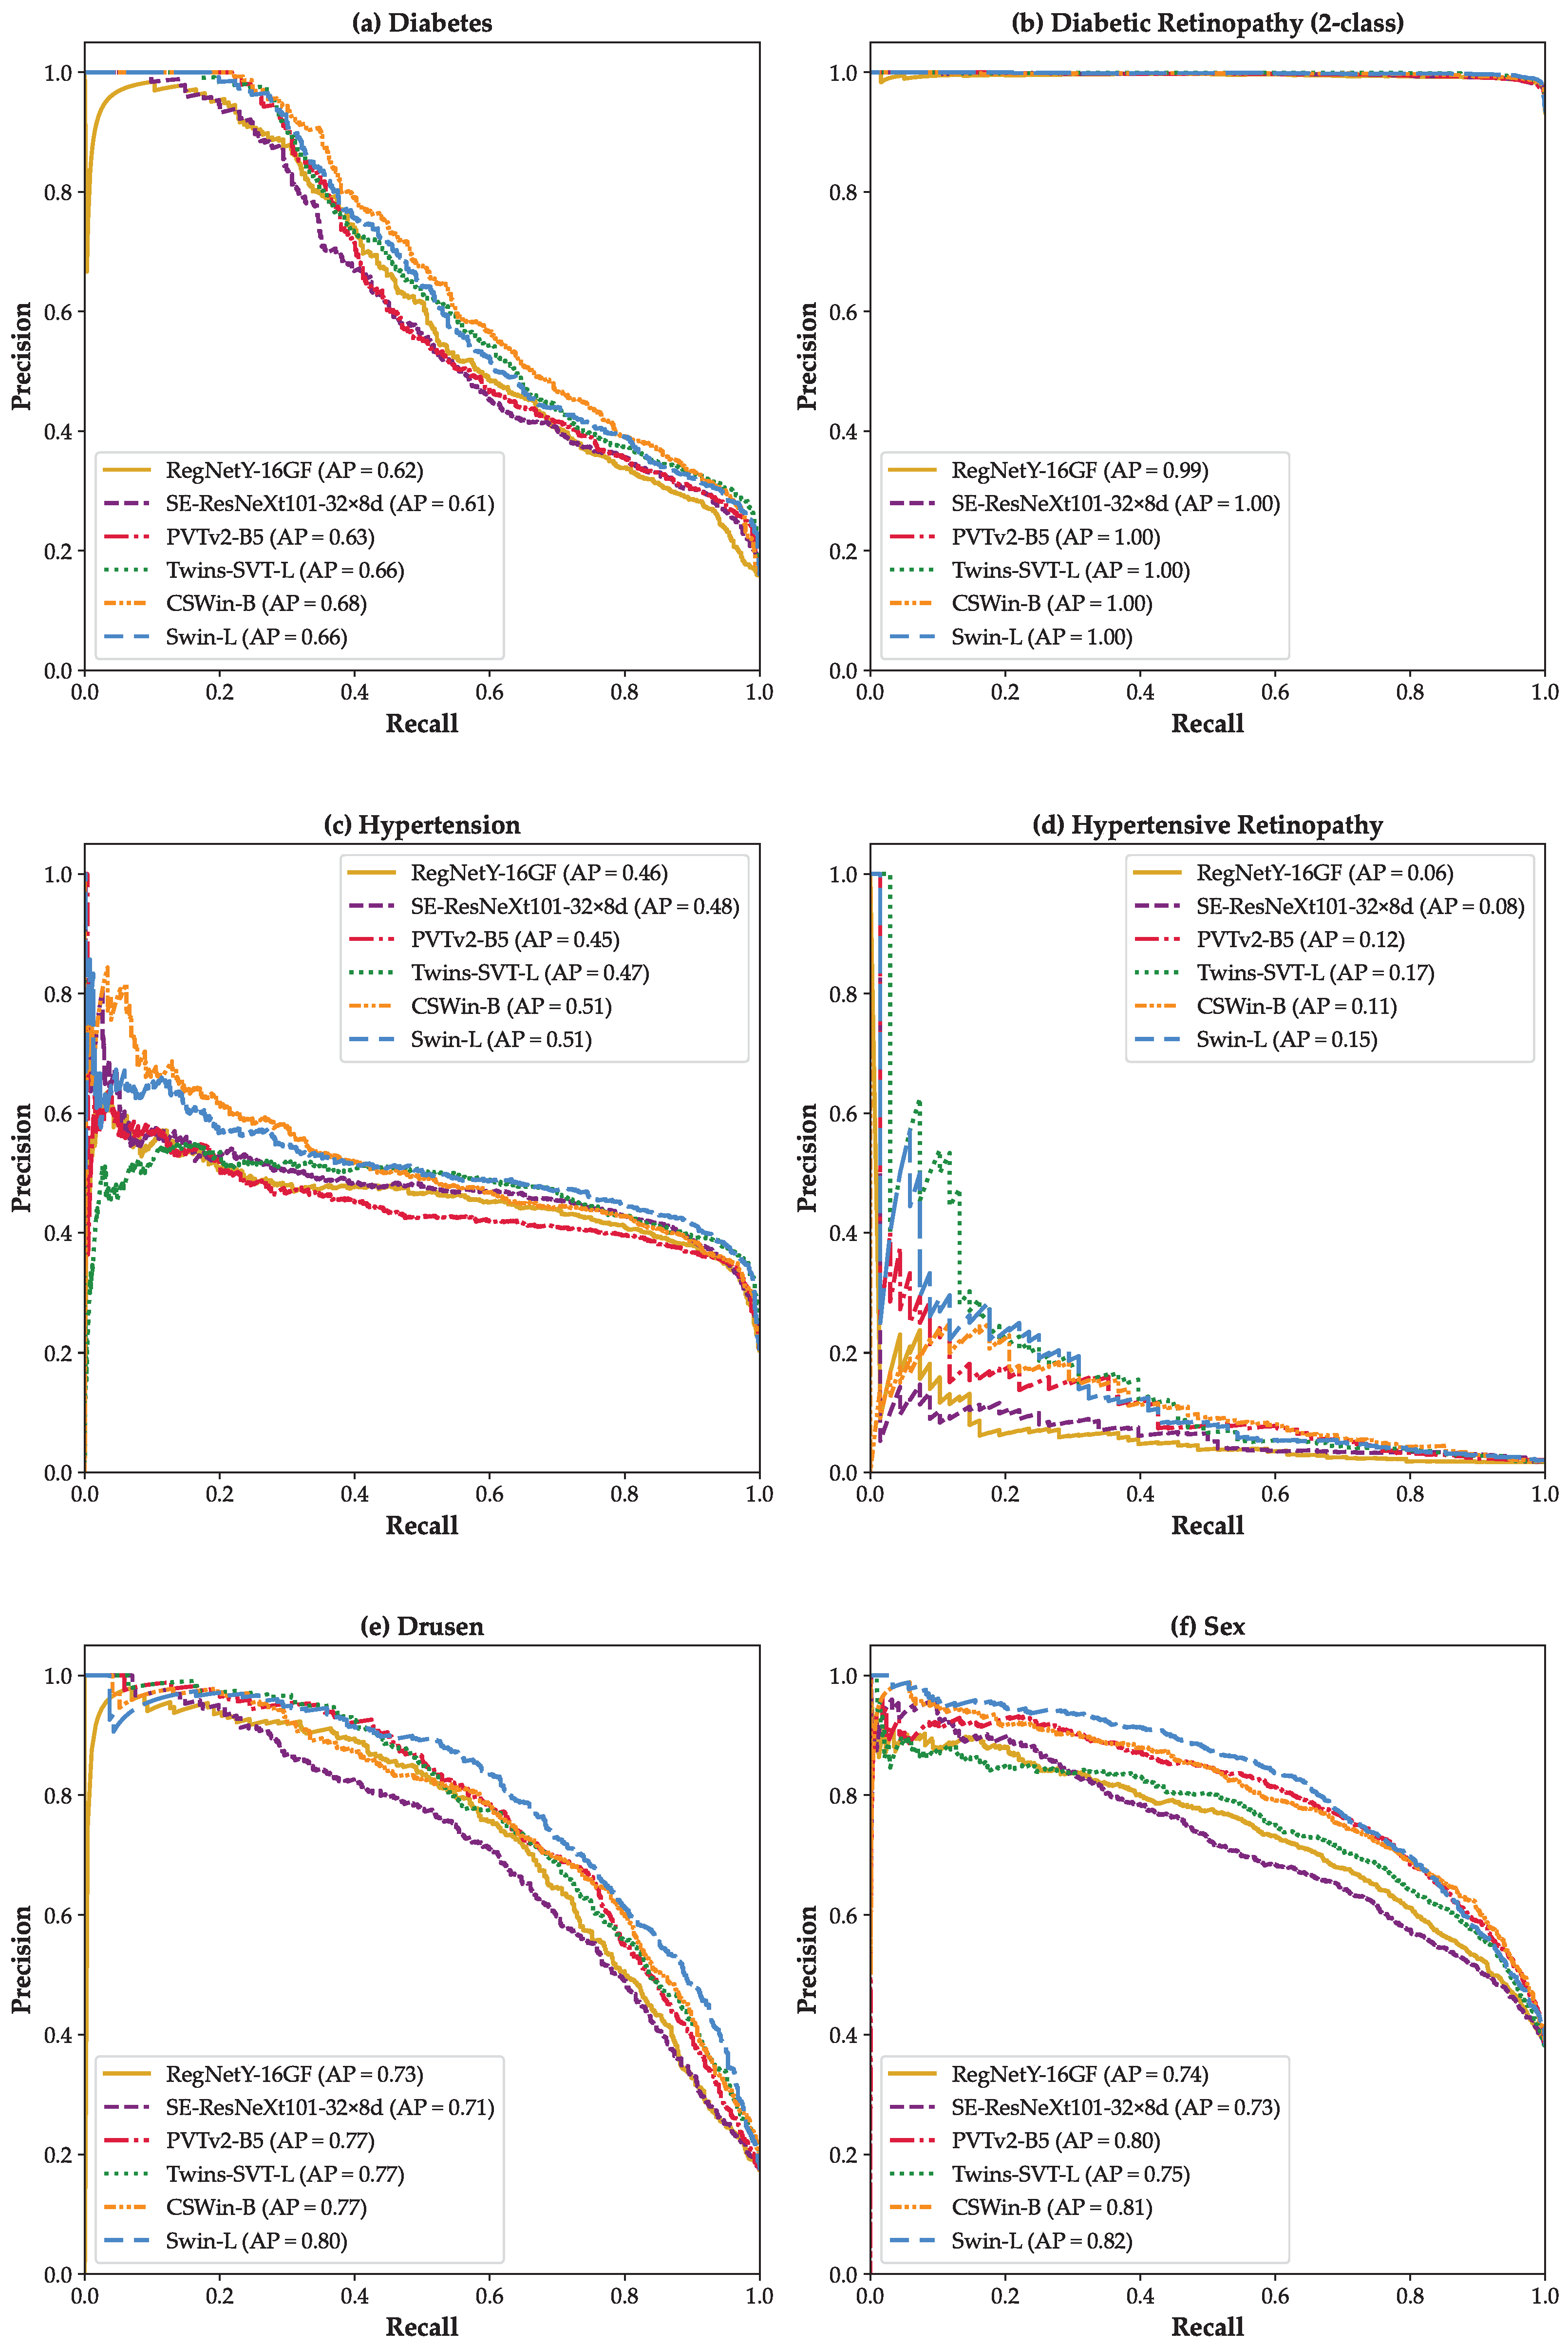
3. Results
4. Discussion
5. Conclusions
Author Contributions
Funding
Institutional Review Board Statement
Informed Consent Statement
Data Availability Statement
Acknowledgments
Conflicts of Interest
References
- Kropp, M.; Golubnitschaja, O.; Mazurakova, A.; Koklesova, L.; Sargheini, N.; Vo, T.T.K.S.; de Clerck, E.; Polivka, J., Jr.; Potuznik, P.; Polivka, J.; et al. Diabetic retinopathy as the leading cause of blindness and early predictor of cascading complications—Risks and mitigation. Epma J. 2023, 14, 21–42. [Google Scholar] [CrossRef] [PubMed]
- Sadda, S.R.; Schachat, A.P.; Wilkinson, C.P.; Hinton, D.R.; Wiedemann, P.; Freund, K.B.; Sarraf, D. Ryan’s Retina E-Book; Elsevier Health Sciences: Amsterdam, The Netherlands, 2022. [Google Scholar]
- Liew, G.; Xie, J.; Nguyen, H.; Keay, L.; Ikram, M.K.; McGeechan, K.; Klein, B.E.; Wang, J.J.; Mitchell, P.; Klaver, C.C.; et al. Hypertensive retinopathy and cardiovascular disease risk: 6 population-based cohorts meta-analysis. Int. J. Cardiol. Cardiovasc. Risk Prev. 2023, 17, 200180. [Google Scholar] [CrossRef]
- Boscia, G.; Bacherini, D.; Vujosevic, S.; Grassi, M.O.; Borrelli, E.; Giancipoli, E.; Landini, L.; Pignataro, M.; Alessio, G.; Boscia, F.; et al. Long-term impact of diabetic retinopathy on response to anti-VEGF treatment in neovascular AMD. Investig. Ophthalmol. Vis. Sci. 2024, 65, 6. [Google Scholar] [CrossRef]
- Ting, D.S.; Peng, L.; Varadarajan, A.V.; Keane, P.A.; Burlina, P.M.; Chiang, M.F.; Schmetterer, L.; Pasquale, L.R.; Bressler, N.M.; Webster, D.R.; et al. Deep learning in ophthalmology: The technical and clinical considerations. Prog. Retin. Eye Res. 2019, 72, 100759. [Google Scholar] [CrossRef] [PubMed]
- Everett, L.A.; Paulus, Y.M. Laser therapy in the treatment of diabetic retinopathy and diabetic macular edema. Curr. Diabetes Rep. 2021, 21, 35. [Google Scholar] [CrossRef] [PubMed]
- Leng, X.; Shi, R.; Wu, Y.; Zhu, S.; Cai, X.; Lu, X.; Liu, R. Deep learning for detection of age-related macular degeneration: A systematic review and meta-analysis of diagnostic test accuracy studies. PLoS ONE 2023, 18, e0284060. [Google Scholar] [CrossRef]
- Danis, R.P.; Lavine, J.A.; Domalpally, A. Geographic atrophy in patients with advanced dry age-related macular degeneration: Current challenges and future prospects. Clin. Ophthalmol. 2015, 9, 2159–2174. [Google Scholar] [CrossRef]
- Ambati, J.; Fowler, B.J. Mechanisms of age-related macular degeneration. Neuron 2012, 75, 26–39. [Google Scholar] [CrossRef]
- Naemi, A.; Schmidt, T.; Mansourvar, M.; Naghavi-Behzad, M.; Ebrahimi, A.; Wiil, U.K. Machine learning techniques for mortality prediction in emergency departments: A systematic review. BMJ Open 2021, 11, e052663. [Google Scholar] [CrossRef]
- Sahafi, A.; Koulaouzidis, A.; Lalinia, M. Polypoid lesion segmentation using YOLO-V8 network in wireless video capsule endoscopy images. Diagnostics 2024, 14, 474. [Google Scholar] [CrossRef]
- Sahafi, A.; Wang, Y.; Rasmussen, C.; Bollen, P.; Baatrup, G.; Blanes-Vidal, V.; Herp, J.; Nadimi, E. Edge artificial intelligence wireless video capsule endoscopy. Sci. Rep. 2022, 12, 13723. [Google Scholar] [CrossRef]
- Lalinia, M.; Sahafi, A. Colorectal polyp detection in colonoscopy images using YOLO-V8 network. Signal Image Video Process. 2024, 18, 2047–2058. [Google Scholar] [CrossRef]
- Gulshan, V.; Peng, L.; Coram, M.; Stumpe, M.C.; Wu, D.; Narayanaswamy, A.; Venugopalan, S.; Widner, K.; Madams, T.; Cuadros, J.; et al. Development and validation of a deep learning algorithm for detection of diabetic retinopathy in retinal fundus photographs. JAMA 2016, 316, 2402–2410. [Google Scholar] [CrossRef]
- Ting, D.S.W.; Cheung, C.Y.L.; Lim, G.; Tan, G.S.W.; Quang, N.D.; Gan, A.; Hamzah, H.; Garcia-Franco, R.; San Yeo, I.Y.; Lee, S.Y.; et al. Development and validation of a deep learning system for diabetic retinopathy and related eye diseases using retinal images from multiethnic populations with diabetes. JAMA 2017, 318, 2211–2223. [Google Scholar] [CrossRef] [PubMed]
- Keenan, T.D.; Dharssi, S.; Peng, Y.; Chen, Q.; Agrón, E.; Wong, W.T.; Lu, Z.; Chew, E.Y. A deep learning approach for automated detection of geographic atrophy from color fundus photographs. Ophthalmology 2019, 126, 1533–1540. [Google Scholar] [CrossRef] [PubMed]
- Keenan, T.D.; Chen, Q.; Peng, Y.; Domalpally, A.; Agron, E.; Hwang, C.K.; Thavikulwat, A.T.; Lee, D.H.; Li, D.; Wong, W.T.; et al. Deep learning automated detection of reticular pseudodrusen from fundus autofluorescence images or color fundus photographs in AREDS2. Ophthalmology 2020, 127, 1674–1687. [Google Scholar] [CrossRef]
- Pham, Q.T.; Ahn, S.; Song, S.J.; Shin, J. Automatic drusen segmentation for age-related macular degeneration in fundus images using deep learning. Electronics 2020, 9, 1617. [Google Scholar] [CrossRef]
- Sadek, I.; Elawady, M.; Shabayek, A.E.R. Automatic classification of bright retinal lesions via deep network features. arXiv 2017. [Google Scholar] [CrossRef]
- Abràmoff, M.D.; Lavin, P.T.; Birch, M.; Shah, N.; Folk, J.C. Pivotal trial of an autonomous AI-based diagnostic system for detection of diabetic retinopathy in primary care offices. NPJ Digit. Med. 2018, 1, 39. [Google Scholar] [CrossRef]
- Poplin, R.; Varadarajan, A.V.; Blumer, K.; Liu, Y.; McConnell, M.V.; Corrado, G.S.; Peng, L.; Webster, D.R. Prediction of cardiovascular risk factors from retinal fundus photographs via deep learning. Nat. Biomed. Eng. 2018, 2, 158–164. [Google Scholar] [CrossRef]
- Lee, T.K.; Kim, S.Y.; Choi, H.J.; Choe, E.K.; Sohn, K.A. Vision transformer based interpretable metabolic syndrome classification using retinal Images. NPJ Digit. Med. 2025, 8, 205. [Google Scholar] [CrossRef]
- Goh, J.H.L.; Ang, E.; Srinivasan, S.; Lei, X.; Loh, J.; Quek, T.C.; Xue, C.; Xu, X.; Liu, Y.; Cheng, C.Y.; et al. Comparative analysis of vision transformers and conventional convolutional neural networks in detecting referable diabetic retinopathy. Ophthalmol. Sci. 2024, 4, 100552. [Google Scholar] [CrossRef]
- Wang, D.; Lian, J.; Jiao, W. Multi-label classification of retinal disease via a novel vision transformer model. Front. Neurosci. 2024, 17, 1290803. [Google Scholar] [CrossRef]
- Zhou, Y.; Chia, M.A.; Wagner, S.K.; Ayhan, M.S.; Williamson, D.J.; Struyven, R.R.; Liu, T.; Xu, M.; Lozano, M.G.; Woodward-Court, P.; et al. A foundation model for generalizable disease detection from retinal images. Nature 2023, 622, 156–163. [Google Scholar] [CrossRef]
- Nakayama, L.F.; Goncalves, M.; Zago Ribeiro, L.; Santos, H.; Ferraz, D.; Malerbi, F.; Celi, L.A.; Regatieri, C. A Brazilian multilabel ophthalmological dataset (BRSET) (version 1.0.1). PhysioNet. RRID:SCR-007345. PhysioNet 2023. [Google Scholar]
- Wilkinson, C.P.; Ferris, F.L., III; Klein, R.E.; Lee, P.P.;; Agardh, C.D.; Davis, M.; Dills, D.; Kampik, A.; Pararajasegaram, R.; Verdaguer, J.T.; et al. Proposed international clinical diabetic retinopathy and diabetic macular edema disease severity scales. Ophthalmology 2003, 110, 1677–1682. [Google Scholar] [CrossRef]
- Nakayama, L.F.; Restrepo, D.; Matos, J.; Ribeiro, L.Z.; Malerbi, F.K.; Celi, L.A.; Regatieri, C.S. BRSET: A Brazilian multilabel ophthalmological dataset of retina fundus photos. PLoS Digit. Health 2024, 3, e0000454. [Google Scholar] [CrossRef] [PubMed]
- Wong, T.; Mitchell, P. The eye in hypertension. Lancet 2007, 369, 425–435. [Google Scholar] [CrossRef] [PubMed]
- Wong, W.L.; Su, X.; Li, X.; Cheung, C.M.G.; Klein, R.; Cheng, C.Y.; Wong, T.Y. Global prevalence of age-related macular degeneration and disease burden projection for 2020 and 2040: A systematic review and meta-analysis. Lancet Glob. Health 2014, 2, e106–e116. [Google Scholar] [CrossRef] [PubMed]
- Dosovitskiy, A.; Beyer, L.; Kolesnikov, A.; Weissenborn, D.; Zhai, X.; Unterthiner, T.; Dehghani, M.; Minderer, M.; Heigold, G.; Gelly, S.; et al. An image is worth 16x16 words: Transformers for image recognition at scale. arXiv 2020, arXiv:2010.11929. [Google Scholar]
- Hu, J.; Shen, L.; Sun, G. Squeeze-and-excitation networks. In Proceedings of the IEEE Conference on Computer Vision and Pattern Recognition, Salt Lake City, UT, USA, 18–22 June 2018; pp. 7132–7141. [Google Scholar]
- Radosavovic, I.; Kosaraju, R.P.; Girshick, R.; He, K.; Dollár, P. Designing network design spaces. In Proceedings of the IEEE/CVF Conference on Computer Vision and Pattern Recognition, Seattle, WA, USA, 14–19 June 2020; pp. 10428–10436. [Google Scholar]
- Liu, Z.; Lin, Y.; Cao, Y.; Hu, H.; Wei, Y.; Zhang, Z.; Lin, S.; Guo, B. Swin transformer: Hierarchical vision transformer using shifted windows. In Proceedings of the IEEE/CVF International Conference on Computer Vision, Montreal, QC, Canada, 11–17 October 2021; pp. 10012–10022. [Google Scholar]
- Chu, X.; Tian, Z.; Wang, Y.; Zhang, B.; Ren, H.; Wei, X.; Xia, H.; Shen, C. Twins: Revisiting the design of spatial attention in vision transformers. Adv. Neural Inf. Process. Syst. 2021, 34, 9355–9366. [Google Scholar]
- Dong, X.; Bao, J.; Chen, D.; Zhang, W.; Yu, N.; Yuan, L.; Chen, D.; Guo, B. Cswin transformer: A general vision transformer backbone with cross-shaped windows. In Proceedings of the IEEE/CVF Conference on Computer Vision and Pattern Recognition, New Orleans, LA, USA, 18–24 June 2022; pp. 12124–12134. [Google Scholar]
- Wang, W.; Xie, E.; Li, X.; Fan, D.P.; Song, K.; Liang, D.; Lu, T.; Luo, P.; Shao, L. Pvt v2: Improved baselines with pyramid vision transformer. Comput. Vis. Media 2022, 8, 415–424. [Google Scholar] [CrossRef]
- Kingma, D.P.; Ba, J. A method for stochastic optimization. arXiv 2014. [Google Scholar] [CrossRef]
- Shorten, C.; Khoshgoftaar, T.M. A survey on image data augmentation for deep learning. J. Big Data 2019, 6, 1–48. [Google Scholar] [CrossRef]
- Nair, V.; Hinton, G.E. Rectified linear units improve restricted boltzmann machines. In Proceedings of the 27th International Conference on Machine Learning (ICML-10), Haifa, Israel, 21–24 June 2010; pp. 807–814. [Google Scholar]
- Hendrycks, D.; Gimpel, K. Gaussian error linear units (gelus). arXiv 2016, arXiv:1606.08415. [Google Scholar]
- Deng, J.; Dong, W.; Socher, R.; Li, L.J.; Li, K.; Fei-Fei, L. Imagenet: A large-scale hierarchical image database. In Proceedings of the 2009 IEEE Conference on Computer Vision and Pattern Recognition, Miami, FL, USA, 20–25 June 2009; pp. 248–255. [Google Scholar]
- Simonyan, K.; Vedaldi, A.; Zisserman, A. Deep inside convolutional networks: Visualising image classification models and saliency maps. arXiv 2013, arXiv:1312.6034. [Google Scholar]
- Sundararajan, M.; Taly, A.; Yan, Q. Axiomatic attribution for deep networks. In Proceedings of the International Conference on Machine Learning, PMLR, Sydney, NSW, Australia, 6–11 August 2017; pp. 3319–3328. [Google Scholar]
- Kokhlikyan, N.; Miglani, V.; Martin, M.; Wang, E.; Alsallakh, B.; Reynolds, J.; Melnikov, A.; Kliushkina, N.; Araya, C.; Yan, S.; et al. Captum: A unified and generic model interpretability library for pytorch. arXiv 2020. [Google Scholar] [CrossRef]
- Lundberg, S.M.; Lee, S.I. A unified approach to interpreting model predictions. Adv. Neural Inf. Process. Syst. 2017, 30, 4768–4777. [Google Scholar]
- Takahashi, S.; Sakaguchi, Y.; Kouno, N.; Takasawa, K.; Ishizu, K.; Akagi, Y.; Aoyama, R.; Teraya, N.; Bolatkan, A.; Shinkai, N.; et al. Comparison of vision transformers and convolutional neural networks in medical image analysis: A systematic review. J. Med. Syst. 2024, 48, 84. [Google Scholar] [CrossRef]
- Mandrekar, J.N. Receiver operating characteristic curve in diagnostic test assessment. J. Thorac. Oncol. 2010, 5, 1315–1316. [Google Scholar] [CrossRef]
- Naemi, A.; Tashk, A.; Azar, A.S.; Samimi, T.; Tavassoli, G.; Mohasefi, A.B.; Khanshan, E.N.; Najafabad, M.H.; Tarighi, V.; Wiil, U.K.; et al. Applications of Artificial Intelligence for Metastatic Gastrointestinal Cancer: A Systematic Literature Review. Cancers 2025, 17, 558. [Google Scholar] [CrossRef]
- Szymkowski, M. Neural Networks and Saliency Maps in Diabetic Retinopathy Diagnosis. In Proceedings of the International Conference on Computer Information Systems and Industrial Management, Tokyo, Japan, 22–24 September 2023; pp. 298–309. [Google Scholar]
- Ayhan, M.S.; Kümmerle, L.B.; Kühlewein, L.; Inhoffen, W.; Aliyeva, G.; Ziemssen, F.; Berens, P. Clinical validation of saliency maps for understanding deep neural networks in ophthalmology. Med Image Anal. 2022, 77, 102364. [Google Scholar] [CrossRef]
- Nur, N.; Tjandrasa, H. Exudate segmentation in retinal images of diabetic retinopathy using saliency method based on region. J. Phys. Conf. Ser. 2018, 1108, 012110. [Google Scholar] [CrossRef]
- Yan, Q.; Zhao, Y.; Zheng, Y.; Liu, Y.; Zhou, K.; Frangi, A.; Liu, J. Automated retinal lesion detection via image saliency analysis. Med. Phys. 2019, 46, 4531–4544. [Google Scholar] [CrossRef] [PubMed]
- Gould, D.S.; Yang, J.; Clifton, D.A. Deep learning for multi-label disease classification of retinal images: Insights from brazilian data for ai development in lower-middle income countries. medRxiv 2024. [Google Scholar]
- Wu, C.; Yang, X.; Gilkes, E.G.; Cui, H.; Choi, J.; Sun, N.; Liao, Z.; Fan, B.; Santillana, M.; Celi, L.; et al. De-identification and obfuscation of gender attributes from retinal scans. In Proceedings of the Workshop on Clinical Image-Based Procedures, Vancouver, BC, Canada, 8–12 October 2023; pp. 91–101. [Google Scholar]
| Label | Image Numbers | Percentage (%) |
|---|---|---|
| Normal | 11,001 | 67.63 |
| Diabetes | 2579 | 15.85 |
| Diabetic Retinopathy | 1070 | 65.80 |
| Hypertension | 3320 | 20.41 |
| Hypertensive Retinopathy | 284 | 1.75 |
| Drusen | 2833 | 17.42 |
| AMD | 299 | 1.84 |
| Sex | 10,052 (Female) | 61.80 |
| Parameter | Value |
|---|---|
| Input Image Size | |
| Batch Size | 16 |
| Learning Rate | 1 × 10⁻⁵ |
| Optimizer | Adam |
| Maximum Epochs | 50 |
| Early Stopping | Enabled (patience = 7) |
| Loss Function | Weighted Cross-Entropy Loss (with class weights) |
| Weight Decay | Not used |
| Data Augmentation | Random Crop, Horizontal Flip, Rotation |
| Activation Function | ReLU (CNNs)/GELU (ViTs) |
| Fine-Tuning | Full fine-tuning (all layers trained) |
| Pre-trained Weights | ImageNet-1K |
| Learning Rate Scheduler | None (fixed learning rate) |
| Random Seed | 42 |
| Framework | PyTorch v2.6.0 |
| Label | Model | Class | Precision | Recall | F1 | Accuracy | AUC |
|---|---|---|---|---|---|---|---|
| Diabetes | RegNetY-16GF | 0 | 0.92 | 0.90 | 0.91 | 0.85 | 0.85 |
| 1 | 0.52 | 0.57 | 0.54 | ||||
| macro | 0.72 | 0.74 | 0.73 | ||||
| weighted | 0.85 | 0.85 | 0.85 | ||||
| SE-ResNeXt101 -32×8d | 0 | 0.93 | 0.82 | 0.87 | 0.80 | 0.85 | |
| 1 | 0.41 | 0.69 | 0.52 | ||||
| macro | 0.67 | 0.75 | 0.69 | ||||
| weighted | 0.85 | 0.80 | 0.81 | ||||
| PVTv2-B5 | 0 | 0.93 | 0.84 | 0.88 | 0.81 | 0.86 | |
| 1 | 0.44 | 0.66 | 0.53 | ||||
| macro | 0.68 | 0.75 | 0.70 | ||||
| weighted | 0.85 | 0.81 | 0.83 | ||||
| Twins-SVT-L | 0 | 0.93 | 0.89 | 0.91 | 0.85 | 0.88 | |
| 1 | 0.51 | 0.63 | 0.56 | ||||
| macro | 0.72 | 0.76 | 0.73 | ||||
| weighted | 0.86 | 0.85 | 0.85 | ||||
| CSWin-B | 0 | 0.94 | 0.86 | 0.89 | 0.83 | 0.88 | |
| 1 | 0.47 | 0.69 | 0.56 | ||||
| macro | 0.71 | 0.77 | 0.73 | ||||
| weighted | 0.86 | 0.83 | 0.84 | ||||
| Swin-L | 0 | 0.92 | 0.92 | 0.92 | 0.86 | 0.88 | |
| 1 | 0.57 | 0.57 | 0.57 | ||||
| macro | 0.74 | 0.74 | 0.74 | ||||
| weighted | 0.86 | 0.86 | 0.86 | ||||
| Diabetic Retinopathy (2-class) | RegNetY-16GF | 0 | 0.99 | 0.97 | 0.98 | 0.96 | 0.95 |
| 1 | 0.65 | 0.82 | 0.73 | ||||
| macro | 0.82 | 0.90 | 0.85 | ||||
| weighted | 0.96 | 0.96 | 0.96 | ||||
| SE-ResNeXt101 -32×8d | 0 | 0.99 | 0.96 | 0.97 | 0.95 | 0.96 | |
| 1 | 0.61 | 0.80 | 0.69 | ||||
| macro | 0.80 | 0.88 | 0.83 | ||||
| weighted | 0.96 | 0.95 | 0.96 | ||||
| PVTv2-B5 | 0 | 0.97 | 0.99 | 0.98 | 0.97 | 0.96 | |
| 1 | 0.86 | 0.63 | 0.73 | ||||
| macro | 0.92 | 0.81 | 0.86 | ||||
| weighted | 0.97 | 0.97 | 0.97 | ||||
| Twins-SVT-L | 0 | 0.99 | 0.97 | 0.98 | 0.96 | 0.98 | |
| 1 | 0.65 | 0.88 | 0.75 | ||||
| macro | 0.82 | 0.93 | 0.86 | ||||
| weighted | 0.97 | 0.96 | 0.96 | ||||
| CSWin-B | 0 | 0.99 | 0.96 | 0.97 | 0.95 | 0.97 | |
| 1 | 0.59 | 0.87 | 0.70 | ||||
| macro | 0.79 | 0.91 | 0.84 | ||||
| weighted | 0.96 | 0.95 | 0.96 | ||||
| Swin-L | 0 | 0.99 | 0.95 | 0.97 | 0.95 | 0.98 | |
| 1 | 0.56 | 0.93 | 0.70 | ||||
| macro | 0.78 | 0.94 | 0.84 | ||||
| weighted | 0.97 | 0.95 | 0.95 | ||||
| Diabetic Retinopathy (3-class) | RegNetY-16GF | 0 | 0.99 | 0.96 | 0.97 | 0.94 | 0.95 |
| 1 | 0.43 | 0.75 | 0.54 | 0.90 | |||
| 2 | 0.74 | 0.72 | 0.73 | 0.82 | |||
| macro | 0.72 | 0.81 | 0.75 | 0.89 | |||
| weighted | 0.96 | 0.94 | 0.95 | 0.95 | |||
| SE-ResNeXt101 -32×8d | 0 | 0.98 | 0.98 | 0.98 | 0.96 | 0.96 | |
| 1 | 0.60 | 0.67 | 0.63 | 0.94 | |||
| 2 | 0.81 | 0.64 | 0.72 | 0.98 | |||
| macro | 0.80 | 0.77 | 0.78 | 0.96 | |||
| weighted | 0.96 | 0.96 | 0.96 | 0.96 | |||
| PVTv2-B5 | 0 | 0.98 | 0.98 | 0.98 | 0.96 | 0.97 | |
| 1 | 0.65 | 0.65 | 0.65 | 0.96 | |||
| 2 | 0.74 | 0.74 | 0.74 | 0.99 | |||
| macro | 0.79 | 0.79 | 0.79 | 0.97 | |||
| weighted | 0.96 | 0.96 | 0.96 | 0.97 | |||
| Twins-SVT-L | 0 | 0.99 | 0.97 | 0.98 | 0.95 | 0.97 | |
| 1 | 0.58 | 0.71 | 0.64 | 0.96 | |||
| 2 | 0.57 | 0.88 | 0.69 | 0.99 | |||
| macro | 0.71 | 0.85 | 0.77 | 0.97 | |||
| weighted | 0.96 | 0.95 | 0.96 | 0.97 | |||
| CSWin-B | 0 | 0.99 | 0.98 | 0.98 | 0.96 | 0.97 | |
| 1 | 0.58 | 0.80 | 0.67 | 0.95 | |||
| 2 | 0.81 | 0.76 | 0.78 | 0.99 | |||
| macro | 0.79 | 0.84 | 0.81 | 0.97 | |||
| weighted | 0.97 | 0.96 | 0.96 | 0.97 | |||
| Swin-L | 0 | 0.99 | 0.95 | 0.97 | 0.94 | 0.98 | |
| 1 | 0.49 | 0.76 | 0.59 | 0.96 | |||
| 2 | 0.56 | 0.89 | 0.69 | 0.99 | |||
| macro | 0.68 | 0.87 | 0.75 | 0.98 | |||
| weighted | 0.96 | 0.94 | 0.95 | 0.98 | |||
| Hypertension | RegNetY-16GF | 0 | 0.92 | 0.73 | 0.82 | 0.74 | 0.82 |
| 1 | 0.42 | 0.75 | 0.54 | ||||
| macro | 0.67 | 0.74 | 0.68 | ||||
| weighted | 0.82 | 0.74 | 0.76 | ||||
| SE-ResNeXt101 -32×8d | 0 | 0.90 | 0.80 | 0.85 | 0.77 | 0.83 | |
| 1 | 0.46 | 0.67 | 0.54 | ||||
| macro | 0.68 | 0.73 | 0.69 | ||||
| weighted | 0.81 | 0.77 | 0.78 | ||||
| PVTv2-B5 | 0 | 0.91 | 0.73 | 0.81 | 0.73 | 0.81 | |
| 1 | 0.41 | 0.72 | 0.52 | ||||
| macro | 0.66 | 0.73 | 0.66 | ||||
| weighted | 0.81 | 0.73 | 0.75 | ||||
| Twins-SVT-L | 0 | 0.94 | 0.70 | 0.80 | 0.72 | 0.84 | |
| 1 | 0.41 | 0.84 | 0.55 | ||||
| macro | 0.68 | 0.77 | 0.68 | ||||
| weighted | 0.84 | 0.72 | 0.75 | ||||
| CSWin-B | 0 | 0.92 | 0.76 | 0.83 | 0.75 | 0.83 | |
| 1 | 0.44 | 0.75 | 0.55 | ||||
| macro | 0.68 | 0.75 | 0.69 | ||||
| weighted | 0.82 | 0.75 | 0.77 | ||||
| Swin-L | 0 | 0.91 | 0.81 | 0.85 | 0.78 | 0.85 | |
| 1 | 0.47 | 0.68 | 0.56 | ||||
| macro | 0.69 | 0.74 | 0.71 | ||||
| weighted | 0.82 | 0.78 | 0.79 | ||||
| Hypertensive Retinopathy | RegNetY-16GF | 0 | 0.99 | 0.93 | 0.96 | 0.92 | 0.67 |
| 1 | 0.07 | 0.28 | 0.11 | ||||
| macro | 0.53 | 0.61 | 0.54 | ||||
| weighted | 0.97 | 0.92 | 0.95 | ||||
| SE-ResNeXt101 -32×8d | 0 | 0.99 | 0.96 | 0.97 | 0.95 | 0.76 | |
| 1 | 0.09 | 0.22 | 0.13 | ||||
| macro | 0.54 | 0.59 | 0.55 | ||||
| weighted | 0.97 | 0.95 | 0.96 | ||||
| PVTv2-B5 | 0 | 0.99 | 0.98 | 0.98 | 0.97 | 0.80 | |
| 1 | 0.15 | 0.22 | 0.18 | ||||
| macro | 0.57 | 0.60 | 0.58 | ||||
| weighted | 0.97 | 0.97 | 0.97 | ||||
| Twins-SVT-L | 0 | 0.99 | 0.98 | 0.98 | 0.97 | 0.80 | |
| 1 | 0.21 | 0.25 | 0.23 | ||||
| macro | 0.60 | 0.62 | 0.61 | ||||
| weighted | 0.97 | 0.97 | 0.97 | ||||
| CSWin-B | 0 | 0.99 | 0.96 | 0.98 | 0.95 | 0.82 | |
| 1 | 0.15 | 0.37 | 0.21 | ||||
| macro | 0.57 | 0.67 | 0.59 | ||||
| weighted | 0.97 | 0.95 | 0.96 | ||||
| Swin-L | 0 | 0.99 | 0.98 | 0.98 | 0.97 | 0.81 | |
| 1 | 0.20 | 0.25 | 0.22 | ||||
| macro | 0.59 | 0.62 | 0.60 | ||||
| weighted | 0.97 | 0.97 | 0.97 | ||||
| Drusen | RegNetY-16GF | 0 | 0.93 | 0.95 | 0.94 | 0.89 | 0.89 |
| 1 | 0.72 | 0.65 | 0.68 | ||||
| macro | 0.82 | 0.80 | 0.81 | ||||
| weighted | 0.89 | 0.89 | 0.89 | ||||
| SE-ResNeXt101 -32×8d | 0 | 0.93 | 0.93 | 0.93 | 0.88 | 0.88 | |
| 1 | 0.65 | 0.66 | 0.65 | ||||
| macro | 0.79 | 0.79 | 0.79 | ||||
| weighted | 0.88 | 0.88 | 0.88 | ||||
| PVTv2-B5 | 0 | 0.94 | 0.93 | 0.94 | 0.89 | 0.91 | |
| 1 | 0.69 | 0.71 | 0.70 | ||||
| macro | 0.81 | 0.82 | 0.82 | ||||
| weighted | 0.89 | 0.89 | 0.89 | ||||
| Twins-SVT-L | 0 | 0.93 | 0.95 | 0.94 | 0.90 | 0.92 | |
| 1 | 0.73 | 0.66 | 0.69 | ||||
| macro | 0.83 | 0.80 | 0.82 | ||||
| weighted | 0.89 | 0.90 | 0.90 | ||||
| CSWin-B | 0 | 0.95 | 0.92 | 0.93 | 0.89 | 0.92 | |
| 1 | 0.66 | 0.75 | 0.70 | ||||
| macro | 0.80 | 0.83 | 0.82 | ||||
| weighted | 0.90 | 0.89 | 0.89 | ||||
| Swin-L | 0 | 0.94 | 0.94 | 0.94 | 0.90 | 0.93 | |
| 1 | 0.73 | 0.70 | 0.71 | ||||
| macro | 0.83 | 0.82 | 0.83 | ||||
| weighted | 0.90 | 0.90 | 0.90 | ||||
| Sex | RegNetY-16GF | 0 | 0.85 | 0.68 | 0.75 | 0.73 | 0.82 |
| 1 | 0.61 | 0.80 | 0.69 | ||||
| macro | 0.73 | 0.74 | 0.72 | ||||
| weighted | 0.76 | 0.73 | 0.73 | ||||
| SE-ResNeXt101 -32×8d | 0 | 0.79 | 0.79 | 0.79 | 0.74 | 0.80 | |
| 1 | 0.66 | 0.66 | 0.66 | ||||
| macro | 0.73 | 0.73 | 0.73 | ||||
| weighted | 0.74 | 0.74 | 0.74 | ||||
| PVTv2-B5 | 0 | 0.89 | 0.67 | 0.76 | 0.75 | 0.87 | |
| 1 | 0.62 | 0.87 | 0.72 | ||||
| macro | 0.76 | 0.77 | 0.74 | ||||
| weighted | 0.79 | 0.75 | 0.75 | ||||
| Twins-SVT-L | 0 | 0.87 | 0.69 | 0.77 | 0.74 | 0.84 | |
| 1 | 0.62 | 0.83 | 0.71 | ||||
| macro | 0.75 | 0.76 | 0.74 | ||||
| weighted | 0.77 | 0.74 | 0.75 | ||||
| CSWin-B | 0 | 0.84 | 0.82 | 0.83 | 0.80 | 0.87 | |
| 1 | 0.72 | 0.75 | 0.74 | ||||
| macro | 0.78 | 0.79 | 0.78 | ||||
| weighted | 0.80 | 0.80 | 0.80 | ||||
| Swin-L | 0 | 0.85 | 0.83 | 0.84 | 0.80 | 0.87 | |
| 1 | 0.73 | 0.76 | 0.74 | ||||
| macro | 0.79 | 0.79 | 0.79 | ||||
| weighted | 0.80 | 0.80 | 0.80 |
| Model | Inference Time per Image (Batch = 1) | Inference Time per Image (Batch = 16) | Average Time for Saliency Map Generation per Image (Batch = 1) |
|---|---|---|---|
| RegNetY-16GF | 13.80 | 9.60 | 50.95 |
| SE-ResNeXt101-32×8d | 27.58 | 11.93 | 85.47 |
| PVTv2-B5 | 43.35 | 9.97 | 136.71 |
| Twins-SVT-L | 20.15 | 10.74 | 67.52 |
| CSWin-B | 68.56 | 13.56 | 204.82 |
| Swin-L | 32.91 | 24.41 | 87.83 |
| Label | Model | Class | Precision | Recall | F1 | Accuracy | AUC |
|---|---|---|---|---|---|---|---|
| Diabetes | ConvNext V2 Large [26] | 0 | - | - | - | - | 0.87 |
| 1 | - | - | - | ||||
| macro | - | - | 0.70 | ||||
| weighted | - | - | - | ||||
| Our Study (Best Model) | 0 | 0.92 | 0.92 | 0.92 | 0.86 | 0.88 | |
| 1 | 0.57 | 0.57 | 0.57 | ||||
| macro | 0.74 | 0.74 | 0.74 | ||||
| weighted | 0.86 | 0.86 | 0.86 | ||||
| Diabetic Retinopathy (2-class) | ConvNext V2 Large [26] | 0 | - | - | - | - | 0.97 |
| 1 | - | - | - | ||||
| macro | - | - | 0.89 | ||||
| weighted | - | - | - | ||||
| ResNet 50 [54] | 0 | - | - | - | 0.97 | 0.97 | |
| 1 | - | - | - | ||||
| macro | 0.86 | 0.78 | 0.82 | ||||
| weighted | - | - | - | ||||
| Our Study (Best Model) | 0 | 0.99 | 0.95 | 0.97 | 0.95 | 0.98 | |
| 1 | 0.56 | 0.93 | 0.70 | ||||
| macro | 0.78 | 0.94 | 0.84 | ||||
| weighted | 0.97 | 0.95 | 0.95 | ||||
| Diabetic Retinopathy (3-class) | ConvNext V2 Large [26] | 0 | - | - | - | - | 0.97 |
| 1 | - | - | - | ||||
| 2 | - | - | - | ||||
| macro | - | - | 0.82 | ||||
| weighted | - | - | - | ||||
| ResNet-200D [55] | 0 | 0.99 | 0.99 | 0.99 | - | 0.95 | |
| 1 | 0.73 | 0.73 | 0.73 | ||||
| 2 | 0.81 | 0.70 | 0.75 | ||||
| macro | 0.84 | 0.81 | 0.83 | ||||
| weighted | - | - | - | ||||
| Our Study (Best Model) | 0 | 0.99 | 0.95 | 0.97 | 0.94 | 0.98 | |
| 1 | 0.49 | 0.76 | 0.59 | ||||
| 2 | 0.56 | 0.89 | 0.69 | ||||
| macro | 0.68 | 0.87 | 0.75 | ||||
| weighted | 0.96 | 0.94 | 0.95 | ||||
| Hypertension | Our Study (Best Model) | 0 | 0.91 | 0.81 | 0.85 | 0.78 | 0.85 |
| 1 | 0.47 | 0.68 | 0.56 | ||||
| macro | 0.69 | 0.74 | 0.71 | ||||
| weighted | 0.82 | 0.78 | 0.79 | ||||
| Hypertensive Retinopathy | ResNet 50 [54] | 0 | - | - | - | 0.95 | 0.76 |
| 1 | - | - | - | ||||
| macro | 0.10 | 0.27 | 0.08 | ||||
| weighted | - | - | - | ||||
| Our Study (Best Model) | 0 | 0.99 | 0.98 | 0.98 | 0.97 | 0.81 | |
| 1 | 0.20 | 0.25 | 0.22 | ||||
| macro | 0.59 | 0.62 | 0.60 | ||||
| weighted | 0.97 | 0.97 | 0.97 | ||||
| Drusen | ResNet 50 [54] | 0 | - | - | - | 0.87 | 0.92 |
| 1 | - | - | - | ||||
| macro | 0.73 | 0.80 | 0.76 | ||||
| weighted | - | - | - | ||||
| Our Study (Best Model) | 0 | 0.94 | 0.94 | 0.94 | 0.90 | 0.93 | |
| 1 | 0.73 | 0.70 | 0.71 | ||||
| macro | 0.83 | 0.82 | 0.83 | ||||
| weighted | 0.90 | 0.90 | 0.90 | ||||
| Sex | ConvNext V2 Large [26] | 0 | - | - | - | - | 0.91 |
| 1 | - | - | - | ||||
| macro | - | - | 0.83 | ||||
| weighted | - | - | - | ||||
| ResNet-200D [55] | 0 | - | - | - | 0.75 | 0.80 | |
| 1 | - | - | - | ||||
| macro | - | - | - | ||||
| weighted | - | - | - | ||||
| Our Study (Best Model) | 0 | 0.85 | 0.83 | 0.84 | 0.80 | 0.87 | |
| 1 | 0.73 | 0.76 | 0.74 | ||||
| macro | 0.79 | 0.79 | 0.79 | ||||
| weighted | 0.80 | 0.80 | 0.80 |
Disclaimer/Publisher’s Note: The statements, opinions and data contained in all publications are solely those of the individual author(s) and contributor(s) and not of MDPI and/or the editor(s). MDPI and/or the editor(s) disclaim responsibility for any injury to people or property resulting from any ideas, methods, instructions or products referred to in the content. |
© 2025 by the authors. Licensee MDPI, Basel, Switzerland. This article is an open access article distributed under the terms and conditions of the Creative Commons Attribution (CC BY) license (https://creativecommons.org/licenses/by/4.0/).
Share and Cite
Aghabeigi Alooghareh, M.M.; Sheikhey, M.M.; Sahafi, A.; Pirnejad, H.; Naemi, A. Deep Learning for Comprehensive Analysis of Retinal Fundus Images: Detection of Systemic and Ocular Conditions. Bioengineering 2025, 12, 840. https://doi.org/10.3390/bioengineering12080840
Aghabeigi Alooghareh MM, Sheikhey MM, Sahafi A, Pirnejad H, Naemi A. Deep Learning for Comprehensive Analysis of Retinal Fundus Images: Detection of Systemic and Ocular Conditions. Bioengineering. 2025; 12(8):840. https://doi.org/10.3390/bioengineering12080840
Chicago/Turabian StyleAghabeigi Alooghareh, Mohammad Mahdi, Mohammad Mohsen Sheikhey, Ali Sahafi, Habibollah Pirnejad, and Amin Naemi. 2025. "Deep Learning for Comprehensive Analysis of Retinal Fundus Images: Detection of Systemic and Ocular Conditions" Bioengineering 12, no. 8: 840. https://doi.org/10.3390/bioengineering12080840
APA StyleAghabeigi Alooghareh, M. M., Sheikhey, M. M., Sahafi, A., Pirnejad, H., & Naemi, A. (2025). Deep Learning for Comprehensive Analysis of Retinal Fundus Images: Detection of Systemic and Ocular Conditions. Bioengineering, 12(8), 840. https://doi.org/10.3390/bioengineering12080840