
A Multi-Stage Framework for Kawasaki Disease Prediction Using Clustering-Based Undersampling and Synthetic Data Augmentation: Cross-Institutional Validation with Dual-Center Clinical Data in Taiwan

 , ,
, ,  ,
,
Abstract
1. Introduction
2. Materials and Methods
2.1. Data Sources
2.2. Preprocessing

| Distance Metric | Original Positives | Retained Negatives | Augmented Samples | Final Positives | Pos/Neg Ratio |
|---|---|---|---|---|---|
| Euclidean | 913 | 52,454 | 1296 | 2186 | 1:24 |
| Manhattan | 913 | 52,287 | 1290 | 2178 | 1:24 |
| Cosine | 913 | 43,817 | 951 | 1826 | 1:24 |
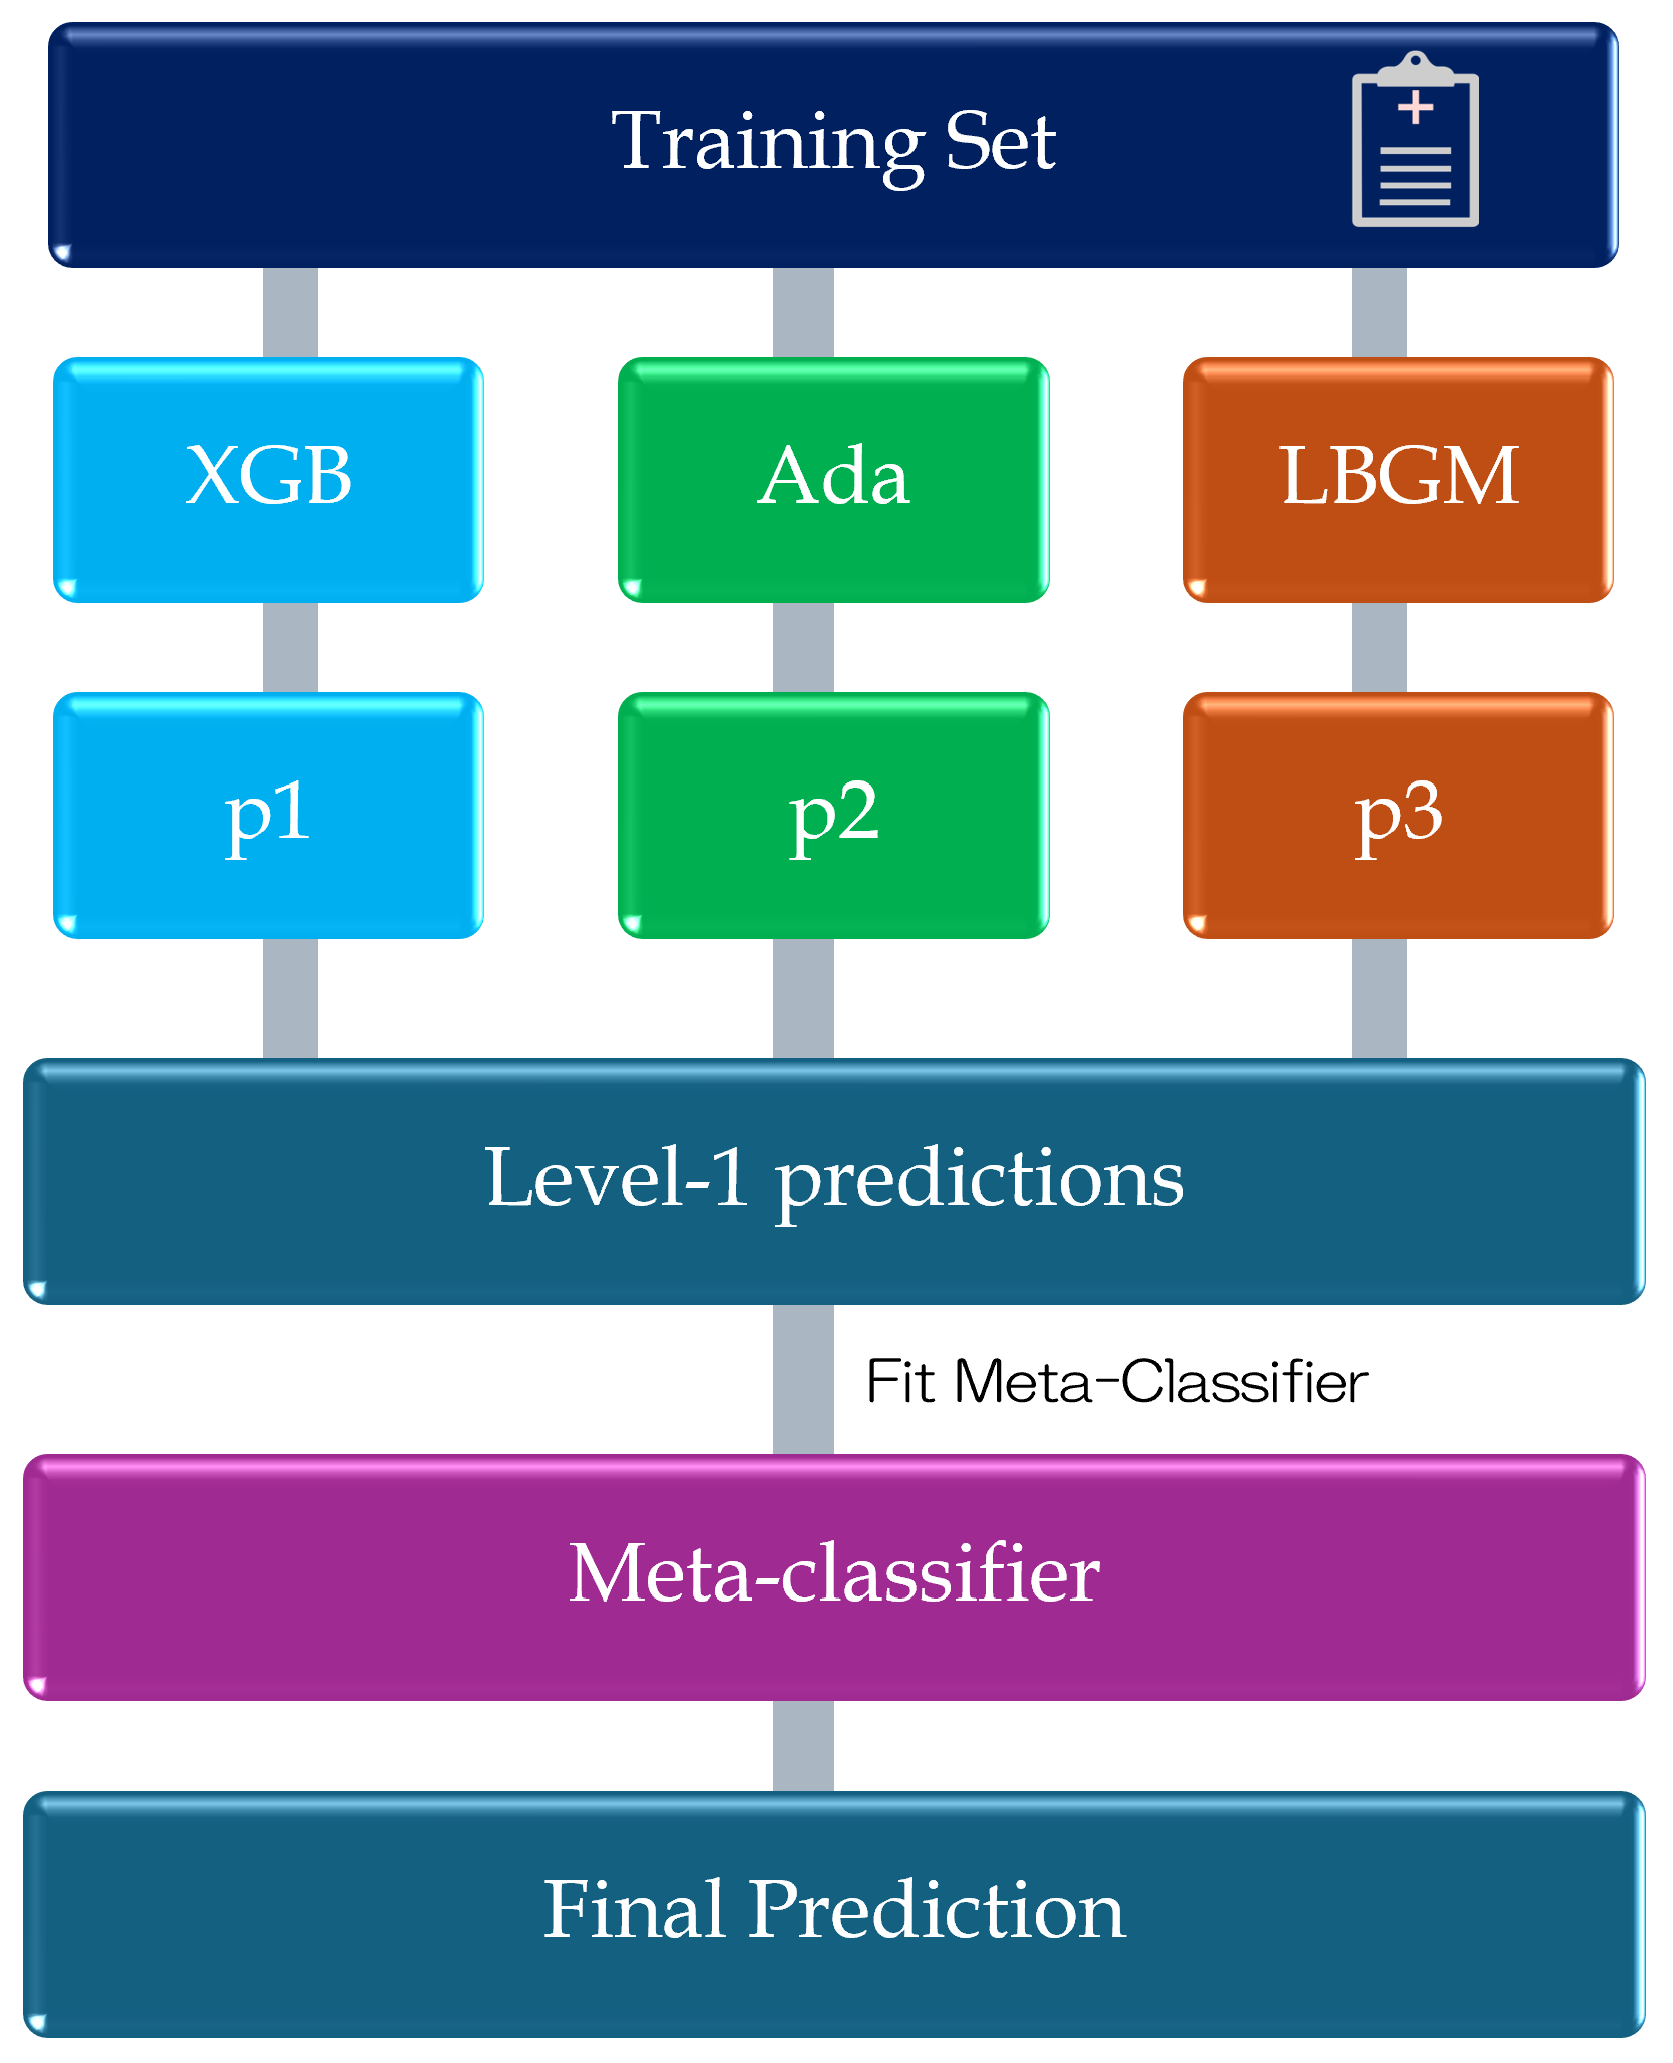
2.3. Model Design
| Algorithm 1 KD Classification Training Pipeline with Clustering-Based Undersampling and Data Augmentation. |
Input: KD training dataset ; augmentation method Initialization: K-means++ clustering (, Euclidean distance); augmentation ratio 1:24; base classifiers Output: Trained stacking ensemble model
|
2.4. Evaluation Criteria
3. Results
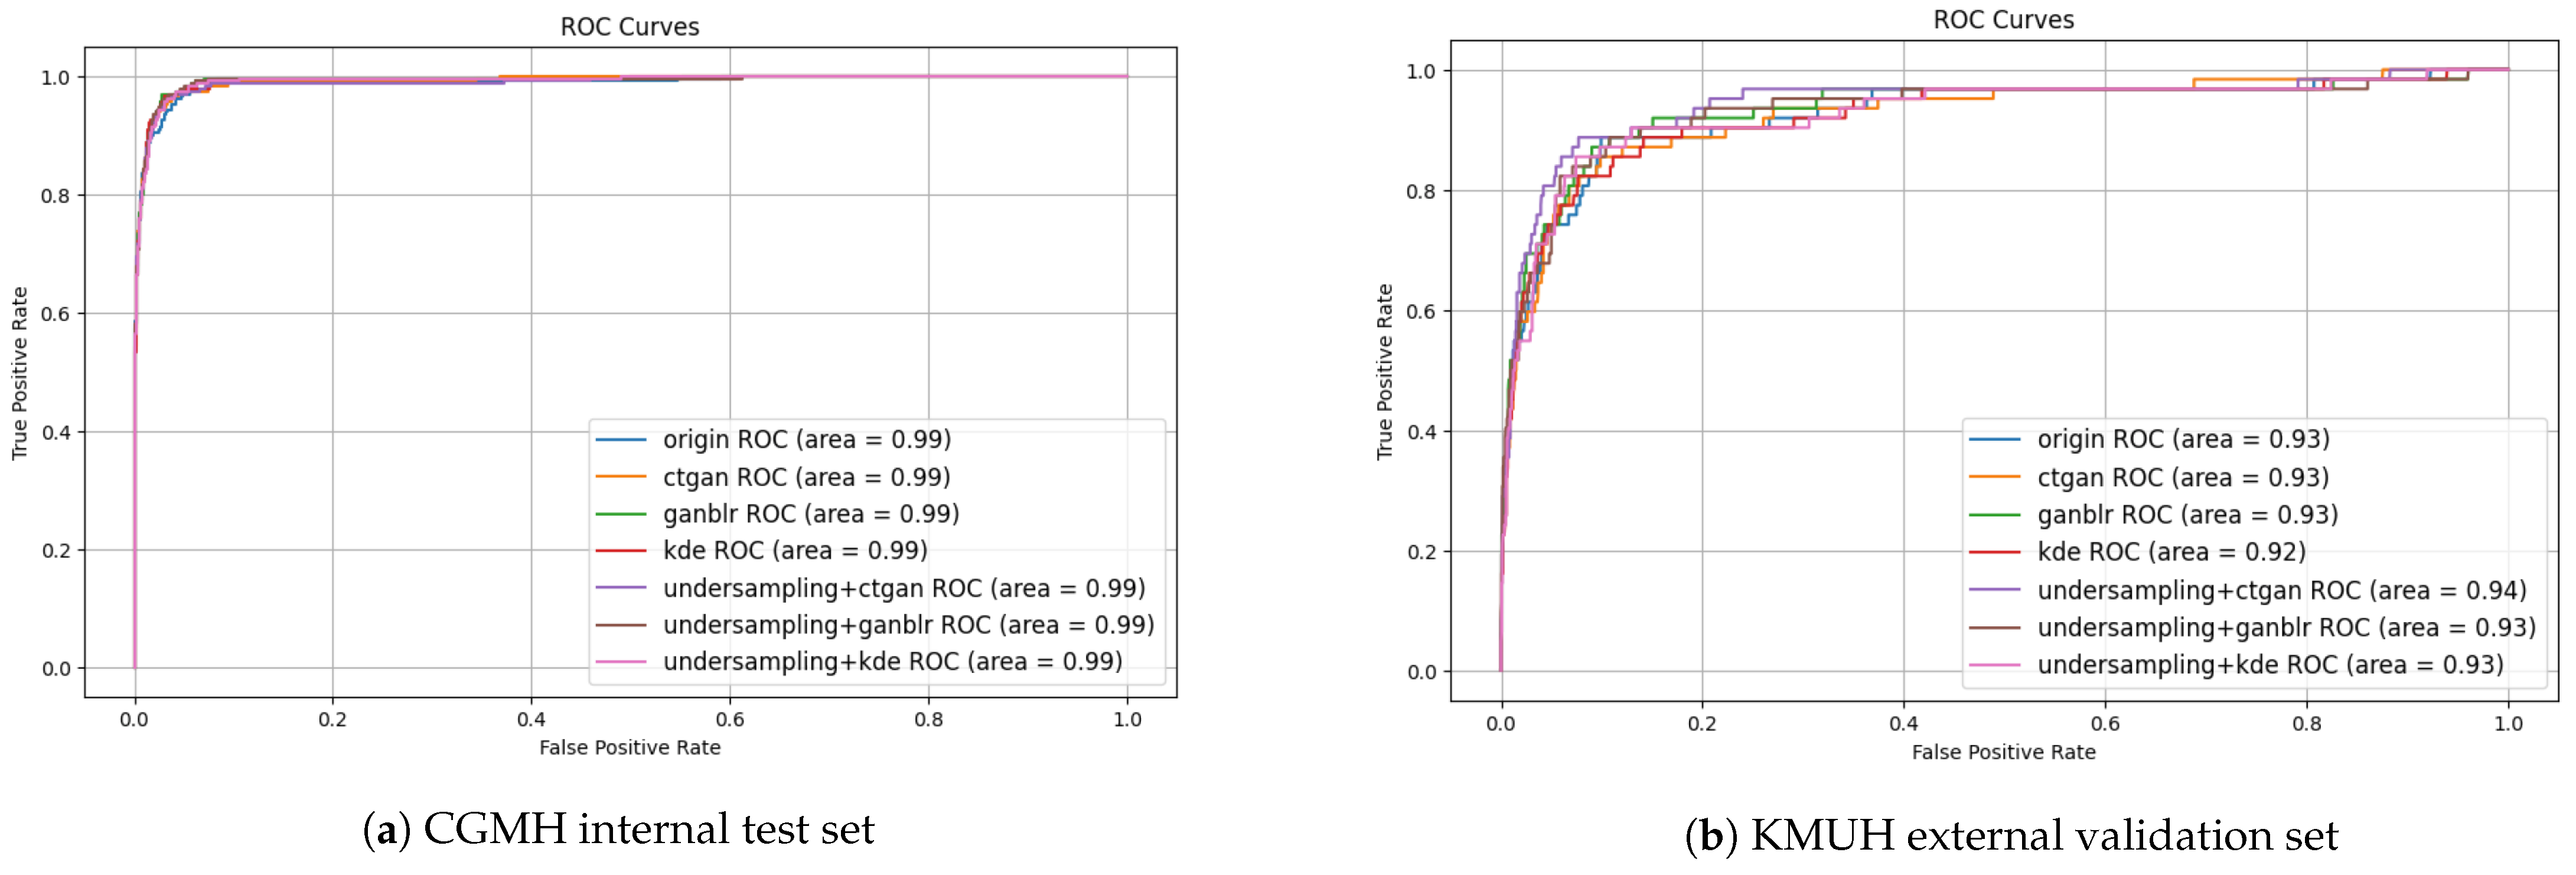
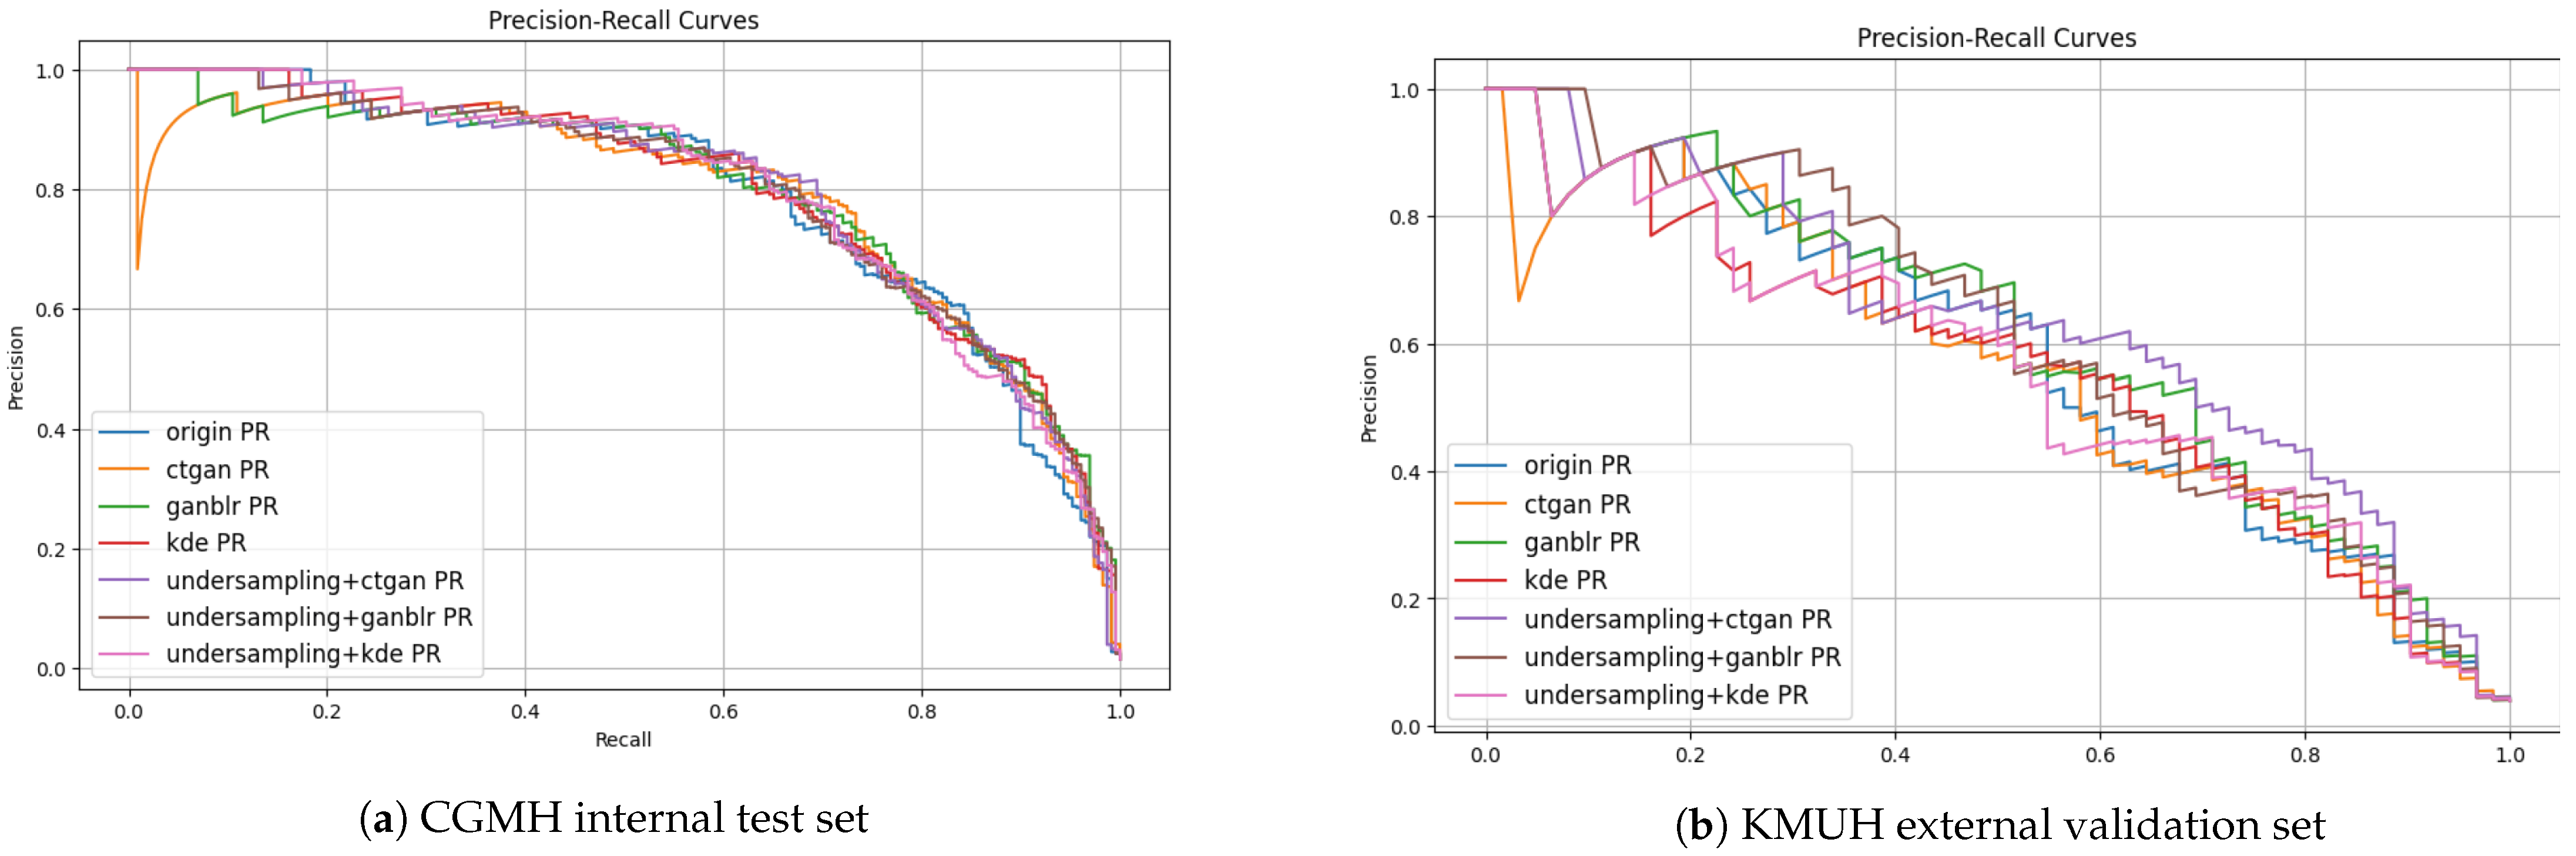
3.1. Overall Framework Performance
| Method | F1-Score (%) | PPV (%) | Specificity (%) |
|---|---|---|---|
| CBU + GANBLR + Stacking (CGMH) | 67.6 | 56.0 | 98.9 |
| CBU + CTGAN + Stacking (KMUH) | 50.7 | 35.1 | 93.8 |
| XGBoost (Original Data, CGMH) | 65.8 | 53.3 | 98.8 |
| XGBoost (Original Data, KMUH) | 7.54 | 3.92 | 0 |
| Stacking (Original Data, CGMH) | 66.3 | 54.1 | 98.9 |
| Stacking (DA only, CTGAN, CGMH) | 67.5 | 55.0 | 91.1 |
| Stacking (DA only, CTGAN, KMUH) | 39.7 | 24.8 | 89.2 |
3.2. Impact of Undersampling and Augmentation Strategies
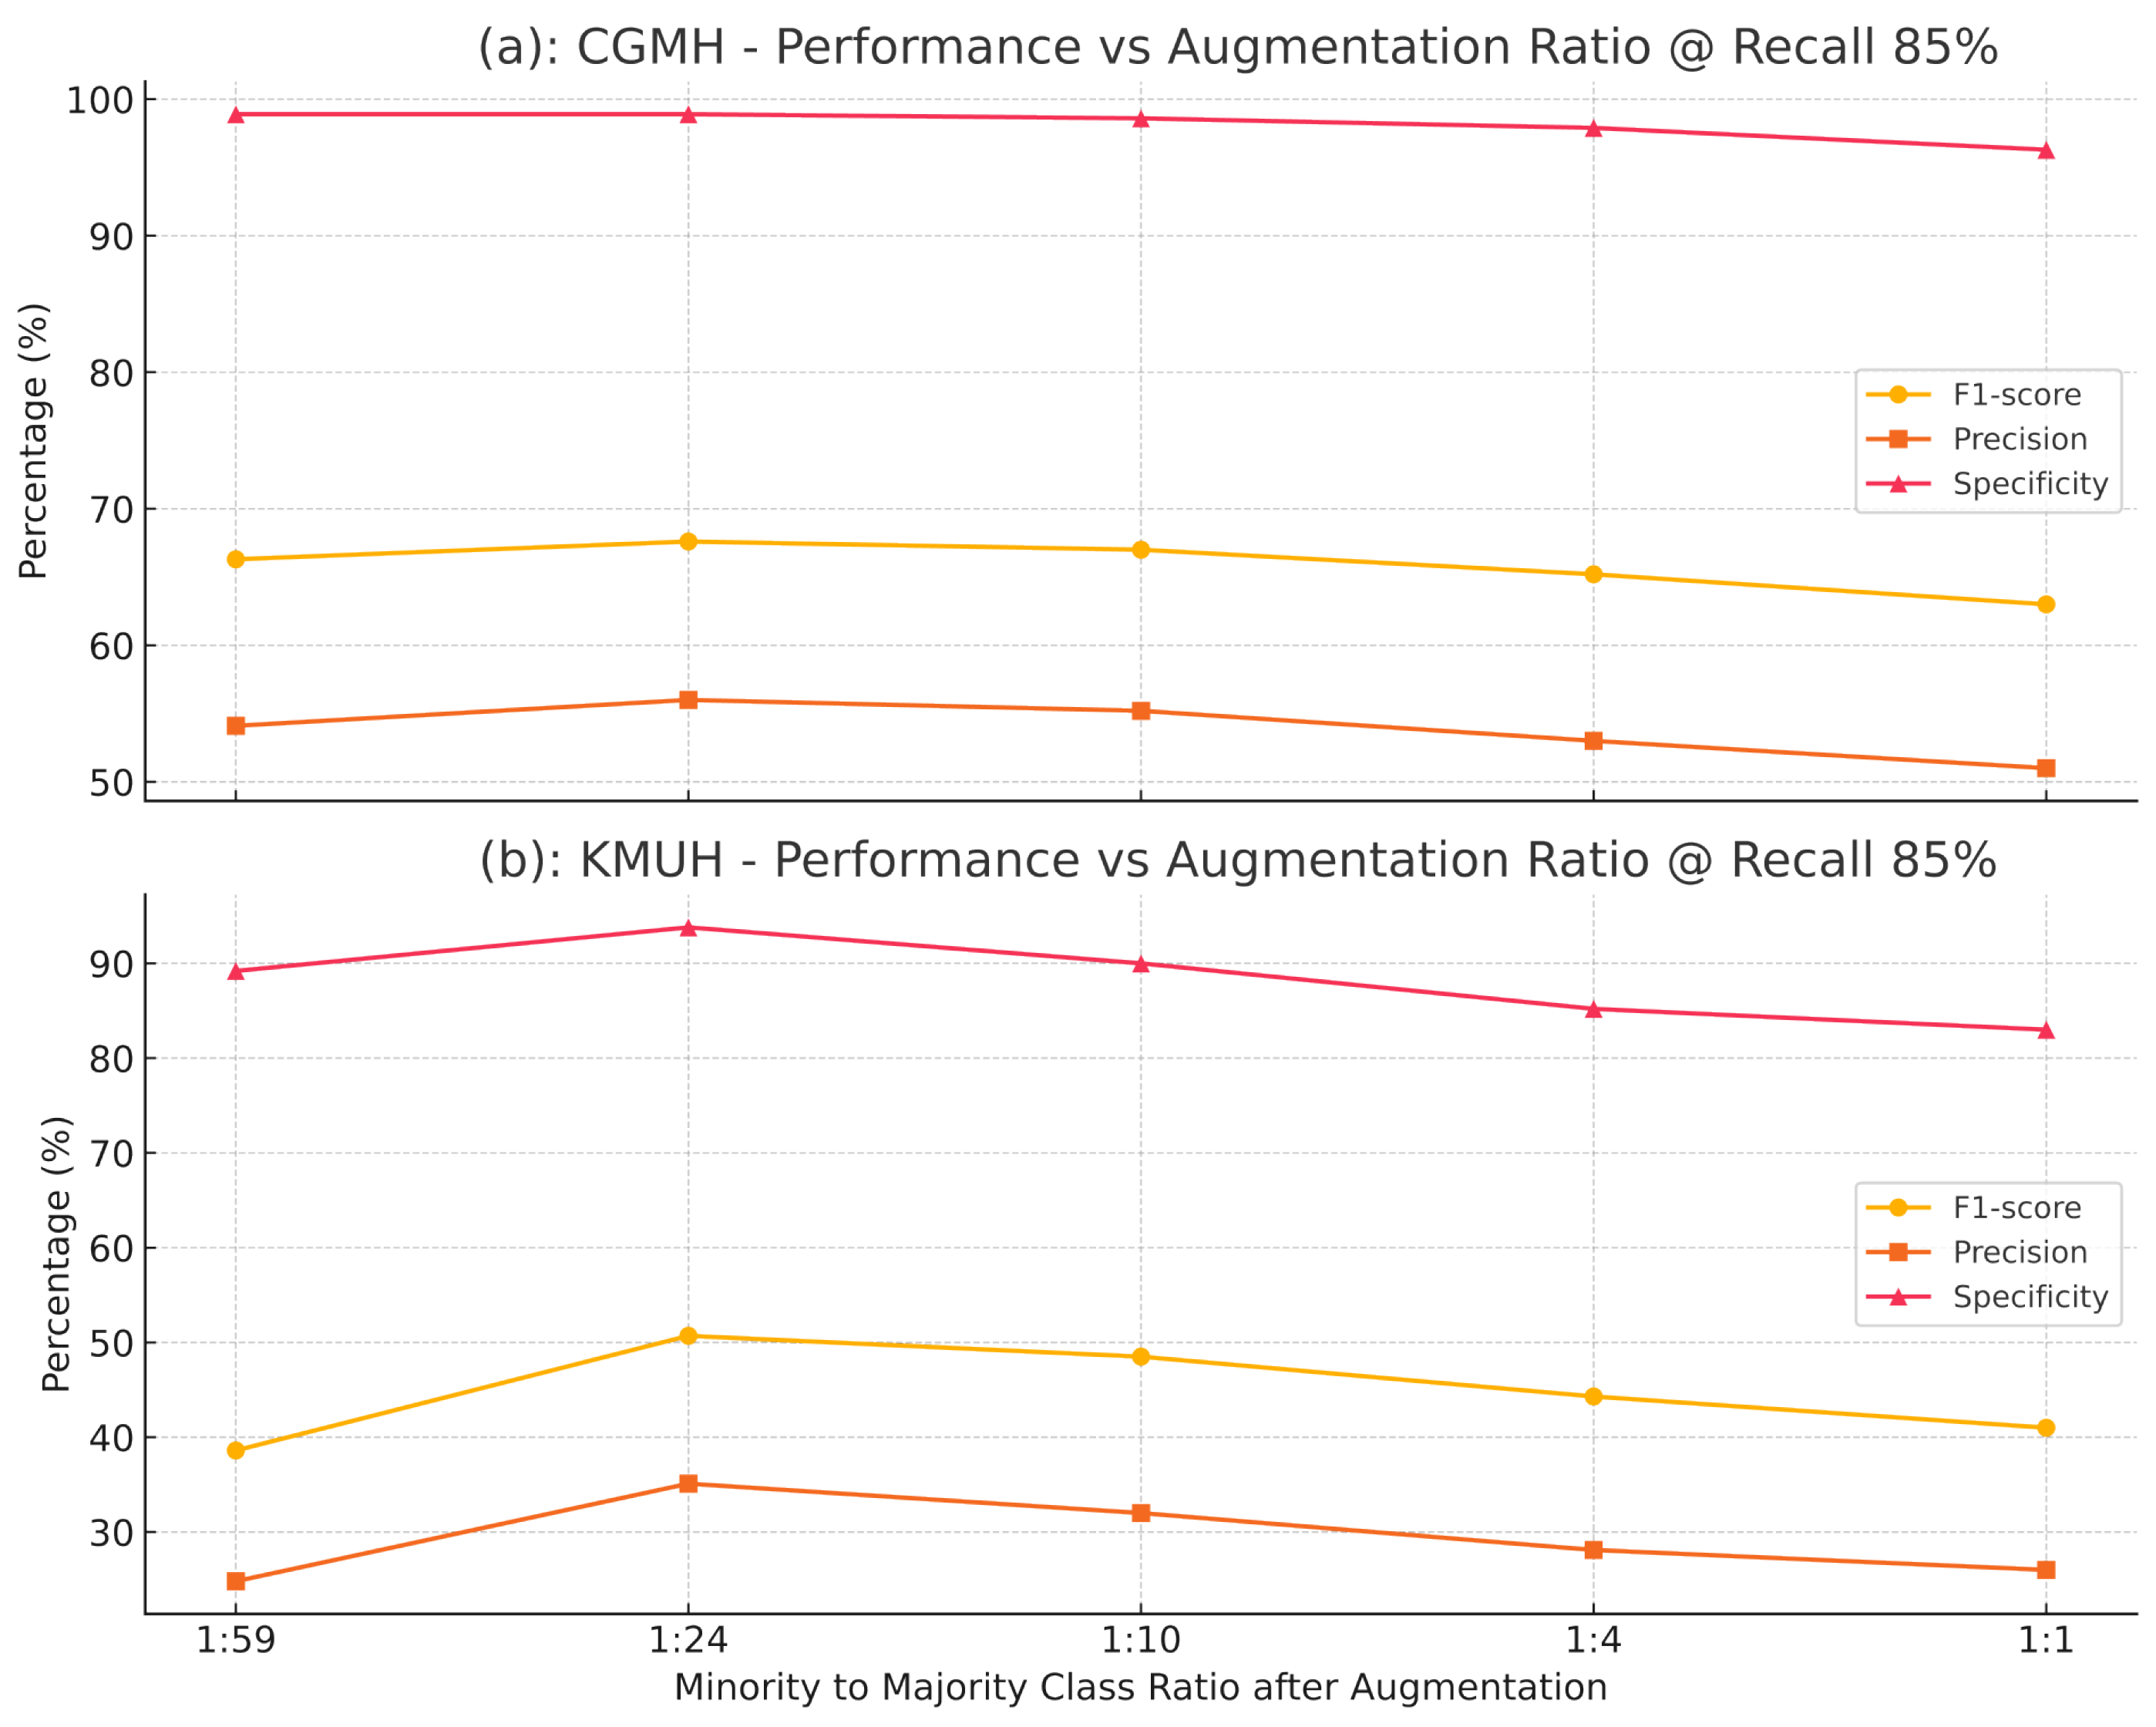
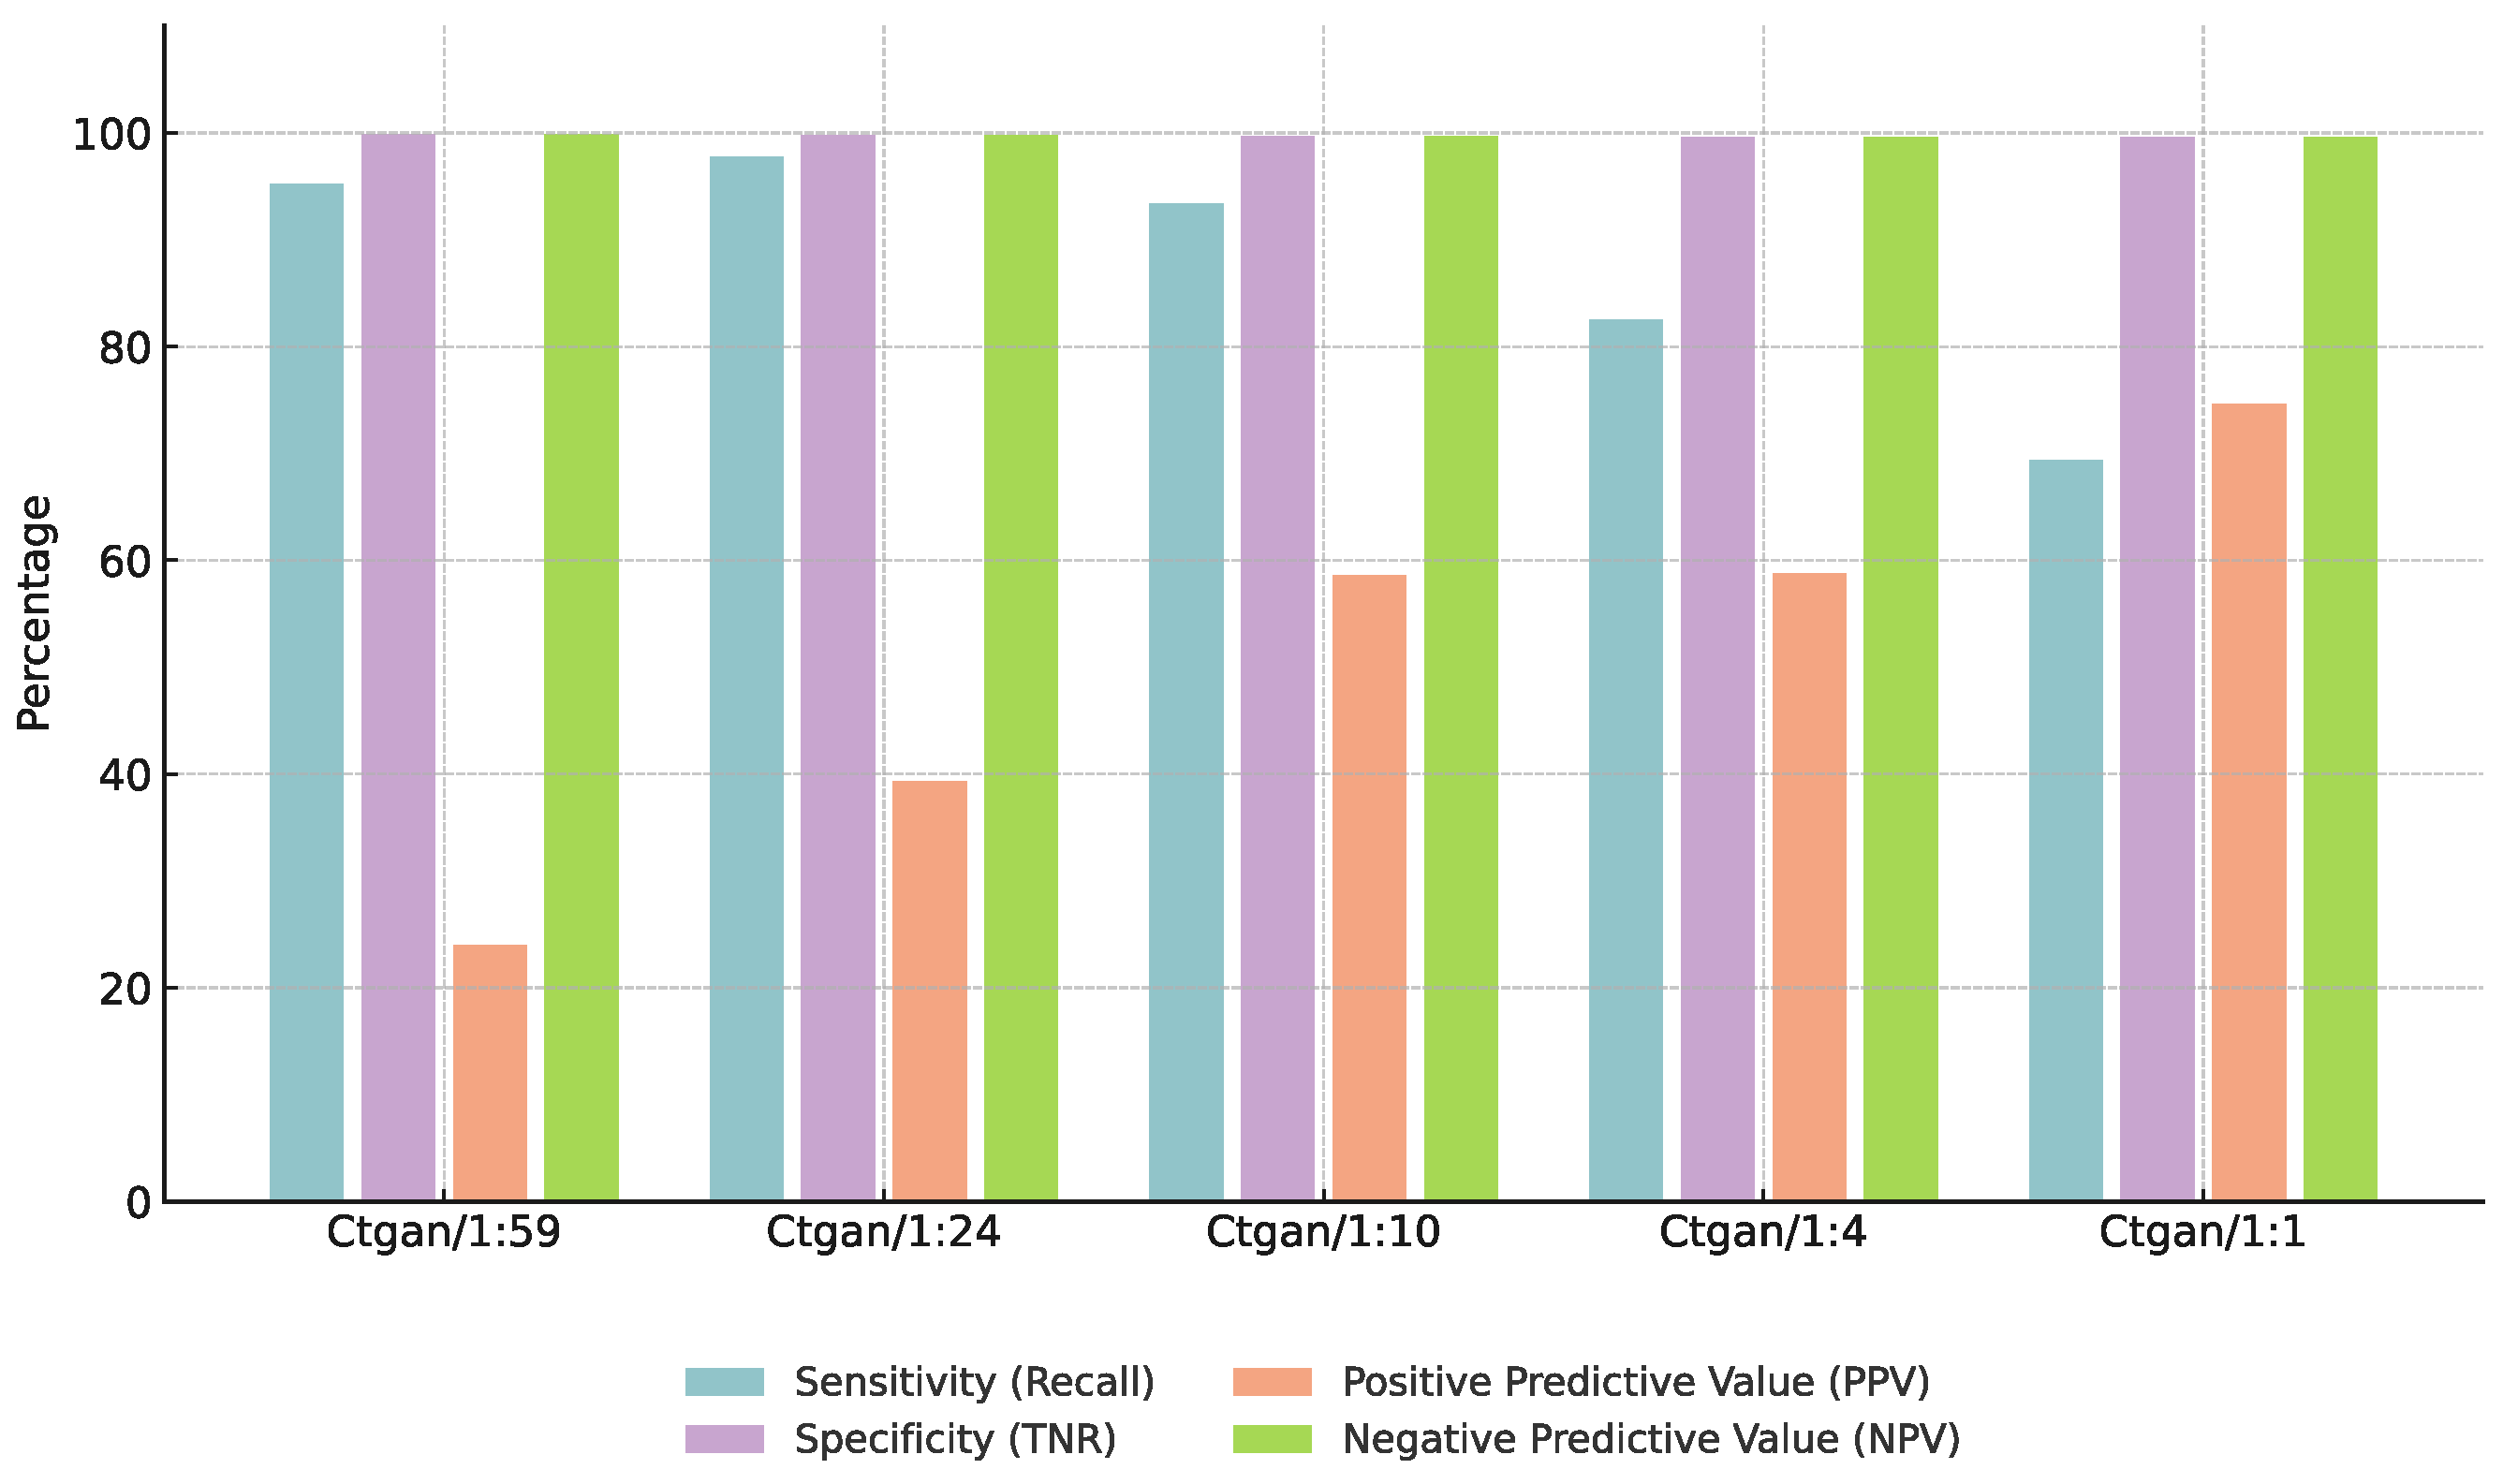
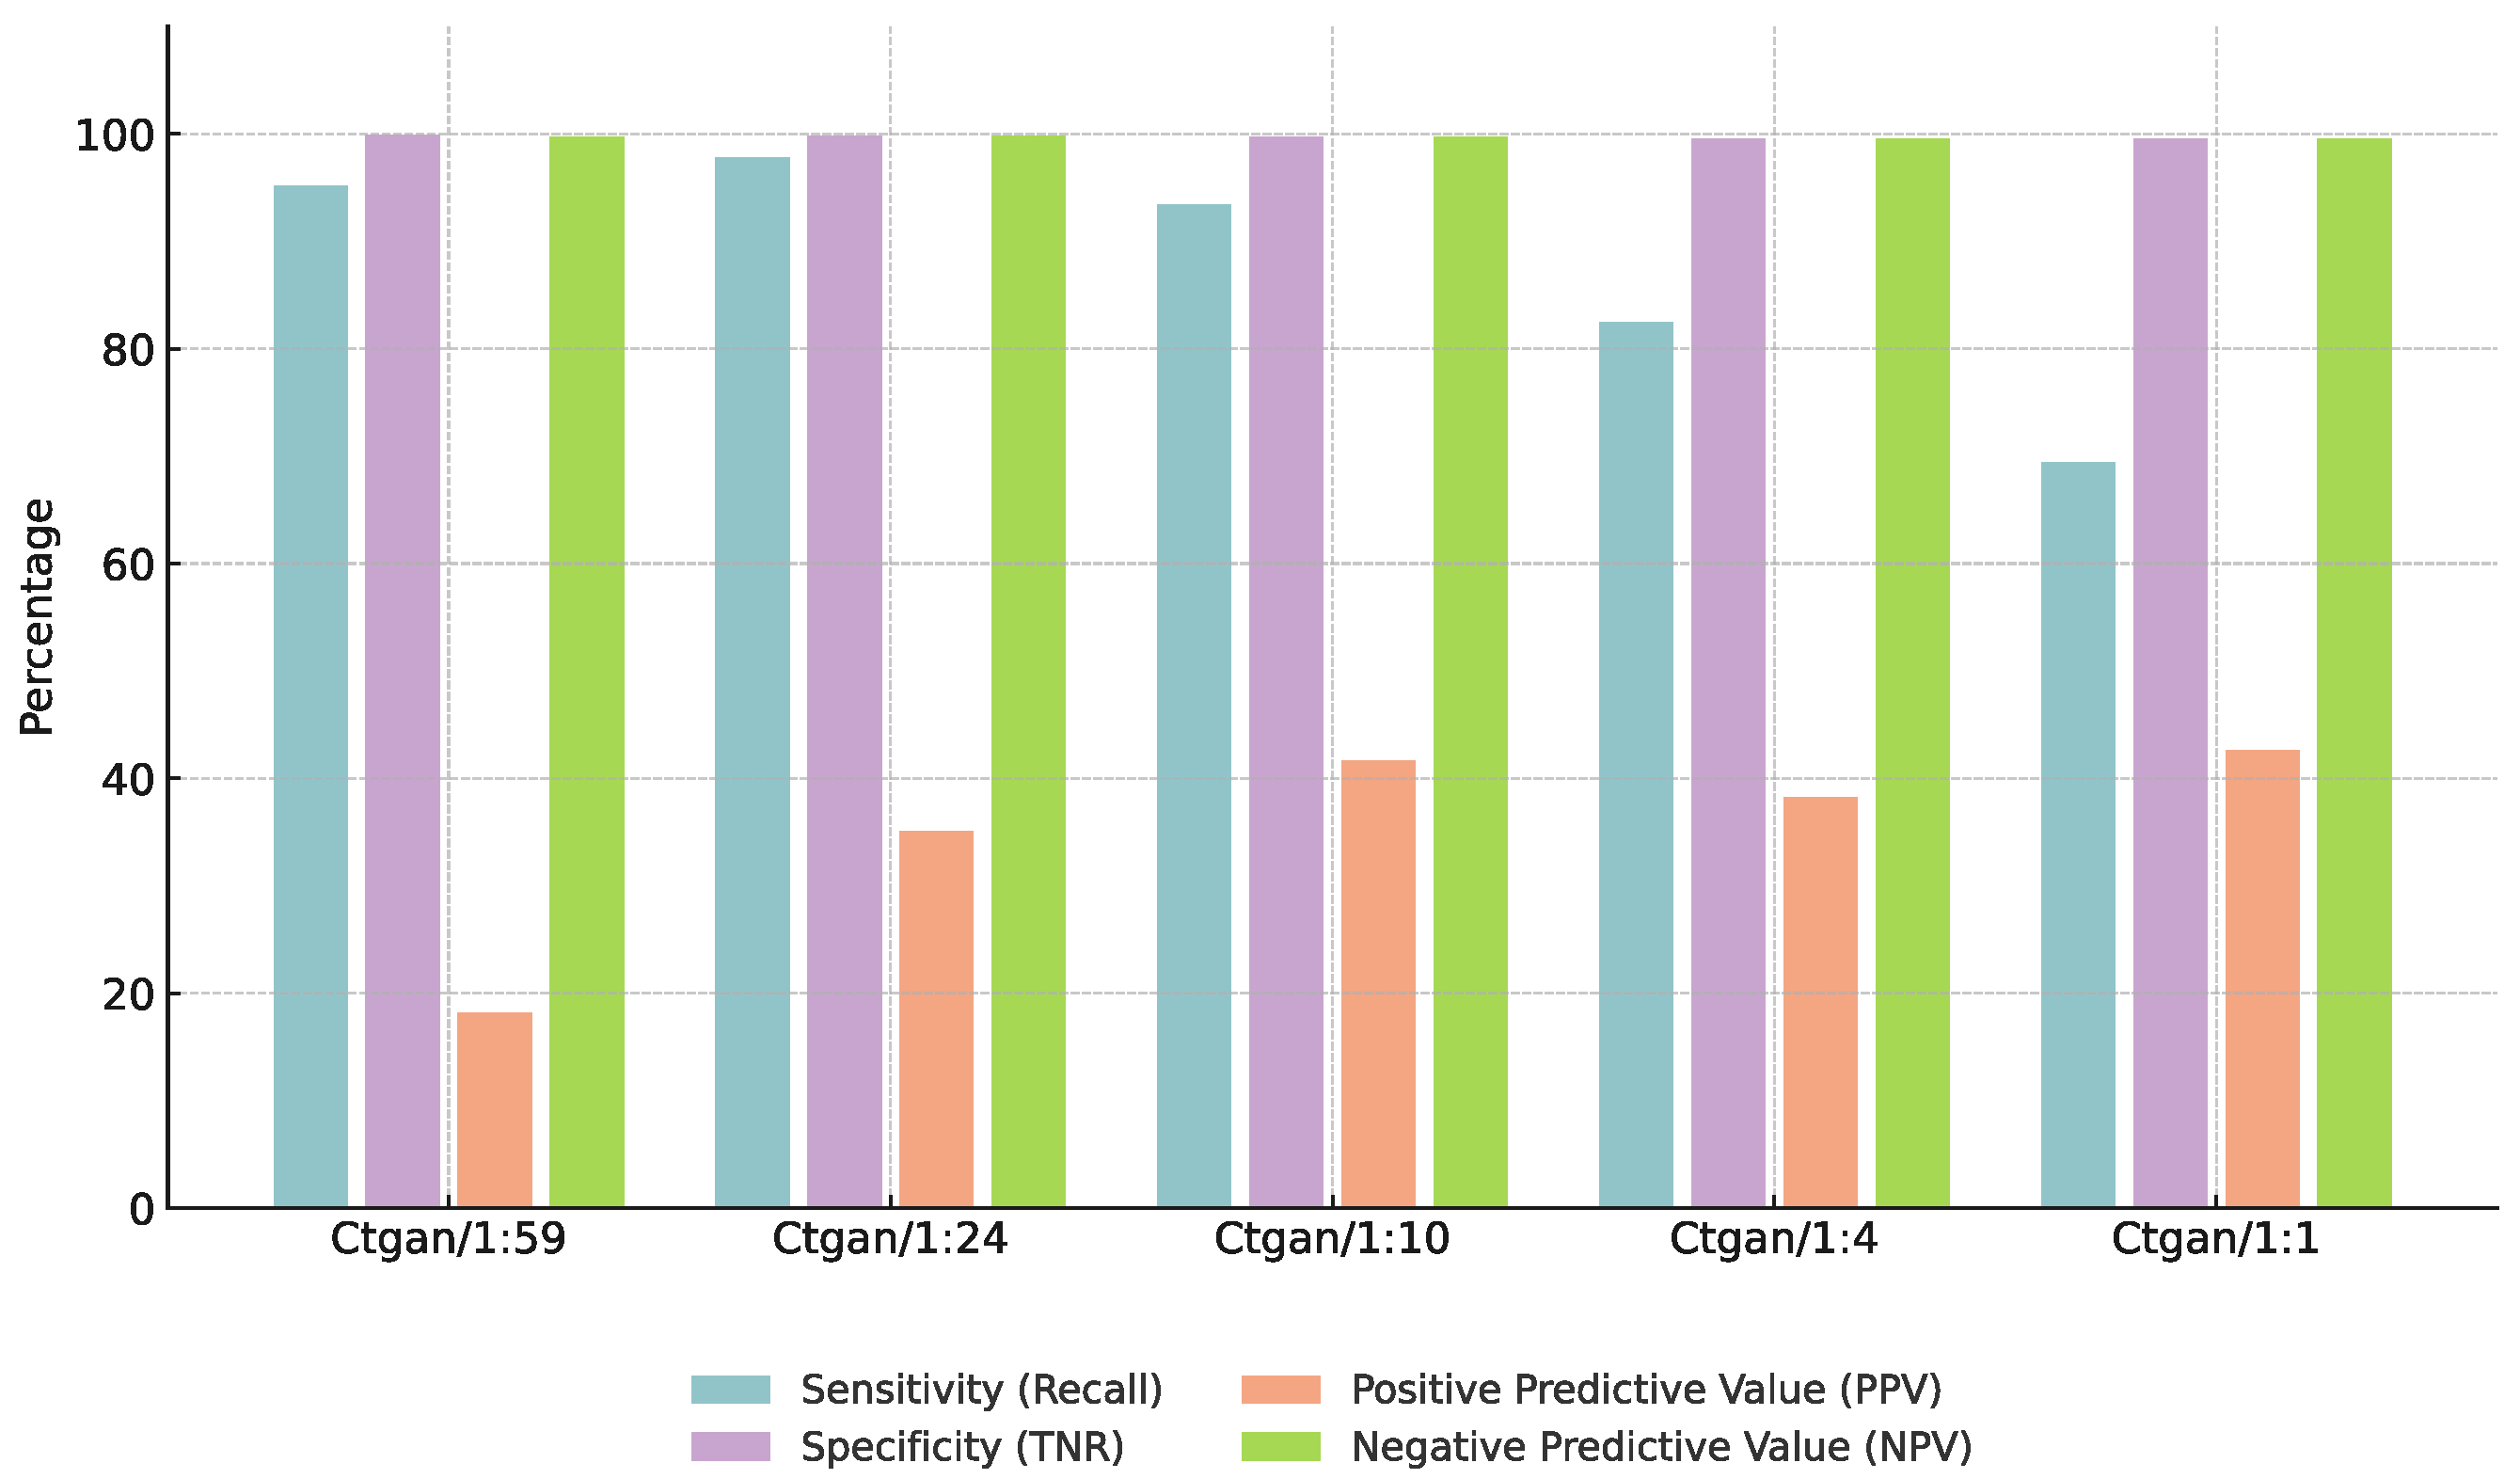
3.3. Effect of Augmentation Ratios
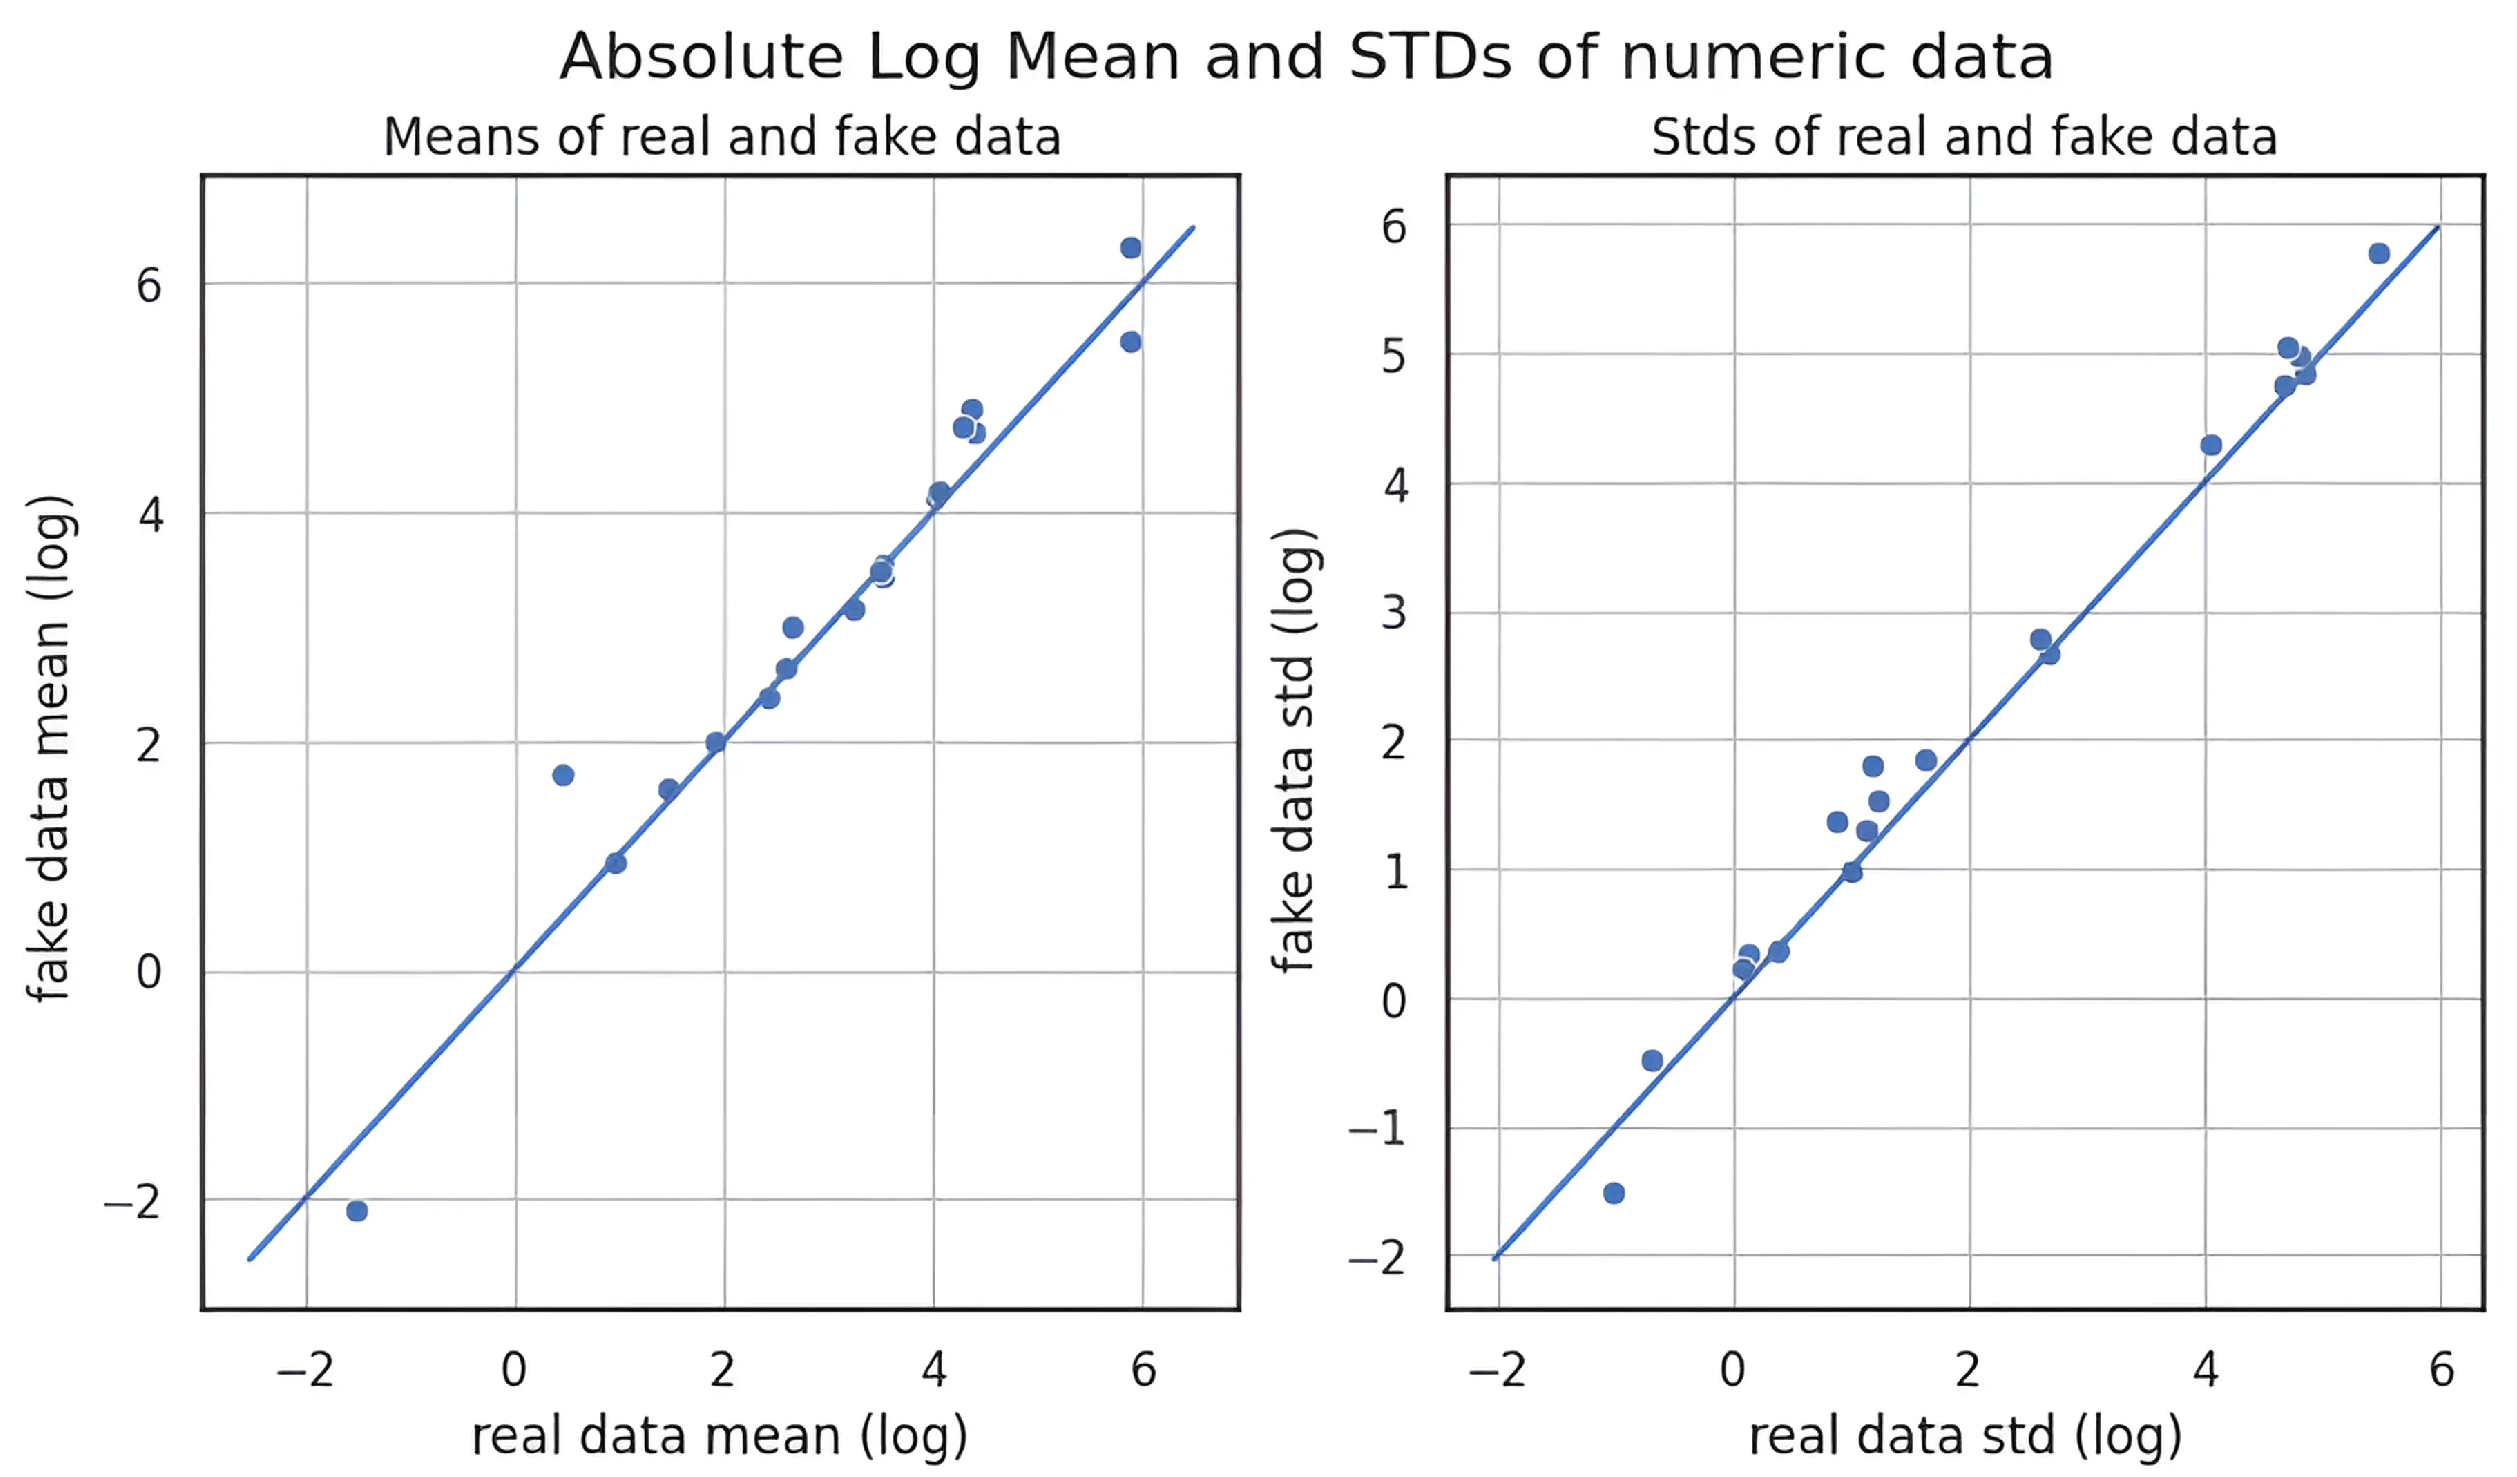
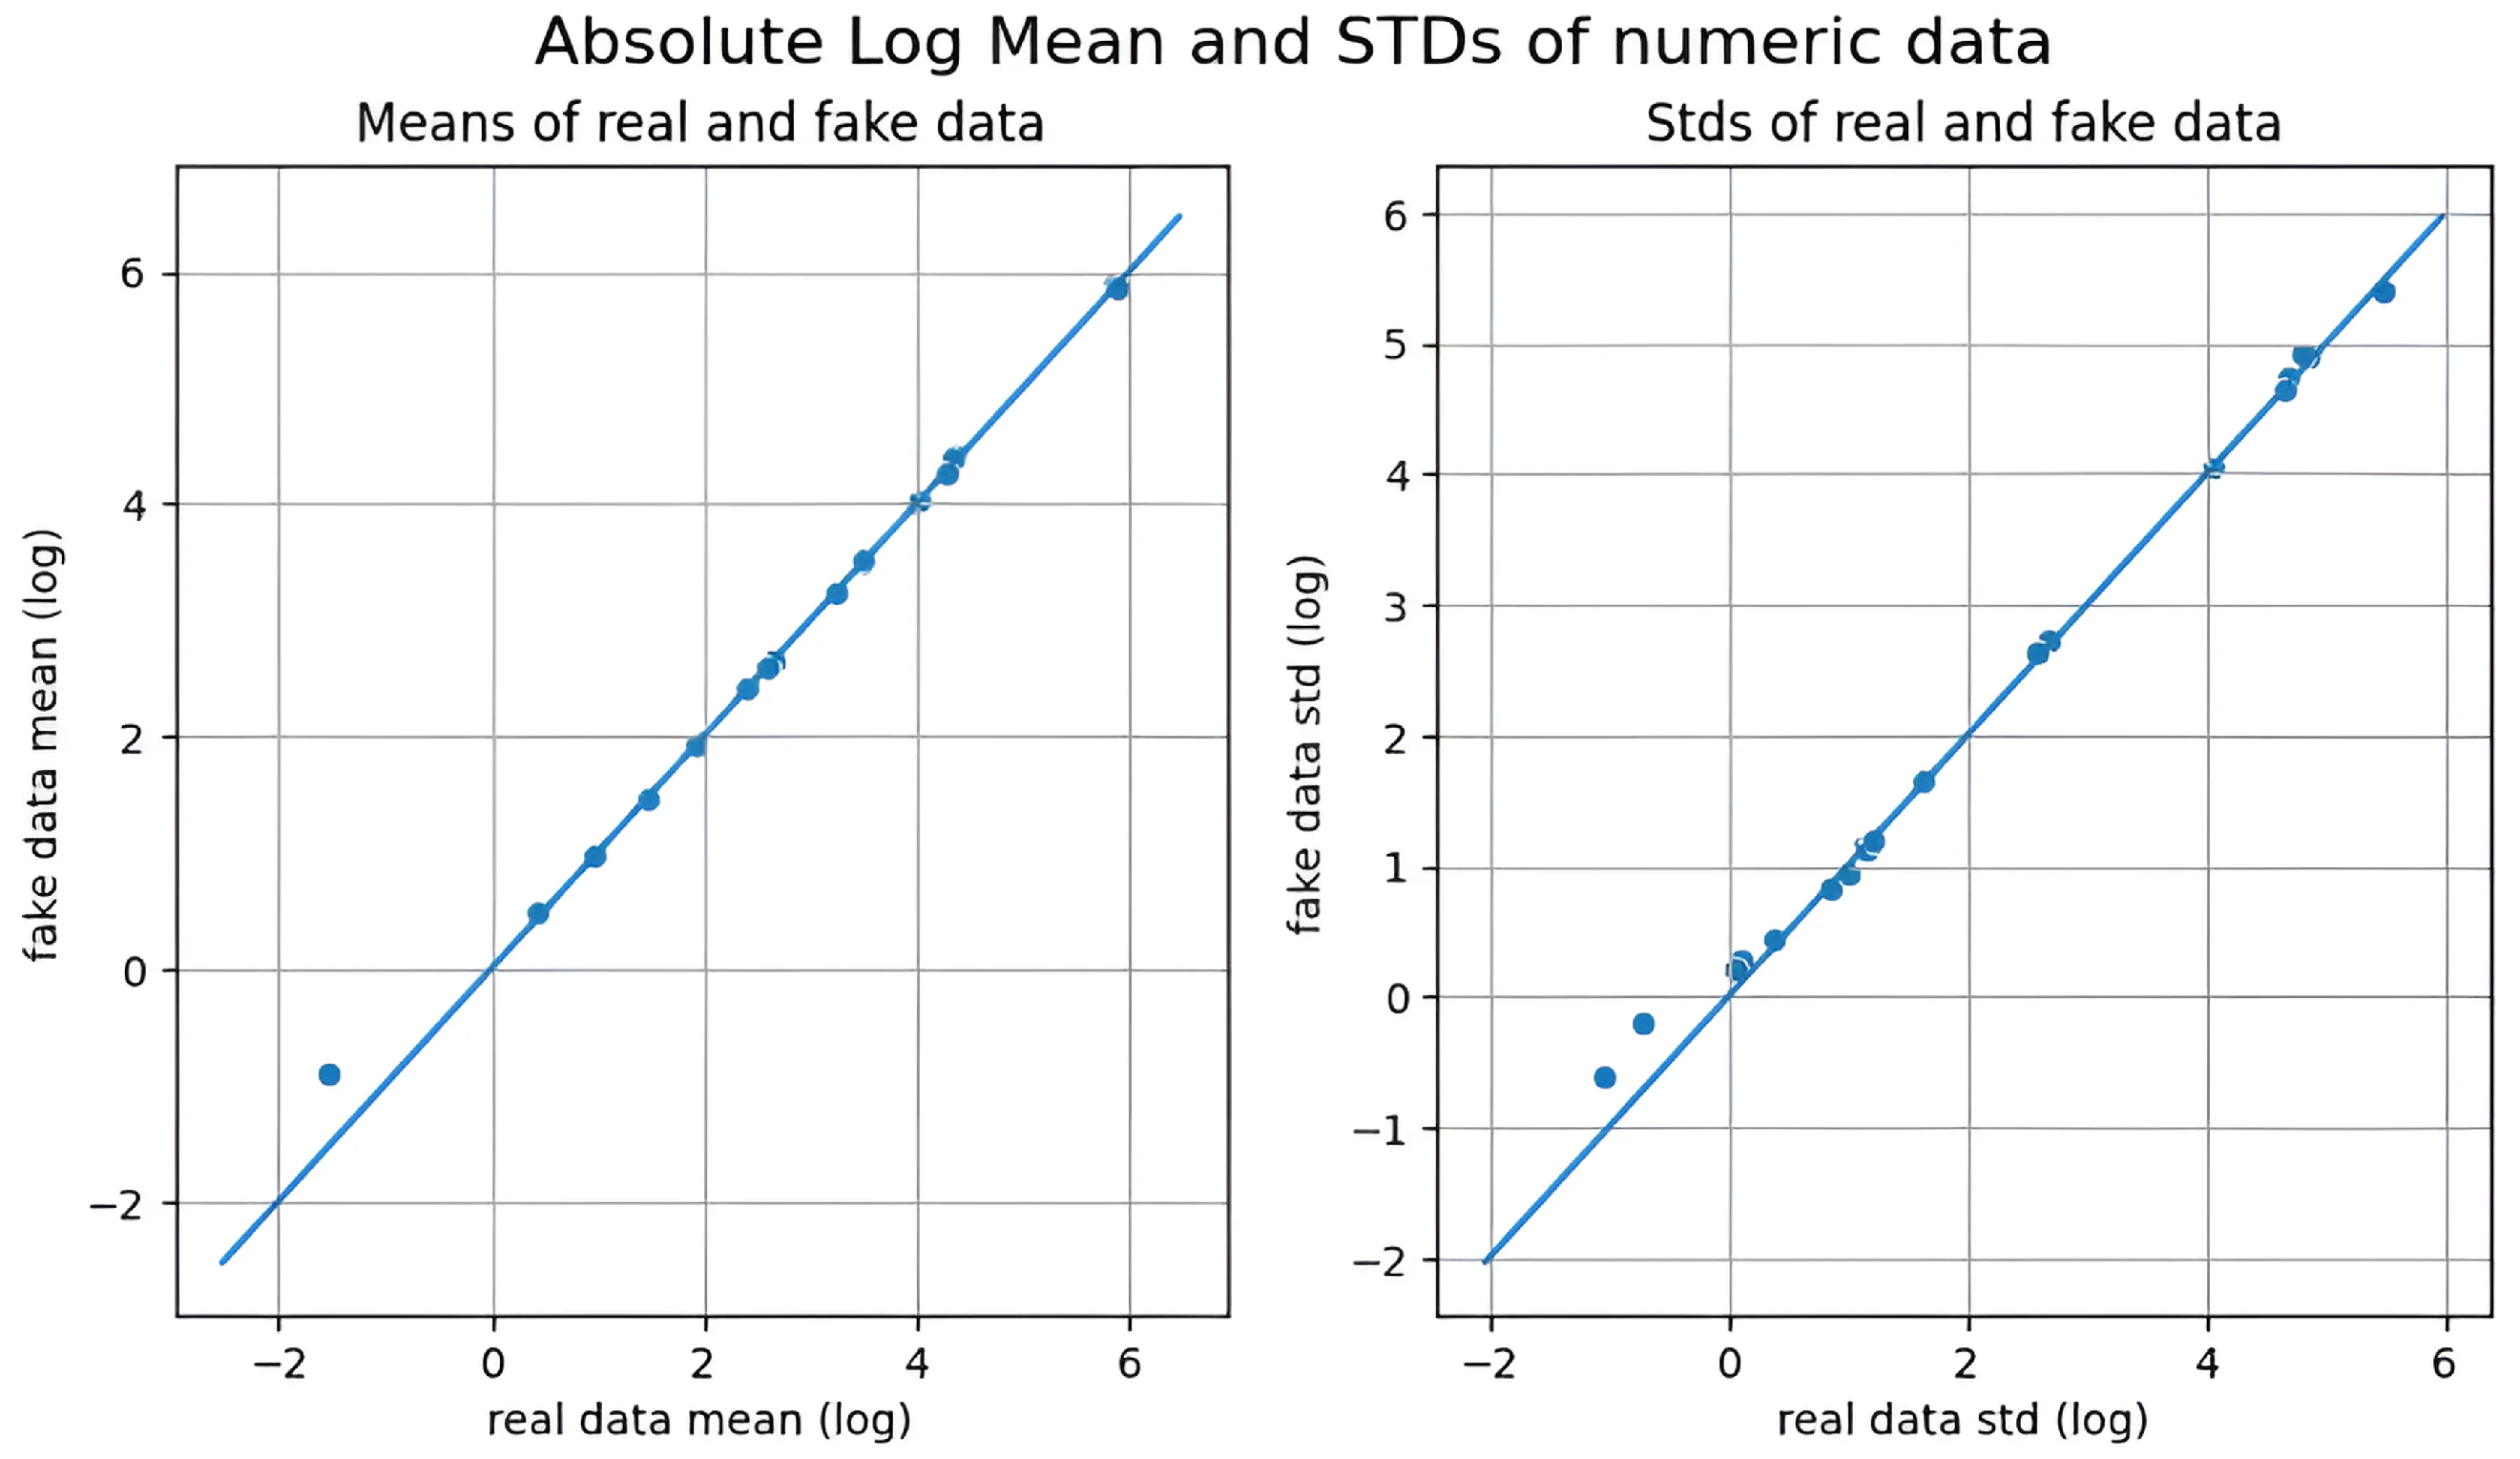
3.4. Quality of Synthetic Data
3.5. Feature Informativeness
4. Discussion
4.1. Model Performance and Generalization Across Institutions
| Strategy | CGMH (Internal Test Set) | KMUH (External Validation Set) |
|---|---|---|
| Baseline Model (XGBoost) | 50.3 | 7.54 |
| Data Augmentation Only (GANBLR) | 64.1 | 34.3 |
| Clustering-Based Augmentation (GANBLR) | 61.4 | 41.3 |
| Model Combination | Base Learners | F1-Score (%) | AUC (%) |
|---|---|---|---|
| XGBoost Only | XGBoost | 50.3 | 76.5 |
| Ensemble (w/o Augment) | XGBoost+LightGBM+AdaBoost | 54.8 | 79.1 |
| Full Model (w/CBU+GANBLR) | XGBoost+LightGBM+AdaBoost | 61.4 | 83.7 |
4.2. Balancing Data Augmentation Quality and Predictive Performance
| Undersampling Method | KMUH F1-Score (%) |
|---|---|
| Random Undersampling | 20.3 |
| Clustering-Based (Euclidean) | 35.7 |
| Augmentation Method | MMD ↓ | PCD ↓ | Entropy ↑ | Info Gain ↑ | F1-Score Improvement (%) |
|---|---|---|---|---|---|
| KDE | 0.10 | 0.07 | 2.51 | 0.12 | 2.1 |
| CTGAN | 0.18 | 0.10 | 2.78 | 0.21 | 6.3 |
| GANBLR | 0.15 | 0.06 | 2.91 | 0.24 | 9.6 |
4.3. Impact of Augmentation Ratios on Model Performance
| Augmentation Ratio (Pos:Neg) | F1-Score (%) | Specificity (%) |
|---|---|---|
| 1:59 | 50.3 | 95.0 |
| 1:24 | 61.4 | 97.2 |
| 1:10 | 58.5 | 96.8 |
| 1:4 | 55.0 | 95.5 |
| 1:1 | 48.0 | 94.0 |
4.4. Study Limitations and Future Directions
4.5. Ethical Considerations
5. Conclusions
- Exploring conditional or diffusion-based augmentation for targeted subgroup synthesis;
- Integrating multimodal clinical data (imaging, genomics);
- Advancing the integration of XAI capabilities to support clinician trust and transparent decision-making;
- Conducting prospective, multi-center trials and workflow integration studies.
Author Contributions
Funding
Institutional Review Board Statement
Informed Consent Statement
Data Availability Statement
Acknowledgments
Conflicts of Interest
References
- Burns, J.C.; Glodé, M.P. Kawasaki syndrome. Lancet 2004, 364, 533–544. [Google Scholar] [CrossRef] [PubMed]
- Kim, D.S. Kawasaki disease. Yonsei Med. J. 2006, 47, 759–772. [Google Scholar] [CrossRef] [PubMed]
- Newburger, J.W.; Takahashi, M.; Burns, J.C. Kawasaki disease. J. Am. Coll. Cardiol. 2016, 67, 1738–1749. [Google Scholar] [CrossRef]
- Goodfellow, I.; Pouget-Abadie, J.; Mirza, M.; Xu, B.; Warde-Farley, D.; Ozair, S.; Courville, A.; Bengio, Y. Generative adversarial nets. In Proceedings of the Advances in Neural Information Processing Systems 27 (NIPS 2014), Montreal, QC, Canada, 8–13 December 2014; Volume 27. [Google Scholar]
- Vincent, P.; Larochelle, H.; Lajoie, I.; Bengio, Y.; Manzagol, P.-A. Extracting and composing robust features with denoising autoencoders. In Proceedings of the 25th International Conference on Machine Learning, Helsinki, Finland, 5–9 July 2008; Volume 25, pp. 1096–1103. [Google Scholar]
- Berthelot, D.; Schumm, W.; Metz, L. BEGAN: Boundary equilibrium generative adversarial networks. arXiv 2017, arXiv:1703.10717. [Google Scholar]
- Goncalves, S.; Plotkin, D.; Veiga, L.; Cunha, C. A framework for explainable artificial intelligence in healthcare using synthetic data. arXiv 2019, arXiv:1902.02302. [Google Scholar]
- Jordon, J.; Yoon, J.; van der Schaar, M. Hide-and-seek privacy challenge: Synthetic health data generation. In Proceedings of the Advances in Neural Information Processing Systems, Online, 6–14 June 2021; Volume 34, pp. 27914–27926. [Google Scholar]
- Xu, L.; Skoularidou, M.; Cuesta-Infante, A.; Veeramachaneni, K. Modeling tabular data using Conditional GAN. arXiv 2019, arXiv:1907.00503. [Google Scholar]
- Węglarczyk, S. Kernel density estimation and its application. ITM Web Conf. 2018, 23, 00037. [Google Scholar] [CrossRef]
- Zhang, Y.; Zaidi, N.A.; Zhou, J.; Li, G. GANBLR: A Tabular Data Generation Model. In Proceedings of the 2021 IEEE International Conference on Data Mining (ICDM), Auckland, New Zealand, 7–10 December 2021; pp. 6826–6833. [Google Scholar]
- Germain, D.P.; Gruson, D.; Malcles, M.; Garcelon, N.; Rodriguez-Palomares, J.F.; Pintos-Morell, G. Applying artificial intelligence to rare diseases: A literature review highlighting lessons from Fabry disease. Orphanet J. Rare Dis. 2025, 20, 47. [Google Scholar] [CrossRef]
- Mao, D.; Liu, P.; Wu, Y.; Lu, H.; Cao, M.; Jin, Y.; Retterer, K.; Bainbridge, M.N. AI-MARRVEL: A Knowledge-Driven AI System for Diagnosing Mendelian Disorders. NEJM AI 2024, 1, e2300009. [Google Scholar] [CrossRef]
- Shah, P.; Rivas, A.; Ghosh, R.; Joseph, T.A.; Ferreira, C.R.; Kalokairinou, L.; Rehm, H.L.; Barash, C.I.; Lehman, C.; Han, B.; et al. Realising the potential impact of artificial intelligence for rare diseases. Artif. Intell. Med. 2024, 146, 102576. [Google Scholar]
- Arthur, D.; Vassilvitskii, S. k-means++: The Advantages of Careful Seeding. In Proceedings of the Eighteenth Annual ACM-SIAM Symposium on Discrete Algorithms, New Orleans, LA, USA, 7–9 January 2007; pp. 1027–1035. [Google Scholar]
- Huang, Z. Clustering large data sets with mixed numeric and categorical values. In Proceedings of the First Pacific Asia Knowledge Discovery and Data Mining Conference, Singapore, 23–24 February 1997; pp. 21–34. [Google Scholar]
- Schubert, E.; Sander, J.; Ester, M.; Kriegel, H.-P.; Xu, X. DBSCAN revisited, revisited: Why and how you should (still) use DBSCAN. ACM Trans. Database Syst. 2017, 42, 1–21. [Google Scholar] [CrossRef]
- Suwanda, R.; Syahputra, Z.; Zamzami, E.M. Analysis of Euclidean distance and Manhattan distance in the k-means algorithm for variations number of centroid k. J. Phys. Conf. Ser. 2020, 1566, 012058. [Google Scholar] [CrossRef]
- Aggarwal, C.; Hinneburg, A.; Keim, D. On the Surprising Behavior of Distance Metrics in High-Dimensional Space. In Proceedings of the 8th International Conference on Database Theory (ICDT 2001), London, UK, 4–6 January 2001; Springer: London, UK, 2001; pp. 420–434. [Google Scholar]
- Pezoulas, V.C.; Doulaverakis, C.; Charalampidis, P.; Koumakis, L.; Giatili, G.; Fragkos, V.; Trivizakis, E.; Tsiknakis, M. Synthetic Data Generation Methods in Healthcare: A Review on Open-Source Tools and Methods. Comput. Struct. Biotechnol. J. 2024, 22, 2892–2910. [Google Scholar] [CrossRef]
- Gretton, A.; Borgwardt, K.M.; Rasch, M.J.; Schölkopf, B.; Smola, A. A kernel two-sample test. J. Mach. Learn. Res. 2012, 13, 723–773. [Google Scholar]
- Gonçalves, A.; Ray, P.; Soper, B.; Stevens, L.R.; Ceyhan, S.; Melnick, L.; van der Schaar, M. Generation and evaluation of synthetic patient data. BMC Med. Res. Methodol. 2020, 20, 108. [Google Scholar] [CrossRef]
- Gkoulalas-Divanis, A.; Choudhury, O.; Bronstein, M.; Puri, V.; Holve, E.; Kumar, R.; Holzinger, A.; Wicks, P.; D’Amour, A.; Ju, C.; et al. Can I Trust My Synthetic Data? A Comprehensive Quality Assessment Framework for Synthetic Tabular Health Data. NPJ Digit. Med. 2024, 7, 50. [Google Scholar]
- Chen, T.; Guestrin, C. XGBoost: A scalable tree boosting system. In Proceedings of the 22nd ACM SIGKDD International Conference on Knowledge Discovery and Data Mining, San Francisco, CA, USA, 13–17 August 2016; pp. 785–794. [Google Scholar]
- Freund, Y.; Schapire, R.E. A decision-theoretic generalization of on-line learning and an application to boosting. J. Comput. Syst. Sci. 1997, 55, 119–139. [Google Scholar] [CrossRef]
- Ke, G.; Meng, Q.; Finley, T.; Wang, T.; Chen, W.; Ma, W.; Ye, Q.; Liu, T.-Y. LightGBM: A highly efficient gradient boosting decision tree. In Proceedings of the 31st International Conference on Neural Information Processing System, Long Beach, CA, USA, 4–9 December 2017; Volume 30. [Google Scholar]
- Rudin, C. Stop explaining black box machine learning models for high stakes decisions and use interpretable models instead. Nat. Mach. Intell. 2019, 1, 206–215. [Google Scholar] [CrossRef]
- Kohavi, R. A study of cross-validation and bootstrap for accuracy estimation and model selection. In Proceedings of the 14th International Joint Conference on Artificial Intelligence (IJCAI ’95), Montreal, QC, Canada, 20–25 August 1995; Morgan Kaufmann Publishers Inc.: San Francisco, CA, USA, 1995; Volume 2, pp. 1137–1143. [Google Scholar]
- Saito, T.; Rehmsmeier, M. The precision-recall plot is more informative than the ROC plot when evaluating binary classifiers on imbalanced datasets. PLoS ONE 2015, 10, e0118432. [Google Scholar] [CrossRef]
- Lundberg, S.; Lee, S.-I. A unified approach to interpreting model predictions. In Proceedings of the 31st International Conference on Neural Information Processing System, Long Beach, CA, USA, 4–9 December 2017; Volume 30. [Google Scholar]
- Ribeiro, M.T.; Singh, S.; Guestrin, C. Why should I trust you? Explaining the predictions of any classifier. In Proceedings of the 22nd ACM SIGKDD International Conference on Knowledge Discovery and Data Mining, San Francisco, CA, USA, 13–17 August 2016; pp. 1135–1144. [Google Scholar]
- Holzinger, A.; Biemann, C.; Pattichis, C.S.; Kell, D.B. What do we need to build explainable AI systems for the medical domain? arXiv 2017, arXiv:1712.09923. [Google Scholar]
- Giuffrè, M.; Shung, D.L. Harnessing the Power of Synthetic Data in Healthcare: Innovation, Application, and Privacy. NPJ Digit. Med. 2023, 6, 186. [Google Scholar] [CrossRef]
- Mehta, R.; Chen, L.; Thompson, S.; Gupta, A.; Olabisi, O.; Ramirez, J.; Smith, D.; Weiss, J.; Zhang, Y.; Patel, N.; et al. Ethical Considerations in AI for Child Health and Recommendations (PEARL-AI Framework). NPJ Digit. Med. 2025, 8, 15. [Google Scholar]


| Category | Number of Features | Example Features |
|---|---|---|
| Demographics | 3 | Sex, Age, Month of Visit |
| Blood Tests | 17 | WBC, Platelet, CRP, AST, ALT |
| Urine Tests | 2 | UWBC, Pyuria |
| Dataset Type | Positive Samples | Negative Samples | Pos/Neg Ratio |
|---|---|---|---|
| Training Set | 913 | 58,799 | 1:64 |
| Test Set | 229 | 14,700 | 1:64 |
| Validation Set | 62 | 1520 | 1:24 |
| Dataset | TP | FP | FN | TN |
|---|---|---|---|---|
| CGMH | 195 | 153 | 34 | 14,547 |
| KMUH | 53 | 119 | 9 | 1401 |
| Undersampling Method | F1-Score (%) | Precision (%) | Specificity (%) |
|---|---|---|---|
| CBU + CTGAN + Stacking (CGMH) | 50.6 | 34.4 | 97.2 |
| RUS + CTGAN + Stacking (CGMH) | 48.8 | 32.8 | 97.0 |
| CBU + CTGAN + Stacking (KMUH) | 26.8 | 15.6 | 79.0 |
| RUS + CTGAN + Stacking (KMUH) | 14.3 | 7.7 | 53.5 |
| Distance Metric | F1-Score (CGMH, %) | F1-Score (KMUH, %) |
|---|---|---|
| Euclidean | 67.6 | 50.7 |
| Manhattan | 64.1 | 34.4 |
| Cosine | 64.9 | 35.7 |
| Augmentation Method | F1-Score (CGMH, %) | F1-Score (KMUH, %) |
|---|---|---|
| CTGAN | 67.6 | 50.7 |
| KDE | 65.0 | 46.1 |
| GANBLR | 67.6 | 45.3 |
| Augmentation Method | MMD | PCD |
|---|---|---|
| CTGAN | 0.0018952004438895825 | 0.11355271761877538 |
| GANBLR | 0.0018952004438895825 | 0.10377477877428594 |
| KDE | 0.0018948196393339823 | 0.03397027996432563 |
| Augmentation Method | Similarity in Feature Means | Similarity in Standard Deviations |
|---|---|---|
| KDE | ★★★★✩ (Highest) | ★★★★✩ (Most Stable) |
| CTGAN | ★★★★✩ (Moderate Shift) | ★★✩✩✩ (Higher Variability) |
| GANBLR | ★★★✩✩ (Moderate Shift) | ★★✩✩✩ (Higher Variability) |
| Feature | Entropy (Original) | Entropy (CBU + GANBLR) | IG (Original) | IG (CBU + GANBLR) |
|---|---|---|---|---|
| ALT | 4.72 | 6.43 | 0.02472 | 0.09320 |
| AST | 4.51 | 6.07 | 0.01579 | 0.08412 |
| CRP | 5.06 | 5.52 | 0.01594 | 0.06060 |
| Band | 1.53 | 2.99 | 0.00211 | 0.07852 |
| UWBC | 4.01 | 5.91 | 0.02645 | 0.09408 |
| Recall Threshold | Dataset | Actual Recall (%) | Precision (%) | Specificity (%) | F1-Score (%) | F2-Score (%) |
|---|---|---|---|---|---|---|
| 80% | CGMH | 81.7% | 63.6% | 99.3% | 71.5% | 77.3% |
| 85% | CGMH | 85.2% | 56.0% | 99.0% | 67.6% | 77.2% |
| 90% | CGMH | 90.8% | 46.3% | 98.4% | 61.3% | 76.2% |
| 95% | CGMH | 95.2% | 37.3% | 97.5% | 53.6% | 72.6% |
| 80% | KMUH | 83.9% | 33.0% | 92.7% | 47.4% | 64.1% |
| 85% | KMUH | 85.5% | 30.8% | 92.2% | 45.3% | 63.1% |
| 90% | KMUH | 90.3% | 26.8% | 90.0% | 41.3% | 56.0% |
| 95% | KMUH | 95.2% | 13.3% | 74.7% | 23.4% | 42.7% |
| Augmentation Method | CGMH F1-Score (%) | KMUH F1-Score (%) |
|---|---|---|
| CTGAN | 58.8 | 35.7 |
| KDE | 58.2 | 35.3 |
| GANBLR | 61.4 | 41.3 |
Disclaimer/Publisher’s Note: The statements, opinions and data contained in all publications are solely those of the individual author(s) and contributor(s) and not of MDPI and/or the editor(s). MDPI and/or the editor(s) disclaim responsibility for any injury to people or property resulting from any ideas, methods, instructions or products referred to in the content. |
© 2025 by the authors. Licensee MDPI, Basel, Switzerland. This article is an open access article distributed under the terms and conditions of the Creative Commons Attribution (CC BY) license (https://creativecommons.org/licenses/by/4.0/).
Share and Cite
Huang, H.-C.; Hung, C.-S.; Lin, C.-H.R.; Shie, Y.-Z.; Yu, C.-H.; Huang, T.-H. A Multi-Stage Framework for Kawasaki Disease Prediction Using Clustering-Based Undersampling and Synthetic Data Augmentation: Cross-Institutional Validation with Dual-Center Clinical Data in Taiwan. Bioengineering 2025, 12, 742. https://doi.org/10.3390/bioengineering12070742
Huang H-C, Hung C-S, Lin C-HR, Shie Y-Z, Yu C-H, Huang T-H. A Multi-Stage Framework for Kawasaki Disease Prediction Using Clustering-Based Undersampling and Synthetic Data Augmentation: Cross-Institutional Validation with Dual-Center Clinical Data in Taiwan. Bioengineering. 2025; 12(7):742. https://doi.org/10.3390/bioengineering12070742
Chicago/Turabian StyleHuang, Heng-Chih, Chuan-Sheng Hung, Chun-Hung Richard Lin, Yi-Zhen Shie, Cheng-Han Yu, and Ting-Hsin Huang. 2025. "A Multi-Stage Framework for Kawasaki Disease Prediction Using Clustering-Based Undersampling and Synthetic Data Augmentation: Cross-Institutional Validation with Dual-Center Clinical Data in Taiwan" Bioengineering 12, no. 7: 742. https://doi.org/10.3390/bioengineering12070742
APA StyleHuang, H.-C., Hung, C.-S., Lin, C.-H. R., Shie, Y.-Z., Yu, C.-H., & Huang, T.-H. (2025). A Multi-Stage Framework for Kawasaki Disease Prediction Using Clustering-Based Undersampling and Synthetic Data Augmentation: Cross-Institutional Validation with Dual-Center Clinical Data in Taiwan. Bioengineering, 12(7), 742. https://doi.org/10.3390/bioengineering12070742