Article

In Silico Identification of LSD1 Inhibition-Responsive Targets in Small Cell Lung Cancer

1
Department of Medical Biology, Faculty of Medicine, Recep Tayyip Erdogan University, 53020 Rize, Türkiye
2
Department of Chest Diseases, Faculty of Medicine, Recep Tayyip Erdogan University, 53020 Rize, Türkiye
3
Department of Biostatistics and Medical Informatics, Faculty of Medicine, Recep Tayyip Erdogan University, 53020 Rize, Türkiye
*
Author to whom correspondence should be addressed.
Bioengineering 2025, 12(5), 504; https://doi.org/10.3390/bioengineering12050504
Submission received: 29 March 2025 / Revised: 28 April 2025 / Accepted: 8 May 2025 / Published: 10 May 2025
(This article belongs to the Special Issue Recent Advances in Genomics Research)

Abstract

:
Small cell lung cancer (SCLC) is an aggressive neuroendocrine malignancy characterized by rapid progression, high metastatic potential, and limited therapeutic options. Lysine-specific demethylase 1 (LSD1) has been identified as a promising epigenetic target in SCLC. RG6016 (ORY-1001) is a selective LSD1 inhibitor currently under clinical investigation for its antitumor activity. In this study, publicly available RNA-Seq datasets from SCLC patient-derived xenograft (PDX) models treated with RG6016 were reanalyzed using bioinformatic approaches. Differential gene expression analysis was conducted to identify genes responsive to LSD1 inhibition. Candidate genes showing significant downregulation were further evaluated by molecular docking to assess their potential interaction with RG6016. The analysis identified a set of differentially expressed genes following RG6016 treatment, including notable downregulation of MYC, UCHL1, and TSPAN8. In silico molecular docking revealed favorable docking poses between RG6016 and the proteins encoded by these genes, suggesting potential direct or indirect targeting. These findings support a broader mechanism of action for RG6016 beyond its known interaction with LSD1. This study demonstrates that RG6016 may exert its antitumor effects through the modulation of additional molecular targets such as MYC, UCHL1, and TSPAN8 in SCLC. The combined bioinformatic and molecular docking analyses provide new insights into the potential multi-target profile of RG6016 and indicate the need for further experimental validation.

Graphical Abstract

1. Introduction

Small cell lung carcinoma (SCLC) accounts for approximately 15% of all lung cancers, which are among the leading causes of cancer-related deaths worldwide [1]. SCLC is strongly linked to tobacco use [2] and is characterized by a high proliferation rate, early metastatic spread, and extremely poor prognosis [1]. The aggressive clinical course of SCLC is largely attributed to its high mutational burden and genomic instability [3].
The biological heterogeneity of SCLC, despite its relatively uniform histological appearance, has emerged as a significant subject of extensive research in recent years [4]. In addition to intertumoral heterogeneity in molecular alterations and the expression of key transcription factors such as TP53, RB1, and MYC, SCLC also exhibits significant intratumoral heterogeneity. This is reflected in the coexistence of cancer cell populations with varying drug sensitivities and resistance mechanisms, which may contribute to the development of chemoresistance, disease progression, and metastasis [5,6]. SCLC is considered one of the most highly metastatic solid tumors, with widespread metastases to the lymph nodes, brain, liver, and bones commonly present at the time of diagnosis in the majority of patients [7]. The high metastatic potential of SCLC is further supported by the high number of circulating tumor cells (CTCs) observed in these patients, offering a unique opportunity for metastatic dissemination [8].
Lysine-specific demethylase 1 (LSD1) functions as a histone demethylase that removes H3K4 mono- and di-methylation transcription marks [9]. Small-molecule inhibitors targeting LSD1 have demonstrated promising antitumor activity in preclinical models of malignancies such as acute myeloid leukemia (AML), SCLC, and medulloblastoma [10,11,12,13]. In addition to inhibiting its enzymatic activity, some LSD1 inhibitors also function by disrupting the interaction between LSD1 and SNAG domain-containing proteins [14], as well as its interaction with chromatin [10]. To date, irreversible LSD1 inhibitors such as tranylcypromine, IMG-7289, INCB059872, GSK-2879552, ORY-1001 (RG6016), ORY-2001, TAK-418, and LH-1802, as well as reversible inhibitors such as SP-2577 and CC-9001, have entered clinical trials [15]. RG6016 is a highly potent and selective covalent LSD1 inhibitor with high selectivity against related flavin adenine dinucleotide (FAD) that has been evaluated in phase I/II clinical trials. This compound has been tested in patients with relapsed or refractory SCLC and AML for its safety profile, pharmacodynamic effects, and maximum tolerated dose [16,17,18].
This study aims to investigate the selective efficacy of the LSD1 inhibitor RG6016 across SCLC subgroups and to elucidate the molecular mechanisms supporting this efficacy. To this end, RNA-seq data from seven ex vivo cultured SCLC patient-derived xenograft (PDX) samples and control groups, obtained from the NCBI-GEO (Gene Expression Omnibus) database under the study titled ‘Targeting NOTCH activation in small cell lung cancer through LSD1 inhibition’, were analyzed using bioinformatics methods. Through the analysis of transcriptomic data obtained from the GEO database, the expression profiles of target genes responsive to LSD1 inhibition were identified, and molecular docking analyses were performed to evaluate potential target genes. Favorable docking poses between RG6016 and the proteins encoded by these target genes were evaluated through molecular docking studies. This study aims to contribute to a better understanding of the therapeutic potential and mechanisms of LSD1 inhibition in SCLC.

2. Material and Methods

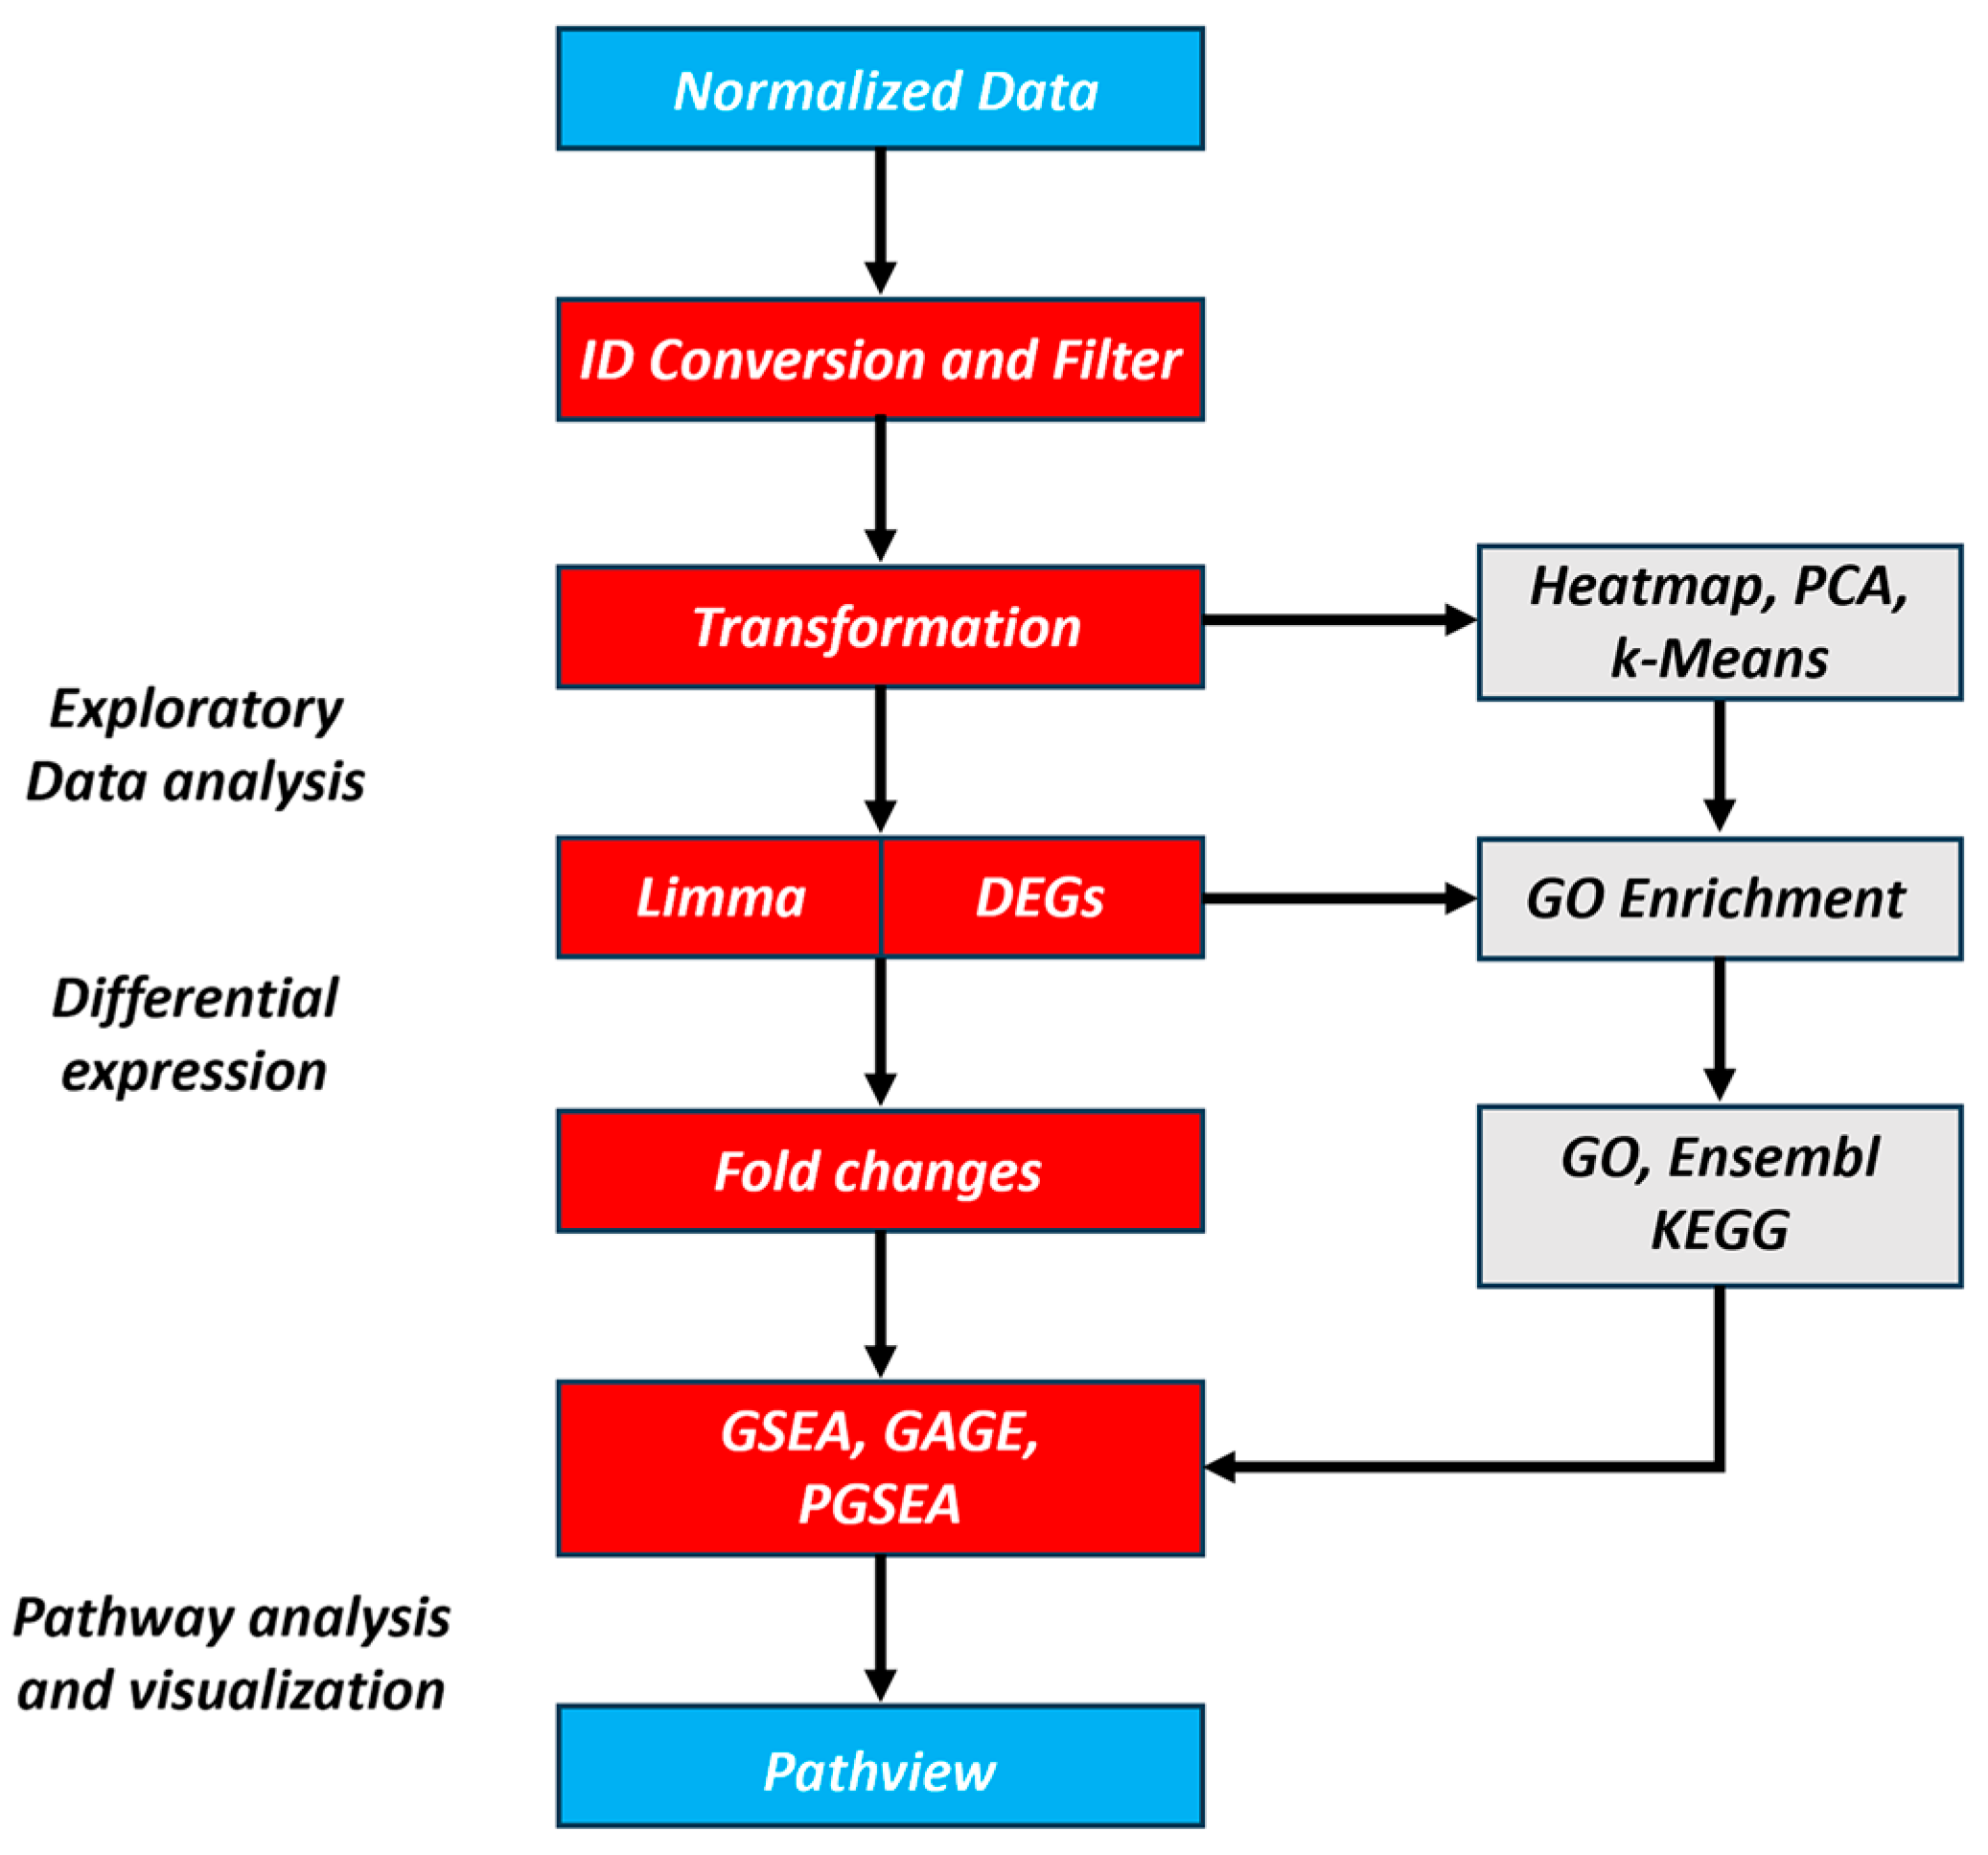
2.1. Bioinformatic Processing of Public RNA-Seq Data

This study reanalyzed RNA-Seq datasets from the publication ‘Targeting NOTCH activation in small cell lung cancer through LSD1 inhibition’ [19] available in the NCBI GEO database, using bioinformatics methods to identify target genes associated with treatment response as potential biomarkers. The referenced study investigated the selective efficacy of the LSD1 inhibitor RG6016 across SCLC PDX models. In this study, we reanalyzed publicly available RNA-Seq data generated from PDX models of SCLC, which were established from CTCs or tumor tissues of patients with extensive-stage disease and treated with the LSD1 inhibitor RG6016; the models were propagated in NSG mice and subjected to drug treatment protocols involving oral administration of RG6016 or saline control, enabling the investigation of transcriptional responses to LSD1 inhibition. The RNA-Seq data have been made publicly available in the Gene Expression Omnibus database under the accession numbers GSE103095, GSE103096, and GSE103097 [19]. In the present study, the downloaded RNA-Seq data were re-evaluated using bioinformatics approaches, and analyses were conducted to identify potential target genes. RNA-Seq data from a total of 14 samples—including 7 ex vivo cultured SCLC samples treated with RG6016 and corresponding control groups—were examined in detail using bioinformatics methods (Table 1). During the data analysis process, dimensionality reduction was performed on the raw dataset containing 35,230 genes by applying Principal Component Analysis (PCA), reducing the number of genes to 18,539. Subsequently, the processed data matrix containing normalized gene expression levels was analyzed using R (version 3.20) and Bioconductor (version 4.4.0) packages for exploratory analysis, differential gene expression (DEG) identification, and pathway enrichment analyses. The selective effects of the LSD1 inhibitor on gene expression were identified, and the underlying molecular mechanisms were analyzed. The bioinformatics analysis of RNA-Seq data enabled a detailed characterization of the genetic and biological profiles of each subgroup, resulting in the identification of candidate target genes [20]. Figure 1 provides a flowchart summarizing the analysis process.

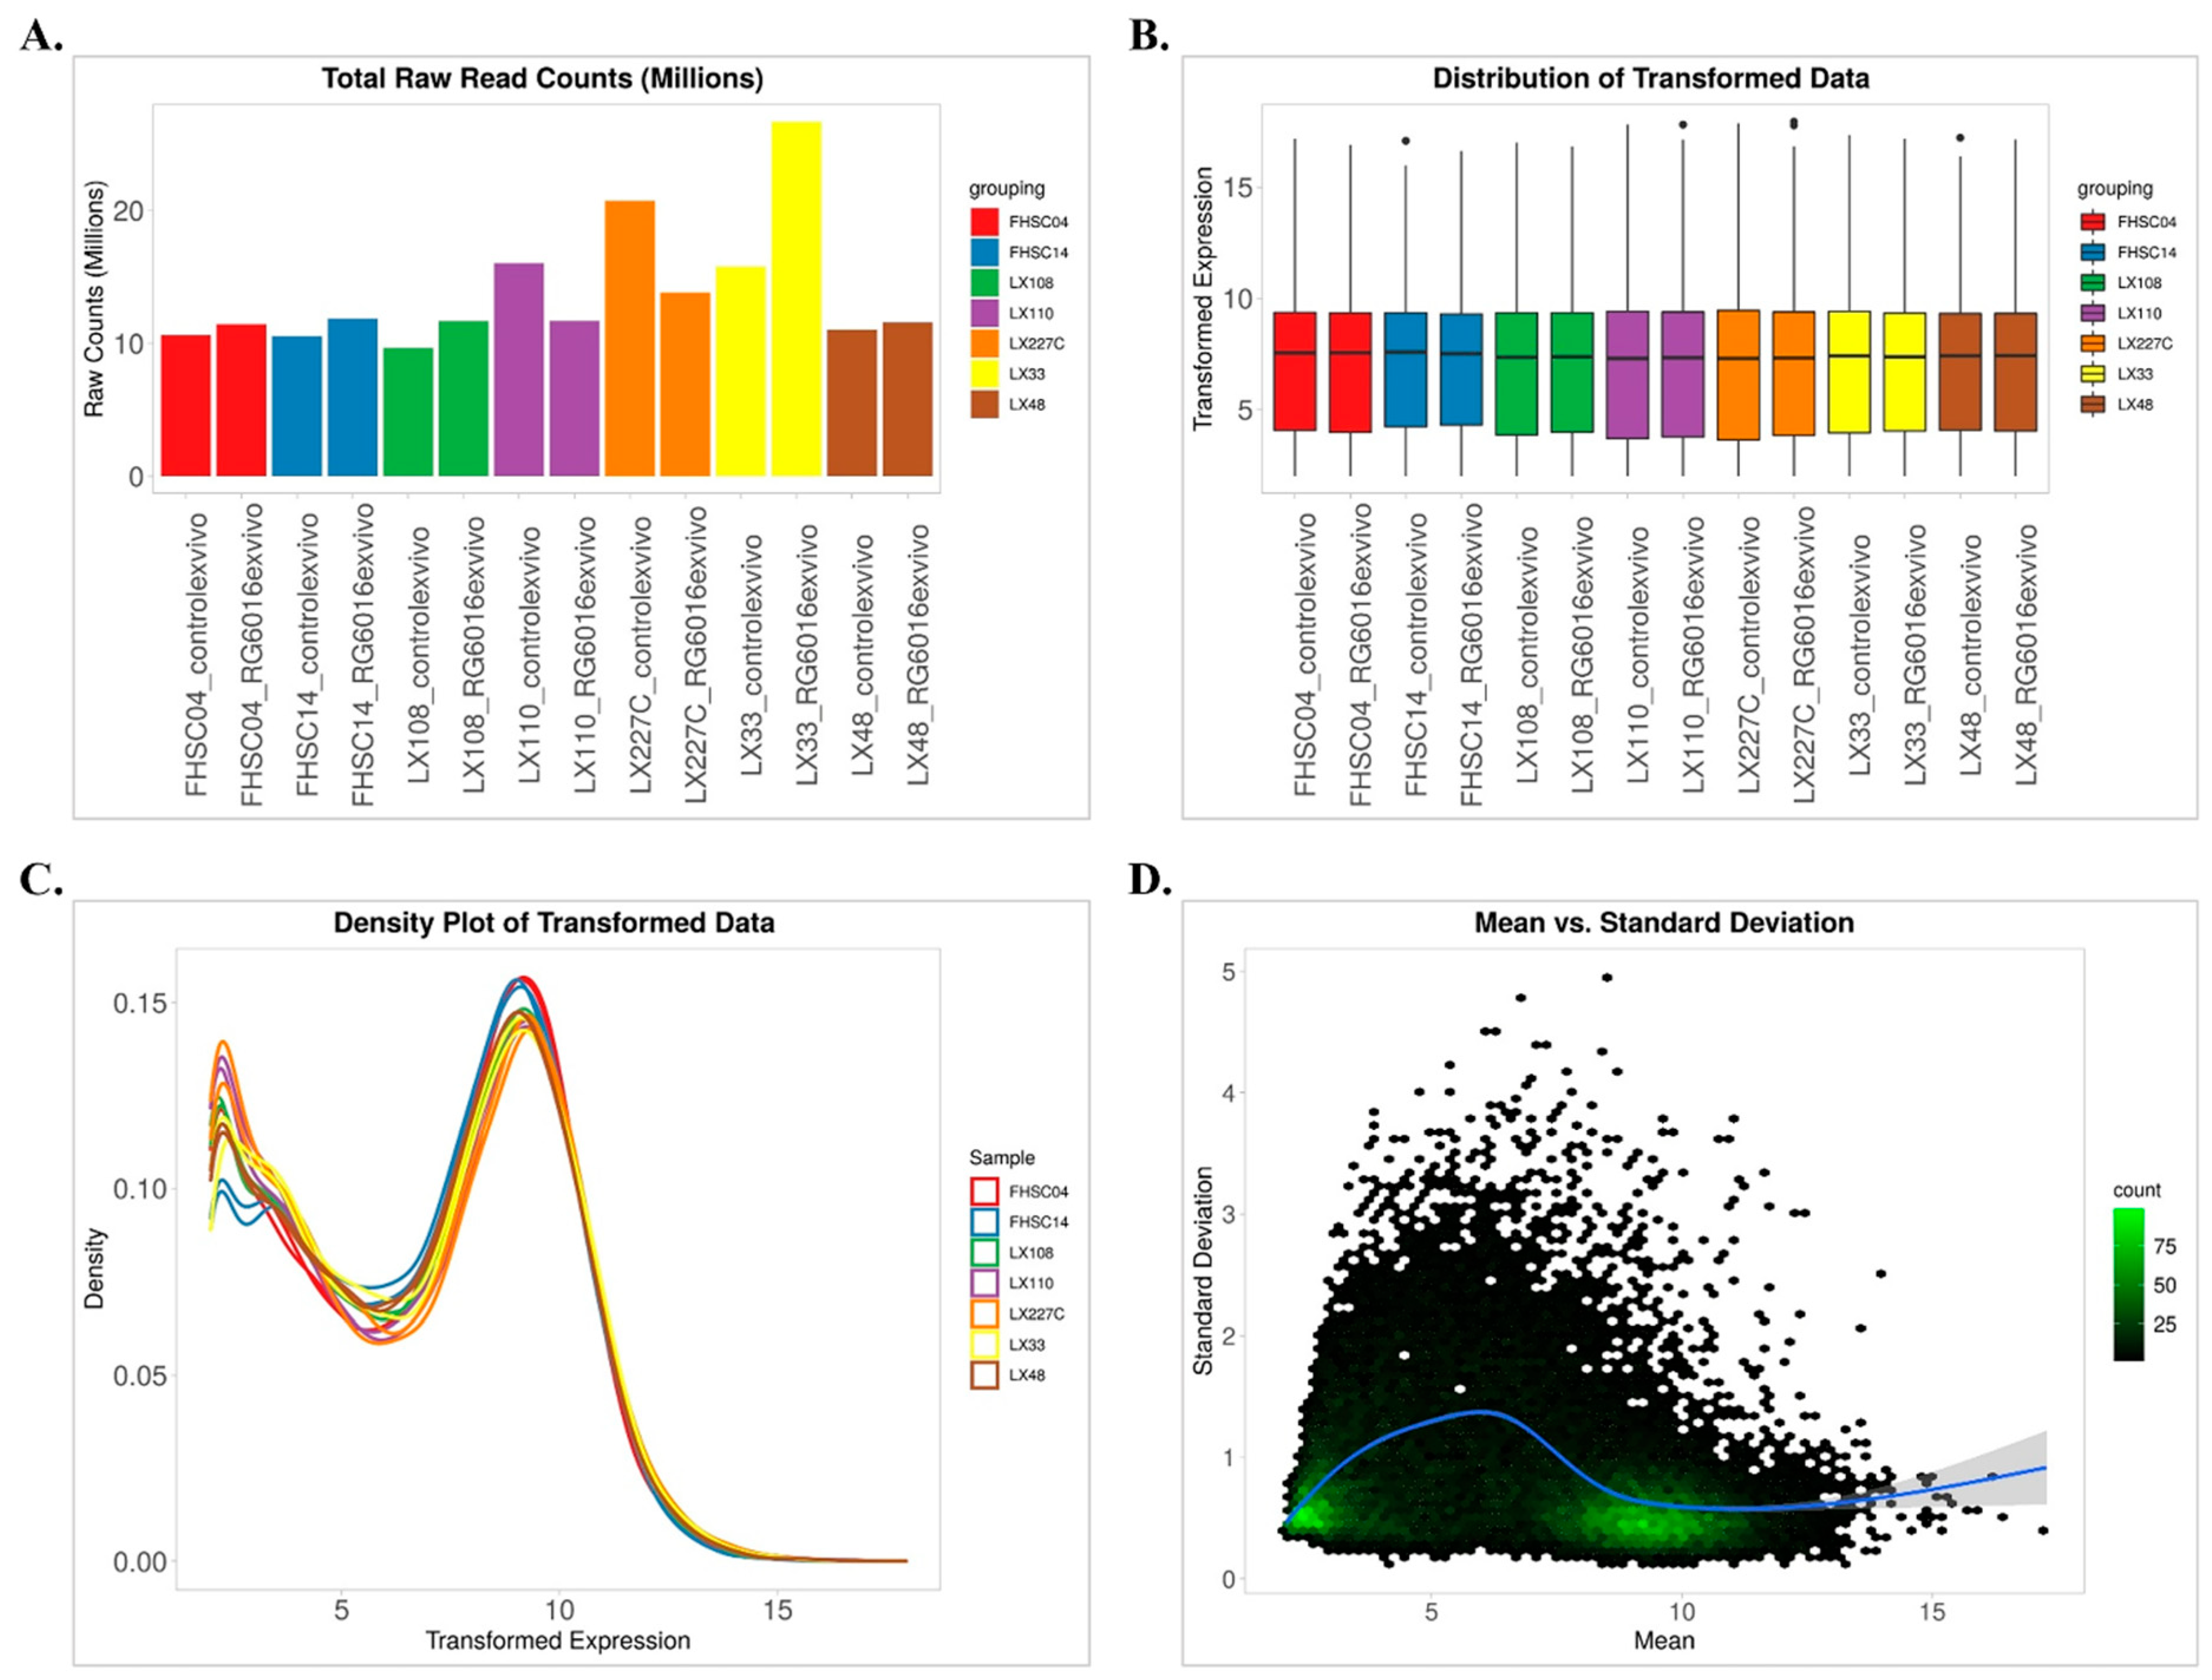
2.2. Data Preprocessing

During the data preprocessing stage, gene identifiers were matched with a reference database to enable automatic conversion and species annotation. Genes with minimal downregulation were excluded from the analysis based on statistical thresholds determined using a threshold-based Wald test (FDR ≤ 0.1 and minimum fold change ≥ 2). This selection was made to enhance the reliability of the differential expression analysis by considering the experimental design, samples, and treatment conditions. The data were appropriately transformed using various methods. Analysis using the edgeR library in R (version 3.20) and Bioconductor (version 4.4.0) revealed that the data distribution for both control and treatment groups across all samples was skewed. This skewness was corrected by applying a log2 transformation, which approximated a normal distribution. The transformation preserved small values while reducing variability across all samples and had a notable impact on downregulated genes. Raw read counts in the cells reflected the quantity of sequencing reads generated under different experimental conditions. However, variations observed between samples were indicative of possible technical variations arising from sample preparation and sequencing processes. These differences were assessed to determine the presence of a potential batch effect, and normalization procedures were applied accordingly (Figure 2A). Following normalization and transformation, the distribution of gene expression levels was examined, and it was observed that systematic differences between samples were largely corrected. This process ensured the reduction in inter-sample variance and enabled the comparability of gene expression levels (Figure 2B). The distribution of transformed gene expression data between control and treatment groups was examined using density plots, allowing for the visualization of expression patterns across the dataset (Figure 2C). Density plots were chosen as they provide a continuous curve representation of the overall distribution of gene expression levels, helping detect variation and potential systematic changes between groups. Additionally, boxplot analyses were performed to further enhance the comparability of the dataset. The variance of gene expression levels was assessed, and genes were filtered based on their statistical reliability and suitability for differential expression analysis. FDR ≤ 0.1 and minimum fold change ≥ 2 were used as threshold values for gene filtering (Figure 2D). As a result, only genes that showed statistically significant and biologically relevant changes were included in the analysis.

2.3. Principal Component Analysis

In this study, Principal Component Analysis (PCA) was applied to reduce the dimensionality of the dataset and to identify underlying patterns [21]. PCA was performed on the gene expression matrix derived from RNA sequencing data to examine the effects of control and RG6016 treatments on different SCLC PDX models. The PCA score plot presented in Figure 3A reveals a separation of samples based on treatment status and PDX model. However, some samples from the control and RG6016 treatment groups did not fully conform to the expected clustering pattern. This discrepancy is associated with the distinct biological responses of the PDX models to RG6016 treatment. Since RNA-Seq data reflect the biological heterogeneity of the cells, considerable variation in gene expression profiles was observed, leading to a wide distribution in the PCA plot. During the analysis process, it was determined that subdividing the samples and optimizing the normalization steps prior to PCA were necessary to achieve optimal results. Following this optimization, the distribution of the subgroups was arranged as shown in Figure 3A. The PCA score plot in Figure 3A confirms the separation of samples based on treatment groups and PDX samples. The first principal component (PC1), which accounts for 25.1% of the variance, primarily represents differences between PDX samples, while PC2 and PC3, accounting for 19.5% and 14.4% of the variance, respectively, contribute to the separation within each treatment group. As shown in Figure 3B, the first three principal components explain 59% of the total variation in the dataset, while the contribution of the remaining components is minimal. These findings demonstrate that PCA effectively distinguishes gene expression profiles between RG6016-treated and control groups, and that the variance captured by PC1, PC2, and PC3 reflects differences in cellular responses to the treatment.

2.4. Molecular Docking

In this study, potential target proteins identified through bioinformatic analyses for SCLC subtypes were evaluated for their possible binding interactions with the LSD1 inhibitor RG6016 using molecular docking methods. By examining the favorable docking poses of RG6016 with different proteins, the aim was to gain structural insights into the molecular mechanisms underlying the therapeutic effects of LSD1 inhibition in SCLC. The chemical structure of RG6016, used as the ligand, was obtained in PDB format from the PubChem database (CID: 71543365) (Figure 4). The molecule underwent energy minimization using UCSF Chimera 1.18 software [22] and was prepared for molecular docking using AutoDock Tools software (Version: 1.5.7) [23].
The three-dimensional structures of the proteins, based on the products of the target genes, were primarily obtained from the Protein Data Bank (PDB) database [24]. For proteins without available crystal structures, models were retrieved from the AlphaFold Protein Structure Database (https://alphafold.ebi.ac.uk/) (accessed on 23 March 2025) [25]. In the docking analyses, the crystal structure of the LSD1/FAD complex (PDB ID: 2V1D), the known target of RG6016, was used as a positive control. The docking of RG6016 to LSD1 was performed as a positive control to validate the docking workflow, given that the covalent interaction between RG6016 and LSD1 is experimentally established in prior studies. The binding score for LSD1 was not used as a quantitative reference, but rather to confirm the plausibility of the docking protocol against a known target. MYC (PDB ID: 1NKP) and UCHL1 (PDB ID: 2ETL) crystal structures were also included in the analysis. The remaining protein models were obtained from the AlphaFold Protein Structure Database and included the following: TSPAN8 (AF-P19075-F1-model_v4), BEX1 (AF-Q9HBH7-F1-model_v4), BEX3 (AF-Q00994-F1-model_v4), CALCA (AF-P01258-F1-model_v4), CD99 (AF-P14209-F1-model_v4), IRX2 (AF-Q9BZI1-F1-model_v4), MAGED4 (AF-Q96JG8-F1-model_v4), OLFM1 (AF-Q99784-F1-model_v4), SEZ6L (AF-Q9BYH1-F1-model_v4), TFF3 (AF-Q07654-F1-model_v4), and SPOCK1 (AF-Q08629-F1-model_v4). The structural quality of each model was assessed based on the average predicted Local Distance Difference Test (pLDDT) scores provided by AlphaFold. These pLDDT scores serve as an internal confidence metric for specific regions of the model. Generally, pLDDT values above 70 indicate reliable backbone predictions, whereas lower scores may correspond to intrinsically disordered regions or flexible loops. In this study, only human-derived protein models were selected for docking analyses. As a result, although some proteins exhibited average pLDDT scores below 70, they were included in the analyses due to the lack of alternative suitable structures in the AlphaFold database. Notably, proteins such as TSPAN8 (88.12), OLFM1 (79.39), and TFF3 (80.13) exceeded the high-confidence threshold. In contrast, proteins including BEX1, BEX3, CALCA, CD99, IRX2, MAGED4, SEZ6L, and SPOCK1 were also considered despite lower pLDDT scores, as they were of human origin and relevant to the experimental context of this study. A summary of the corresponding UniProt identifiers and average pLDDT scores is provided in Table S1 [26].
All protein structures were prepared for docking analysis using AutoDock Tools (Version: 1.5.7) [23]. During this process, polar hydrogen atoms were added, Gasteiger charges and Kollman united atom charges were assigned, and water molecules present in crystal structures were removed. For each target protein, binding regions were defined using AutoDock Tools 1.5.7. Grid boxes were sized to encompass the potential binding sites, and center coordinates (X, Y, Z) were determined. Binding regions were identified by positioning the ligand within the presumed cavity, and the grid box center was determined based on the geometric location of the ligand as automatically suggested by AutoDock Tools [27]. Docking analyses were conducted for a total of 14 proteins, including the positive control LSD1/FAD complex and 13 target proteins identified through bioinformatics analyses. Specific grid coordinates and box sizes for each protein are detailed in Table 2. Docking studies were performed using AutoDock Vina (Version: 1.1.2) [28]. The binding energies (kcal/mol) of RG6016 to each target protein were calculated, and conformations with the lowest binding energies were selected for further analysis. The docking scores reported in this study reflect pose-fitting estimations based on the AutoDock Vina scoring function. These scores do not represent thermodynamic binding affinities and should not be interpreted as direct measures of binding energy. Ligand–protein interactions based on these conformations were analyzed using BIOVIA Discovery Studio 2024 Client (Dassault Systèmes, 2024).

3. Results

3.1. Correlation Matrix Among PDX Samples

The gene expression profiles of the control and RG6016-treated PDX samples were analyzed using log2-transformed values and scatter plots to evaluate linear relationships (Figure 5). For each biological replicate, Pearson correlation coefficients (r) and p-values were calculated to assess the strength of these relationships. Strong and positive correlations were observed between FHSC04-control and FHSC04-RG6016 (r = 0.99, p < 0.001), FHSC14-control and FHSC14-RG6016 (r = 0.99, p < 0.001), LX108-control and LX108-RG6016 (r = 0.99, p < 0.001), LX110-control and LX110-RG6016 (r = 0.99, p < 0.001), LX227C-control and LX227C-RG6016 (r = 0.99, p < 0.001), LX33-control and LX33-RG6016 (r = 0.99, p < 0.001), and LX48-control and LX48-RG6016 (r = 0.99, p < 0.001). The observed high positive correlations reflect a strong similarity and reproducibility of gene expression profiles across diverse PDX samples in both control and treatment conditions, emphasizing the reliability and consistency of the experimental data.

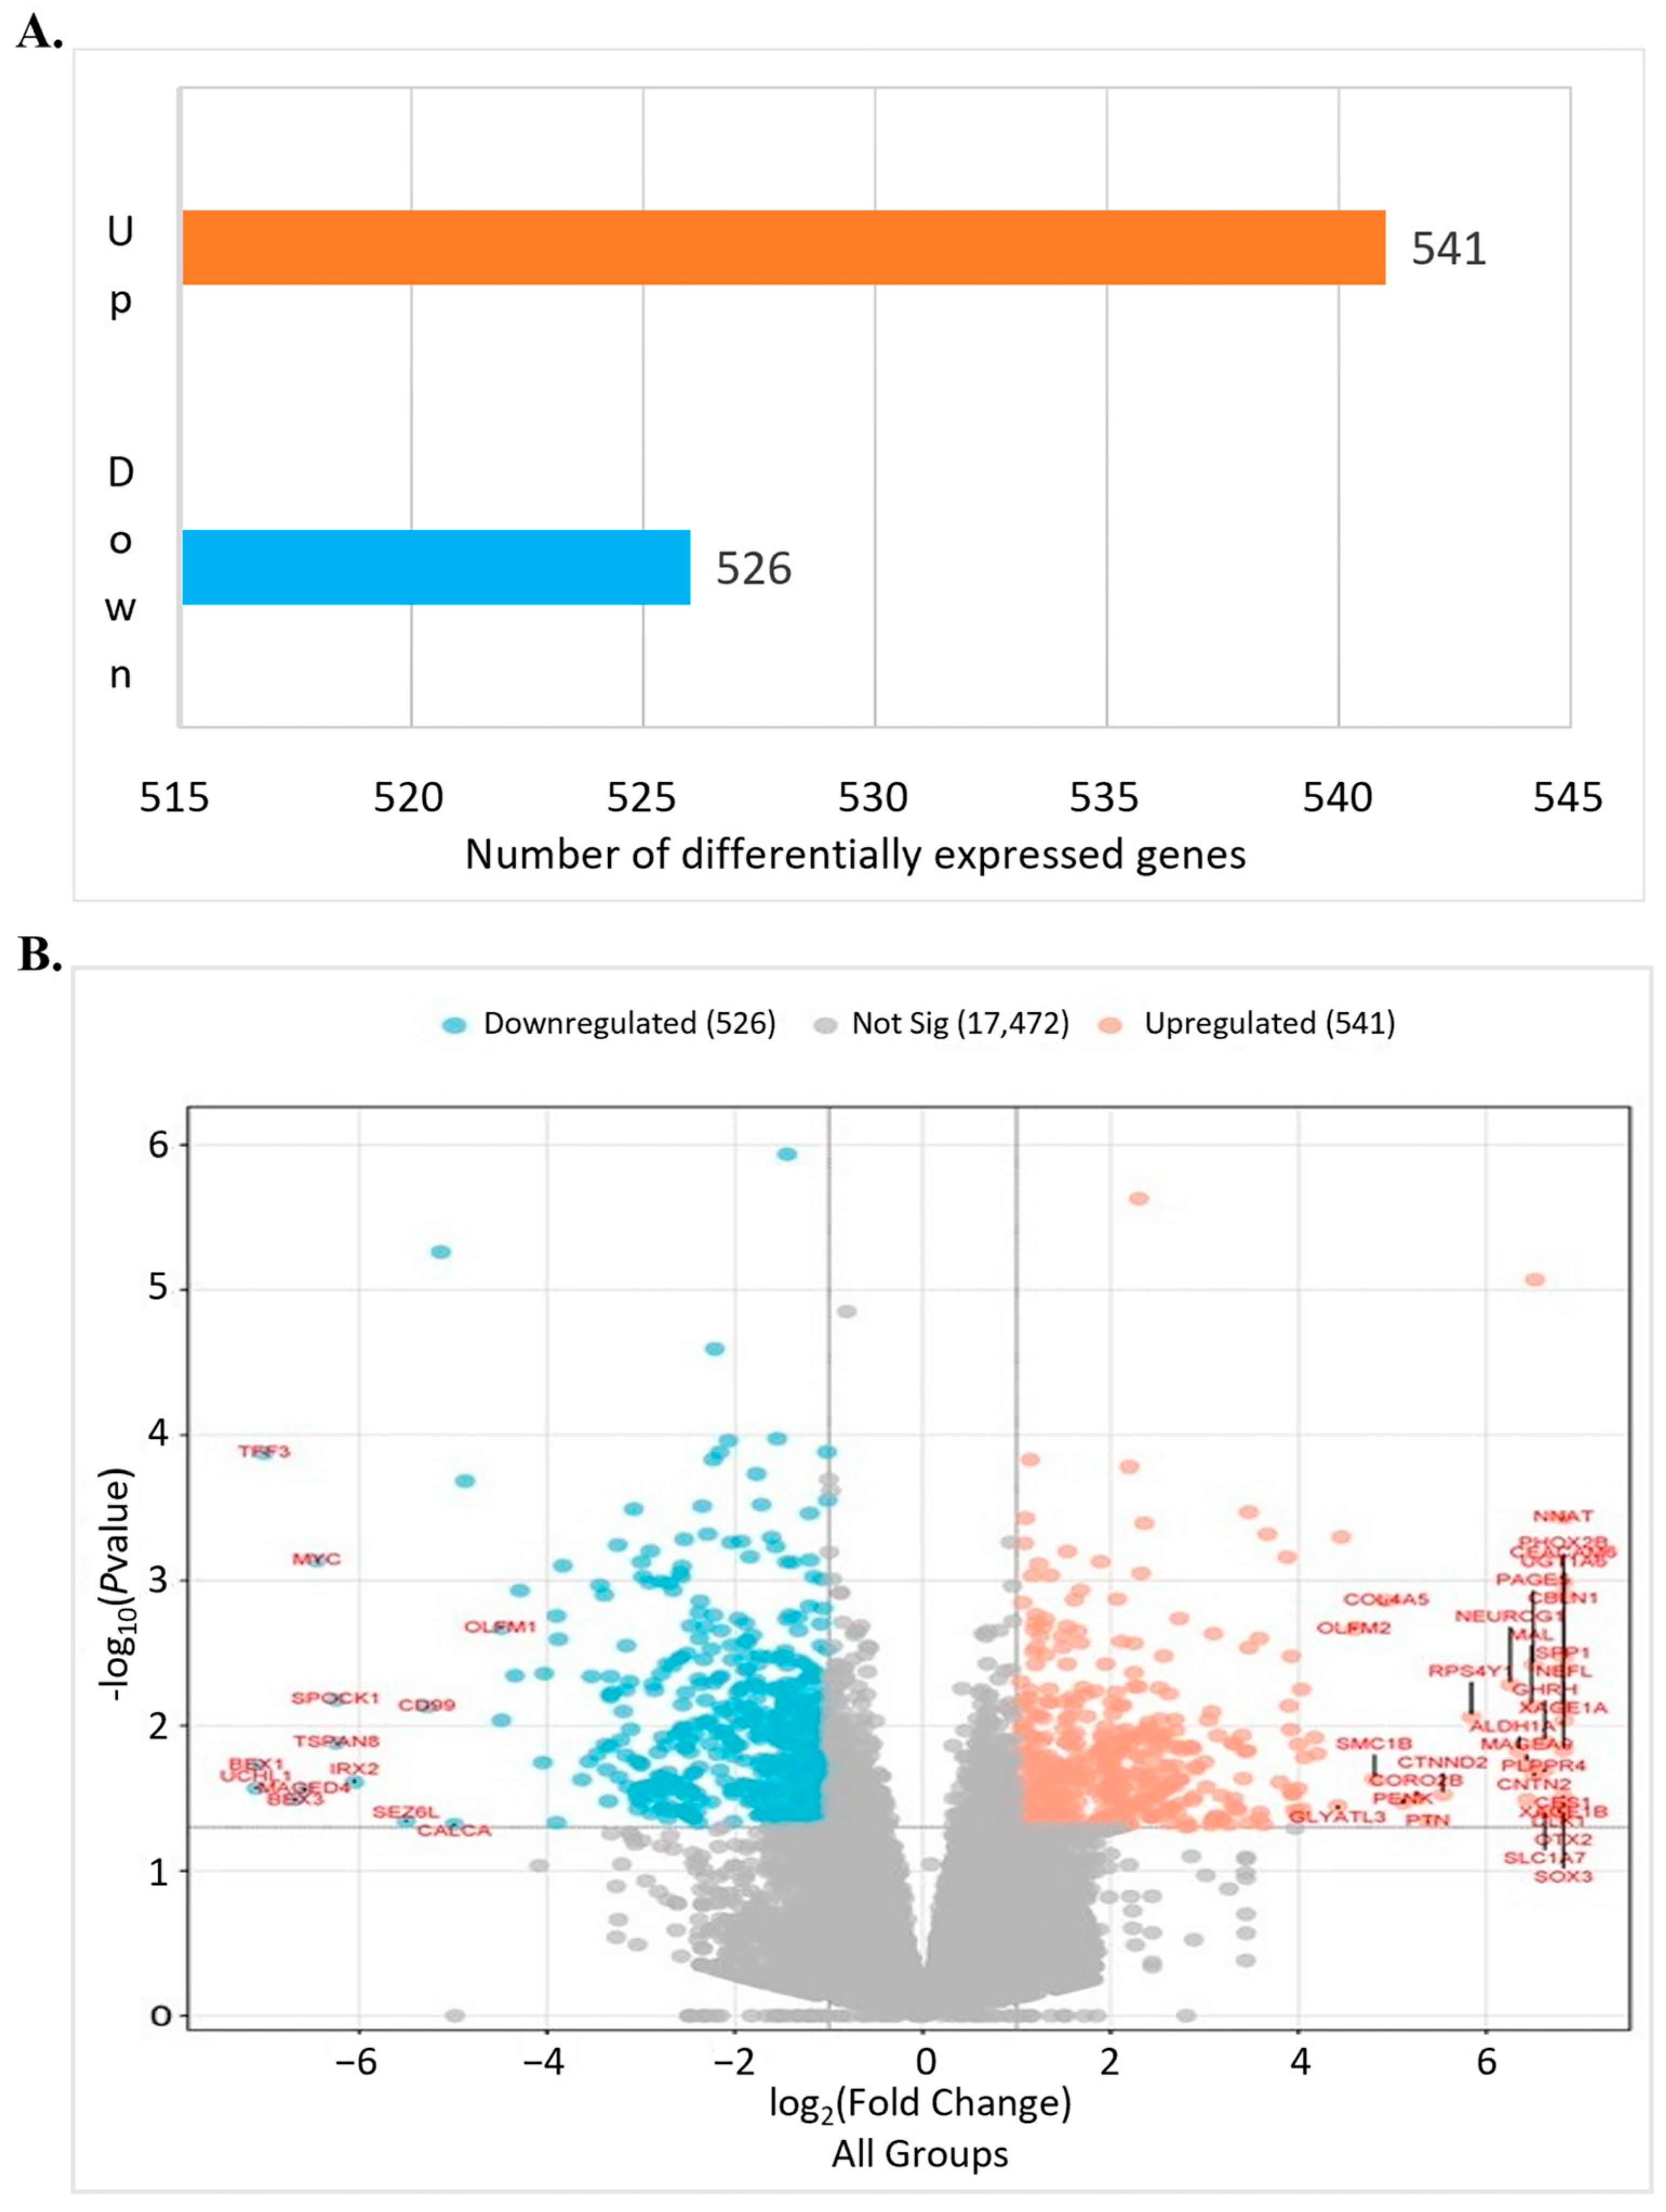
3.2. Differentially Expressed Genes2 (DEG2) Analysis

In this study, differential gene expression analysis was performed to identify expression differences between the control and RG6016-treated samples. As a result of the analysis, a total of 961 genes were found to be significantly differentially expressed; among them, 541 genes were upregulated and 526 genes were downregulated (Figure 6A). As shown in Figure 6B, the differentially expressed genes (DEGs) are distributed according to their log2 fold change and adjusted p-values. The upregulated genes exhibited statistically significant positive fold changes, while the downregulated genes showed statistically significant negative fold changes. In addition, 17,472 genes were identified as not significantly differentially expressed. Some genes showed log2 fold change values greater than 6, indicating marked differences in gene expression levels between the control and RG6016-treated groups. The findings in Figure 6B demonstrate that the majority of both upregulated and downregulated genes exhibit not only statistically significant p-values but also substantial fold changes. These data strongly support that RG6016 treatment has a significant and notable impact on gene expression.

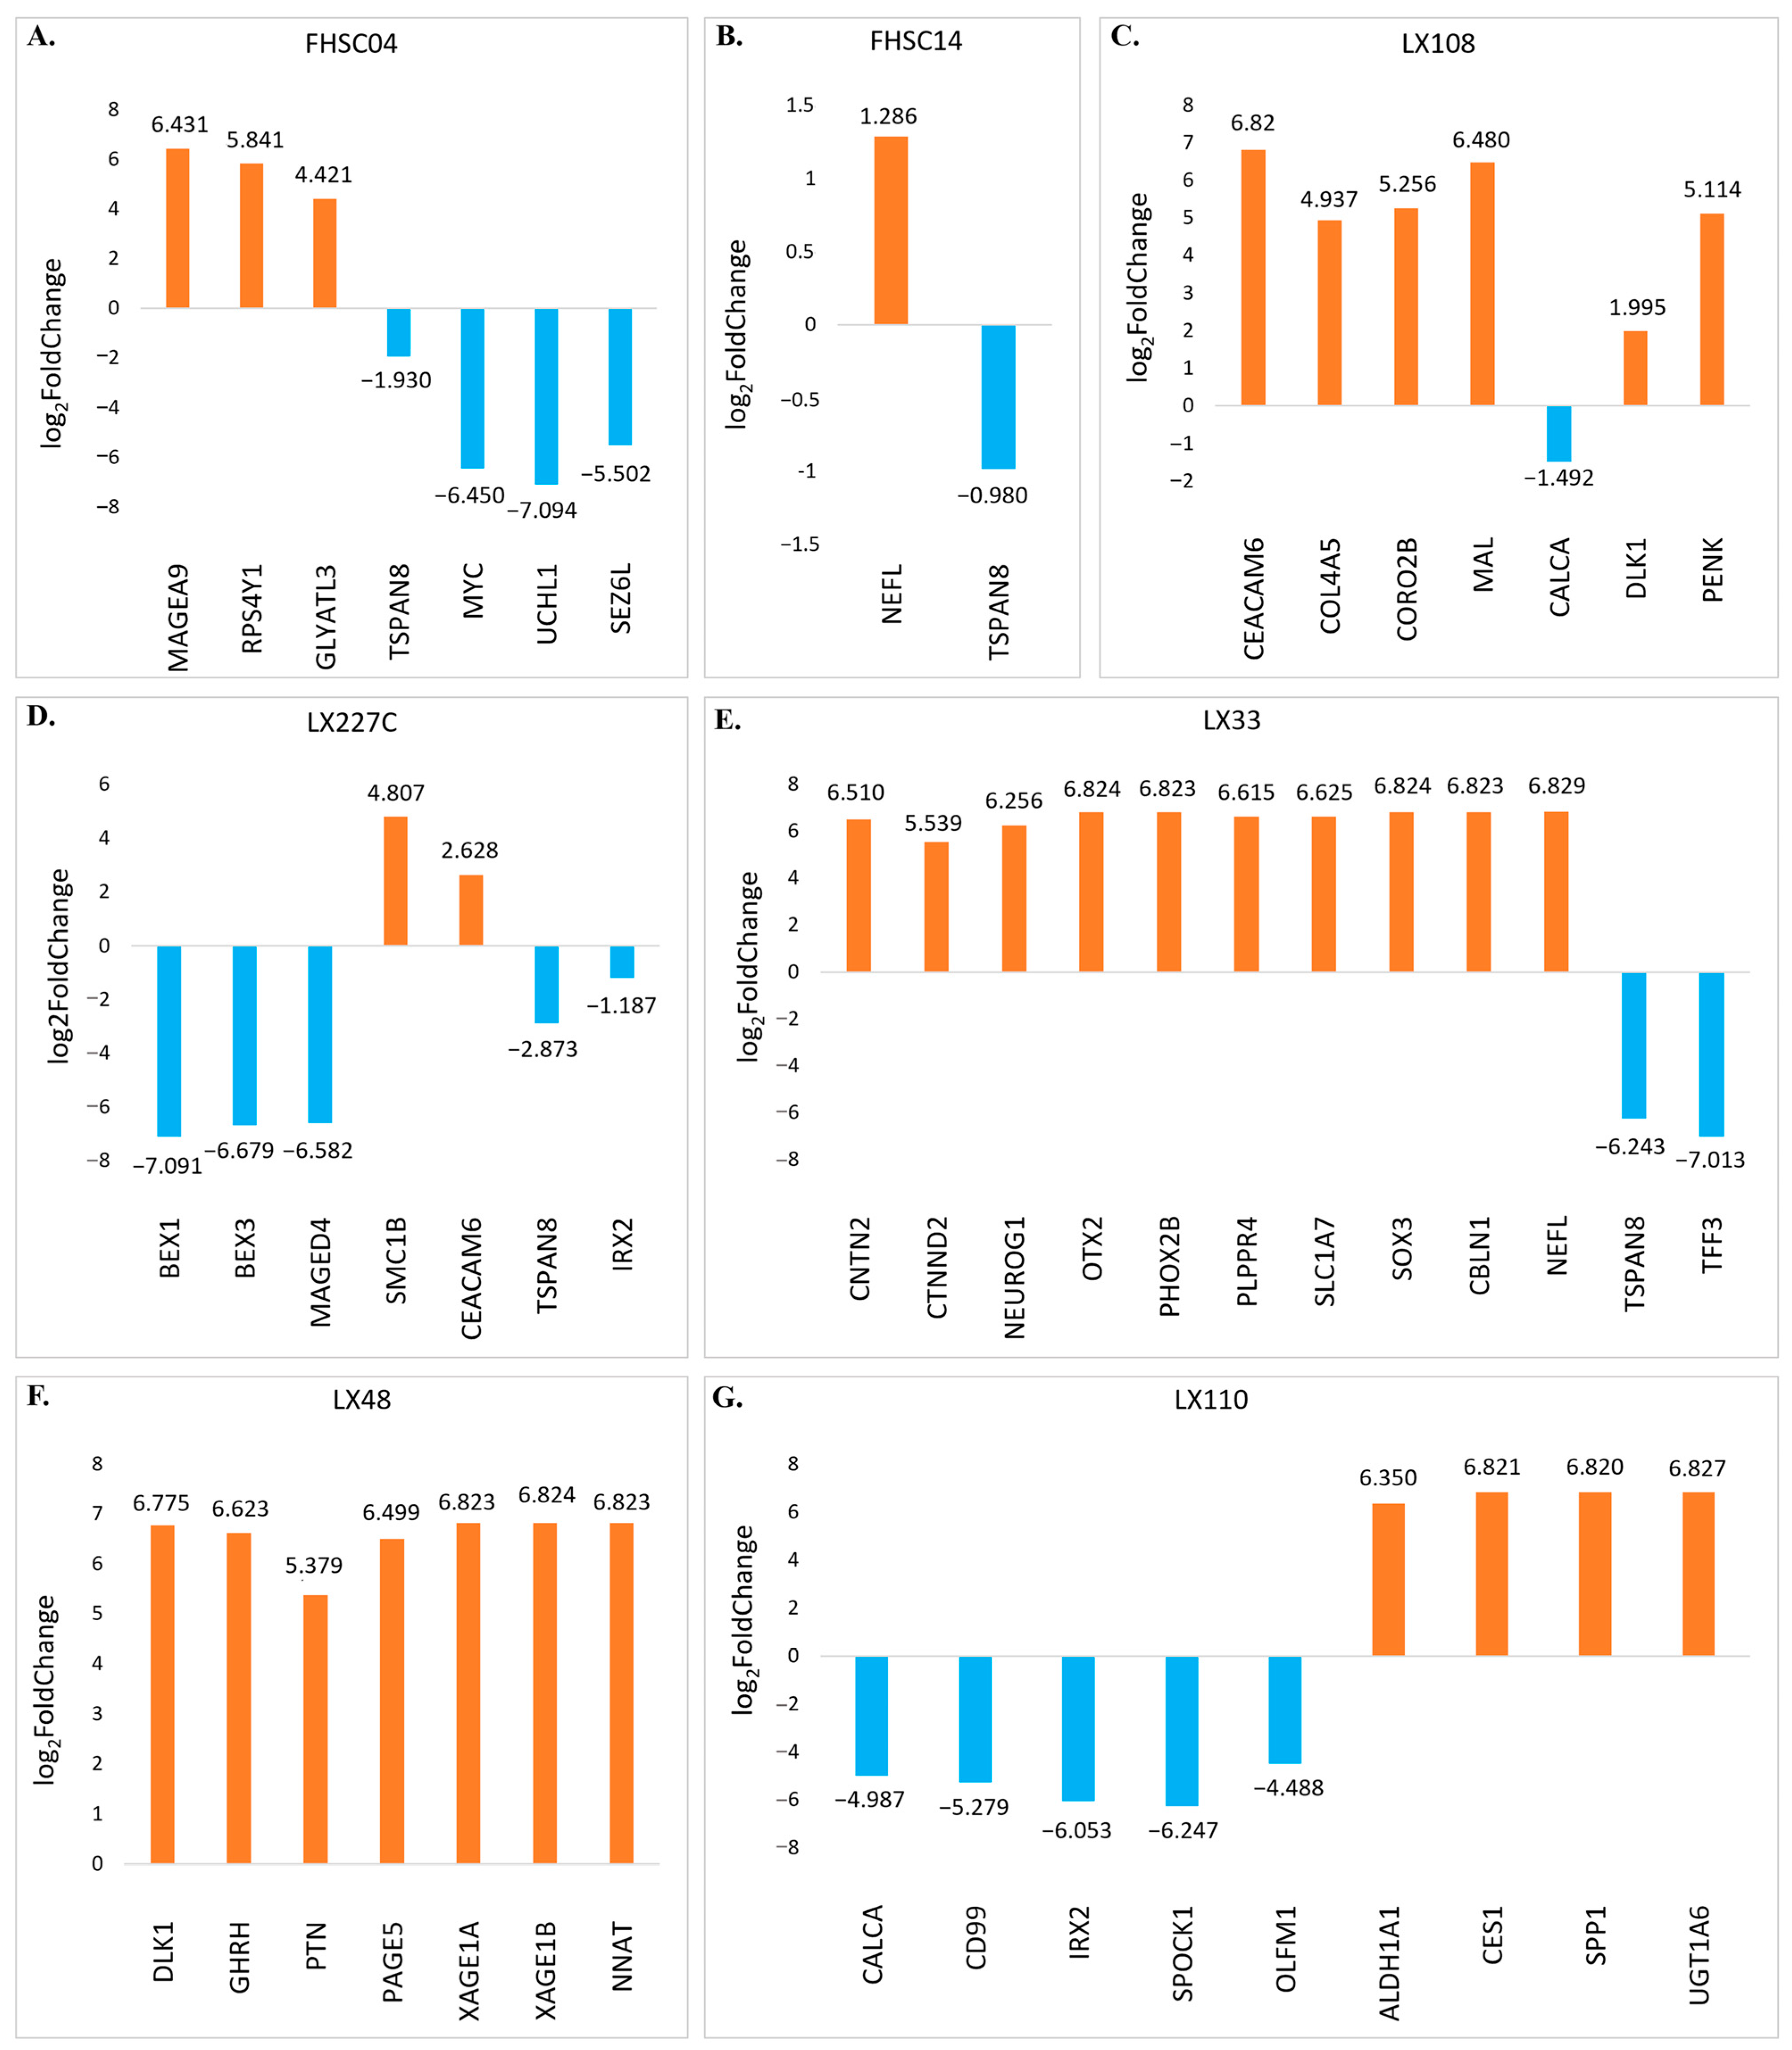
3.3. DEG2 Profiles Across All PDX Samples Following RG6016 Treatment

The heatmap presented in Figure 7A reveals statistically significant differences in gene expression profiles across various PDX samples (FHSC04, FHSC14, LX110, LX227C, LX33, LX48, and LX108) and treatment conditions (control and RG6016). Hierarchical clustering analysis was applied to identify gene expression patterns and demonstrated that RG6016 treatment led to distinct expression profiles in the treated PDX samples. In addition, the associated bar graphs (Figure 7B–F) visualize the normalized gene expression levels in the control and RG6016-treated PDX samples. Overall, RG6016 treatment caused notable changes in gene expression levels across all samples, with PDX model-specific variations in response. According to the differential expression analysis, RG6016 induced statistically significant changes in gene expression in certain PDX samples. As shown in Figure 7B, CALCA (p = 0.048), CD99 (p = 0.007), IRX2 (p < 0.001), SPOCK1 (p = 0.006), and OLFM1 (p = 0.009) were significantly downregulated in LX110. In LX227C, BEX1 (p = 0.01), BEX3 (p = 0.031), and MAGED4 (p = 0.027) were also significantly downregulated under RG6016 treatment, while SMC1B (p = 0.023) was significantly upregulated. Figure 7C shows that in LX33, CNTN2 (p = 0.021), CTNND2 (p = 0.029), NEUROG1 (p = 0.005), OTX2 (p = 0.03), PHOX2B (p < 0.001), PLPPR4 (p = 0.002), SLC1A7 (p = 0.031), and SOX3 (p = 0.004) were significantly upregulated. Additionally, DLK1 (p = 0.003) showed significantly increased expression in LX48 following RG6016 treatment. As shown in Figure 7D, CBLN1 (p = 0.004) was upregulated in LX33; CEACAM6 (p < 0.001), COL4A5 (p = 0.01), CORO2B (p = 0.03), and MAL (p = 0.007) were upregulated in LX108; GHRH (p = 0.01) and PTN (p = 0.045) in LX48; and SEZ6L (p = 0.04) in FHSC04. Conversely, MYC (p < 0.001) and UCHL1 (p = 0.02) were significantly downregulated in FHSC04, and TSPAN8 (p = 0.01) in LX33 under RG6016 treatment. Additionally, Figure 7E shows that GLYATL3 (p = 0.035) was significantly upregulated in FHSC04, NEFL (p = 0.009) in LX33, and PAGE5 (p = 0.003), XAGE1A (p = 0.014), and XAGE1B (p = 0.03) in LX48. In Figure 7F, ALDH1A1 (p = 0.015), CES1 (p = 0.03), SPP1 (p = 0.007), and UGT1A6 (p = 0.003) were significantly upregulated in LX110, while MAGEA9 (p = 0.018) and RPS4Y1 (p = 0.008) were upregulated in FHSC04, and NNAT (p < 0.001) in LX48. In contrast, TFF3 (p < 0.001) was significantly downregulated in LX33.
These findings demonstrate that RG6016 treatment induces distinct, statistically significant changes in gene expression in a PDX sample-specific manner. The data highlight that the effects of RG6016 are not limited to a general response but involve strong and specific molecular reactions in certain PDX samples (see Table 3).
Figure 8 presents the results of differential gene expression analysis across different PDX samples following RG6016 treatment. In each graph (A–G), genes that were significantly upregulated (orange bars) and downregulated (blue bars) based on their log2FoldChange values are displayed. In FHSC04 (Figure 8A), the most prominently upregulated genes were MAGEA9, RPS4Y1, and GLYATL3, while MYC, UCHL1, and SEZ6L were among the most strongly downregulated. In FHSC14 (Figure 8B), NEFL showed a mild upregulation, whereas TSPAN8 was downregulated. The LX108 sample (Figure 8C) exhibited strong upregulation of genes such as CEACAM6, COL4A5, and CORO2B, while TSPAN8 was downregulated. In the LX227C (Figure 8D), BEX1, BEX3, and MAGED4 were the most prominently downregulated genes, whereas CEACAM6 and TSPAN8 were upregulated. In the LX33 (Figure 8E), genes such as CNTN2, NEUROG1, OTX2, and PHOX2B were notably upregulated, while TSPAN8 and TFF3 showed strong downregulation. In LX48 (Figure 8F), DLK1, GHRH, and PTN were upregulated. Lastly, in LX110 (Figure 8G), CES1, SPP1, and UGT1A6 were among the most strongly upregulated genes, while CALCA (log2FoldChange: −4.987), CD99, and IRX2 were significantly downregulated. The differential expression analyses presented in Figure 8 clearly demonstrate that RG6016 treatment induces statistically significant changes in gene expression levels across all PDX samples. When evaluated in terms of both upregulation and downregulation, several genes showed notably strong responses to the treatment. These genes exhibited remarkably high log2FoldChange values and levels of statistical significance compared to others. This highlights that the biological effects of RG6016 are not only widespread but also specific and potent, emphasizing the depth of PDX tumor-specific molecular responses and their potential clinical relevance.

3.4. Pathway Enrichment Analysis of DEGs

To understand the effects of RG6016 treatment on biological processes and signaling pathways across different PDX samples, pathway enrichment analysis was performed using the DEGs. Table 4 and Figure S1 illustrate the biological pathways associated with both upregulated and downregulated genes, along with their statistical significance levels.

3.4.1. Upregulated Pathways

Following RG6016 treatment, the most prominently activated biological pathways were identified as nicotine addiction (Fold Enrichment = 4.09, −log10(FDR) = 4.23, n = 16), and protein digestion and absorption (Fold Enrichment = 3.26, −log10(FDR) = 7.86, n = 35) (Table 4; Figure S1A,B). In addition, the extracellular matrix (ECM)–receptor interaction pathway (Fold Enrichment = 3.14, −log10(FDR) = 6.29, n = 30) was also identified among the upregulated biological processes following RG6016 treatment. Figure S1A presents the network analysis of the upregulated pathways, while Figure S1B ranks them according to their statistical significance. These findings reveal that RG6016 treatment activates specific biological pathways in a PDX sample-dependent manner. Notably, the upregulation of pathways such as ECM–receptor interaction, which are associated with cytoskeletal dynamics and extracellular matrix remodeling, points to the potential impact of RG6016 on cell architecture and interaction with the microenvironment. Furthermore, changes in pathways related to nicotine addiction, metabolism, and cellular signaling suggest that RG6016 may influence a broad spectrum of biological processes within treated PDX samples.

3.4.2. Downregulated Pathways

The biological pathways suppressed following RG6016 treatment are presented in Table 4 and Figure S1C,D. The most prominently downregulated processes include histidine metabolism (Fold Enrichment = 3.52, −log10(FDR) = 2.87, n = 12) and steroid hormone biosynthesis (Fold Enrichment = 2.36, −log10(FDR) = 2.31, n = 19). In addition, xenobiotic metabolism by cytochrome P450 (Fold Enrichment = 2.29, −log10(FDR) = 2.87, n = 25) pathways were also found to be downregulated following RG6016 treatment. Figure S1C visualizes the interactions between these pathways in a network diagram, while Figure S1D presents a bar chart ranking the most significantly downregulated pathways based on their −log10(FDR) values. These results indicate that RG6016 treatment suppresses key metabolic processes and cellular components. In particular, notable decreases were observed in biological pathways such as histidine metabolism, steroid hormone biosynthesis, and ECM–receptor interaction, suggesting that RG6016 may exert its therapeutic effects, in part, by downregulating pathways critical to tumor cell metabolism, signaling, and extracellular communication.
It is noteworthy that certain biological pathways identified as enriched in this study, including taste transduction and nicotine addiction, might not represent a direct relevance to the biology of SCLC or to the genes TSPAN8, UCHL1, and MYC, which were identified as potential targets of RG6016 through our bioinformatic and molecular docking analyses. This may be attributed to the broad nature of the differentially expressed gene lists and the statistical characteristics of pathway enrichment analysis, which can occasionally highlight pathways of limited biological relevance due to gene overlaps or database annotations. Therefore, although the presence of such pathways is recognized, the interpretation of the findings is primarily centered on enrichment results that demonstrate biological relevance and are substantiated by the existing literature within the context of cancer biology and therapeutic targeting.

3.5. Network Analysis

Protein–protein interaction (PPI) network analysis was performed to investigate the relationships among DEGs across all PDX samples following RG6016 treatment, enabling the identification of interactions among significantly altered proteins and their potential impact on biological processes (Figure 9). The analysis revealed interactions among proteins encoded by genes such as MYC, UCHL1, and TSPAN8, forming a tightly connected network characterized by functionally interdependent and strongly interacting components (Figure 9A). In Figure 9B, a circular connection diagram visualizes the links between DEGs responsive to RG6016 treatment and their associated biological processes. This diagram shows that genes affected by the treatment are associated with a wide array of biological functions. The colored chords in the diagram indicate which functional categories each gene is linked to, with some genes being connected to multiple biological pathways. The fact that certain genes are involved in several functional categories implies that they may play a central role in modulating the cellular response to treatment. These findings support the widespread influence of RG6016 on intracellular signaling pathways and highlight the complexity of the molecular response induced by treatment.

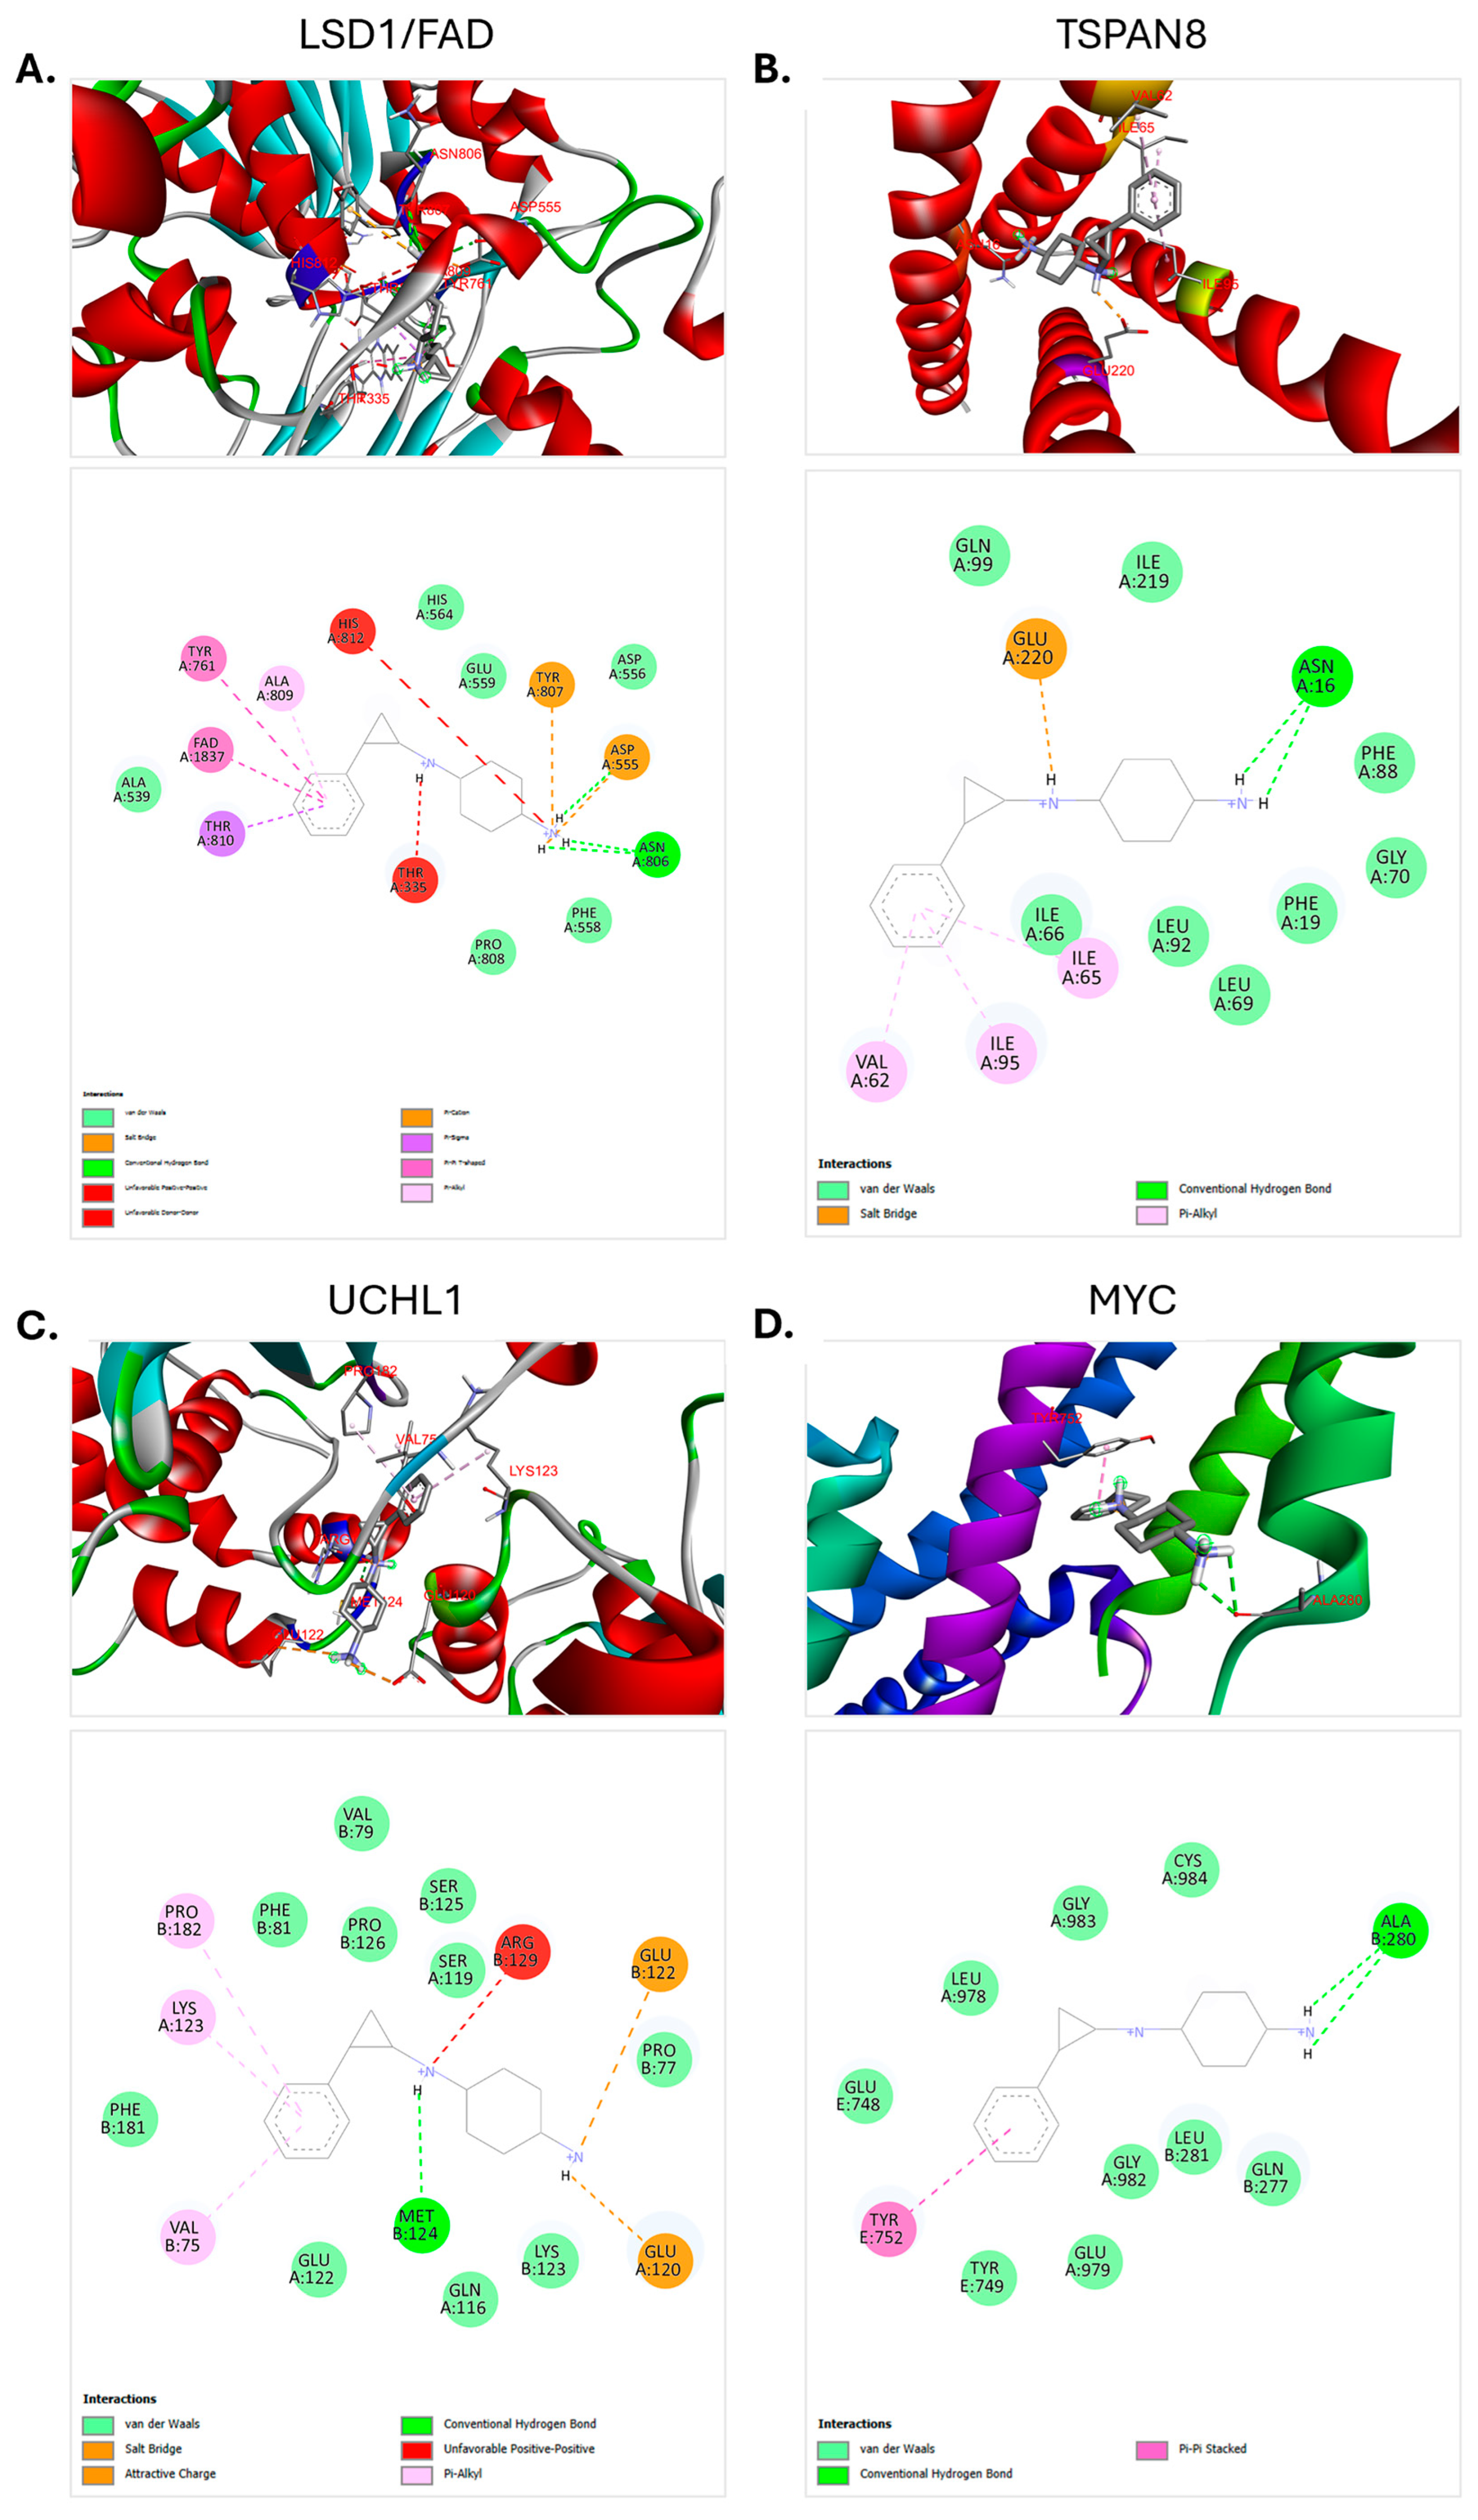
3.6. Molecular Docking Analysis

In this study, molecular docking analyses were conducted to evaluate the potential interactions between the LSD1 inhibitor RG6016 and its target proteins in SCLC samples. In addition to the positive control LSD1, 13 proteins encoded by genes that were significantly downregulated as a result of LSD1 inhibition were selected as targets, based on differential expression analysis of RNA-seq data. The goal was to identify proteins that could be directly or indirectly affected by RG6016. Docking analyses were performed for a total of 14 proteins, including the known target LSD1/FAD complex. For each interaction, docking score (kcal/mol), conventional hydrogen bonds, interacting amino acid residues, and bond lengths were assessed. The general docking data are presented in Table S2, whereas proteins with binding energies equal to or lower than −7.0 kcal/mol, which indicate strong and potentially biologically relevant interactions, are detailed in Table 5. Proteins with weaker binding affinities (above −7.0 kcal/mol) are visualized in Figures S2–S4 and were excluded from prioritized interpretation.
Among all proteins analyzed, LSD1, used as a positive control, exhibited a strong docking score with the ligand at −7.2 kcal/mol. This interaction involved three conventional hydrogen bonds with the amino acid residues ASP555 (2.21 Å) and ASN806 (2.57 and 2.60 Å). These findings confirm LSD1 as a direct and high-affinity target, in agreement with previously reported structural interactions. In addition to LSD1, three other proteins including TSPAN8 (−7.4 kcal/mol), UCHL1 (−7.2 kcal/mol), and MYC (−7.0 kcal/mol) also exhibited docking scores with RG6016. TSPAN8 formed two conventional hydrogen bonds with ASN16, at distances of 2.44 Å and 2.48 Å. UCHL1 established a single hydrogen bond with MET124 (2.54 Å). MYC formed two hydrogen bonds with ALA280, at distances of 2.63 Å and 2.79 Å. These interactions suggest that RG6016 can stably bind within the active pockets of these proteins, potentially modulating their function. Figure 10 presents the 3D binding poses and 2D interaction diagrams of RG6016 with LSD1, TSPAN8, UCHL1, and MYC. These visuals demonstrate not only hydrogen bonding but also complementary interactions such as hydrophobic contacts (e.g., Pi–alkyl, van der Waals), π–π stacking, and in some cases, salt bridges. The presence of these interactions further supports a favorable docking pose of RG6016 to its targets. In conclusion, in addition to LSD1, significant interactions were identified between RG6016 and the downregulated gene products TSPAN8, UCHL1, and MYC. These findings suggest that the molecular effects of RG6016 may extend beyond LSD1 inhibition, potentially involving the modulation of additional cellular pathways through interactions with these target proteins.
On the other hand, other downregulated gene products such as OLFM1, MAGED4, SPOCK1, CALCA, TFF3, BEX1, BEX3, CD99, and IRX2 were not included in the core analysis of this study, as their docking scores ranged between −6.8 and −4.4 kcal/mol (Table S2). However, the docking analyses of these proteins revealed various binding motifs, including conventional hydrogen bonds, π–π stacking, cation–π interactions, and hydrophobic contacts, indicating that RG6016 may also potentially interact with these proteins (Figures S2–S4). These findings suggest that RG6016 may exhibit a multi-target binding profile in silico and that interactions observed with targets beyond LSD1 are also scientifically noteworthy. The potential interactions of RG6016 extending beyond LSD1 inhibition imply a broadened therapeutic profile for this compound. In conclusion, these in silico results, when supported by future experimental validations, may contribute to a more comprehensive understanding of the target engagement capacity of RG6016.

4. Discussion

SCLC accounts for approximately 15% of all lung cancers and is the leading cause of cancer-related deaths in men and the second most common cause in women worldwide [29,30]. Characterized by biological features such as rapid proliferation, high vascularity, and apoptotic imbalance, SCLC is also notable for its tendency to metastasize at an early stage [31,32]. In treatment-resistant tumors such as SCLC, LSD1 inhibition has been shown to trigger distinct cellular responses [11]. LSD1 specifically removes mono- and dimethyl groups from lysine 4 or lysine 9 on histone H3 (H3K4me1/2 and H3K9me1/2), thereby acting as either a transcriptional repressor or activator depending on the context [33]. Another critical function of LSD1 is its role in hypoxia response [34]. Under hypoxic conditions, stabilization and activation of HIF-1α lead to the transcriptional induction of various target genes [34,35]. Pharmacological inhibition of LSD1 has been shown to delay tumor growth and exert cytostatic effects in both in vitro and xenograft models [11]. LSD1 inhibitor therapy has made progress in the treatment of hematological cancers [36] and lung cancer [11]. Studies on the role of LSD1 in prostate cancer have demonstrated that LSD1 inhibitors suppress MYC signaling and reduce tumor growth [37]. RG6016 is a potent LSD1 inhibitor that exerts its effect by irreversibly binding to the FAD cofactor of LSD1. It is currently undergoing clinical trials for the treatment of AML and solid tumors [18].
In this study, our bioinformatics analyses demonstrated that RG6016 induces selective, PDX tumor model-specific, and statistically significant changes in gene expression. The downregulation of genes such as MYC, UCHL1, and TSPAN8, along with the high binding affinities observed between RG6016 and the proteins encoded by these genes, suggests that these targets may play key roles in the therapeutic response. As LSD1 primarily functions as a transcriptional repressor, our focus was directed toward downregulated genes to better reflect the direct consequences of its inhibition. Pathway enrichment analyses revealed that RG6016 affects pathways related to cytoskeletal organization, ECM interactions, and cellular metabolism. Notably, the activation of pathways such as ECM–receptor interaction, and the suppression of pathways like histidine metabolism and steroid hormone biosynthesis, point to the multifaceted biological effects of the drug. However, some statistically enriched pathways identified in the analysis may not be directly relevant to the biological context of the study, likely due to gene overlap and the inherent limitations of enrichment algorithms. PPI analyses further indicated that the gene products targeted by RG6016 are involved in numerous biological processes, supporting the notion that its effects are mediated through a broad molecular network. In molecular docking analyses, LSD1 was evaluated as a positive control and exhibited favorable docking pose with RG6016. Similarly, high binding affinities were observed with TSPAN8, UCHL1, and MYC proteins. The formation of hydrogen bonds and complementary interactions with these proteins suggests that RG6016 may potentially modulate their functions, highlighting its broader therapeutic impact beyond LSD1 inhibition.
TSPAN8 is a transmembrane protein that organizes tetraspanin-enriched microdomains on the cell membrane, thereby contributing to the spatial arrangement of membrane proteins [38]. Through this function, it plays a critical role in the regulation of various fundamental cellular processes, including cell–cell interactions and signal transduction. The influence of TSPAN8 on cell motility is particularly important in the context of cancer progression. Elevated TSPAN8 mRNA expression has been reported in several cancer types, including colorectal, pancreatic [39], gastric [40], and hepatocellular carcinomas [41], as well as in melanoma [42] and glioma [43]. UCHL1 is a multifunctional protein and a key member of the deubiquitination protein family. It regulates cellular proliferation, differentiation, and damage response by modulating both ubiquitin-dependent and -independent pathways [44,45]. Studies have shown that UCHL1 is upregulated in lung cancers and plays a critical regulatory role in tumorigenesis [46,47]. Other cancers with high UCHL1 expression include breast cancer [48,49,50], melanoma [51,52], and osteosarcoma [53,54]. MYC is a potent transcription factor that regulates essential processes such as cell growth, cell cycle progression, metabolism, and apoptosis, making it a central player in cancer biology [55,56,57,58,59]. The overexpression of MYC is a hallmark of many cancer types and has been shown to directly initiate malignant transformation in various malignancies [56]. In SCLC, the overexpression of MYC family genes contributes to disease progression by influencing cell cycle and apoptosis pathways [60].
Interestingly, LSD1 has also been shown to enhance the stability of the transcription factor HIF-1α by demethylating both HIF-1α and RACK1 [61,62,63,64]. Similarly, UCHL1 contributes to the stabilization of HIF-1α by deubiquitinating it, thereby supporting cellular adaptation to hypoxia [65]. MYC, in collaboration with hypoxia-related HIF-1α, has been shown to promote glycolysis and suppress mitochondrial respiration, effectively reprogramming cellular metabolism. Moreover, MYC stabilizes HIF-1α under normoxic conditions and enhances its accumulation under hypoxic conditions, establishing a strong synergy between these two factors in support of metabolic reprogramming [66]. Additionally, LSD1 inhibitors have been reported to suppress MYC signaling and reduce tumor growth [67]. In line with these findings, our results showed that the expression levels of MYC and UCHL1 were significantly downregulated following RG6016 treatment. This suggests that RG6016 may exert its effects on cellular proliferation and metabolism through these targets. Based on these data, it is proposed that RG6016 may modulate the HIF-1α pathway via LSD1, UCHL1, and MYC in aggressive cancers such as SCLC, thereby influencing key processes like hypoxia response, metastasis, and neuroendocrine differentiation. With these multifaceted effects, RG6016 appears to be a promising therapeutic candidate capable of targeting critical pathways in tumor biology.
This study evaluated the selective efficacy of the LSD1 inhibitor RG6016 in SCLC and the molecular mechanisms underlying this effect through bioinformatics analyses and molecular docking approaches. The bioinformatic analysis of RNA-seq data revealed altered gene expression profiles in response to RG6016 treatment, while docking results demonstrated favorable docking pose between RG6016 and the gene products of TSPAN8, UCHL1, and MYC. These findings suggest that the effects of RG6016 may extend beyond LSD1 inhibition, potentially influencing multiple cellular networks and pathways. Given the critical roles of TSPAN8, UCHL1, and MYC in key biological processes in aggressive cancers like SCLC, targeting these molecules may offer valuable therapeutic potential. In this study, in silico molecular docking analysis revealed strong predicted interactions between RG6016 and several proteins not previously associated with FAD-dependent activity, including UCHL1, MYC, and TSPAN8. Although the docking scores with TSPAN8, UCHL1, and MYC were relatively high, these findings do not imply definitive binding or reactivity. Rather, they suggest that these proteins may warrant further experimental investigation to explore their potential modulation by RG6016. While these findings suggest a possible multi-target profile for RG6016, it is important to acknowledge that computational docking inherently lacks the capacity to fully capture the dynamic conformational flexibility of proteins under physiological conditions. Additionally, factors such as membrane localization (particularly relevant for tetraspanins like TSPAN8) and post-translational modifications are typically not incorporated into standard docking models. Therefore, further experimental validation is required to determine whether these predicted interactions are biologically relevant. While this study did not include molecular dynamics (MD) simulations due to its exploratory in silico design, future work will aim to evaluate the stability of the identified RG6016–protein complexes through MD-based MM/PBSA analysis. This study is limited by its in silico approach. While molecular docking provides valuable predictions regarding ligand–protein interactions, it does not account for conformational flexibility, post-translational modifications, membrane localization, or the thermodynamic profile of binding under physiological conditions. Furthermore, the absence of MD simulations and MM/PBSA binding energy calculations restricts the precision of interaction assessments. Experimental validation of the identified targets will be essential to confirm their biological relevance. Further studies using cellular models or proteomics approaches will be essential to clarify the extent effects of RG6016, which may provide new insights into its mechanism of action or reveal previously unrecognized therapeutic opportunities. In future analyses, the inclusion of upregulated genes is also planned, as their investigation may reveal clinically relevant pathways of potential activation. Further investigation into the molecular mechanisms and therapeutic impact of RG6016 in SCLC is of great importance for future research and clinical translation.

5. Conclusions

In conclusion, this study comprehensively revealed the selective efficacy of the LSD1 inhibitor RG6016 in SCLC and its potential molecular targets through bioinformatic and molecular docking analyses. The downregulation of genes such as MYC, UCHL1, and TSPAN8, along with their potential in silico interaction with RG6016, suggests that the compound may possess a multifaceted mechanism of action. Furthermore, the potential involvement of these targets in key processes such as hypoxia, metabolism, and tumor progression through HIF-1α signaling further supports the therapeutic potential of RG6016 in tumor biology. However, to confirm the reliability and biological relevance of these findings, further in vitro and in vivo experimental validation is essential.

Supplementary Materials

The following supporting information can be downloaded at: https://www.mdpi.com/article/10.3390/bioengineering12050504/s1, Pathway enrichment analysis of DEGs in RG6016-treated PDX samples. (A) Network graph of downregulated pathways visualizing genetic connections among pathways (Figure S1). General view of docking position of RG6016 in binding sites of MAGED4, OLFM1, TFF3, and SPOCK1 is presented (Figure S2), followed by molecular docking analyses of RG6016 with CALCA, CD99, IRX2, and SEZ6L (Figure S3), and with BEX1 and BEX3 (Figure S4). A summary of AlphaFold-derived models, including UniProt IDs and average pLDDT scores, is provided, noting that some lower-confidence models were included due to lack of alternative human structures (Table S1). Comprehensive docking data, including binding energies and interaction details for all 14 analyzed proteins, are provided (Table S2).

Author Contributions

Conceptualization, M.K., N.O., I.N. and H.S.N.; investigation, M.K. and I.N.; methodology, M.K. and I.N.; data curation, M.K. and I.N.; writing—original draft, M.K., N.O., I.N. and H.S.N.; writing—review and editing, M.K., N.O., I.N. and H.S.N. All authors have read and agreed to the published version of the manuscript.

Funding

This research received no external funding.

Institutional Review Board Statement

Not applicable.

Informed Consent Statement

Not applicable.

Data Availability Statement

The data are available from the authors on reasonable request.

Acknowledgments

We would like to thank the authors of the study titled “Targeting NOTCH activation in small cell lung cancer through LSD1 inhibition”, whose data were made publicly available through the GEO database, enabling us to access and use the main datasets in our analysis. We also sincerely thank the reviewers for their constructive evaluations and valuable feedback that contributed to the improvement of our manuscript. The graphical abstract presented in this study was created in BioRender. Nalkiran, I. (2025) https://BioRender.com/oa0ly59 (accessed on 5 May 2025).

Conflicts of Interest

The authors declare no conflicts of interest.

References

  1. Rudin, C.M.; Brambilla, E.; Faivre-Finn, C.; Sage, J. Small-cell lung cancer. Nat. Rev. Dis. Primers 2021, 7, 3. [Google Scholar] [CrossRef] [PubMed]
  2. Huang, R.; Wei, Y.; Hung, R.J.; Liu, G.; Su, L.; Zhang, R.; Zong, X.; Zhang, Z.-F.; Morgenstern, H.; Brüske, I.; et al. Associated links among smoking, chronic obstructive pulmonary disease, and small cell lung cancer: A pooled analysis in the International Lung Cancer Consortium. EBioMedicine 2015, 2, 1677–1685. [Google Scholar] [CrossRef] [PubMed]
  3. Kim, K.-B.; Dunn, C.T.; Park, K.-S. Recent progress in mapping the emerging landscape of the small-cell lung cancer genome. Exp. Mol. Med. 2019, 51, 1–13. [Google Scholar] [CrossRef] [PubMed]
  4. Baine, M.K.; Hsieh, M.-S.; Lai, W.V.; Egger, J.V.; Jungbluth, A.A.; Daneshbod, Y.; Beras, A.; Spencer, R.; Lopardo, J.; Bodd, F.; et al. SCLC subtypes defined by ASCL1, NEUROD1, POU2F3, and YAP1: A comprehensive immunohistochemical and histopathologic characterization. J. Thorac. Oncol. 2020, 15, 1823–1835. [Google Scholar] [CrossRef]
  5. Stewart, C.A.; Gay, C.M.; Xi, Y.; Sivajothi, S.; Sivakamasundari, V.; Fujimoto, J.; Bolisetty, M.; Hartsfield, P.M.; Balasubramaniyan, V.; Chalishazar, M.D.; et al. Single-cell analyses reveal increased intratumoral heterogeneity after the onset of therapy resistance in small-cell lung cancer. Nat. Cancer 2020, 1, 423–436. [Google Scholar] [CrossRef]
  6. Yang, D.; Denny, S.K.; Greenside, P.G.; Chaikovsky, A.C.; Brady, J.J.; Ouadah, Y.; Granja, J.M.; Jahchan, N.S.; Lim, J.S.; Kwok, S.; et al. Intertumoral heterogeneity in SCLC is influenced by the cell type of origin. Cancer Discov. 2018, 8, 1316–1331. [Google Scholar] [CrossRef]
  7. Ko, J.; Winslow, M.M.; Sage, J. Mechanisms of small cell lung cancer metastasis. EMBO Mol. Med. 2021, 13, e13122. [Google Scholar] [CrossRef]
  8. Hodgkinson, C.L.; Morrow, C.J.; Li, Y.; Metcalf, R.L.; Rothwell, D.G.; Trapani, F.; Polanski, R.; Burt, D.J.; Simpson, K.L.; Morris, K.; et al. Tumorigenicity and genetic profiling of circulating tumor cells in small-cell lung cancer. Nat. Med. 2014, 20, 897–903. [Google Scholar] [CrossRef]
  9. Shi, Y.; Lan, F.; Matson, C.; Mulligan, P.; Whetstine, J.R.; Cole, P.A.; Casero, R.A.; Shi, Y. Histone demethylation mediated by the nuclear amine oxidase homolog LSD1. Cell 2004, 119, 941–953. [Google Scholar] [CrossRef]
  10. McGrath, J.P.; Williamson, K.E.; Balasubramanian, S.; Odate, S.; Arora, S.; Hatton, C.; Edwards, T.M.; O’Brien, T.; Magnuson, S.; Stokoe, D.; et al. Pharmacological inhibition of the histone lysine demethylase KDM1A suppresses the growth of multiple acute myeloid leukemia subtypes. Cancer Res. 2016, 76, 1975–1988. [Google Scholar] [CrossRef]
  11. Mohammad, H.P.; Smitheman, K.N.; Kamat, C.D.; Soong, D.; Federowicz, K.E.; Van Aller, G.S.; Schneck, J.L.; Carson, J.D.; Liu, Y.; Butticello, M.; et al. A DNA hypomethylation signature predicts antitumor activity of LSD1 inhibitors in SCLC. Cancer Cell 2015, 28, 57–69. [Google Scholar] [CrossRef] [PubMed]
  12. Sugino, N.; Kawahara, M.; Tatsumi, G.; Kanai, A.; Matsui, H.; Yamamoto, R.; Nagai, Y.; Fujii, S.; Shimazu, Y.; Hishizawa, M.; et al. A novel LSD1 inhibitor NCD38 ameliorates MDS-related leukemia with complex karyotype by attenuating leukemia programs via activating super-enhancers. Leukemia 2017, 31, 2303–2314. [Google Scholar] [CrossRef] [PubMed]
  13. Lee, C.; Rudneva, V.A.; Erkek, S.; Zapatka, M.; Chau, L.Q.; Tacheva-Grigorova, S.K.; Garancher, A.; Rusert, J.M.; Aksoy, O.; Lea, R.; et al. Lsd1 as a therapeutic target in Gfi1-activated medulloblastoma. Nat. Commun. 2019, 10, 332. [Google Scholar] [CrossRef] [PubMed]
  14. Takagi, S.; Ishikawa, Y.; Mizutani, A.; Iwasaki, S.; Matsumoto, S.; Kamada, Y.; Nomura, T.; Nakamura, K. LSD1 inhibitor T-3775440 inhibits SCLC cell proliferation by disrupting LSD1 interactions with SNAG domain proteins INSM1 and GFI1B. Cancer Res. 2017, 77, 4652–4662. [Google Scholar] [CrossRef]
  15. Li, M.; Dai, M.; Cheng, B.; Li, S.; Guo, E.; Fu, J.; Ma, T.; Yu, B. Strategies that regulate LSD1 for novel therapeutics. Acta Pharm. Sin. B 2024, 14, 1494–1507. [Google Scholar] [CrossRef]
  16. Fang, Y.; Liao, G.; Yu, B. LSD1/KDM1A inhibitors in clinical trials: Advances and prospects. J. Hematol. Oncol. 2019, 12, 129. [Google Scholar] [CrossRef]
  17. Maes, T.; Mascaró, C.; Tirapu, I.; Estiarte, A.; Ciceri, F.; Lunardi, S.; Guibourt, N.; Perdones, A.; Lufino, M.M.; Somervaille, T.C.; et al. ORY-1001, a potent and selective covalent KDM1A inhibitor, for the treatment of acute leukemia. Cancer Cell 2018, 33, 495–511.e412. [Google Scholar] [CrossRef]
  18. Salamero, O.; Montesinos, P.; Willekens, C.; Pérez-Simón, J.A.; Pigneux, A.; Récher, C.; Popat, R.; Carpio, C.; Molinero, C.; Mascaró, C.; et al. First-in-human phase I study of iadademstat (ORY-1001): A first-in-class lysine-specific histone demethylase 1A inhibitor, in relapsed or refractory acute myeloid leukemia. J. Clin. Oncol. 2020, 38, 4260–4273. [Google Scholar] [CrossRef]
  19. Augert, A.; Eastwood, E.; Ibrahim, A.H.; Wu, N.; Grunblatt, E.; Basom, R.; Liggitt, D.; Eaton, K.D.; Martins, R.; Poirier, J.T.; et al. Targeting NOTCH activation in small cell lung cancer through LSD1 inhibition. Sci. Signal 2019, 12. [Google Scholar] [CrossRef]
  20. Kivrak, M.; Nalkiran, I.; Sevim Nalkiran, H. Exploring the Therapeutic Potential of the DOT1L Inhibitor EPZ004777 Using Bioinformatics and Molecular Docking Approaches in Acute Myeloid Leukemia. Curr. Issues Mol. Biol. 2025, 47, 173. [Google Scholar] [CrossRef]
  21. Jolliffe, I. Principal Component Analysis. In Encyclopedia of Statistics in Behavioral Science; Everitt, B.S., Howell, D.C., Eds.; Wiley: Hoboken, NJ, USA, 2005. [Google Scholar]
  22. Pettersen, E.F.; Goddard, T.D.; Huang, C.C.; Couch, G.S.; Greenblatt, D.M.; Meng, E.C.; Ferrin, T.E. UCSF Chimera—A visualization system for exploratory research and analysis. J. Comput. Chem. 2004, 25, 1605–1612. [Google Scholar] [CrossRef] [PubMed]
  23. Morris, G.M.; Huey, R.; Lindstrom, W.; Sanner, M.F.; Belew, R.K.; Goodsell, D.S.; Olson, A.J. AutoDock4 and AutoDockTools4: Automated docking with selective receptor flexibility. J. Comput. Chem. 2009, 30, 2785–2791. [Google Scholar] [CrossRef] [PubMed]
  24. Berman, H.M.; Westbrook, J.; Feng, Z.; Gilliland, G.; Bhat, T.N.; Weissig, H.; Shindyalov, I.N.; Bourne, P.E.; Burkhardt, K.; Feng, Z.; et al. The Protein Data Bank. Nucleic Acids Res. 2000, 28, 235–242. [Google Scholar] [CrossRef]
  25. Jumper, J.; Evans, R.; Pritzel, A.; Green, T.; Figurnov, M.; Ronneberger, O.; Tunyasuvunakool, K.; Bates, R.; Žídek, A.; Potapenko, A.; et al. Highly accurate protein structure prediction with AlphaFold. Nature 2021, 596, 583–589. [Google Scholar] [CrossRef]
  26. Tunyasuvunakool, K.; Adler, J.; Wu, Z.; Green, T.; Zielinski, M.; Žídek, A.; Bridgland, A.; Cowie, A.; Meyer, C.; Laydon, A.; et al. Highly accurate protein structure prediction for the human proteome. Nature 2021, 596, 590–596. [Google Scholar] [CrossRef]
  27. Nalkiran, I.; Sevim Nalkiran, H. Repurposing ProTAME for Bladder Cancer: A Combined Therapeutic Approach Targeting Cell Migration and MMP Regulation. Biology 2025, 14, 263. [Google Scholar] [CrossRef]
  28. Trott, O.; Olson, A.J. AutoDock Vina: Improving the speed and accuracy of docking with a new scoring function, efficient optimization, and multithreading. J. Comput. Chem. 2010, 31, 455–461. [Google Scholar] [CrossRef]
  29. Torre, L.A.; Siegel, R.L.; Jemal, A. Lung cancer statistics. Adv. Exp. Med. Biol. 2016, 893, 1–19. [Google Scholar]
  30. Kalemkerian, G.P.; Akerley, W.; Bogner, P.; Borghaei, H.; Chow, L.Q.; Downey, R.J.; Gandhi, L.; Ganti, A.K.P.; Govindan, R.; Grecula, J.C.; et al. Small cell lung cancer. J. Natl. Compr. Canc Netw. 2013, 11, 78–98. [Google Scholar] [CrossRef]
  31. Gazdar, A.F.; Bunn, P.A.; Minna, J.D. Small-cell lung cancer: What we know, what we need to know and the path forward. Nat. Rev. Cancer 2017, 17, 725–737. [Google Scholar] [CrossRef]
  32. George, J.L.J.; Jang, S.J.; Cun, Y.; Ozretić, L.; Kong, G.; Leenders, F.; Lu, X.; Fernández-Cuesta, L.; Bosco, G.; Müller, C.; et al. Comprehensive genomic profiles of small cell lung cancer. Nature 2015, 524, 47–53. [Google Scholar] [CrossRef] [PubMed]
  33. Rotili, D.; Mai, A. Targeting histone demethylases: A new avenue for the fight against cancer. Genes. Cancer 2011, 2, 663–679. [Google Scholar] [CrossRef] [PubMed]
  34. Semenza, G.L. Pharmacologic targeting of hypoxia-inducible factors. Annu. Rev. Pharmacol. Toxicol. 2019, 59, 379–403. [Google Scholar] [CrossRef] [PubMed]
  35. Kaelin, W.G. Proline hydroxylation and gene expression. Annu. Rev. Biochem. 2005, 74, 115–128. [Google Scholar] [CrossRef]
  36. Wass, M.; Göllner, S.; Besenbeck, B.; Schlenk, R.F.; Mundmann, P.; Göthert, J.R.; Noppeney, R.; Schliemann, C.; Mikesch, J.-H.; Lenz, G.; et al. A proof of concept phase I/II pilot trial of LSD1 inhibition by tranylcypromine combined with ATRA in refractory/relapsed AML patients not eligible for intensive therapy. Leukemia 2021, 35, 701–711. [Google Scholar] [CrossRef]
  37. Whyte, W.A.; Orlando, D.A.; Hnisz, D.; Abraham, B.J.; Lin, C.Y.; Kagey, M.H.; Rahl, P.B.; Lee, T.I.; Young, R.A. Master transcription factors and mediator establish super-enhancers at key cell identity genes. Cell 2013, 153, 307–319. [Google Scholar] [CrossRef]
  38. Charrin, S.; Jouannet, S.; Boucheix, C.; Rubinstein, E. Tetraspanins at a glance. J. Cell Sci. 2014, 127, 3641–3648. [Google Scholar] [CrossRef]
  39. Claas, C.; Seiter, S.; Claas, A.; Savelyeva, L.; Schwab, M.; Zöller, M. Association between the rat homologue of CO-029, a metastasis-associated tetraspanin molecule and consumption coagulopathy. J. Cell Biol. 1998, 141, 267–280. [Google Scholar] [CrossRef]
  40. Zhu, H.; Wu, Y.; Zheng, W.; Lu, S. CO-029 is overexpressed in gastric cancer and mediates the effects of EGF on gastric cancer cell proliferation and invasion. Int. J. Mol. Med. 2015, 35, 798–802. [Google Scholar] [CrossRef]
  41. Kanetaka, K.; Sakamoto, M.; Yamamoto, Y.; Yamasaki, S.; Lanza, F.; Kanematsu, T.; Hirohashi, S. Overexpression of tetraspanin CO-029 in hepatocellular carcinoma. J. Hepatol. 2001, 35, 637–642. [Google Scholar] [CrossRef]
  42. Berthier-Vergnes, O.; El Kharbili, M.; de la Fouchardière, A.; Pointecouteau, T.; Verrando, P.; Wierinckx, A.; Lachuer, J.; Le Naour, F.; Lamartine, J. Gene expression profiles of human melanoma cells with different invasive potential reveal TSPAN8 as a novel mediator of invasion. Br. J. Cancer 2011, 104, 155–165. [Google Scholar] [CrossRef] [PubMed]
  43. Pan, S.-J.; Wu, Y.-B.; Cai, S.; Pan, Y.-X.; Liu, W.; Bian, L.-G.; Sun, B.; Sun, Q.-F. Over-expression of tetraspanin 8 in malignant glioma regulates tumor cell progression. Biochem. Biophys. Res. Commun. 2015, 458, 476–482. [Google Scholar] [CrossRef] [PubMed]
  44. Ngoc Anh Suong, D.; Thi Phuong Thao, D.; Masamitsu, Y.; Linh Thuoc, T. Ubiquitin carboxyl hydrolase L1 significance for human diseases. Protein Pept. Lett. 2014, 21, 624–630. [Google Scholar] [CrossRef]
  45. Bishop, P.; Rocca, D.; Henley, J.M. Ubiquitin C-terminal hydrolase L1 (UCH-L1): Structure, distribution and roles in brain function and dysfunction. Biochem. J. 2016, 473, 2453–2462. [Google Scholar] [CrossRef]
  46. Hibi, K.; Westra, W.H.; Borges, M.; Goodman, S.; Sidransky, D.; Jen, J. PGP9. 5 as a candidate tumor marker for non-small-cell lung cancer. Am. J. Pathol. 1999, 155, 711–715. [Google Scholar] [CrossRef]
  47. Kim, H.; Kim, Y.; Lim, S.; Nam, Y.; Jeong, J.; Lee, K. Ubiquitin C-terminal hydrolase-L1 is a key regulator of tumor cell invasion and metastasis. Oncogene 2009, 28, 117–127. [Google Scholar] [CrossRef]
  48. Lien, H.-C.; Wang, C.-C.; Lin, C.-H.; Lu, Y.-S.; Huang, C.-S.; Hsiao, L.-P.; Yao, Y.-T. Differential expression of ubiquitin carboxy-terminal hydrolase L1 in breast carcinoma and its biological significance. Hum. Pathol. 2013, 44, 1838–1848. [Google Scholar] [CrossRef]
  49. Lien, H.-C.; Wang, C.-C.; Huang, C.-S.; Yang, Y.-W.; Kuo, W.-H.; Yao, Y.-T. Ubiquitin carboxy-terminal hydrolase L1 may be involved in the development of mammary phyllodes tumors. Virchows Arch. 2013, 462, 155–161. [Google Scholar] [CrossRef]
  50. Jin, Y.; Zhang, W.; Xu, J.; Wang, H.; Zhang, Z.; Chu, C.; Liu, X.; Zou, Q. UCH-L1 involved in regulating the degradation of EGFR and promoting malignant properties in drug-resistant breast cancer. Int. J. Clin. Exp. Pathol. 2015, 8, 12500. [Google Scholar]
  51. Wulfänger, J.; Biehl, K.; Tetzner, A.; Wild, P.; Ikenberg, K.; Meyer, S.; Seliger, B. Heterogeneous expression and functional relevance of the ubiquitin carboxyl-terminal hydrolase L1 in melanoma. Int. J. Cancer 2013, 133, 2522–2532. [Google Scholar] [CrossRef]
  52. Kim, H.J.; Magesh, V.; Lee, J.-J.; Kim, S.; Knaus, U.G.; Lee, K.-J. Ubiquitin C-terminal hydrolase-L1 increases cancer cell invasion by modulating hydrogen peroxide generated via NADPH oxidase 4. Oncotarget 2015, 6, 16287. [Google Scholar] [CrossRef] [PubMed]
  53. Liu, X.; Zeng, B.; Ma, J.; Wan, C. Comparative proteomic analysis of osteosarcoma cell and human primary cultured osteoblastic cell. Cancer Investig. 2009, 27, 345–352. [Google Scholar] [CrossRef] [PubMed]
  54. Zheng, S.; Qiao, G.; Min, D.; Zhang, Z.; Lin, F.; Yang, Q.; Feng, T.; Tang, L.; Sun, Y.; Zhao, H.; et al. Heterogeneous expression and biological function of ubiquitin carboxy-terminal hydrolase-L1 in osteosarcoma. Cancer Lett. 2015, 359, 36–46. [Google Scholar] [CrossRef] [PubMed]
  55. Dang, C.V. c-Myc target genes involved in cell growth, apoptosis, and metabolism. Mol. Cell. Biol. 1999, 19, 1–11. [Google Scholar] [CrossRef]
  56. Dang, C.V. MYC on the path to cancer. Cell 2012, 149, 22–35. [Google Scholar] [CrossRef]
  57. Dang, C.V.; O’Donnell, K.A.; Zeller, K.I.; Nguyen, T.; Osthus, R.C.; Li, F. The c-Myc target gene network. Semin. Cancer Biol. 2006, 16, 253–264. [Google Scholar] [CrossRef]
  58. Dang, C.V.; Resar, L.M.; Emison, E.; Kim, S.; Li, Q.; Prescott, J.E.; Wonsey, D.; Zeller, K. Function of the c-Myc oncogenic transcription factor. Exp. Cell Res. 1999, 253, 63–77. [Google Scholar] [CrossRef]
  59. Evan, G.I.; Wyllie, A.H.; Gilbert, C.S.; Littlewood, T.D.; Land, H.; Brooks, M.; Waters, C.M.; Penn, L.Z.; Hancock, D.C. Induction of apoptosis in fibroblasts by c-myc protein. Cell 1992, 69, 119–128. [Google Scholar] [CrossRef]
  60. Den Hollander, J.; Rimpi, S.; Doherty, J.R.; Rudelius, M.; Buck, A.; Hoellein, A.; Kremer, M.; Graf, N.; Scheerer, M.; Hall, M.A.; et al. Aurora kinases A and B are up-regulated by Myc and are essential for maintenance of the malignant state. Blood 2010, 116, 1498–1505. [Google Scholar] [CrossRef]
  61. Kim, Y.; Nam, H.J.; Lee, J.; Park, D.Y.; Kim, C.; Yu, Y.S.; Kim, D.; Park, S.W.; Bhin, J.; Hwang, D.; et al. Methylation-dependent regulation of HIF-1α stability restricts retinal and tumour angiogenesis. Nat. Commun. 2016, 7, 10347. [Google Scholar] [CrossRef]
  62. Liu, X.; Chen, Z.; Xu, C.; Leng, X.; Cao, H.; Ouyang, G.; Xiao, W. Repression of hypoxia-inducible factor α signaling by Set7-mediated methylation. Nucleic Acids Res. 2015, 43, 5081–5098. [Google Scholar] [CrossRef] [PubMed]
  63. Lee, J.; Park, J.H.; Choi, H.J.; Won, H.; Joo, H.; Shin, D.-H.; Park, M.-K.; Han, B.; Kim, K.P.; Lee, T.J.; et al. LSD1 demethylates HIF1α to inhibit hydroxylation and ubiquitin-mediated degradation in tumor angiogenesis. Oncogene 2017, 36, 5512–5521. [Google Scholar] [CrossRef] [PubMed]
  64. Yang, S.J.; Park, Y.S.; Cho, J.H.; Moon, B.; An, H.J.; Lee, J.Y.; Xie, Z.; Wang, Y.; Pocalyko, D.; Lee, D.C.; et al. Regulation of hypoxia responses by flavin adenine dinucleotide-dependent modulation of HIF-1α protein stability. EMBO J. 2017, 36, 1011–1028. [Google Scholar] [CrossRef]
  65. Goto, Y.; Zeng, L.; Yeom, C.J.; Zhu, Y.; Morinibu, A.; Shinomiya, K.; Kobayashi, M.; Hirota, K.; Itasaka, S.; Yoshimura, M.; et al. UCHL1 provides diagnostic and antimetastatic strategies due to its deubiquitinating effect on HIF-1α. Nat. Commun. 2015, 6, 6153. [Google Scholar] [CrossRef]
  66. Doe, M.R.; Ascano, J.M.; Kaur, M.; Cole, M.D. Myc posttranscriptionally induces HIF1 protein and target gene expression in normal and cancer cells. Cancer Res. 2012, 72, 949–957. [Google Scholar] [CrossRef]
  67. Liu, S.; Chai, T.; Garcia-Marques, F.; Yin, Q.; Hsu, E.C.; Shen, M.; Shaw Toland, A.M.; Bermudez, A.; Hartono, A.B.; Massey, C.F.; et al. UCHL1 is a potential molecular indicator and therapeutic target for neuroendocrine carcinomas. Cell Rep. Med. 2024, 5, 101381. [Google Scholar] [CrossRef]
Figure 1. Workflow of normalized expression and RNA-seq read count analysis.
Bioengineering 12 00504 g001
Figure 2. An overview of RNA sequencing data in the control and RG6016-treated PDX samples. (A) The total raw read counts (in millions) across all PDX samples are visualized. Sequencing depth was consistently maintained across treatment conditions. (B) The boxplot of log2-transformed gene expression data shows similar distributions across samples, confirming successful normalization. (C) The density plot of the transformed data indicates consistent gene expression distributions across all samples. (D) The dispersion plot visualizes the relationship between the mean expression levels and standard deviations of genes, highlighting the variance in gene expression. The blue line represents the trend between mean and standard deviation, while the grey shadow indicates the confidence interval around the trend. These analyses support the reliability of the data and the success of the normalization process.
Bioengineering 12 00504 g002
Figure 3. Investigation of the effects of RG6016 on PDX samples using PCA. (A) PCA was performed on the gene expression matrix obtained from RNA-seq data. The PCA score plot shows how the control and RG6016 treatment groups in different PDX samples are distributed along the principal components (PC1 and PC2). Treatment groups are represented by colors (red: control; blue: the RG6016), while PDX samples are indicated by different shapes. (B) The scree plot illustrates the contribution of each principal component to the explained variance. PC1 and PC2 account for 25.1% and 19.5% of the total variance, respectively, making them the components that carry the most information. The elbow point helps identify the most meaningful components, and the optimal number of components was further supported by Horn’s parallel analysis method. The red line represents the cumulative proportion of explained variance across the principal components.
Bioengineering 12 00504 g003
Figure 4. Structure of RG6016 molecule: (A) 2D chemical structure, (B) 3D molecular model.
Bioengineering 12 00504 g004
Figure 5. Scatter plots of log2-transformed gene expression data. Gene expression levels in control and RG6016-treated groups were compared for the following PDX samples: (A) FHSC04, (B) FHSC14, (C) LX108, (D) LX110, (E) LX227C, (F) LX33, and (G) LX48. Each point represents a gene, with the X-axis indicating the control group and the Y-axis indicating the treatment group.
Bioengineering 12 00504 g005
Figure 6. The number of DEGs and log2 fold change plots. The number of DEGs and the distribution of log2 fold changes identified in the differential expression analysis are visualized. In the experimental design, the gene expression profile of each PDX sample was compared against a general category comprising all PDX samples. (A) shows the number of genes differentially expressed between the control and RG6016 treatment groups. (B) The volcano plot illustrates the relationship between log2 fold change and adjusted p-value. The blue dots represent downregulated genes, the orange dots represent upregulated genes, and the gray dots indicate genes with no statistically significant change.
Bioengineering 12 00504 g006
Figure 7. Heatmap and expression profiles of key genes. (A) The heatmap displays gene expression levels in PDX samples treated with control or RG6016. The colored bars at the top represent different PDX samples and treatment groups. Green indicates downregulation, while red indicates upregulation. Genes are ordered using hierarchical clustering based on their expression levels across conditions. (BF) The bar graphs show the normalized expression levels of selected genes. Black dots represent biological replicates, and error bars indicate standard deviation.
Bioengineering 12 00504 g007
Figure 8. PDX sample-specific differential gene expression (Log2FoldChange). Bar graphs display the log2 fold change values of DEGs in various PDX samples following RG6016 treatment. Positive log2 fold change values (orange bars) represent genes with significantly increased expression, while negative log2 fold change values (blue bars) indicate genes with significantly decreased expression. Expression changes in response to RG6016 treatment were determined for the following PDX samples: (A) FHSC04, (B) FHSC14, (C) LX108, (D) LX227C, (E) LX33, (F) LX48, and (G) LX110.
Bioengineering 12 00504 g008
Figure 9. The PPI networks and Circos plot of DEGs in RG6016-treated PDX models. (A) The PPI network displays the top 20 statistically significant DEGs following RG6016 treatment and their biological interactions. Genes located at the center of the network exhibit strong interactions with other genes. (B) The Circos plot visualizes the complex interactions among the top 40 statistically significant DEGs. LSD1 was not included in the PPI network, as it did not appear in the DEG list. It was used solely as a reference target in the docking analysis.
Bioengineering 12 00504 g009
Figure 10. Binding poses and interaction diagrams of RG6016 with the LSD1/FAD complex (A), TSPAN8 (B), UCHL1 (C), and MYC (D) proteins. The upper panel displays the three-dimensional binding sites of RG6016 within each protein, while the lower panel presents two-dimensional interaction maps, including hydrogen bonds and hydrophobic interactions. In the LSD1 structure, the FAD cofactor is highlighted in purple to enhance visual distinction and biological interpretability. The FAD cofactor is clearly displayed in the upper panel of Figure 10A.
Bioengineering 12 00504 g010
Table 1. Experimental design.
Sample NamePDX SampleTreatment
FHSC04_ControlFHSC04CONTROL
FHSC04_RG6016FHSC04RG6016
FHSC14_ControlFHSC14CONTROL
FHSC14_RG6016FHSC14RG6016
LX108_ControlLX108CONTROL
LX108_RG6016LX108RG6016
LX110_ControlLX110CONTROL
LX110_RG6016LX110RG6016
LX227C_ControlLX227CCONTROL
LX227C_RG6016LX227CRG6016
LX33_ControlLX33CONTROL
LX33_RG6016LX33RG6016
LX48_ControlLX48CONTROL
LX48_RG6016LX48RG6016
Table 2. Center coordinates and grid box dimensions of proteins used in docking analyses.
ProteinCenter at (X, Y, Z)Dimension (Å)
LSD1/FAD complexX: −5.864, Y: 60.314, Z: 93.81340 Å × 40 Å × 40 Å
TSPAN8X: −35.139, Y: −19.879, Z: 50.937100 Å × 100 Å × 100 Å
UCHL1X: 84.171, Y: 25.697, Z: 19.34140 Å × 40 Å × 40 Å
MYCX: 53.448, Y: 47.445, Z: 58.07940 Å × 40 Å × 40 Å
BEX1X: −35.261, Y: −20.238, Z: 50.826100 Å × 100 Å × 100 Å
BEX3X: 74.024, Y: 0.969, Z: −16.177100 Å × 100 Å × 100 Å
CALCAX: −5.523, Y: −2.272, Z: 0.537100 Å × 100 Å × 100 Å
CD99X: −1.135, Y: −2.164, Z: −6.97100 Å × 100 Å × 100 Å
IRX2X: −4.002, Y: 0.413, Z: −4.13840 Å × 40 Å × 40 Å
MAGED4X: −2.805, Y: 5.328, Z: −3.03140 Å × 40 Å × 40 Å
OLFM1X: 4.006, Y: 1.697, Z: −2.99840 Å × 40 Å × 40 Å
SEZL6X: −6.505, Y: 3.144, Z: 16.417100 Å × 100 Å × 100 Å
TFF3X: −1.078, Y: 2.169, Z: −4.76240 Å × 40 Å × 40 Å
SPOCK1X: 0.809, Y: 3.861, Z: −0.61540 Å × 40 Å × 40 Å
Table 3. Gene expression patterns following RG6016 treatment based on DEG2 results.
Up/DownregulatedEnsembl IDSymbolEntrez-Gene IDlog2FC
Values
Description
UpENSG00000277586NEFL47476.829Neurofilament light chain
UpENSG00000167165UGT1A6545786.827UDP glucuronosyltransferase family 1 member A6
UpENSG00000086548CEACAM646806.825CEA cell adhesion molecule 6
UpENSG00000134595SOX366586.824SRY-box transcription factor 3
UpENSG00000204382XAGE1B6530676.824X antigen family member 1B
UpENSG00000165588OTX250156.824Orthodenticle homeobox 2
UpENSG00000102924CBLN18696.823Cerebellin 1 precursor
UpENSG00000204379XAGE1A6532206.823X antigen family member 1A
UpENSG00000109132PHOX2B89296.823Paired like homeobox 2B
UpENSG00000053438NNAT48266.823Neuronatin
UpENSG00000198848CES110666.821Carboxylesterase 1
UpENSG00000118785SPP166966.820Secreted phosphoprotein 1
UpENSG00000185559DLK187886.775Delta like non-canonical Notch ligand 1
UpENSG00000162383SLC1A765126.625Solute carrier family 1 member 7
UpENSG00000118702GHRH26916.623Growth hormone releasing hormone
UpENSG00000117600PLPPR498906.615Phospholipid phosphatase related 4
UpENSG00000184144CNTN269006.510Contactin 2
UpENSG00000158639PAGE5907376.499PAGE family member 5
UpENSG00000172005MAL41186.480Mal, T cell differentiation protein
UpENSG00000123584MAGEA941086.431MAGE family member A9
UpENSG00000165092ALDH1A12166.350Aldehyde dehydrogenase 1 family member A1
UpENSG00000181965NEUROG147626.256Neurogenin 1
UpENSG00000129824RPS4Y161925.841Ribosomal protein S4 Y-linked 1
UpENSG00000169862CTNND215015.539Catenin delta 2
UpENSG00000105894PTN57645.379Pleiotrophin
UpENSG00000103647CORO2B103915.256Coronin 2B
UpENSG00000181195PENK51795.114proenkephalin
UpENSG00000188153COL4A512874.937Collagen type IV alpha 5 chain
UpENSG00000077935SMC1B271274.807Structural maintenance of chromosomes 1B
UpENSG00000203972GLYATL33893964.421Glycine-N-acyltransferase like 3
DownENSG00000130558OLFM110439−4.488Olfactomedin 1
DownENSG00000110680CALCA796−4.987Calcitonin related polypeptide alpha
DownENSG00000002586CD994267−5.279CD99 molecule (Xg blood group)
DownENSG00000100095SEZ6L23544−5.502Seizure related 6 homolog like
DownENSG00000170561IRX2153572−6.053Iroquois homeobox 2
DownENSG00000127324TSPAN87103−6.243Tetraspanin 8
DownENSG00000152377SPOCK16695−6.247SPARC (osteonectin), cwcv and kazal like domains proteoglycan 1
DownENSG00000136997MYC4609−6.450MYC proto-oncogene, bHLH transcription factor
DownENSG00000154545MAGED4728239−6.582MAGE family member D4
DownENSG00000166681BEX327018−6.679Brain expressed X-linked 3
DownENSG00000160180TFF37033−7.013Trefoil factor 3
DownENSG00000133169BEX155859−7.091Brain expressed X-linked 1
DownENSG00000154277UCHL17345−7.094Ubiquitin C-terminal hydrolase L1
Table 4. Pathway enrichment analysis results for RG6016-treated PDX samples.
DirectionDEG2 Analysis: All PDX Sample PathwaysFoldEnrichednGenes−log10(FDR)
UpNicotine addiction4.09164.23
Protein digestion and absorption3.26357.86
ECM-receptor interaction3.14306.29
DownHistidine metabolism3.52122.87
Steroid hormone biosynthesis2.36192.31
Metabolism of xenobiotics by cytochrome P4502.29252.87
Table 5. Molecular docking results of RG6016 with positive control LSD1 and proteins showing docking scores.
ProteinDocking Score (Kcal/mol)Amino Acid
Interaction
Hydrogen BondDistance (Å)Number of Conventional
Hydrogen Bonds
LSD1/FAD complex−7.2ASP5552.213
ASN8062.57
ASN8062.60
TSPAN8−7.4ASN162.442
ASN162.48
UCHL1−7.2MET1242.541
MYC−7.0ALA2802.632
ALA2802.79
Disclaimer/Publisher’s Note: The statements, opinions and data contained in all publications are solely those of the individual author(s) and contributor(s) and not of MDPI and/or the editor(s). MDPI and/or the editor(s) disclaim responsibility for any injury to people or property resulting from any ideas, methods, instructions or products referred to in the content.

