
A Bayesian Survival Analysis on Long COVID and Non-Long COVID Patients: A Cohort Study Using National COVID Cohort Collaborative (N3C) Data

 , , and
Abstract
1. Introduction
2. Related Work
3. Methodology
3.1. Dataset
3.2. Cohort Identification and Feature Development
3.2.1. COVID-Positive Long COVID Group Inclusion Criteria
- COVID-19-positive patient as defined with a positive SARS-CoV-2 PCR/AG test or a recorded U07.1 positive diagnosis. The earliest date of either is their COVID index date.
- Patient was older than or 18 years old at the time of their COVID index.
- Patient had a U09.9 code in their available health records. The first date of U09.9 was after their COVID index and after 1 October 2021 (date U09.9 was published for use).
3.2.2. COVID-Positive Control Group Inclusion Criteria (No Documented Long COVID)
- COVID-19-positive patient as defined with a positive SARS-CoV-2 PCR/AG test or a recorded U07.1 positive diagnosis. The earliest date of either is their COVID index date.
- Patient was older than or equal to 18 years old at the time of their COVID index.
- Patient had no U09.9 code in their available health records.
- Patient was selected as a matched control based on the matching process described below. This ensured a balance of cases and controls with regard to age, COVID era, patient engagement, and healthcare system (site).
3.2.3. Matching Process
- The case and control are from the same health system, minimizing selection bias related to health system population and care practices.
- The age difference between the case and control is less than or equal to 10 years, minimizing mortality and Long COVID diagnosis biases related to age.
- The difference in the COVID index date between the case and control is less than or equal to 45 days, minimizing the bias related to the different phases of the pandemic. This also helps ensure similar post-COVID potential observation periods in our survival analysis.
- The difference in the log of the pre-index number of visits between the case and control must be less than or equal to 1. This ensures a similar level of engagement with the health system, which can both be a proxy for acuity as well as predictive of the capture of mortality events.
- The difference in the log of CCI score must be less than or equal to 0.5 where the CCI score is based on comorbidities recorded before and up through the COVID index date. This helps balance pre-existing mortality risk between the cases and controls.
3.2.4. Survival Timeline Considerations
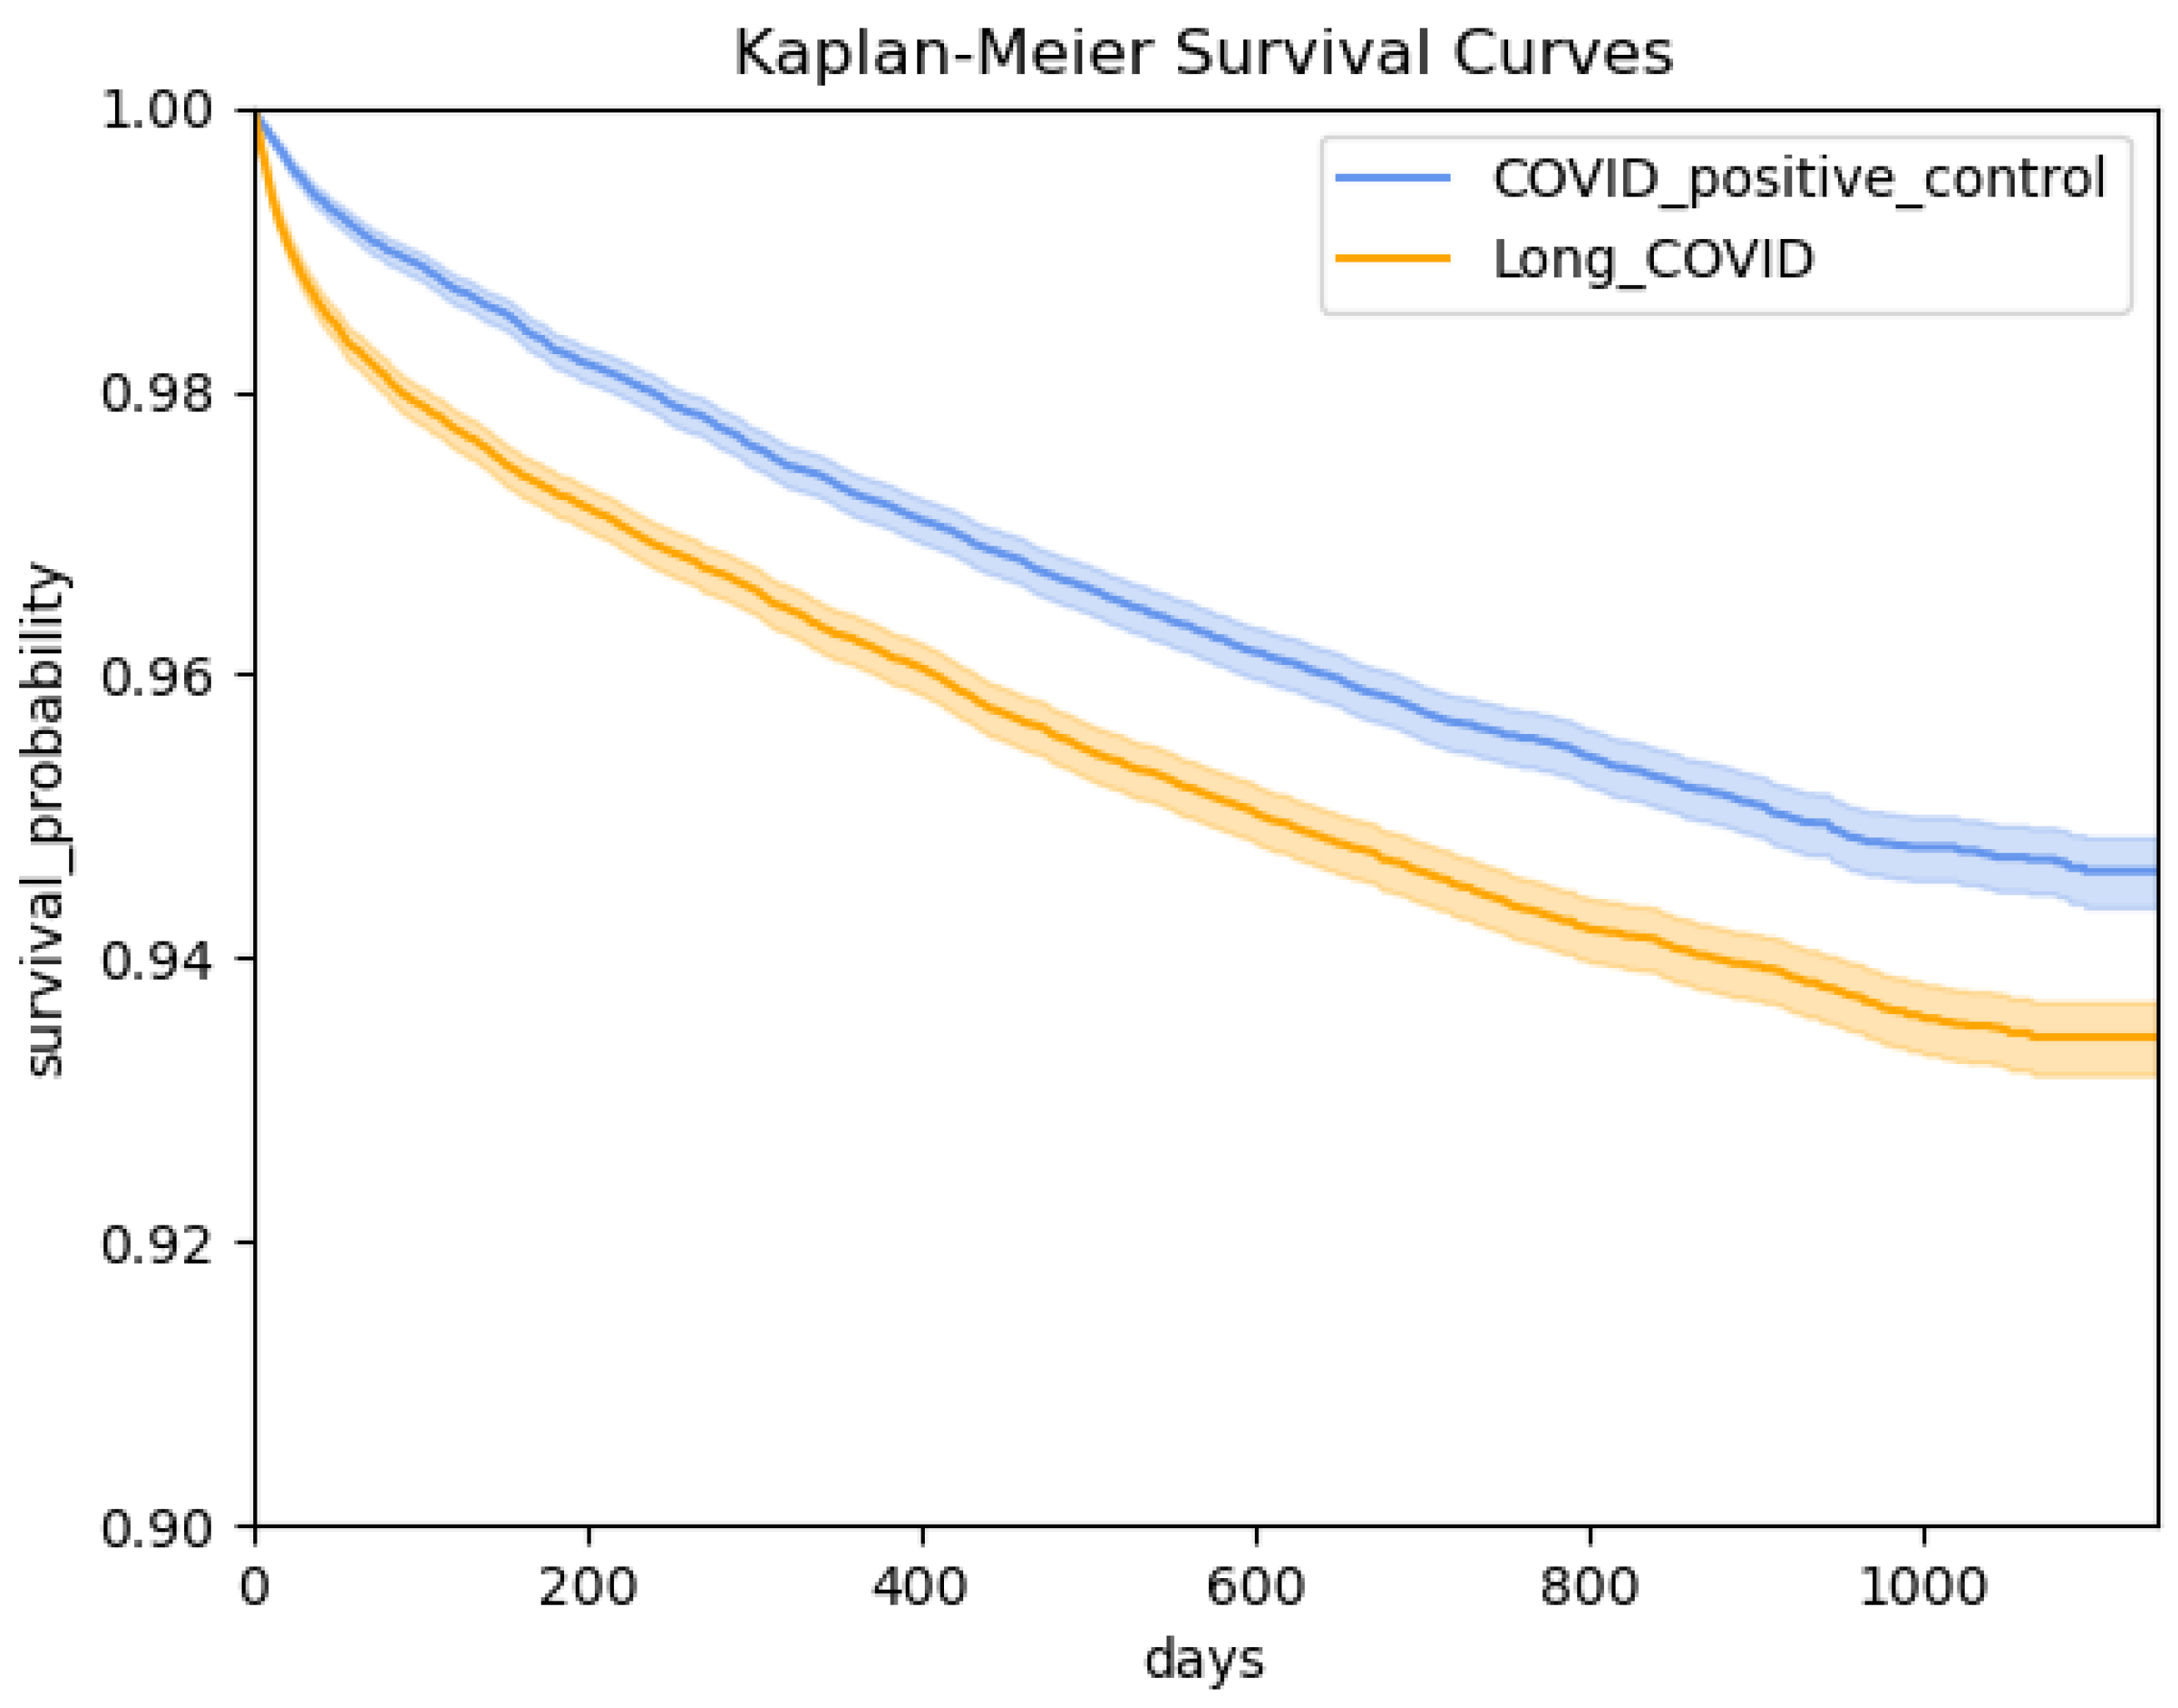
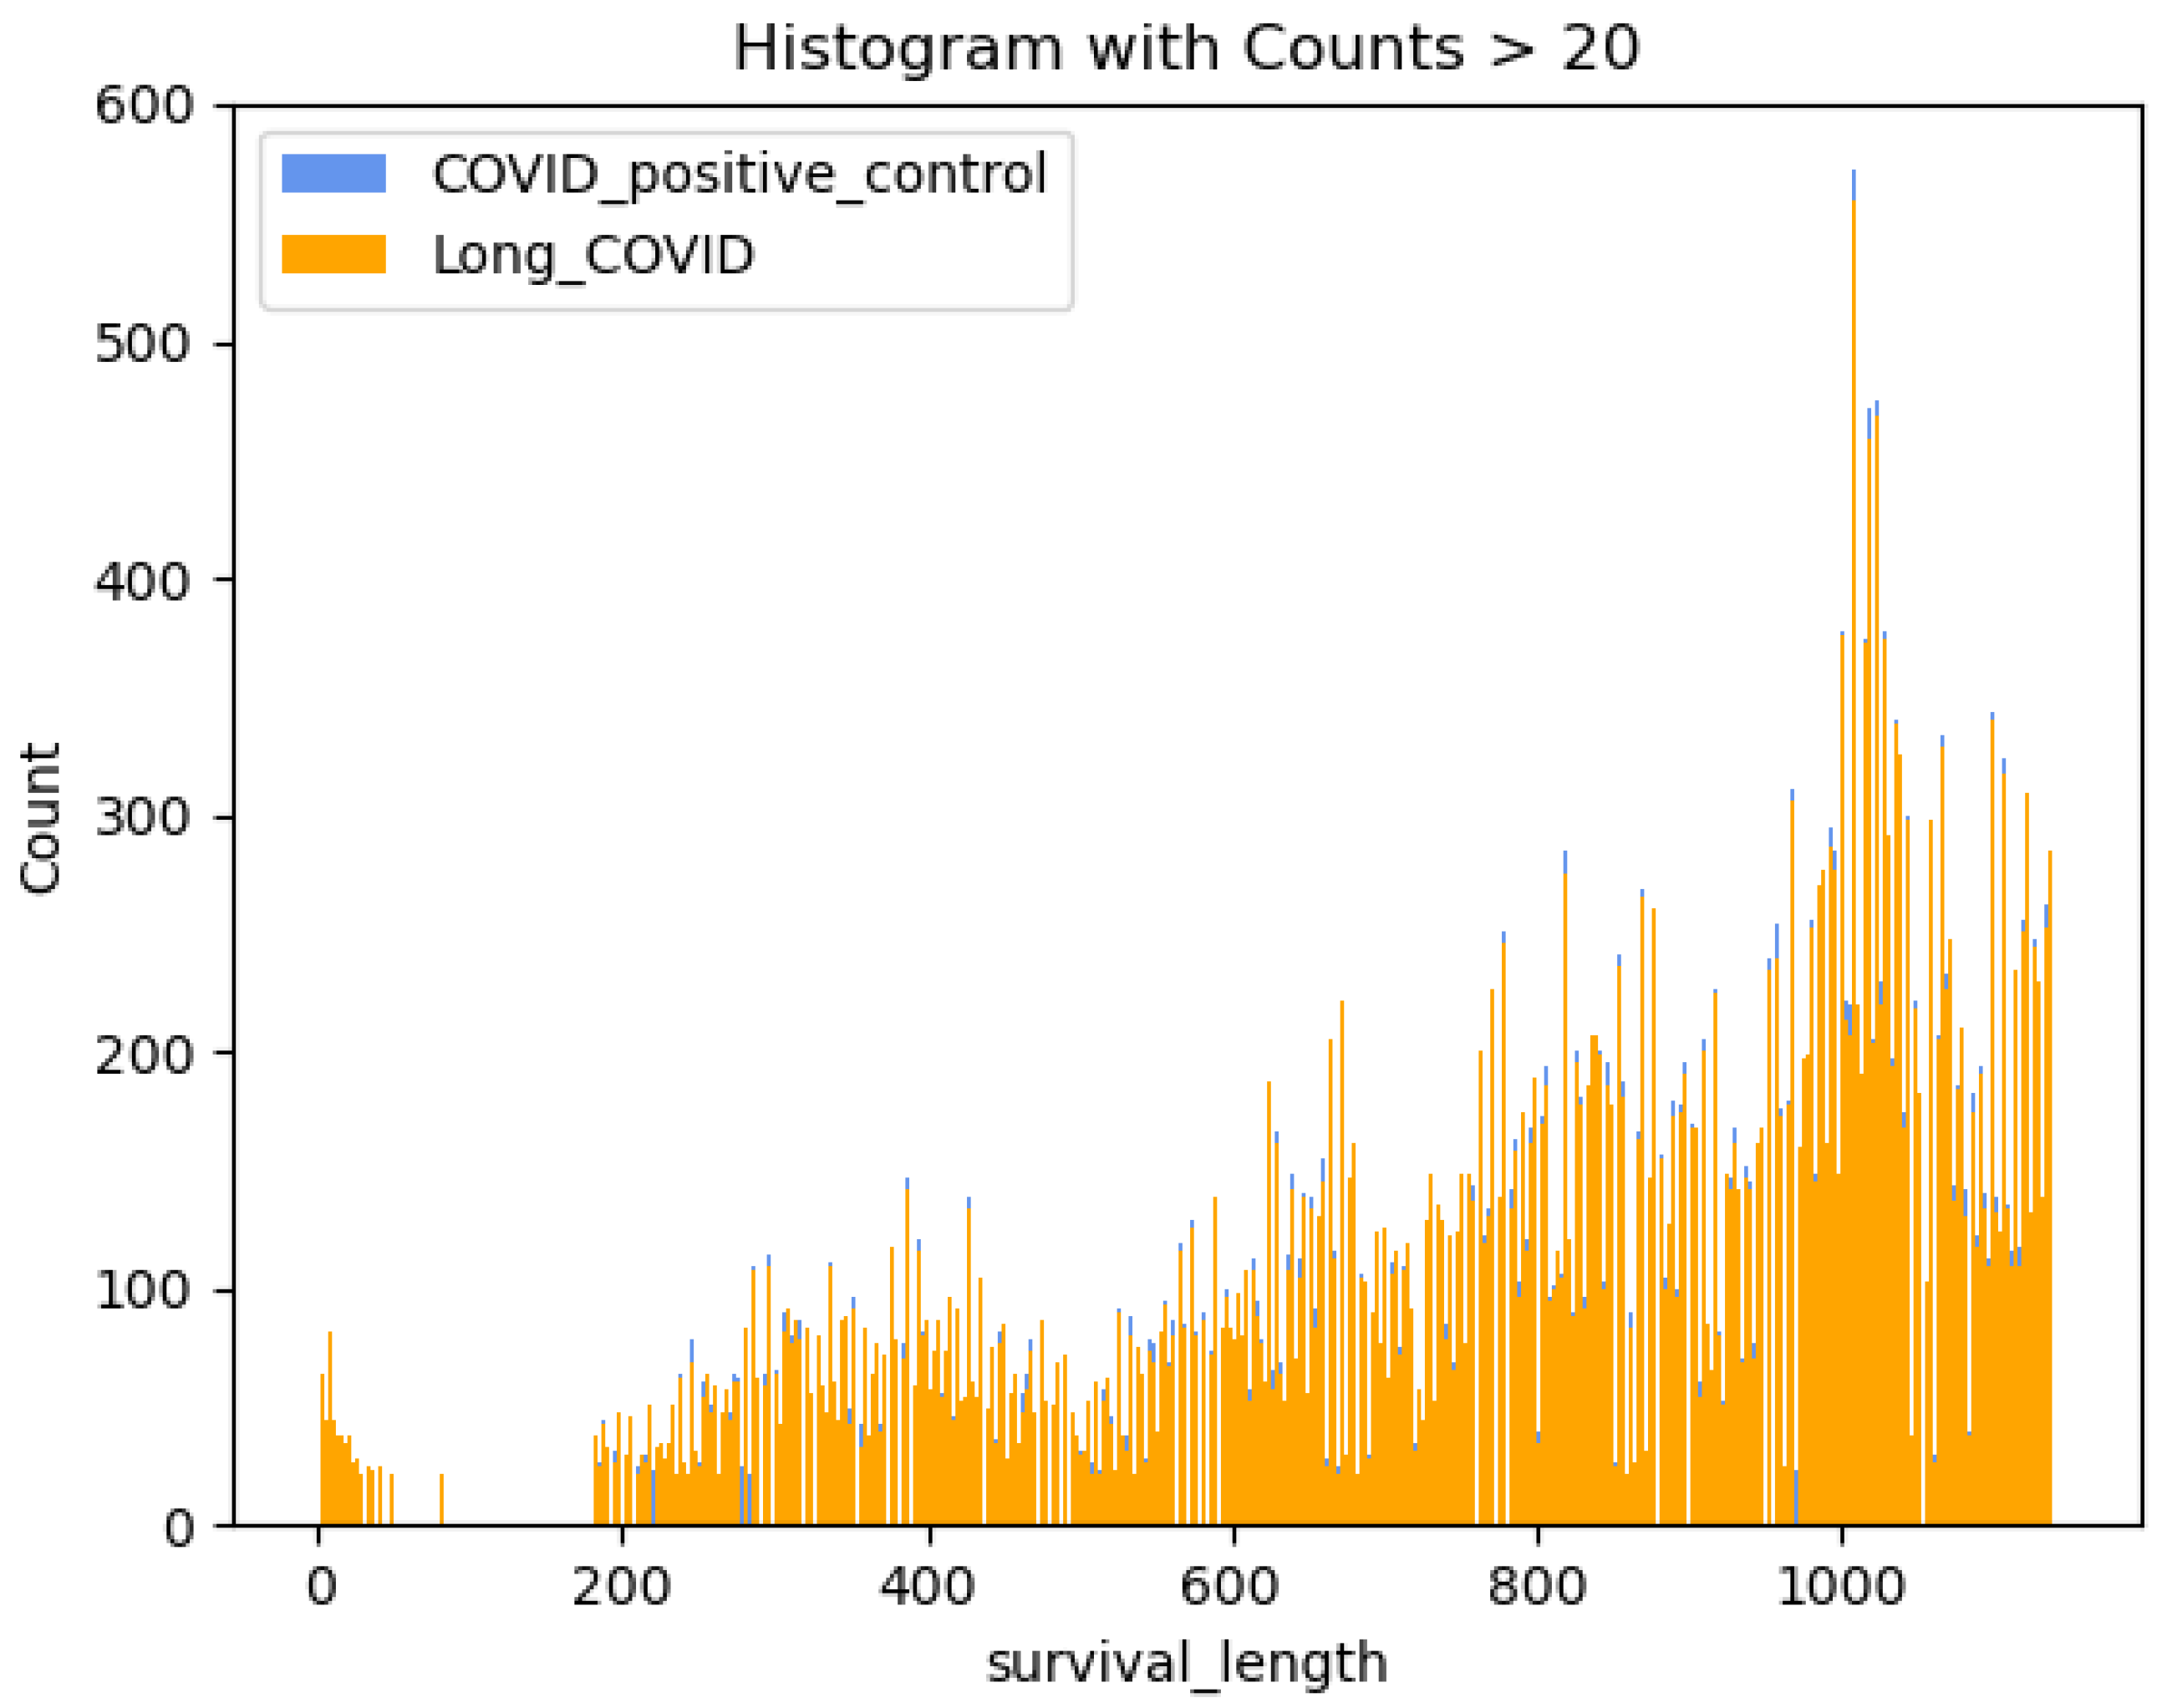
3.3. Survival Analysis
3.4. Bayesian Parametric Models
Log-Normal Model
4. Results
4.1. Cohort Summary
4.2. Modeling
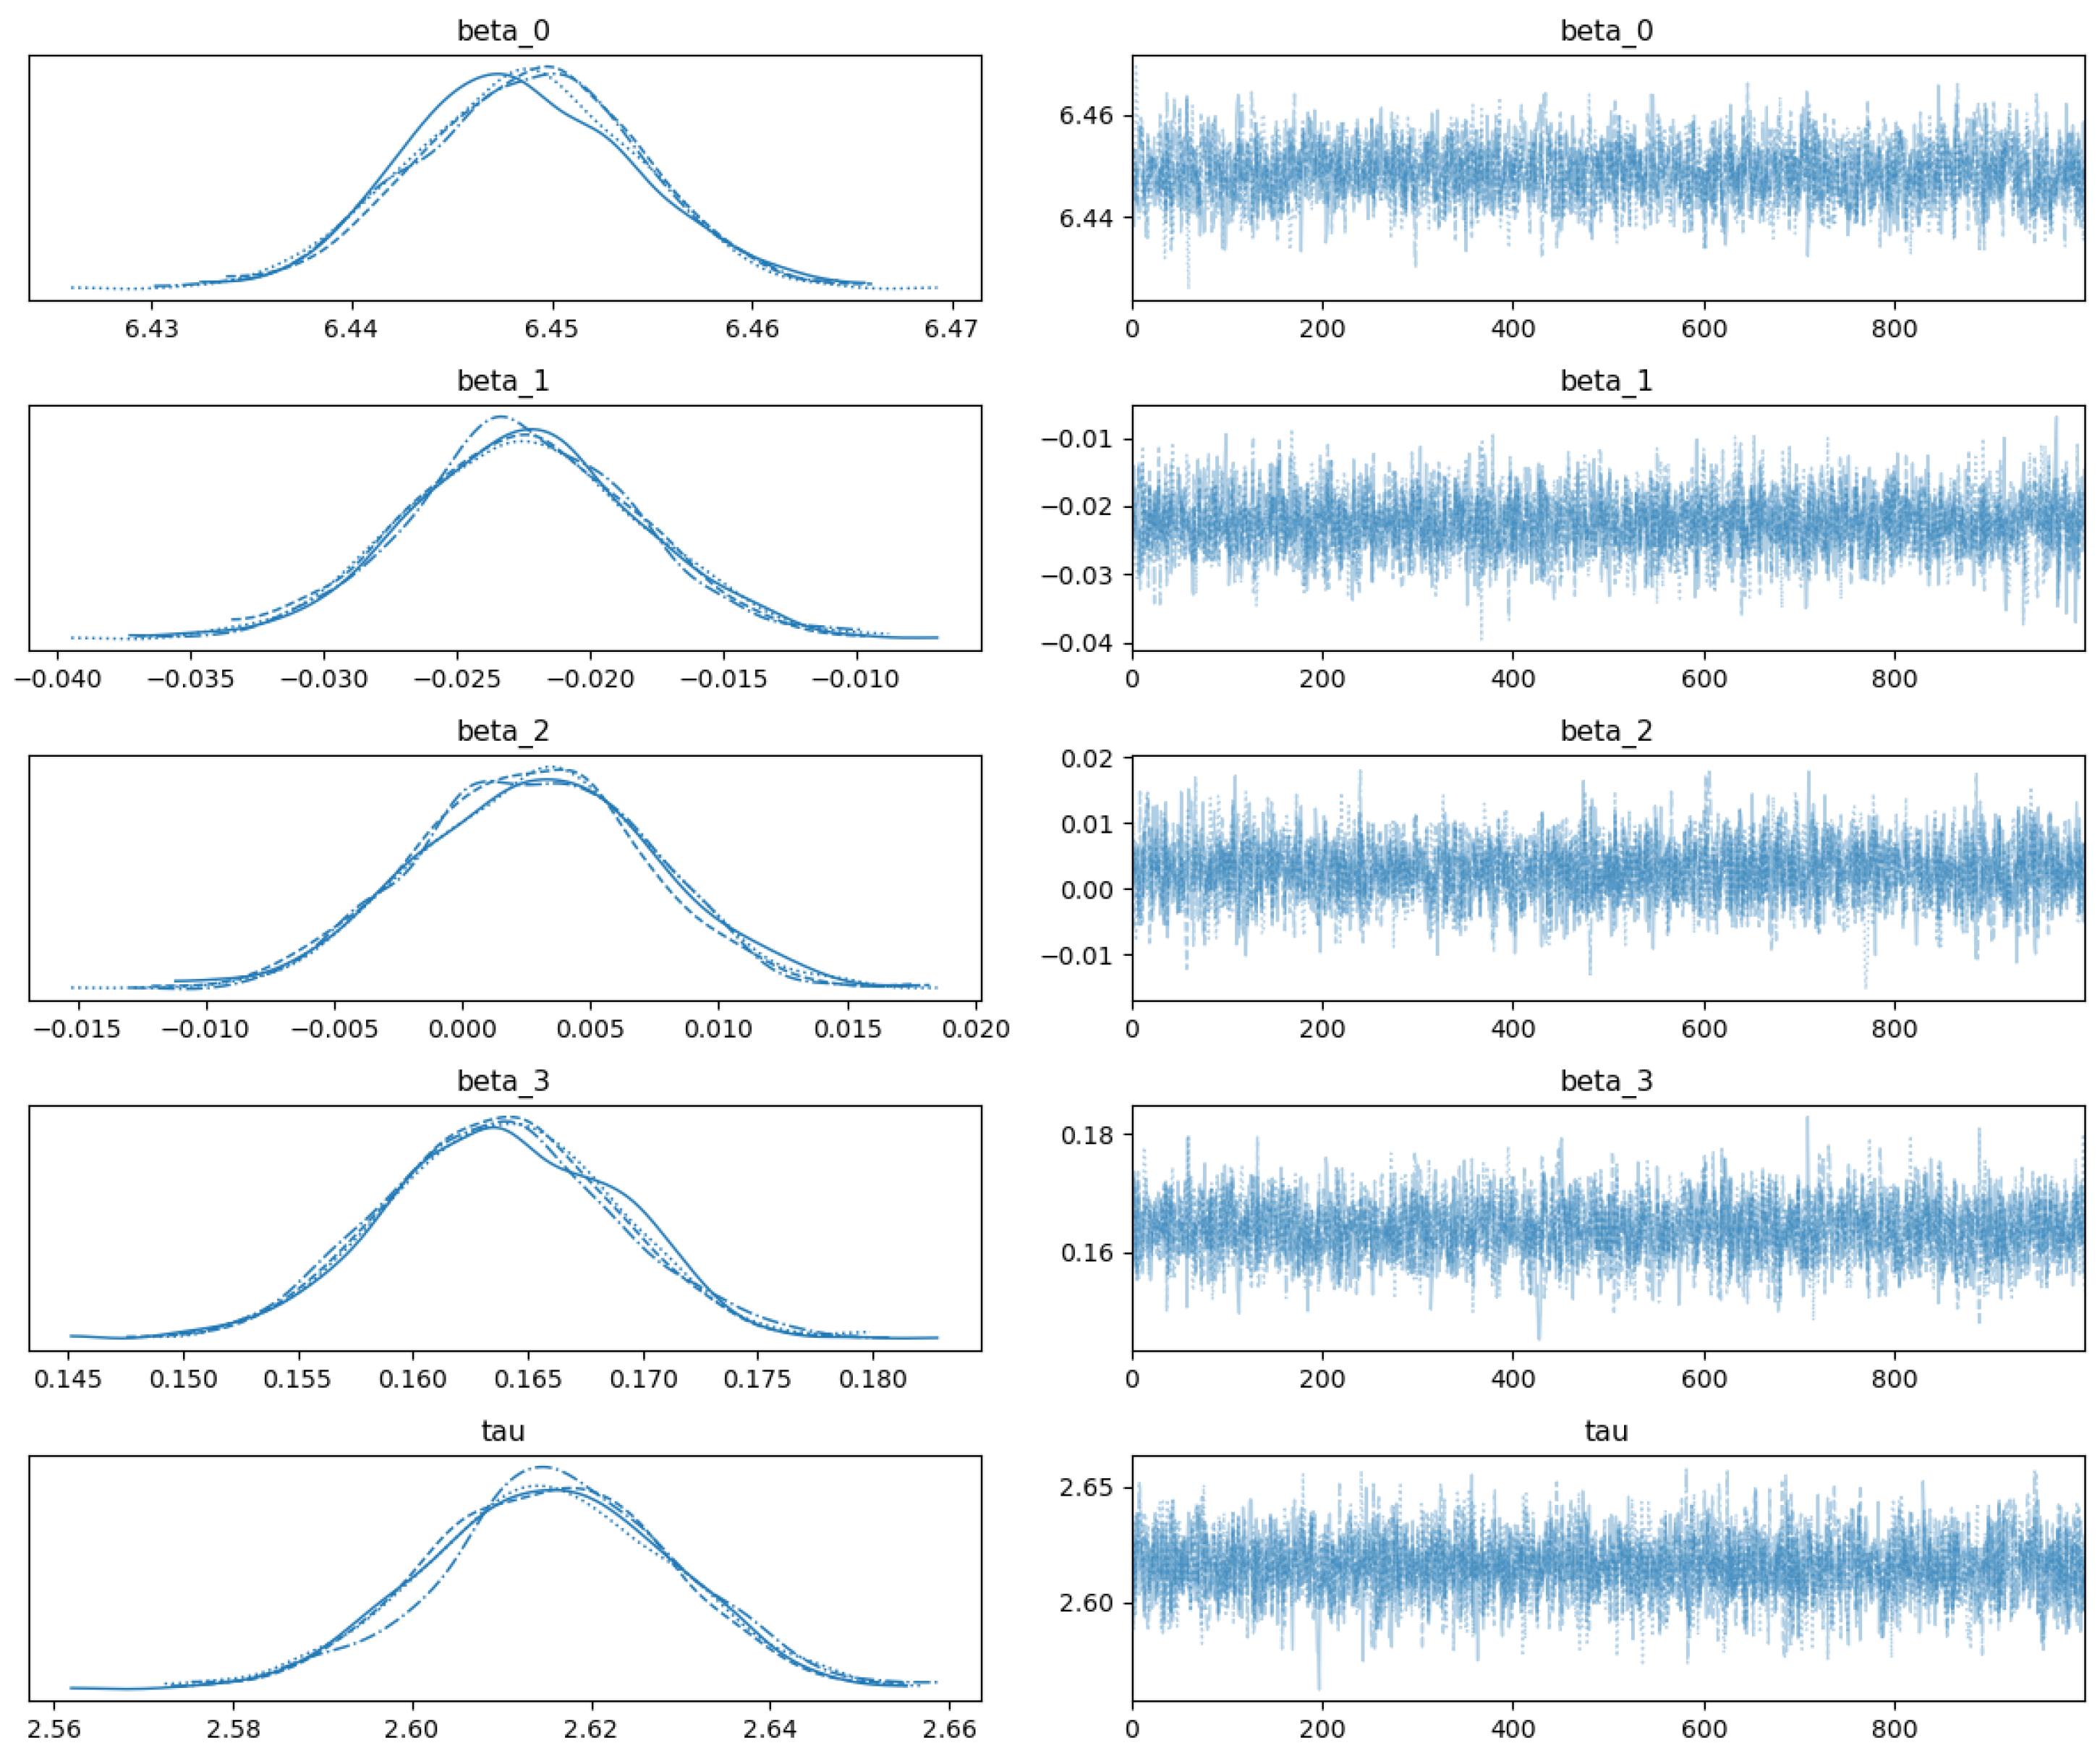
4.3. Parameter Estimation
5. Discussion
6. Conclusions
Author Contributions
Funding
Institutional Review Board Statement
Informed Consent Statement
Data Availability Statement
Acknowledgments
Conflicts of Interest
References
- Long COVID or Post-COVID Conditions. 2021. Available online: https://www.cdc.gov/covid/long-term-effects/ (accessed on 9 April 2025).
- New ICD-10-CM Code for Post-COVID Conditions, Following the 2019 Novel Coronavirus (COVID-19). 2021. Available online: https://www.cdc.gov/nchs/data/icd/announcement-new-icd-code-for-post-covid-condition-april-2022-final.pdf (accessed on 9 April 2025).
- Haendel, M.A.; Chute, C.G.; Bennett, T.D.; Eichmann, D.A.; Guinney, J.; Kibbe, W.A.; Payne, P.R.; Pfaff, E.R.; Robinson, P.N.; Saltz, J.H.; et al. The National COVID Cohort Collaborative (N3C): Rationale, design, infrastructure, and deployment. J. Am. Med. Inform. Assoc. 2021, 28, 427–443. [Google Scholar] [CrossRef] [PubMed]
- Hill, E.L.; Mehta, H.B.; Sharma, S.; Mane, K.; Xie, C.; Cathey, E.; Loomba, J.; Russell, S.; Spratt, H.; DeWitt, P.E.; et al. Risk factors associated with post-acute sequelae of sars-cov-2 in an ehr cohort: A national covid cohort collaborative (n3c) analysis as part of the nih recover program. medRxiv 2022. [Google Scholar] [CrossRef]
- Pfaff, E.R.; Madlock-Brown, C.; Baratta, J.M.; Bhatia, A.; Davis, H.; Girvin, A.; Hill, E.; Kelly, E.; Kostka, K.; Loomba, J.; et al. Coding long COVID: Characterizing a new disease through an ICD-10 lens. BMC Med. 2023, 21, 58. [Google Scholar] [CrossRef]
- Reese, J.T.; Blau, H.; Casiraghi, E.; Bergquist, T.; Loomba, J.J.; Callahan, T.J.; Laraway, B.; Antonescu, C.; Coleman, B.; Gargano, M.; et al. Generalisable long COVID subtypes: Findings from the NIH N3C and RECOVER programmes. EBioMedicine 2023, 87, 104413. [Google Scholar] [CrossRef]
- Jiang, S.; Loomba, J.; Sharma, S.; Brown, D. Vital measurements of hospitalized COVID-19 patients as a predictor of long COVID: An EHR-based cohort study from the RECOVER program in N3C. In Proceedings of the 2022 IEEE International Conference on Bioinformatics and Biomedicine (BIBM), Las Vegas, NV, USA, 6–8 December 2022; pp. 3023–3030. [Google Scholar]
- Antony, B.; Blau, H.; Casiraghi, E.; Loomba, J.J.; Callahan, T.J.; Laraway, B.J.; Wilkins, K.J.; Antonescu, C.C.; Valentini, G.; Williams, A.E.; et al. Predictive models of long COVID. EBioMedicine 2023, 96, 104777. [Google Scholar] [CrossRef]
- Ibrahim, J.G.; Chen, M.H.; Sinha, D.; Ibrahim, J.; Chen, M. Bayesian Survival Analysis; Springer: Berlin/Heidelberg, Germany, 2001; Volume 2. [Google Scholar]
- Sousa, G.; Garces, T.; Cestari, V.; Florêncio, R.; Moreira, T.; Pereira, M. Mortality and survival of COVID-19. Epidemiol. Infect. 2020, 148, e123. [Google Scholar] [CrossRef] [PubMed]
- Neville, T.H.; Hays, R.D.; Tseng, C.H.; Gonzalez, C.A.; Chen, L.; Hong, A.; Yamamoto, M.; Santoso, L.; Kung, A.; Schwab, K.; et al. Survival after severe COVID-19: Long-term outcomes of patients admitted to an intensive care unit. J. Intensive Care Med. 2022, 37, 1019–1028. [Google Scholar] [CrossRef]
- Long, J.D.; Strohbehn, I.; Sawtell, R.; Bhattacharyya, R.; Sise, M.E. COVID-19 Survival and its impact on chronic kidney disease. Transl. Res. 2022, 241, 70–82. [Google Scholar] [CrossRef]
- Quan, H.; Li, B.; Couris, C.M.; Fushimi, K.; Graham, P.; Hider, P.; Januel, J.M.; Sundararajan, V. Updating and validating the Charlson comorbidity index and score for risk adjustment in hospital discharge abstracts using data from 6 countries. Am. J. Epidemiol. 2011, 173, 676–682. [Google Scholar] [CrossRef]
- Zhou, A.; French, E.; Moffitt, R.; Loomba, J. N3C Logic Liaison Templates: Transforming Complex Health Data Into Analytics Ready Tables. 2023. Available online: https://doi.org/10.18130/rv3j-ke83 (accessed on 9 April 2025).
- Stuart, E.A.; King, G.; Imai, K.; Ho, D. MatchIt: Nonparametric preprocessing for parametric causal inference. J. Stat. Softw. 2011, 42, 1–28. [Google Scholar]
- Jager, K.J.; Tripepi, G.; Chesnaye, N.C.; Dekker, F.W.; Zoccali, C.; Stel, V.S. Where to look for the most frequent biases? Nephrology 2020, 25, 435–441. [Google Scholar] [CrossRef] [PubMed]
- Yadav, K.; Lewis, R.J. Immortal time bias in observational studies. JAMA 2021, 325, 686–687. [Google Scholar] [CrossRef] [PubMed]
- Stuart, E.A. Matching methods for causal inference: A review and a look forward. Stat. Sci. Rev. J. Inst. Math. Stat. 2010, 25, 1. [Google Scholar] [CrossRef] [PubMed]
- N3C Privacy-Preserving Record Linkage. Available online: https://covid.cd2h.org/PPRL/ (accessed on 9 April 2025).
- OMOP Common Data Model. Available online: https://ohdsi.github.io/CommonDataModel/ (accessed on 9 April 2025).
- Leung, K.M.; Elashoff, R.M.; Afifi, A.A. Censoring issues in survival analysis. Annu. Rev. Public Health 1997, 18, 83–104. [Google Scholar] [CrossRef]
- Joarder, A.; Krishna, H.; Kundu, D. Inferences on Weibull parameters with conventional type-I censoring. Comput. Stat. Data Anal. 2011, 55, 1–11. [Google Scholar] [CrossRef]
- Dutta, S.; Dey, S.; Kayal, S. Bayesian survival analysis of logistic exponential distribution for adaptive progressive Type-II censored data. Comput. Stat. 2023, 39, 2109–2155. [Google Scholar] [CrossRef]
- Royston, P. The lognormal distribution as a model for survival time in cancer, with an emphasis on prognostic factors. Stat. Neerl. 2001, 55, 89–104. [Google Scholar] [CrossRef]
- Gupta, R.C.; Kannan, N.; Raychaudhuri, A. Analysis of lognormal survival data. Math. Biosci. 1997, 139, 103–115. [Google Scholar] [CrossRef]
- Betancourt, M. A conceptual introduction to Hamiltonian Monte Carlo. arXiv 2017, arXiv:1701.02434. [Google Scholar]
- Hoffman, M.D.; Gelman, A. The No-U-Turn sampler: Adaptively setting path lengths in Hamiltonian Monte Carlo. J. Mach. Learn. Res. 2014, 15, 1593–1623. [Google Scholar]
- Patil, A.; Huard, D.; Fonnesbeck, C.J. PyMC: Bayesian stochastic modelling in Python. J. Stat. Softw. 2010, 35, 1. [Google Scholar] [CrossRef]
- Adult BMI. Available online: https://www.cdc.gov/bmi/faq/index.html (accessed on 9 April 2025).
- Roy, V. Convergence diagnostics for markov chain monte carlo. Annu. Rev. Stat. Its Appl. 2020, 7, 387–412. [Google Scholar] [CrossRef]
- Rich, J.T.; Neely, J.G.; Paniello, R.C.; Voelker, C.C.; Nussenbaum, B.; Wang, E.W. A practical guide to understanding Kaplan-Meier curves. Otolaryngol.—Head Neck Surg. 2010, 143, 331–336. [Google Scholar] [CrossRef] [PubMed]
- Bland, J.M.; Altman, D.G. The logrank test. BMJ 2004, 328, 1073. [Google Scholar] [CrossRef] [PubMed]
- Bouman, P.; Dukic, V.; Meng, X.L. A Bayesian multiresolution hazard model with application to an AIDS reporting delay study. Stat. Sin. 2005, 15, 325–357. [Google Scholar]
- Dukić, V.; Dignam, J. Bayesian hierarchical multiresolution hazard model for the study of time-dependent failure patterns in early stage breast cancer. Bayesian Anal. 2007, 2, 591. [Google Scholar] [PubMed]
- Pfaff, E.R.; Girvin, A.T.; Bennett, T.D.; Bhatia, A.; Brooks, I.M.; Deer, R.R.; Dekermanjian, J.P.; Jolley, S.E.; Kahn, M.G.; Kostka, K.; et al. Identifying who has long COVID in the USA: A machine learning approach using N3C data. Lancet Digit. Health 2022, 4, e532–e541. [Google Scholar] [CrossRef]
- Crosskey, M.; McIntee, T.; Preiss, A.J.; Brannock, M.D.; Yoo, Y.J.; Hadley, E.C.; Blanceró, F.; Chew, R.; Loomba, J.; Bhatia, A.; et al. Reengineering a machine learning phenotype to adapt to the changing COVID-19 landscape: A study from the N3C and RECOVER consortia. medRxiv 2023. [Google Scholar] [CrossRef]
- Austin, P.C.; Lee, D.S.; Fine, J.P. Introduction to the analysis of survival data in the presence of competing risks. Circulation 2016, 133, 601–609. [Google Scholar] [CrossRef]
- Schuster, N.A.; Hoogendijk, E.O.; Kok, A.A.; Twisk, J.W.; Heymans, M.W. Ignoring competing events in the analysis of survival data may lead to biased results: A nonmathematical illustration of competing risk analysis. J. Clin. Epidemiol. 2020, 122, 42–48. [Google Scholar] [CrossRef]

| Inclusion Criteria | Number of Patients |
|---|---|
| COVID-positive patients | 7,223,164 |
| patients with U09.9 code | 74,873 |
| U09.9 date later than COVID index date and 1 October 2021 | 72,881 |
| age greater than or equal to 18 | 70,569 |
| Inclusion Criteria | Number of Patients |
|---|---|
| COVID-positive patients | 7,223,164 |
| age greater than or equal to 18 | 6,074,612 |
| patients with no U09.9 code | 5,998,558 |
| patients from clinical sites reporting U09.9 | 5,310,527 |
| COVID-Positive Control Group | Long COVID Group | |
|---|---|---|
| number of patients | 5,310,527 | 70,569 |
| age (mean (SD)) | 48.22 (18.96) | 54.87 (16.52) |
| sex (%) | ||
| Female | 3,016,285 (56.8) | 46,238 (65.5) |
| Male | 2,288,951 (43.1) | 24,297 (34.4) |
| race and ethnicity (%) | ||
| Asian Non-Hispanic | 146,001 (2.7) | 1917 (2.7) |
| Black or African American Non-Hispanic | 617,374 (11.6) | 7798 (11.1) |
| White Non-Hispanic | 3,409,546 (64.2) | 49,671 (70.4) |
| Other Non-Hispanic | 200,365 (3.8) | 1390 (2.0) |
| Hispanic or Latino Any Race | 638,650 (12.0) | 7061 (10.0) |
| Missing/Unknown | 298,591 (5.6) | 2732 (3.9) |
| CCI category (%) | ||
| 0 | 3,517,745 (66.2) | 29,447 (41.7) |
| 1–2 | 1,040,193 (19.6) | 22,266 (31.6) |
| 3–4 | 372,760 (7.0) | 9745 (13.8) |
| 4+ | 311,516 (5.9) | 8849 (12.5) |
| age category (%) | ||
| 18–20 | 258,611 (4.9) | 823 (1.2) |
| 21–45 | 2,265,771 (42.7) | 20,442 (29.0) |
| 46–65 | 1,679,984 (31.6) | 29,612 (42.0) |
| 66+ | 1,106,161 (20.8) | 19,692 (27.9) |
| COVID-Positive Control Group | Long COVID Group | |
|---|---|---|
| number of patients | 47,437 | 47,437 |
| age (mean (SD)) | 56.35 (16.22) | 56.24 (16.40) |
| sex (%) | ||
| Female | 29,079 (61.3) | 31,340 (66.1) |
| Male | 18,344 (38.7) | 16,078 (33.9) |
| race and ethnicity (%) | ||
| Asian Non-Hispanic | 1472 (3.1) | 1256 (2.6) |
| Black or African American Non-Hispanic | 5671 (12.0) | 5254 (11.1) |
| White Non-Hispanic | 32,995 (69.6) | 33,928 (71.5) |
| Other Non-Hispanic | 887 (1.9) | 904 (1.9) |
| Hispanic or Latino Any Race | 4653 (9.8) | 4396 (9.3) |
| Missing/Unknown | 1759 (3.7) | 1699 (3.6) |
| CCI category (%) | ||
| 0 | 18,222 (38.4) | 17,006 (35.8) |
| 1–2 | 14,035 (29.6) | 15,447 (32.6) |
| 3–4 | 8103 (17.1) | 7833 (16.5) |
| 4+ | 7004 (14.8) | 7052 (14.9) |
| age category (%) | ||
| 18–20 | 380 (0.8) | 434 (0.9) |
| 21–45 | 12,134 (25.6) | 12,371 (26.1) |
| 46–65 | 20,006 (42.2) | 20,039 (42.2) |
| 66+ | 14,917 (31.4) | 14,593 (30.8) |
| Parameter | Mean | Standard Deviation | 95% High-Density Interval |
|---|---|---|---|
| (intercept) | 6.449 | 0.006 | [6.439, 6.459] |
| (U09.9) | −0.023 | 0.004 | [−0.031, −0.014] |
| (obesity) | 0.003 | 0.005 | [−0.006, 0.011] |
| (mild visit severity) | 0.164 | 0.005 | [0.155, 0.173] |
| (precision) | 2.616 | 0.014 | [2.588, 2.639] |
Disclaimer/Publisher’s Note: The statements, opinions and data contained in all publications are solely those of the individual author(s) and contributor(s) and not of MDPI and/or the editor(s). MDPI and/or the editor(s) disclaim responsibility for any injury to people or property resulting from any ideas, methods, instructions or products referred to in the content. |
© 2025 by the authors. Licensee MDPI, Basel, Switzerland. This article is an open access article distributed under the terms and conditions of the Creative Commons Attribution (CC BY) license (https://creativecommons.org/licenses/by/4.0/).
Share and Cite
Jiang, S.; Loomba, J.; Zhou, A.; Sharma, S.; Sengupta, S.; Liu, J.; Brown, D.; on behalf of N3C Consortium. A Bayesian Survival Analysis on Long COVID and Non-Long COVID Patients: A Cohort Study Using National COVID Cohort Collaborative (N3C) Data. Bioengineering 2025, 12, 496. https://doi.org/10.3390/bioengineering12050496
Jiang S, Loomba J, Zhou A, Sharma S, Sengupta S, Liu J, Brown D, on behalf of N3C Consortium. A Bayesian Survival Analysis on Long COVID and Non-Long COVID Patients: A Cohort Study Using National COVID Cohort Collaborative (N3C) Data. Bioengineering. 2025; 12(5):496. https://doi.org/10.3390/bioengineering12050496
Chicago/Turabian StyleJiang, Sihang, Johanna Loomba, Andrea Zhou, Suchetha Sharma, Saurav Sengupta, Jiebei Liu, Donald Brown, and on behalf of N3C Consortium. 2025. "A Bayesian Survival Analysis on Long COVID and Non-Long COVID Patients: A Cohort Study Using National COVID Cohort Collaborative (N3C) Data" Bioengineering 12, no. 5: 496. https://doi.org/10.3390/bioengineering12050496
APA StyleJiang, S., Loomba, J., Zhou, A., Sharma, S., Sengupta, S., Liu, J., Brown, D., & on behalf of N3C Consortium. (2025). A Bayesian Survival Analysis on Long COVID and Non-Long COVID Patients: A Cohort Study Using National COVID Cohort Collaborative (N3C) Data. Bioengineering, 12(5), 496. https://doi.org/10.3390/bioengineering12050496