
Leveraging Function Intersectionality and Multi-Modal Cerebrovascular Reactivity Measures for the Derivation of Individualized Intracranial Pressure Thresholds in Acute Traumatic Neural Injury

 , , , , , ,
Abstract
1. Introduction
2. Materials and Methods
2.1. Patient Population
2.2. Data Collection
2.3. Ethics
2.4. Signal Processing
2.5. iICP Derivation
2.6. Data Processing
2.7. Statistical Analysis
3. Results
3.1. Patient Population
3.2. Derivation of iICP
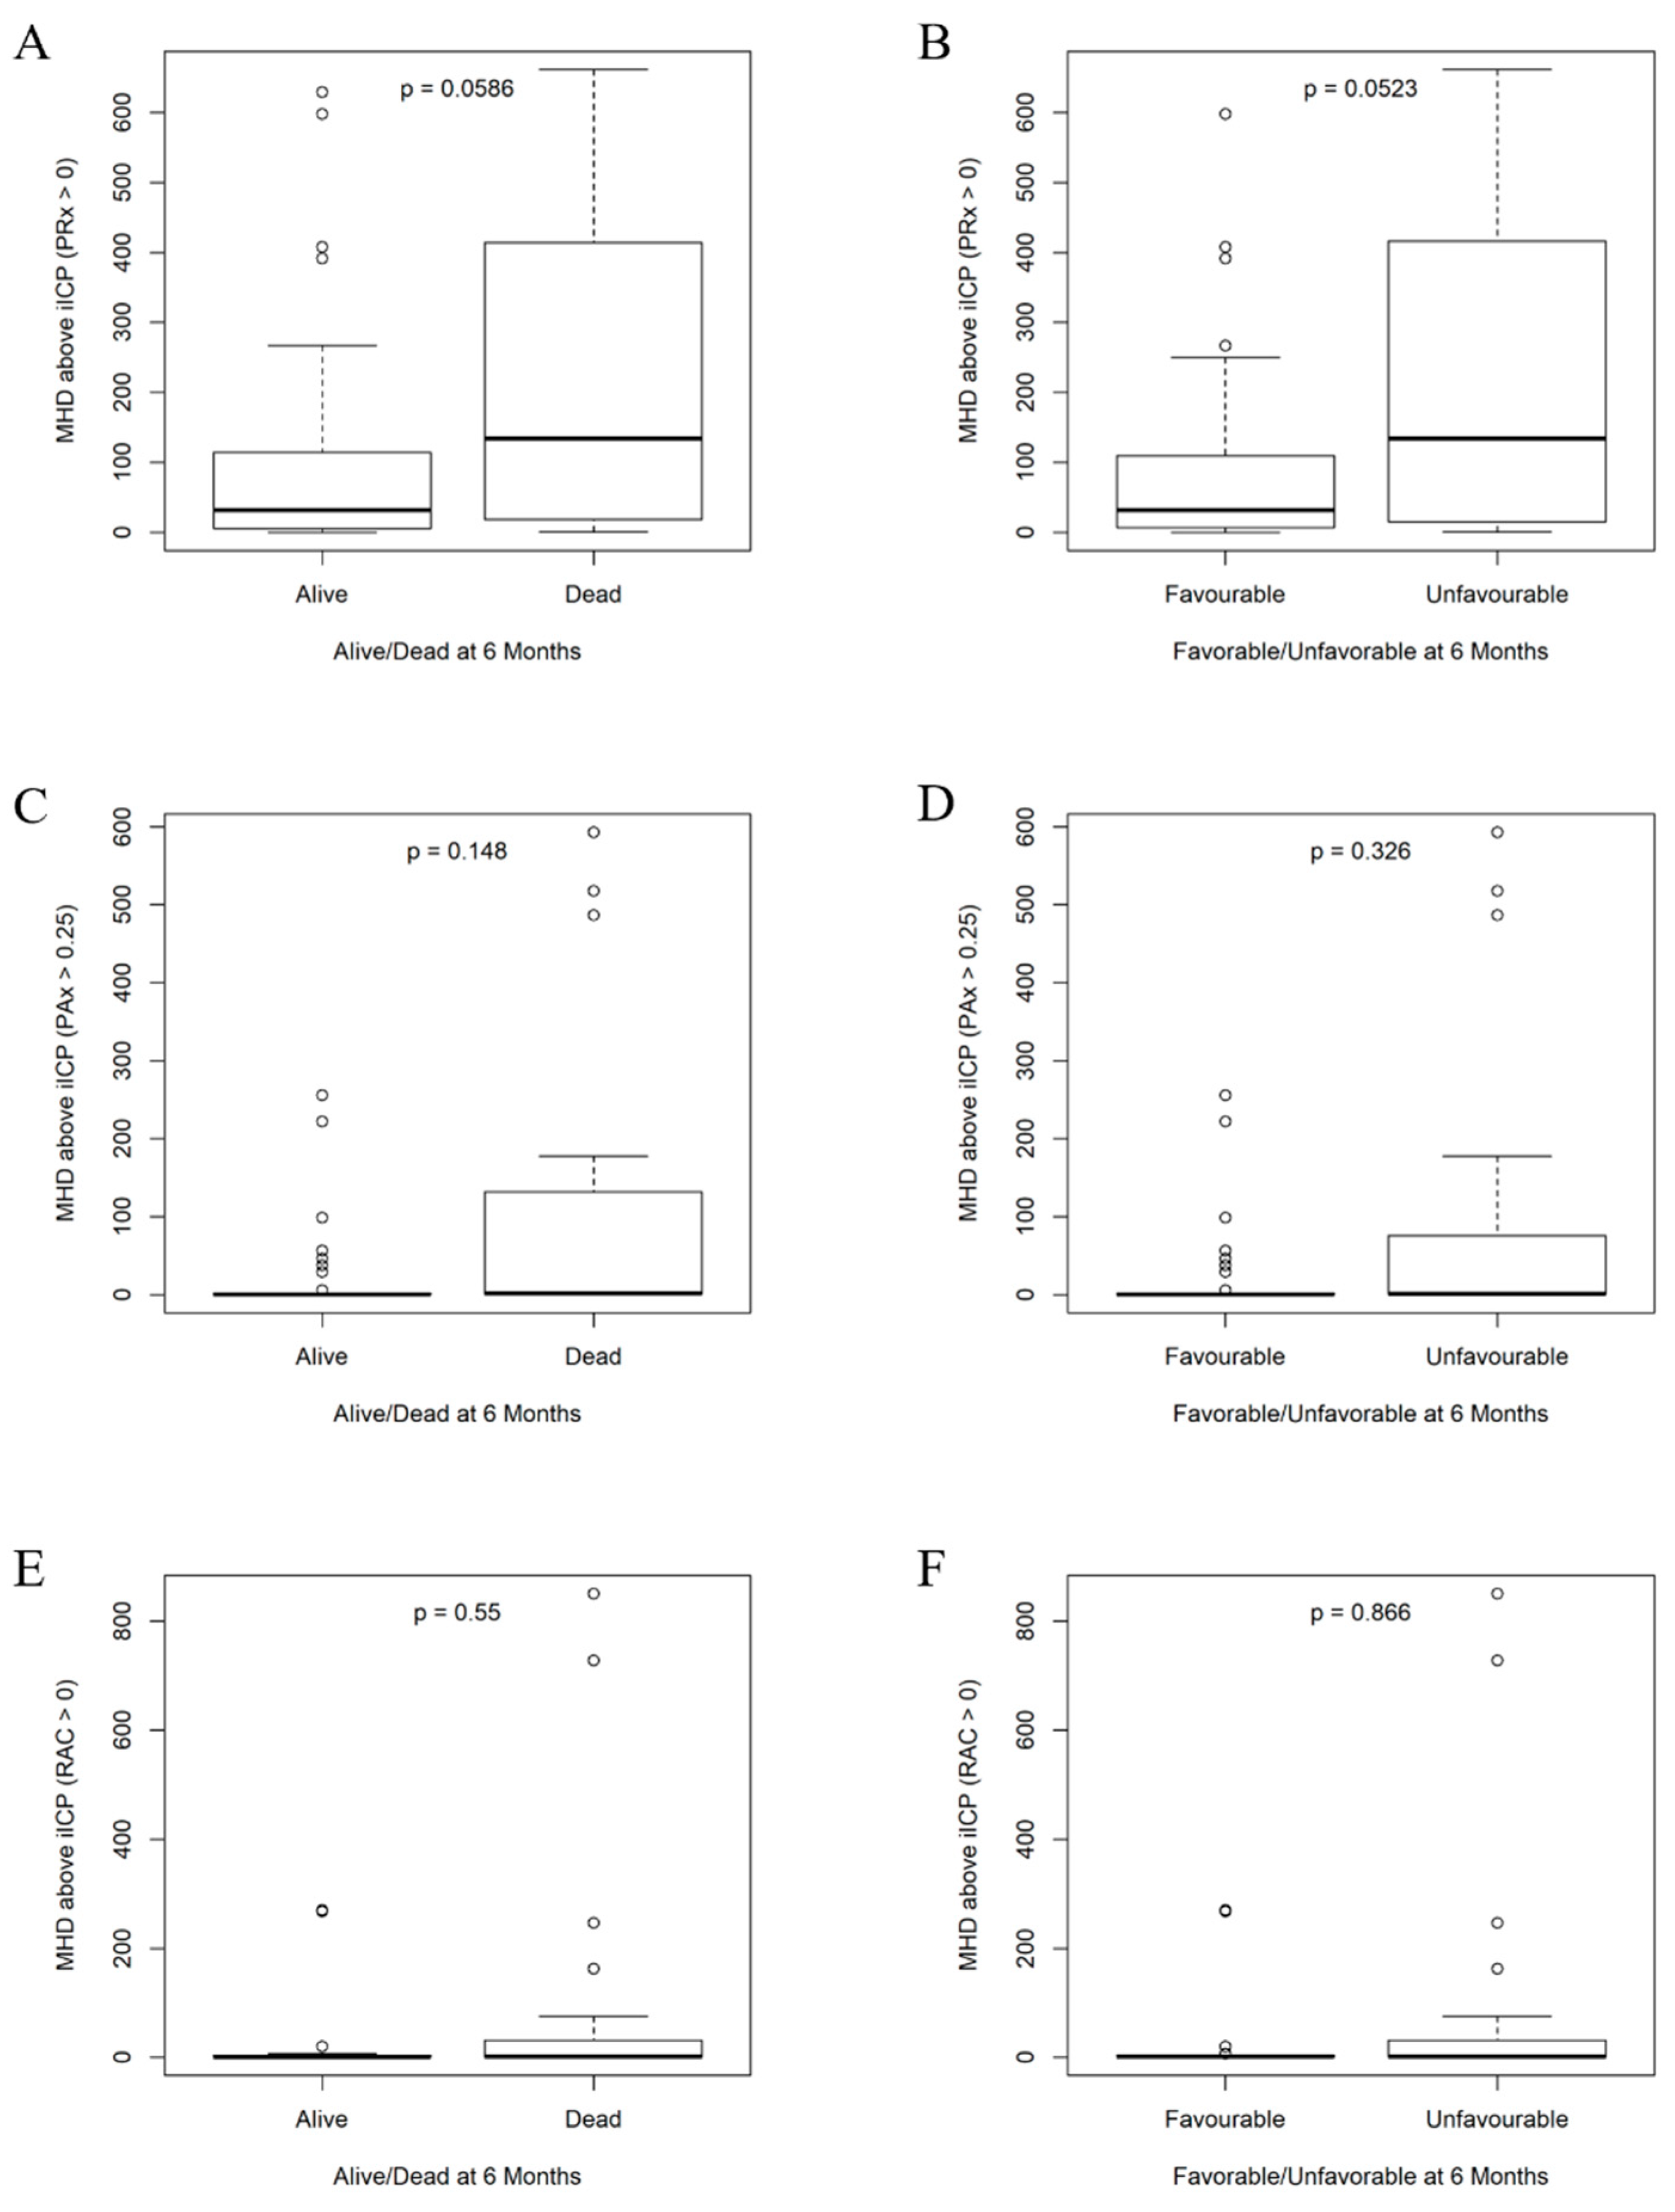
3.3. Comparisons Between Dichotomized Groupings
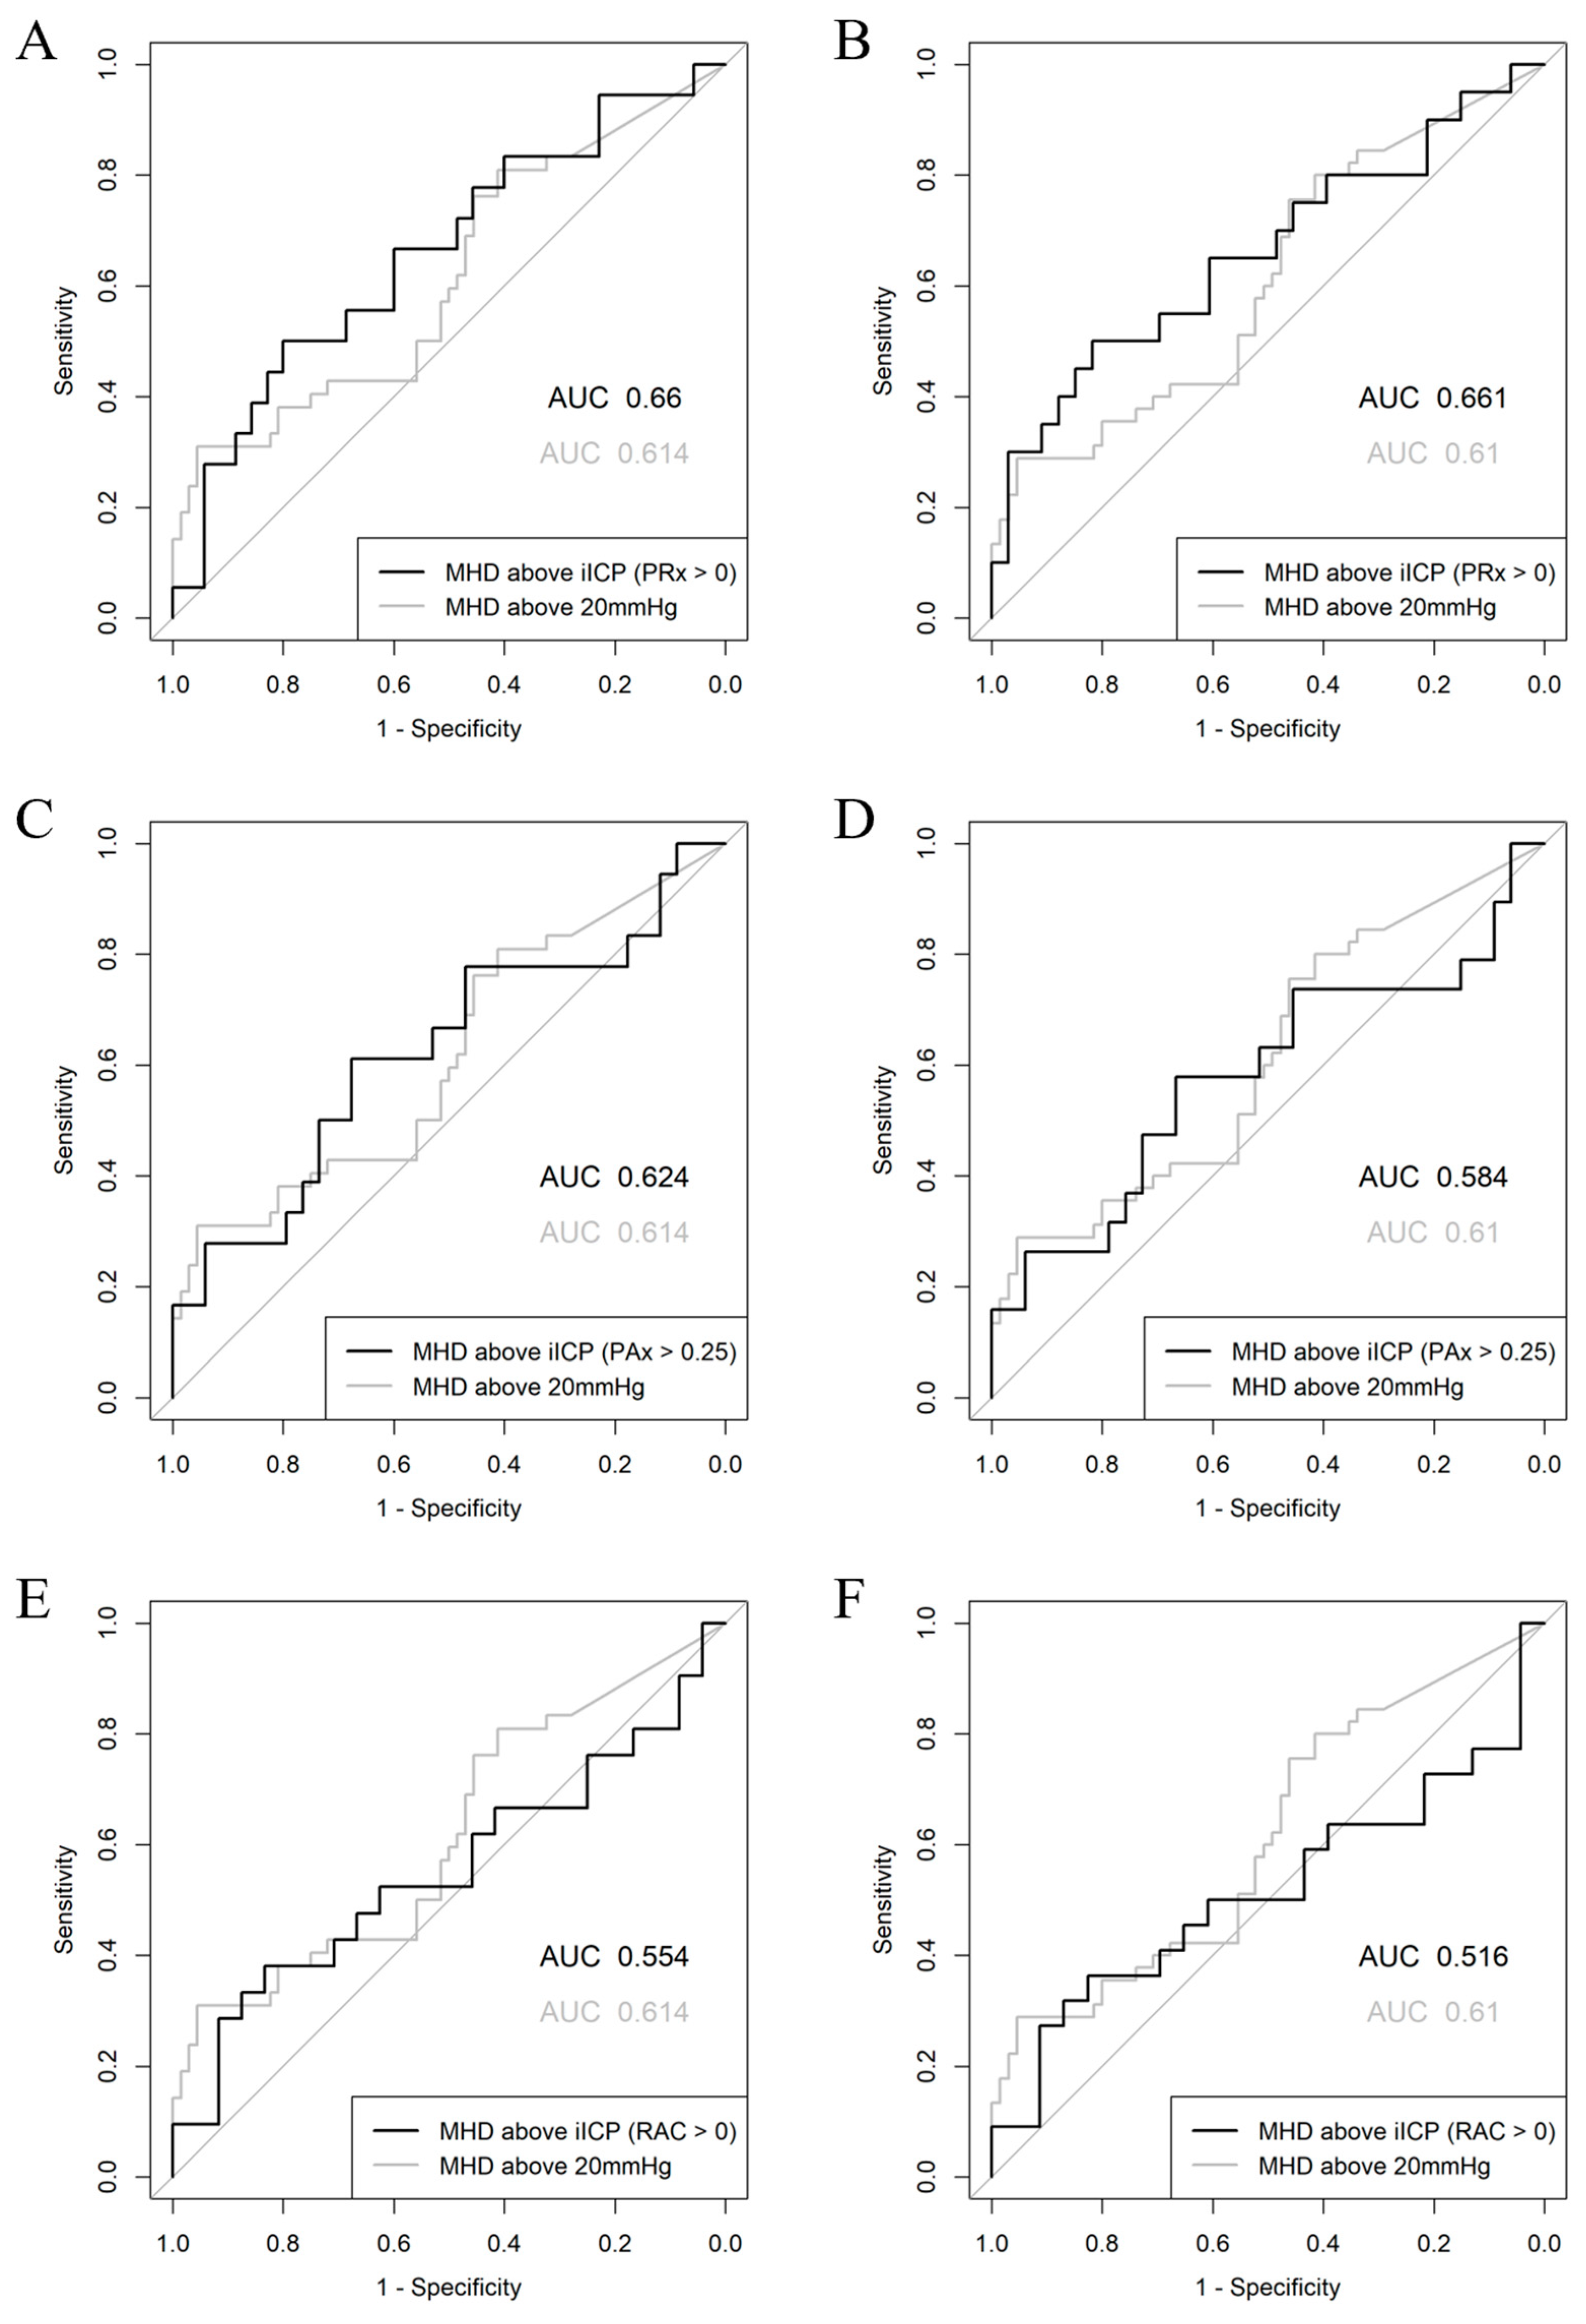
3.4. Logistic Regression Analyses
4. Discussion
5. Limitations
6. Future Directions
7. Conclusions
Author Contributions
Funding
Institutional Review Board Statement
Informed Consent Statement
Data Availability Statement
Acknowledgments
Conflicts of Interest
Abbreviations
| ABP | arterial blood pressure |
| AIC | Akaike information criterion |
| AMP | pulse amplitude of ICP |
| a.u. | arbitrary units |
| AUC | area under the curve |
| BTF | Brain Trauma Foundation |
| CI | confidence interval |
| CPP | cerebral perfusion pressure |
| CPPopt | cerebral perfusion pressure optimum |
| CT | computed tomography |
| EVD | external ventricular drain |
| GCS | Glasgow Coma Scale |
| GOSE | Glasgow Outcome Scale-Extended |
| ICM+ | Intensive Care Monitoring “Plus” |
| ICP | intracranial pressure |
| SICU | surgical intensive care unit |
| iICP | individualized intracranial pressure threshold |
| iICP.ci | iICP values filtered for those associated with a 95% CI of less than 0.2 a.u. |
| iICP.5-25 | iICP values filtered for those within a range of 5–25 mmHg |
| IMPACT | International Mission for Prognosis and Analysis of Clinical Trials |
| IQR | interquartile range |
| LOESS | locally weighted scatterplot smoothing |
| MAP | mean arterial pressure |
| mmHg | millimeters of mercury |
| PAx | pulse amplitude index (correlation between AMP and MAP) |
| PRx | pressure reactivity index (correlation between ICP and MAP) |
| RAC | correlation (R) between AMP (A) and CPP (C) |
Appendix A
Appendix B

| Demographic Variable | Median (IQR) or Raw Numbers (%) | ||
|---|---|---|---|
| Number of Patients | 124 | ||
| Age (years) | 42 (27–57) | ||
| Sex | Male | 103 (83%) | |
| Female | 21 (17%) | ||
| Admission GCS Total | 6.5 (4–8) | ||
| Admission GCS Motor | 4 (2–5) | ||
| Admission GCS Eyes | 1 (1–2) | ||
| Admission GCS Verbal | 1 (1–1) | ||
| Admission Pupillary Response | Bilaterally Reactive | 73 (59%) | |
| Unilaterally Unreactive | 32 (26%) | ||
| Bilaterally Unreactive | 19 (15%) | ||
| Marshall CT Grade | 5 (3–5) | ||
| Rotterdam CT Grade | 4 (4–5.25) | ||
| Helsinki CT Score | 6 (4.75–9) | ||
| Stockholm CT Score | 3.2 (2.5–3.9) | ||
| GOSE (6 Months) | 5 (1–7) | ||
| Number Alive (GOSE 2–8) at 6 Months | 68 (62%) | ||
| Number Dead (GOSE 1) at 6 Months | 42 (38%) | ||
| Number Favorable (GOSE 5–8) at 6 Months | 65 (59%) | ||
| Number Unfavorable (GOSE 1–4) at 6 Months | 45 (41%) | ||
| Number with Hypoxia Episode | 40 (32%) | ||
| Number with Hypotension Episode | 12 (10%) | ||
| Number with Traumatic SAH | 120 (97%) | ||
| Number with Epidural Hematoma | 13 (10%) | ||
| Admission Hemoglobin | 133.5 (115–146.75) | ||
| Admission Serum Glucose | 8.2 (7.1–11.1) | ||
| Length of Hospital Stay | 21 (8.5–42) | ||
| Length of ICU Stay | 8 (4–15) | ||
Appendix C
| Physiologic Metric | Median (IQR) |
|---|---|
| Duration of Physiologic Monitoring (hours) | 73.27 (37.17–130.3) |
| Mean MAP (mmHg) | 84.35 (79.72–88.66) |
| Mean ICP (mmHg) | 9.418 (5.806–12.7) |
| % Time ICP > 20 mmHg | 1.476 (0.07516–5.751) |
| Mean Hourly Dose of ICP > 20 mmHg | 2.958 (0.05611–12.25) |
| % Time ICP > 22 mmHg | 0.7846 (0–2.968) |
| Mean Hourly Dose of ICP > 22 mmHg | 1.636 (0–8.123) |
| Mean CPP (mmHg) | 73.93 (70.2–79.62) |
| % Time CPP < 60 mmHg | 4.031 (1.114–8.496) |
| % Time CPP > 70 mmHg | 64.06 (46.42–76.28) |
| Mean PRx | 0.1545 (0.03913–0.2809) |
| % Time PRx > 0 | 66.27 (52.7–81.71) |
| % Time PRx > 0.25 | 41.36 (27.82–57.17) |
| % Time PRx > 0.35 | 31.36 (19.48–46.01) |
| Mean PAx | 0.004365 (−0.1267–0.1265) |
| % Time PAx > 0 | 50.9 (34.85–66.36) |
| % Time PAx > 0.20 | 30.08 (15.91–45.56) |
| % Time PAx > 0.25 | 25.26 (12.43–40.13) |
| Mean RAC | −0.2301 (−0.3928–−0.03803) |
| % Time RAC > 0 | 24.47 (14–44.41) |
| iICP (PRx > 0) | 10.98 (5.94–18.31) |
| % Time ICP > iICP (PRx > 0) | 19.05 (3.106–74.89) |
| Mean Hourly Dose of ICP > iICP (PRx > 0) | 50.31 (6.53–230.5) |
| iICP (PRx > 0.25) | 15.26 (10.57–19.95) |
| % Time ICP > iICP (PRx > 0.25) | 3.411 (0.4349–23.99) |
| Mean Hourly Dose of ICP > iICP (PRx > 0.25) | 7.491 (1.065–63.18) |
| iICP (PRx > 0.35) | 17.23 (11.59–22.77) |
| % Time ICP > iICP (PRx > 0.35) | 1.175 (0.329–9.568) |
| Mean Hourly Dose of ICP > iICP (PRx > 0.35) | 2.764 (0.6038–24.97) |
| iICP (PAx > 0) | 12.82 (8.985–21.27) |
| % Time ICP > iICP (PAx > 0) | 3.537 (0.5514–65.18) |
| Mean Hourly Dose of ICP > iICP (PAx > 0) | 14.58 (0.8713–147.2) |
| iICP (PAx > 0.20) | 19.46 (13.58–32.49) |
| % Time ICP > iICP (PAx > 0.20) | 0.4343 (0.1083–4.008) |
| Mean Hourly Dose of ICP > iICP (PAx > 0.20) | 1.023 (0.2026–6.59) |
| iICP (PAx > 0.25) | 19.91 (14.79–35.46) |
| % Time ICP > iICP (PAx > 0.25) | 0.334 (0.1015–1.53) |
| Mean Hourly Dose of ICP > iICP (PAx > 0.25) | 0.74 (0.2006–4.963) |
| iICP (RAC > 0) | 18.7 (11.9–25.76) |
| % Time ICP > iICP (RAC > 0) | 0.6271 (0.1819–3.758) |
| Mean Hourly Dose of ICP > iICP (RAC > 0) | 1.067 (0.132–6.579) |
Appendix D
Appendix E
Appendix F
| Variable | Identified Median (IQR) | Not Identified Median (IQR) | p-Value |
|---|---|---|---|
| Age (years) | 36 (25–59) | 44 (34–54.5) | 0.136 |
| Sex (% Male) | 80.30% | 85.70% | 0.575 |
| Admission GCS Total | 7 (4–8) | 6 (4–8) | 0.653 |
| Admission GCS Motor | 4 (2–5) | 4 (2–5) | 0.197 |
| Admission GCS Eyes | 1 (1–2) | 1 (1–2) | 0.664 |
| Admission GCS Verbal | 1 (1–1) | 1 (1–2) | 0.454 |
| Admission Pupil Response (% Bilaterally Reactive) | 60.70% | 57.10% | 0.924 |
| Marshall CT Grade | 4 (3–5) | 5 (3–5) | 0.685 |
| Rotterdam CT Grade | 4 (4–5) | 5 (4–5.5) | 0.756 |
| Helsinki CT Score | 6 (4–9) | 6 (5–9) | 0.880 |
| Stockholm CT Score | 3.3 (2.5–4) | 3.2 (2.45–3.75) | 0.532 |
| GOSE (6 Months) | 5 (1–7) | 5 (1–7) | 0.841 |
| Number Alive (GOSE 2–8) at 6 Months | 66% | 57.90% | 0.495 |
| Number Dead (GOSE 1) at 6 Months | 34% | 42.10% | 0.495 |
| Number Favorable (GOSE 5–8) at 6 Months | 62.30% | 56.10% | 0.646 |
| Number Unfavorable (GOSE 1–4) at 6 Months | 37.70% | 43.90% | 0.646 |
| Number with Hypoxia Episode | 29.50% | 34.90% | 0.651 |
| Number with Hypotension Episode | 4.90% | 14.30% | 0.144 |
| Number with Traumatic SAH | 96.70% | 96.80% | 1.000 |
| Number with Epidural Hematoma | 9.80% | 11.10% | 1.000 |
| Admission Hemoglobin | 135 (116–148) | 133 (114–146) | 0.720 |
| Admission Serum Glucose | 8.15 (7.38–11.9) | 8.4 (6.9–11) | 0.465 |
| Length of Hospital Stay | 27 (10–46) | 20.5 (8–34.8) | 0.177 |
| Length of ICU Stay | 10.5 (5–18.8) | 7 (4–11) | 0.014 |
| Mean MAP (mmHg) | 82.6 (80–86.5) | 86 (79–90.5) | 0.210 |
| Mean ICP (mmHg) | 10.5 (6.11–13) | 8.55 (5.13–11.9) | 0.372 |
| Mean Hourly Dose of ICP > 20 mmHg | 4.18 (0.239–11.8) | 1.21 (0.015–14) | 0.320 |
| Mean Hourly Dose of ICP > 22 mmHg | 2.32 (0.0213–8) | 0.671 (0–7.68) | 0.375 |
| Mean CPP (mmHg) | 73.6 (71.1–76.6) | 75.1 (69.5–80.5) | 0.359 |
| % Time CPP < 60 mmHg | 5.08 (1.71–9.26) | 2.82 (0.48–7.31) | 0.108 |
| % Time CPP > 70 mmHg | 59.1 (47.5–73.4) | 68.4 (40.6–82.6) | 0.433 |
| Mean PRx | 0.0396 (−0.0607–0.138) | 0.272 (0.179–0.405) | <0.001 |
| % Time PRx > 0 | 53.2 (41.7–64.5) | 81.5 (68.9–88.4) | <0.001 |
| % Time PRx > 0.25 | 28.3 (20.9–39.4) | 57.1 (42.6–71.4) | <0.001 |
| % Time PRx > 0.35 | 19.5 (13.1–29.2) | 44.2 (31.9–61.4) | <0.001 |
| Mean PAx | −0.09 (−0.172–0.0342) | 0.0638 (−0.0418–0.241) | <0.001 |
| % Time PAx > 0 | 38.6 (29.7–55.6) | 59.2 (43.9–76.4) | <0.001 |
| % Time PAx > 0.20 | 21.2 (12.1–33.7) | 37 (23–58.3) | <0.001 |
| % Time PAx > 0.25 | 17.7 (9.68–28.5) | 30.6 (18.3–51.9) | <0.001 |
| Mean RAC | −0.376 (−0.47–−0.195) | −0.123 (−0.27–0.0155) | <0.001 |
| % Time RAC > 0 | 16.3 (8.21–29.1) | 35.7 (22.1–52.3) | <0.001 |
Appendix G
| Variable | Identified Median (IQR) | Not Identified Median (IQR) | p-Value |
|---|---|---|---|
| Age (years) | 42 (27–57) | 40.5 (28.2–52.8) | 0.651 |
| Sex (% Male) | 83.70% | 81.60% | 0.973 |
| Admission GCS Total | 6 (4–8) | 7 (4.25–9.75) | 0.213 |
| Admission GCS Motor | 4 (2–5) | 4 (2–5) | 0.471 |
| Admission GCS Eyes | 1 (1–2) | 1 (1–2) | 0.172 |
| Admission GCS Verbal | 1 (1–1) | 1 (1–2) | 0.004 |
| Admission Pupil Response (% Bilaterally Reactive) | 54.70% | 68.40% | 0.233 |
| Marshall CT Grade | 5 (3–5) | 4 (3–5) | 0.673 |
| Rotterdam CT Grade | 4.5 (4–6) | 4 (4–5) | 0.804 |
| Helsinki CT Score | 7 (5–9) | 5 (4–9) | 0.375 |
| Stockholm CT Score | 3.25 (2.58–3.98) | 3 (2.4–3.85) | 0.397 |
| GOSE (6 Months) | 5 (1–7) | 7 (1–7) | 0.177 |
| Number Alive (GOSE 2–8) at 6 Months | 58.90% | 67.60% | 0.499 |
| Number Dead (GOSE 1) at 6 Months | 41.10% | 32.40% | 0.499 |
| Number Favorable (GOSE 5–8) at 6 Months | 57.50% | 62.20% | 0.794 |
| Number Unfavorable (GOSE 1–4) at 6 Months | 42.50% | 37.80% | 0.794 |
| Number with Hypoxia Episode | 29.10% | 39.50% | 0.350 |
| Number with Hypotension Episode | 5.80% | 18.40% | 0.063 |
| Number with Traumatic SAH | 96.50% | 97.40% | 1.000 |
| Number with Epidural Hematoma | 10.50% | 10.50% | 1.000 |
| Admission Hemoglobin | 134 (116–147) | 133 (113–145) | 0.599 |
| Admission Serum Glucose | 8.3 (7.05–11.6) | 8.05 (7.12–9.8) | 0.384 |
| Length of Hospital Stay | 21 (10–42) | 21 (7.25–35.8) | 0.309 |
| Length of ICU Stay | 9 (4–15.2) | 7 (3.25–12.5) | 0.133 |
| Mean MAP (mmHg) | 84 (79.9–88.4) | 85.7 (79.7–89.6) | 0.680 |
| Mean ICP (mmHg) | 10.1 (6.27–12.4) | 8.03 (4.52–14.8) | 0.823 |
| Mean Hourly Dose of ICP > 20 mmHg | 2.78 (0.0431–10.8) | 3.11 (0.0817–43.3) | 0.567 |
| Mean Hourly Dose of ICP > 22 mmHg | 1.64 (0–7.55) | 1.56 (0.00381–32.7) | 0.636 |
| Mean CPP (mmHg) | 73.9 (71.1–79.3) | 74.1 (68.9–79.9) | 0.798 |
| % Time CPP < 60 mmHg | 3.96 (1.18–8.57) | 4.61 (0.523–8.41) | 0.933 |
| % Time CPP > 70 mmHg | 64.1 (46–76.7) | 64 (48–75.4) | 0.835 |
| Mean PRx | 0.149 (0.0381–0.224) | 0.228 (0.0491–0.416) | 0.026 |
| % Time PRx > 0 | 64.6 (52.5–71.7) | 78.2 (55.9–88.3) | 0.008 |
| % Time PRx > 0.25 | 39.7 (27.8–50.8) | 51.5 (28.3–73.6) | 0.020 |
| % Time PRx > 0.35 | 29.8 (19.1–41) | 37.1 (20–63.8) | 0.028 |
| Mean PAx | −0.0205 (−0.146–0.123) | 0.023 (−0.0966–0.149) | 0.160 |
| % Time PAx > 0 | 46.6 (33–65.1) | 53.1 (38.3–66.8) | 0.172 |
| % Time PAx > 0.20 | 29.7 (15.3–45.3) | 31.3 (21.9–48.3) | 0.213 |
| % Time PAx > 0.25 | 24.4 (11.8–39.7) | 26.8 (17.2–42.5) | 0.203 |
| Mean RAC | −0.26 (−0.417–−0.0831) | −0.199 (−0.319–0.00956) | 0.047 |
| % Time RAC > 0 | 22.7 (11.9–39.4) | 27.7 (19.1–50.4) | 0.060 |
Appendix H
| Variable | Identified Median (IQR) | Not Identified Median (IQR) | p-Value |
|---|---|---|---|
| Age (years) | 42 (26.2–57) | 41 (29.8–52.8) | 0.935 |
| Sex (% Male) | 86.70% | 73.50% | 0.141 |
| Admission GCS Total | 6 (4–8) | 7 (5–8.75) | 0.200 |
| Admission GCS Motor | 4 (2–5) | 4.5 (2.25–5) | 0.256 |
| Admission GCS Eyes | 1 (1–2) | 1 (1–2) | 0.343 |
| Admission GCS Verbal | 1 (1–1) | 1 (1–2) | 0.048 |
| Admission Pupil Response (% Bilaterally Reactive) | 55.60% | 67.60% | 0.014 |
| Marshall CT Grade | 5 (3–5) | 4.5 (3.25–5) | 0.816 |
| Rotterdam CT Grade | 4.5 (4–5.75) | 4 (4–5) | 0.961 |
| Helsinki CT Score | 6 (5–9) | 5.5 (4.25–9) | 0.998 |
| Stockholm CT Score | 3.25 (2.5–3.9) | 3 (2.4–3.85) | 0.494 |
| GOSE (6 Months) | 5 (1–7) | 6 (1–7) | 0.623 |
| Number Alive (GOSE 2–8) at 6 Months | 60.30% | 65.60% | 0.756 |
| Number Dead (GOSE 1) at 6 Months | 39.70% | 34.40% | 0.756 |
| Number Favorable (GOSE 5–8) at 6 Months | 59% | 59.40% | 1.000 |
| Number Unfavorable (GOSE 1–4) at 6 Months | 41% | 40.60% | 1.000 |
| Number with Hypoxia Episode | 28.90% | 41.20% | 0.276 |
| Number with Hypotension Episode | 8.90% | 11.80% | 0.886 |
| Number with Traumatic SAH | 96.70% | 97.10% | 1.000 |
| Number with Epidural Hematoma | 8.90% | 14.70% | 0.539 |
| Admission Hemoglobin | 134 (117–148) | 130 (111–142) | 0.161 |
| Admission Serum Glucose | 8.4 (7–11.4) | 8.05 (7.12–10) | 0.515 |
| Length of Hospital Stay | 21 (10–50.2) | 22 (7–32) | 0.137 |
| Length of ICU Stay | 9.5 (4–15.2) | 7 (3–9.75) | 0.030 |
| Mean MAP (mmHg) | 84 (79.2–88.4) | 85.6 (81–89.6) | 0.571 |
| Mean ICP (mmHg) | 9.79 (5.35–12.5) | 8.51 (6.24–14.5) | 0.460 |
| Mean Hourly Dose of ICP > 20 mmHg | 2.65 (0.0102–10.8) | 3.3 (0.35–32.7) | 0.271 |
| Mean Hourly Dose of ICP > 22 mmHg | 1.59 (0–7.55) | 1.94 (0.192–19.8) | 0.329 |
| Mean CPP (mmHg) | 74.2 (71.1–79.7) | 73.6 (68.5–78.4) | 0.282 |
| % Time CPP < 60 mmHg | 4.03 (1.13–7.94) | 4.24 (0.577–9.57) | 0.799 |
| % Time CPP > 70 mmHg | 64.7 (48.2–77.1) | 63 (36.8–73.4) | 0.381 |
| Mean PRx | 0.153 (0.0446–0.269) | 0.164 (0.00939–0.416) | 0.463 |
| % Time PRx > 0 | 65.3 (53.4–79.5) | 71.3 (51.8–88.3) | 0.216 |
| % Time PRx > 0.25 | 40.5 (28.7–56.4) | 42.2 (24.3–74.1) | 0.392 |
| % Time PRx > 0.35 | 31.8 (19.5–42.4) | 29.8 (18.1–63.8) | 0.534 |
| Mean PAx | −0.0205 (−0.146–0.123) | 0.0249 (−0.0729–0.269) | 0.099 |
| % Time PAx > 0 | 46.6 (33–65.3) | 53.2 (39.6–78.2) | 0.113 |
| % Time PAx > 0.20 | 30.1 (15.3–45.3) | 30.2 (21.9–61.4) | 0.204 |
| % Time PAx > 0.25 | 25.3 (11.8–39.7) | 25.2 (17.2–55.9) | 0.200 |
| Mean RAC | −0.241 (−0.38–−0.0612) | −0.209 (−0.402–0.0125) | 0.344 |
| % Time RAC > 0 | 24.1 (13.7–42.2) | 26.3 (14.9–54.3) | 0.386 |
Appendix I
| Variable | Identified Median (IQR) | Not Identified Median (IQR) | p-Value |
|---|---|---|---|
| Age (years) | 38 (25–50) | 51 (32.5–60) | 0.020 |
| Sex (% Male) | 83.10% | 83% | 1.000 |
| Admission GCS Total | 7 (4–8) | 6 (4–8) | 0.941 |
| Admission GCS Motor | 4 (2–5) | 4 (2–5) | 0.515 |
| Admission GCS Eyes | 1 (1–2) | 1 (1–2) | 0.459 |
| Admission GCS Verbal | 1 (1–1) | 1 (1–2) | 0.061 |
| Admission Pupil Response (% Bilaterally Reactive) | 62.30% | 53.20% | 0.098 |
| Marshall CT Grade | 4 (3–5) | 5 (3.5–5) | 0.443 |
| Rotterdam CT Grade | 4 (3–6) | 5 (4–5) | 0.522 |
| Helsinki CT Score | 6 (4–9) | 6 (5–9) | 0.646 |
| Stockholm CT Score | 3.2 (2.5–3.95) | 3.2 (2.5–3.75) | 0.928 |
| GOSE (6 Months) | 6 (1–7) | 4 (1–7) | 0.367 |
| Number Alive (GOSE 2–8) at 6 Months | 66.20% | 54.80% | 0.320 |
| Number Dead (GOSE 1) at 6 Months | 33.80% | 45.20% | 0.320 |
| Number Favorable (GOSE 5–8) at 6 Months | 64.70% | 50% | 0.185 |
| Number Unfavorable (GOSE 1–4) at 6 Months | 35.30% | 50% | 0.185 |
| Number with Hypoxia Episode | 29.90% | 36.20% | 0.596 |
| Number with Hypotension Episode | 6.50% | 14.90% | 0.222 |
| Number with Traumatic SAH | 96.10% | 97.90% | 0.987 |
| Number with Epidural Hematoma | 5.20% | 19.10% | 0.031 |
| Admission Hemoglobin | 134 (118–148) | 130 (113–145) | 0.417 |
| Admission Serum Glucose | 8.4 (7.05–11.6) | 7.95 (7.1–10.4) | 0.625 |
| Length of Hospital Stay | 22 (10–42) | 18.5 (7.25–38) | 0.283 |
| Length of ICU Stay | 8.5 (4–17) | 7.5 (4–13.8) | 0.305 |
| Mean MAP (mmHg) | 84.8 (80.4–89.4) | 82.7 (79–87) | 0.170 |
| Mean ICP (mmHg) | 10.9 (6.84–13.3) | 7.9 (3.9–10.6) | 0.016 |
| Mean Hourly Dose of ICP > 20 mmHg | 5.75 (0.0626–16.9) | 1.05 (0.0343–7.77) | 0.089 |
| Mean Hourly Dose of ICP > 22 mmHg | 3.1 (0.0105–9.22) | 0.389 (0–3.62) | 0.080 |
| Mean CPP (mmHg) | 74.6 (71.2–79.7) | 73.6 (69.4–78.4) | 0.369 |
| % Time CPP < 60 mmHg | 4.51 (1.13–9.26) | 3.19 (0.902–7.73) | 0.392 |
| % Time CPP > 70 mmHg | 64.2 (50.4–75.9) | 63.9 (39–76) | 0.564 |
| Mean PRx | 0.148 (0.0109–0.265) | 0.192 (0.12–0.383) | 0.016 |
| % Time PRx > 0 | 63 (51.7–79.2) | 70.1 (63.1–86.7) | 0.008 |
| % Time PRx > 0.25 | 39.4 (26.8–56.7) | 45.8 (34.4–70.5) | 0.018 |
| % Time PRx > 0.35 | 29.2 (18.3–42.3) | 35.2 (25.3–59.3) | 0.028 |
| Mean PAx | −0.0369 (−0.127–0.0638) | 0.116 (−0.107–0.28) | 0.003 |
| % Time PAx > 0 | 45.1 (33.7–59.2) | 64.9 (37.5–82.4) | 0.002 |
| % Time PAx > 0.20 | 24.2 (15.3–36.7) | 41.4 (19.4–63.8) | 0.003 |
| % Time PAx > 0.25 | 20.7 (12.4–30.8) | 35.1 (16.3–57.8) | 0.003 |
| Mean RAC | −0.288 (−0.437–−0.125) | −0.122 (−0.345–0.0413) | <0.001 |
| % Time RAC > 0 | 21.4 (11.4–34) | 36.1 (19.5–56) | <0.001 |
Appendix J
| Variable | Identified Median (IQR) | Not Identified Median (IQR) | p-Value |
|---|---|---|---|
| Age (years) | 42 (31–56.2) | 40.5 (24–57) | 0.562 |
| Sex (% Male) | 84.40% | 81.70% | 0.871 |
| Admission GCS Total | 6.5 (4–8) | 6.5 (4–8) | 0.946 |
| Admission GCS Motor | 4 (2–5) | 4 (2–5) | 0.733 |
| Admission GCS Eyes | 1 (1–2) | 1 (1–2) | 0.498 |
| Admission GCS Verbal | 1 (1–1) | 1 (1–1.25) | 0.826 |
| Admission Pupil Response (% Bilaterally Reactive) | 56.20% | 61.70% | 0.548 |
| Marshall CT Grade | 5 (3–5) | 4.5 (3–5) | 0.783 |
| Rotterdam CT Grade | 4.5 (3–5.25) | 4 (4–5.25) | 0.762 |
| Helsinki CT Score | 6.5 (4–9) | 6 (5–9) | 0.860 |
| Stockholm CT Score | 3.25 (2.88–3.83) | 3.2 (2.4–3.92) | 0.702 |
| GOSE (6 Months) | 5 (1–7) | 5 (1–7) | 0.771 |
| Number Alive (GOSE 2–8) at 6 Months | 63.20% | 60.40% | 0.918 |
| Number Dead (GOSE 1) at 6 Months | 36.80% | 39.60% | 0.918 |
| Number Favorable (GOSE 5–8) at 6 Months | 61.40% | 56.60% | 0.751 |
| Number Unfavorable (GOSE 1–4) at 6 Months | 38.60% | 43.40% | 0.751 |
| Number with Hypoxia Episode | 26.60% | 38.30% | 0.227 |
| Number with Hypotension Episode | 6.20% | 13.30% | 0.303 |
| Number with Traumatic SAH | 98.40% | 95% | 0.566 |
| Number with Epidural Hematoma | 9.40% | 11.70% | 0.902 |
| Admission Hemoglobin | 133 (122–146) | 134 (113–148) | 0.623 |
| Admission Serum Glucose | 8.4 (7.1–10.8) | 7.95 (7.07–11.1) | 0.719 |
| Length of Hospital Stay | 26 (11–42) | 15 (7–40) | 0.085 |
| Length of ICU Stay | 11 (5.5–17) | 7 (4–13) | 0.022 |
| Mean MAP (mmHg) | 84.6 (80.8–89.2) | 82.8 (79–87.5) | 0.206 |
| Mean ICP (mmHg) | 10.2 (6.95–13.1) | 8.39 (4.85–12.2) | 0.387 |
| Mean Hourly Dose of ICP > 20 mmHg | 5.21 (0.0561–12.3) | 2.43 (0.0514–12.9) | 0.517 |
| Mean Hourly Dose of ICP > 22 mmHg | 2.83 (0.00789–8.12) | 0.933 (0–6.9) | 0.424 |
| Mean CPP (mmHg) | 75 (71.2–79.6) | 73.3 (69.6–79.1) | 0.163 |
| % Time CPP < 60 mmHg | 4.03 (1.03–7.73) | 4.17 (1.43–10.1) | 0.812 |
| % Time CPP > 70 mmHg | 67.7 (52.1–78.2) | 62.1 (42.4–74.1) | 0.277 |
| Mean PRx | 0.153 (0.0316–0.272) | 0.158 (0.0633–0.291) | 0.620 |
| % Time PRx > 0 | 66 (52.3–80.1) | 67.4 (55.7–83.8) | 0.515 |
| % Time PRx > 0.25 | 40.1 (27.3–56.8) | 41.7 (28.8–58.9) | 0.532 |
| % Time PRx > 0.35 | 31.1 (18.9–44.5) | 31.6 (20.1–46.4) | 0.578 |
| Mean PAx | 0.0293 (−0.109–0.117) | −0.0202 (−0.128–0.162) | 0.942 |
| % Time PAx > 0 | 53.4 (35.3–63.1) | 47.8 (34.7–67.6) | 0.848 |
| % Time PAx > 0.20 | 32.4 (15.9–44.9) | 28.1 (15.9–47.1) | 0.998 |
| % Time PAx > 0.25 | 27 (12.4–39) | 23.5 (12.4–41.9) | 0.986 |
| Mean RAC | −0.23 (−0.409–−0.0751) | −0.23 (−0.379–−0.0237) | 0.496 |
| % Time RAC > 0 | 24.5 (12.5–40.4) | 23.8 (15.6–45.7) | 0.532 |
Appendix K
| Variable | Identified Median (IQR) | Not Identified Median (IQR) | p-Value |
|---|---|---|---|
| Age (years) | 42 (28–54.5) | 41.5 (25.5–57.2) | 0.990 |
| Sex (% Male) | 81.70% | 84.40% | 0.871 |
| Admission GCS Total | 6.5 (4–8) | 6.5 (4–8) | 0.758 |
| Admission GCS Motor | 4 (2–5) | 4 (2–5) | 0.657 |
| Admission GCS Eyes | 1 (1–2) | 1 (1–2) | 0.275 |
| Admission GCS Verbal | 1 (1–1) | 1 (1–2) | 0.246 |
| Admission Pupil Response (% Bilaterally Reactive) | 50% | 67.20% | 0.087 |
| Marshall CT Grade | 5 (3–5) | 4.5 (3–5) | 0.928 |
| Rotterdam CT Grade | 4.5 (4–5.25) | 4 (4–5.25) | 0.982 |
| Helsinki CT Score | 6 (4–9) | 6 (5–9) | 0.992 |
| Stockholm CT Score | 3.4 (2.9–3.91) | 3.05 (2.4–3.9) | 0.260 |
| GOSE (6 Months) | 6 (1–7) | 5 (1–7) | 0.445 |
| Number Alive (GOSE 2–8) at 6 Months | 65.40% | 58.60% | 0.594 |
| Number Dead (GOSE 1) at 6 Months | 34.60% | 41.40% | 0.594 |
| Number Favorable (GOSE 5–8) at 6 Months | 63.50% | 55.20% | 0.491 |
| Number Unfavorable (GOSE 1–4) at 6 Months | 36.50% | 44.80% | 0.491 |
| Number with Hypoxia Episode | 25% | 39.10% | 0.138 |
| Number with Hypotension Episode | 6.70% | 12.50% | 0.427 |
| Number with Traumatic SAH | 98.30% | 95.30% | 0.658 |
| Number with Epidural Hematoma | 10% | 10.90% | 1.000 |
| Admission Hemoglobin | 132 (119–146) | 136 (113–148) | 0.856 |
| Admission Serum Glucose | 8.2 (7–11.5) | 8.2 (7.1–11) | 0.815 |
| Length of Hospital Stay | 31 (10.2–53.8) | 15 (7–32) | 0.032 |
| Length of ICU Stay | 11 (6–16.5) | 7 (3.5–13.5) | 0.017 |
| Mean MAP (mmHg) | 84.5 (80.6–88.5) | 83.8 (79–89.5) | 0.677 |
| Mean ICP (mmHg) | 10.4 (6.59–13.1) | 8.23 (5.19–12.2) | 0.379 |
| Mean Hourly Dose of ICP > 20 mmHg | 5.79 (0.0561–13.8) | 2.43 (0.0514–10.8) | 0.338 |
| Mean Hourly Dose of ICP > 22 mmHg | 3.08 (0.00789–8.67) | 0.933 (0–5.86) | 0.274 |
| Mean CPP (mmHg) | 74.4 (71.2–77.9) | 73.5 (69.8–80.6) | 0.603 |
| % Time CPP < 60 mmHg | 4.36 (1.11–7.85) | 3.4 (1.09–9.66) | 0.755 |
| % Time CPP > 70 mmHg | 64.9 (51.4–74.6) | 63.9 (43.7–78.7) | 0.778 |
| Mean PRx | 0.152 (0.0316–0.277) | 0.164 (0.0567–0.281) | 0.729 |
| % Time PRx > 0 | 65.3 (52.7–80.1) | 68.6 (54.4–82.1) | 0.575 |
| % Time PRx > 0.25 | 39.7 (27.7–57.2) | 42.2 (28.4–57.3) | 0.648 |
| % Time PRx > 0.35 | 30.7 (18.9–45.6) | 31.7 (20–46.1) | 0.688 |
| Mean PAx | 0.0325 (−0.109–0.147) | −0.0352 (−0.127–0.106) | 0.481 |
| % Time PAx > 0 | 54.2 (34.5–67.7) | 45.5 (35–65.4) | 0.589 |
| % Time PAx > 0.20 | 33.8 (15.7–46.9) | 24.7 (16.3–43.1) | 0.444 |
| % Time PAx > 0.25 | 28.8 (12.4–42.7) | 21.3 (12.8–36.8) | 0.401 |
| Mean RAC | −0.205 (−0.439–−0.0487) | −0.248 (−0.379–−0.0327) | 0.927 |
| % Time RAC > 0 | 27.2 (13.3–43.8) | 22.2 (15.1–44.4) | 0.927 |
Appendix L
| Variable | Identified Median (IQR) | Not Identified Median (IQR) | p-Value |
|---|---|---|---|
| Age (years) | 43 (32–59) | 40 (25–53.5) | 0.093 |
| Sex (% Male) | 79.60% | 85.30% | 0.556 |
| Admission GCS Total | 7 (5–8.25) | 6 (4–8) | 0.035 |
| Admission GCS Motor | 4 (3–5) | 4 (2–5) | 0.079 |
| Admission GCS Eyes | 1 (1–2.25) | 1 (1–2) | 0.095 |
| Admission GCS Verbal | 1 (1–2) | 1 (1–1) | 0.257 |
| Admission Pupil Response (% Bilaterally Reactive) | 61.20% | 57.30% | 0.911 |
| Marshall CT Grade | 5 (4–5) | 4 (3–5) | 0.006 |
| Rotterdam CT Grade | 5 (4–6) | 4 (3–5) | <0.001 |
| Helsinki CT Score | 8 (5–9) | 5 (4–9) | 0.018 |
| Stockholm CT Score | 3.31 (2.5–3.95) | 3.2 (2.5–3.8) | 0.437 |
| GOSE (6 Months) | 5 (1–7) | 6 (1–7) | 0.371 |
| Number Alive (GOSE 2–8) at 6 Months | 53.30% | 67.70% | 0.185 |
| Number Dead (GOSE 1) at 6 Months | 46.70% | 32.30% | 0.185 |
| Number Favorable (GOSE 5–8) at 6 Months | 51.10% | 64.60% | 0.223 |
| Number Unfavorable (GOSE 1–4) at 6 Months | 48.90% | 35.40% | 0.223 |
| Number with Hypoxia Episode | 38.80% | 28% | 0.290 |
| Number with Hypotension Episode | 6.10% | 12% | 0.440 |
| Number with Traumatic SAH | 98% | 96% | 0.933 |
| Number with Epidural Hematoma | 10.20% | 10.70% | 1.000 |
| Admission Hemoglobin | 136 (122–150) | 133 (113–146) | 0.259 |
| Admission Serum Glucose | 8.3 (7.15–11) | 8.2 (7.1–11.2) | 0.915 |
| Length of Hospital Stay | 17 (8–42) | 23 (10–41) | 0.449 |
| Length of ICU Stay | 7 (4–13.8) | 9 (4–15) | 0.424 |
| Mean MAP (mmHg) | 81.3 (77.9–86.7) | 85.5 (81.6–90.5) | 0.018 |
| Mean ICP (mmHg) | 9.13 (5.01–12.4) | 10 (7.05–12.8) | 0.492 |
| Mean Hourly Dose of ICP > 20 mmHg | 1.21 (0–16.9) | 4.18 (0.205–10.9) | 0.367 |
| Mean Hourly Dose of ICP > 22 mmHg | 0.832 (0–7.25) | 2.19 (0.0183–8.25) | 0.356 |
| Mean CPP (mmHg) | 73.6 (69.1–76.7) | 74.6 (71.1–80.5) | 0.229 |
| % Time CPP < 60 mmHg | 4.73 (1.16–9.26) | 3.76 (0.787–7.65) | 0.421 |
| % Time CPP > 70 mmHg | 57.7 (41.3–74) | 67.5 (51–82.3) | 0.138 |
| Mean PRx | 0.184 (0.0641–0.289) | 0.154 (0.0122–0.272) | 0.268 |
| % Time PRx > 0 | 69.4 (57–81.6) | 63.9 (49.9–82.1) | 0.180 |
| % Time PRx > 0.25 | 43.6 (32.3–57.3) | 39.9 (23.1–56.2) | 0.202 |
| % Time PRx > 0.35 | 31.9 (25.1–46.3) | 29.3 (17.1–42.1) | 0.239 |
| Mean PAx | 0.0483 (−0.0875–0.151) | −0.0467 (−0.14–0.0809) | 0.045 |
| % Time PAx > 0 | 59.2 (41.5–67.3) | 43.4 (33–63.4) | 0.052 |
| % Time PAx > 0.20 | 36.5 (22.7–46.4) | 22.7 (14.1–38.4) | 0.021 |
| % Time PAx > 0.25 | 30.8 (17.1–42.3) | 18.9 (10.7–32.8) | 0.017 |
| Mean RAC | −0.124 (−0.279–0.00293) | −0.319 (−0.441–−0.124) | <0.001 |
| % Time RAC > 0 | 36.1 (23.8–50.7) | 19.6 (10.3–34.5) | <0.001 |
Appendix M
Appendix N
| Alive/Dead Outcome Groups | ||||
| Model | AUC (95% CI) | AIC | p-Value | Nagelkerke’s R2 |
| Mean Hourly Dose of ICP > 20 mmHg | 0.614 (0.508–0.716) | 138.3 | 0.0217 | 0.140 |
| Mean Hourly Dose of ICP > 22 mmHg | 0.623 (0.513–0.728) | 139.4 | 0.0146 | 0.128 |
| Mean Hourly Dose of ICP > iICP (PRx > 0) | 0.660 (0.508–0.813) | 68.6 | 0.0293 | 0.085 |
| Mean Hourly Dose of ICP > iICP.ci (PRx > 0) | 0.665 (0.485–0.829) | 60.3 | 0.0365 | 0.076 |
| Mean Hourly Dose of ICP > iICP.5-25 (PRx > 0) | 0.762 (0.574–0.917) | 44.3 | 0.0042 | 0.273 |
| Mean Hourly Dose of ICP > iICP (PRx > 0.25) | 0.530 (0.391–0.661) | 102.8 | 0.3339 | 0.002 |
| Mean Hourly Dose of ICP > iICP.ci (PRx > 0.25) | 0.524 (0.370–0.684) | 79.3 | 0.3842 | 0.002 |
| Mean Hourly Dose of ICP > iICP.5-25 (PRx > 0.25) | 0.541 (0.317–0.617) | 79.1 | 0.3049 | 0.023 |
| Mean Hourly Dose of ICP > iICP (PRx > 0.35) | 0.503 (0.364–0.631) | 108.7 | 0.4838 | 0.002 |
| Mean Hourly Dose of ICP > iICP.ci (PRx > 0.35) | 0.533 (0.375–0.691) | 76.5 | 0.3444 | 0.001 |
| Mean Hourly Dose of ICP > iICP.5-25 (PRx > 0.35) | 0.510 (0.328–0.646) | 81.1 | 0.4514 | 0.006 |
| Mean Hourly Dose of ICP > iICP (PAx > 0) | 0.533 (0.373–0.677) | 89.2 | 0.3309 | 0.036 |
| Mean Hourly Dose of ICP > iICP.ci (PAx > 0) | 0.537 (0.274–0.649) | 65.6 | 0.3441 | 0.030 |
| Mean Hourly Dose of ICP > iICP.5-25 (PAx > 0) | 0.552 (0.281–0.625) | 69.2 | 0.2756 | 0.028 |
| Mean Hourly Dose of ICP > iICP (PAx > 0.20) | 0.481 (0.320–0.646) | 77.4 | 0.5940 | 0.039 |
| Mean Hourly Dose of ICP > iICP.ci (PAx > 0.20) | 0.496 (0.278–0.718) | 46.6 | 0.5220 | 0.027 |
| Mean Hourly Dose of ICP > iICP.5-25 (PAx > 0.20) | 0.473 (0.311–0.742) | 46.5 | 0.6073 | 0.068 |
| Mean Hourly Dose of ICP > iICP (PAx > 0.25) | 0.624 (0.457–0.783) | 66.2 | 0.0738 | 0.123 |
| Mean Hourly Dose of ICP > iICP.ci (PAx > 0.25) | 0.621 (0.379–0.856) | 34.2 | 0.1694 | 0.166 |
| Mean Hourly Dose of ICP > iICP.5-25 (PAx > 0.25) | 0.561 (0.300–0.783) | 37.5 | 0.3103 | 0.141 |
| Mean Hourly Dose of ICP > iICP (RAC > 0) | 0.554 (0.373–0.726) | 63.7 | 0.2751 | 0.071 |
| Mean Hourly Dose of ICP > iICP.ci (RAC > 0) | 0.508 (0.280–0.758) | 35.3 | 0.4880 | 0.033 |
| Mean Hourly Dose of ICP > iICP.5-25 (RAC > 0) | 0.665 (0.451–0.848) | 43.3 | 0.0653 | 0.093 |
| Favorable/Unfavorable Outcome Groups | ||||
| Model | AUC (95% CI) | AIC | p-Value | Nagelkerke’s R2 |
| Mean Hourly Dose of ICP > 20 mmHg | 0.610 (0.500–0.719) | 142.3 | 0.0246 | 0.123 |
| Mean Hourly Dose of ICP > 22 mmHg | 0.605 (0.490–0.711) | 143.4 | 0.0291 | 0.111 |
| Mean Hourly Dose of ICP > iICP (PRx > 0) | 0.661 (0.492–0.808) | 68.8 | 0.0262 | 0.134 |
| Mean Hourly Dose of ICP > iICP.ci (PRx > 0) | 0.663 (0.478–0.829) | 60.8 | 0.0337 | 0.131 |
| Mean Hourly Dose of ICP > iICP.5-25 (PRx > 0) | 0.707 (0.499–0.880) | 47.4 | 0.0182 | 0.224 |
| Mean Hourly Dose of ICP > iICP (PRx > 0.25) | 0.512 (0.353–0.628) | 103.5 | 0.4361 | 0.001 |
| Mean Hourly Dose of ICP > iICP.ci (PRx > 0.25) | 0.557 (0.405–0.707) | 79.6 | 0.2378 | 0.005 |
| Mean Hourly Dose of ICP > iICP.5-25 (PRx > 0.25) | 0.517 (0.333–0.634) | 79.5 | 0.4173 | 0.017 |
| Mean Hourly Dose of ICP > iICP (PRx > 0.35) | 0.486 (0.384–0.642) | 109.5 | 0.5859 | 0.001 |
| Mean Hourly Dose of ICP > iICP.ci (PRx > 0.35) | 0.569 (0.399–0.728) | 76.9 | 0.1996 | 0.004 |
| Mean Hourly Dose of ICP > iICP.5-25 (PRx > 0.35) | 0.510 (0.338–0.636) | 81.1 | 0.4514 | 0.006 |
| Mean Hourly Dose of ICP > iICP (PAx > 0) | 0.506 (0.351–0.665) | 90.9 | 0.4721 | 0.027 |
| Mean Hourly Dose of ICP > iICP.ci (PAx > 0) | 0.492 (0.330–0.686) | 67.4 | 0.5404 | 0.018 |
| Mean Hourly Dose of ICP > iICP.5-25 (PAx > 0) | 0.552 (0.273–0.620) | 69.2 | 0.2756 | 0.028 |
| Mean Hourly Dose of ICP > iICP (PAx > 0.20) | 0.452 (0.384–0.719) | 78.7 | 0.7291 | 0.032 |
| Mean Hourly Dose of ICP > iICP.ci (PAx > 0.20) | 0.496 (0.274–0.710) | 46.6 | 0.5220 | 0.027 |
| Mean Hourly Dose of ICP > iICP.5-25 (PAx > 0.20) | 0.473 (0.308–0.731) | 46.5 | 0.6073 | 0.068 |
| Mean Hourly Dose of ICP > iICP (PAx > 0.25) | 0.584 (0.403–0.748) | 67.9 | 0.1631 | 0.109 |
| Mean Hourly Dose of ICP > iICP.ci (PAx > 0.25) | 0.621 (0.353–0.856) | 34.2 | 0.1694 | 0.166 |
| Mean Hourly Dose of ICP > iICP.5-25 (PAx > 0.25) | 0.561 (0.306–0.800) | 37.5 | 0.3103 | 0.141 |
| Mean Hourly Dose of ICP > iICP (RAC > 0) | 0.516 (0.338–0.694) | 64.2 | 0.4331 | 0.062 |
| Mean Hourly Dose of ICP > iICP.ci (RAC > 0) | 0.508 (0.258–0.750) | 35.3 | 0.4880 | 0.033 |
| Mean Hourly Dose of ICP > iICP.5-25 (RAC > 0) | 0.665 (0.464–0.853) | 43.3 | 0.0653 | 0.093 |
Appendix O
| Alive/Dead Outcome Groups | |||||
| Model | AUC (95% CI) | AIC | p-Value | Nagelkerke’s R2 | Δ Nagelkerke’s R2 |
| IMPACT Core | 0.793 (0.698–0.879) | 124.2 | <0.0001 | 0.344 | - |
| + Mean Hourly Dose of ICP > 20 mmHg | 0.855 (0.773–0.926) | 107.9 | <0.0001 | 0.500 | 0.156 |
| + Mean Hourly Dose of ICP > 22 mmHg | 0.852 (0.768–0.925) | 109.5 | <0.0001 | 0.487 | 0.143 |
| + Mean Hourly Dose of ICP > iICP (PRx > 0) | 0.914 (0.817–0.984) | 49.3 | <0.0001 | 0.607 | 0.263 |
| + Mean Hourly Dose of ICP > iICP.ci (PRx > 0) | 0.898 (0.783–0.981) | 46.5 | <0.0001 | 0.566 | 0.222 |
| + Mean Hourly Dose of ICP > iICP.5-25 (PRx > 0) | 0.988 (0.946–1.000) | 22.3 | <0.0001 | 0.878 | 0.534 |
| + Mean Hourly Dose of ICP > iICP (PRx > 0.25) | 0.801 (0.684–0.904) | 88.3 | <0.0001 | 0.358 | 0.014 |
| + Mean Hourly Dose of ICP > iICP.ci (PRx > 0.25) | 0.762 (0.617–0.894) | 74.4 | 0.0004 | 0.282 | −0.062 |
| + Mean Hourly Dose of ICP > iICP.5-25 (PRx > 0.25) | 0.869 (0.771–0.951) | 60.0 | <0.0001 | 0.534 | 0.190 |
| + Mean Hourly Dose of ICP > iICP (PRx > 0.35) | 0.788 (0.672–0.883) | 93.8 | <0.0001 | 0.346 | 0.002 |
| + Mean Hourly Dose of ICP > iICP.ci (PRx > 0.35) | 0.781 (0.635–0.909) | 70.5 | 0.0002 | 0.313 | −0.031 |
| + Mean Hourly Dose of ICP > iICP.5-25 (PRx > 0.35) | 0.828 (0.705–0.931) | 67.4 | <0.0001 | 0.432 | 0.088 |
| + Mean Hourly Dose of ICP > iICP (PAx > 0) | 0.708 (0.570–0.827) | 86.3 | 0.0024 | 0.237 | −0.107 |
| + Mean Hourly Dose of ICP > iICP.ci (PAx > 0) | 0.673 (0.504–0.824) | 68.4 | 0.0256 | 0.166 | −0.178 |
| + Mean Hourly Dose of ICP > iICP.5-25 (PAx > 0) | 0.763 (0.635–0.884) | 68.7 | 0.0008 | 0.233 | −0.111 |
| + Mean Hourly Dose of ICP > iICP (PAx > 0.20) | 0.698 (0.545–0.827) | 77.2 | 0.0063 | 0.217 | −0.127 |
| + Mean Hourly Dose of ICP > iICP.ci (PAx > 0.20) | 0.746 (0.544–0.909) | 49.7 | 0.0099 | 0.211 | −0.133 |
| + Mean Hourly Dose of ICP > iICP.5-25 (PAx > 0.20) | 0.712 (0.523–0.869) | 50.8 | 0.0217 | 0.205 | −0.139 |
| + Mean Hourly Dose of ICP > iICP (PAx > 0.25) | 0.742 (0.585–0.869) | 66.8 | 0.0019 | 0.290 | −0.054 |
| + Mean Hourly Dose of ICP > iICP.ci (PAx > 0.25) | 0.712 (0.490–0.895) | 40.4 | 0.0423 | 0.245 | −0.099 |
| + Mean Hourly Dose of ICP > iICP.5-25 (PAx > 0.25) | 0.711 (0.494–0.894) | 42.1 | 0.0359 | 0.280 | −0.064 |
| + Mean Hourly Dose of ICP > iICP (RAC > 0) | 0.756 (0.601–0.893) | 64.5 | 0.0014 | 0.259 | −0.085 |
| + Mean Hourly Dose of ICP > iICP.ci (RAC > 0) | 0.674 (0.424–0.879) | 41.2 | 0.0847 | 0.142 | −0.202 |
| + Mean Hourly Dose of ICP > iICP.5-25 (RAC > 0) | 0.750 (0.558–0.915) | 47.3 | 0.0097 | 0.249 | −0.095 |
| Favorable/Unfavorable Outcome Groups | |||||
| Model | AUC (95% CI) | AIC | p-Value | Nagelkerke’s R2 | Δ Nagelkerke’s R2 |
| IMPACT Core | 0.753 (0.653–0.845) | 135.1 | <0.0001 | 0.262 | - |
| + Mean Hourly Dose of ICP > 20 mmHg | 0.801 (0.706–0.884) | 123.1 | <0.0001 | 0.392 | 0.130 |
| + Mean Hourly Dose of ICP > 22 mmHg | 0.799 (0.701–0.889) | 124.7 | <0.0001 | 0.378 | 0.116 |
| + Mean Hourly Dose of ICP > iICP (PRx > 0) | 0.871 (0.752–0.965) | 56.6 | <0.0001 | 0.523 | 0.261 |
| + Mean Hourly Dose of ICP > iICP.ci (PRx > 0) | 0.857 (0.722–0.959) | 52.9 | <0.0001 | 0.486 | 0.224 |
| + Mean Hourly Dose of ICP > iICP.5-25 (PRx > 0) | 0.903 (0.746–1.000) | 39.1 | <0.0001 | 0.616 | 0.354 |
| + Mean Hourly Dose of ICP > iICP (PRx > 0.25) | 0.780 (0.662–0.889) | 91.3 | <0.0001 | 0.325 | 0.063 |
| + Mean Hourly Dose of ICP > iICP.ci (PRx > 0.25) | 0.755 (0.613–0.883) | 76.4 | 0.0005 | 0.251 | −0.011 |
| + Mean Hourly Dose of ICP > iICP.5-25 (PRx > 0.25) | 0.848 (0.735–0.940) | 63.2 | <0.0001 | 0.488 | 0.226 |
| + Mean Hourly Dose of ICP > iICP (PRx > 0.35) | 0.770 (0.647–0.872) | 96.7 | <0.0001 | 0.317 | 0.055 |
| + Mean Hourly Dose of ICP > iICP.ci (PRx > 0.35) | 0.779 (0.638–0.901) | 70.1 | 0.0002 | 0.328 | 0.066 |
| + Mean Hourly Dose of ICP > iICP.5-25 (PRx > 0.35) | 0.828 (0.703–0.935) | 67.4 | <0.0001 | 0.432 | 0.170 |
| + Mean Hourly Dose of ICP > iICP (PAx > 0) | 0.705 (0.565–0.824) | 89.1 | 0.0024 | 0.208 | −0.054 |
| + Mean Hourly Dose of ICP > iICP.ci (PAx > 0) | 0.693 (0.519–0.838) | 70.0 | 0.0130 | 0.160 | −0.102 |
| + Mean Hourly Dose of ICP > iICP.5-25 (PAx > 0) | 0.763 (0.633–0.880) | 68.7 | 0.0008 | 0.233 | −0.029 |
| + Mean Hourly Dose of ICP > iICP (PAx > 0.20) | 0.684 (0.542–0.814) | 80.0 | 0.0097 | 0.179 | −0.083 |
| + Mean Hourly Dose of ICP > iICP.ci (PAx > 0.20) | 0.746 (0.556–0.909) | 49.7 | 0.0099 | 0.211 | −0.051 |
| + Mean Hourly Dose of ICP > iICP.5-25 (PAx > 0.20) | 0.712 (0.527–0.877) | 50.8 | 0.0217 | 0.205 | −0.057 |
| + Mean Hourly Dose of ICP > iICP (PAx > 0.25) | 0.726 (0.574–0.858) | 69.8 | 0.0033 | 0.250 | −0.012 |
| + Mean Hourly Dose of ICP > iICP.ci (PAx > 0.25) | 0.712 (0.490–0.895) | 40.4 | 0.0423 | 0.245 | −0.017 |
| + Mean Hourly Dose of ICP > iICP.5-25 (PAx > 0.25) | 0.711 (0.489–0.894) | 42.1 | 0.0359 | 0.280 | 0.018 |
| + Mean Hourly Dose of ICP > iICP (RAC > 0) | 0.739 (0.575–0.874) | 65.4 | 0.0027 | 0.241 | −0.021 |
| + Mean Hourly Dose of ICP > iICP.ci (RAC > 0) | 0.674 (0.417–0.879) | 41.2 | 0.0847 | 0.142 | −0.120 |
| + Mean Hourly Dose of ICP > iICP.5-25 (RAC > 0) | 0.750 (0.558–0.911) | 47.3 | 0.0097 | 0.249 | −0.013 |
References
- Maas, A.I.R.; Menon, D.K.; Adelson, P.D.; Andelic, N.; Bell, M.J.; Belli, A.; Bragge, P.; Brazinova, A.; Büki, A.; Chesnut, R.M.; et al. Traumatic Brain Injury: Integrated Approaches to Improve Prevention, Clinical Care, and Research. Lancet Neurol. 2017, 16, 987–1048. [Google Scholar] [CrossRef] [PubMed]
- Toth, P.; Szarka, N.; Farkas, E.; Ezer, E.; Czeiter, E.; Amrein, K.; Ungvari, Z.; Hartings, J.A.; Buki, A.; Koller, A. Traumatic Brain Injury-Induced Autoregulatory Dysfunction and Spreading Depression-Related Neurovascular Uncoupling: Pathomechanisms, Perspectives, and Therapeutic Implications. Am. J. Physiol.-Heart Circ. Physiol. 2016, 311, H1118–H1131. [Google Scholar] [CrossRef] [PubMed]
- Carney, N.; Totten, A.M.; O’Reilly, C.; Ullman, J.S.; Hawryluk, G.W.J.; Bell, M.J.; Bratton, S.L.; Chesnut, R.; Harris, O.A.; Kissoon, N.; et al. Guidelines for the Management of Severe Traumatic Brain Injury, Fourth Edition. Neurosurgery 2017, 80, 6–15. [Google Scholar] [CrossRef] [PubMed]
- Hawryluk, G.W.J.; Aguilera, S.; Buki, A.; Bulger, E.; Citerio, G.; Cooper, D.J.; Arrastia, R.D.; Diringer, M.; Figaji, A.; Gao, G.; et al. A Management Algorithm for Patients with Intracranial Pressure Monitoring: The Seattle International Severe Traumatic Brain Injury Consensus Conference (SIBICC). Intensive Care Med. 2019, 45, 1783–1794. [Google Scholar] [CrossRef]
- Donnelly, J.; Czosnyka, M.; Adams, H.; Cardim, D.; Kolias, A.G.; Zeiler, F.A.; Lavinio, A.; Aries, M.; Robba, C.; Smielewski, P.; et al. Twenty-Five Years of Intracranial Pressure Monitoring After Severe Traumatic Brain Injury: A Retrospective, Single-Center Analysis. Neurosurgery 2019, 85, E75–E82. [Google Scholar] [CrossRef]
- Steyerberg, E.W.; Wiegers, E.; Sewalt, C.; Buki, A.; Citerio, G.; De Keyser, V.; Ercole, A.; Kunzmann, K.; Lanyon, L.; Lecky, F.; et al. Case-Mix, Care Pathways, and Outcomes in Patients with Traumatic Brain Injury in CENTER-TBI: A European Prospective, Multicentre, Longitudinal, Cohort Study. Lancet Neurol. 2019, 18, 923–934. [Google Scholar] [CrossRef]
- Depreitere, B.; Citerio, G.; Smith, M.; Adelson, P.D.; Aries, M.J.; Bleck, T.P.; Bouzat, P.; Chesnut, R.; De Sloovere, V.; Diringer, M.; et al. Cerebrovascular Autoregulation Monitoring in the Management of Adult Severe Traumatic Brain Injury: A Delphi Consensus of Clinicians. Neurocrit. Care 2021, 34, 731–738. [Google Scholar] [CrossRef]
- Le Roux, P.; Menon, D.K.; Citerio, G.; Vespa, P.; Bader, M.K.; Brophy, G.M.; Diringer, M.N.; Stocchetti, N.; Videtta, W.; Armonda, R.; et al. Consensus Summary Statement of the International Multidisciplinary Consensus Conference on Multimodality Monitoring in Neurocritical Care: A Statement for Healthcare Professionals from the Neurocritical Care Society and the European Society of Intensive Care Medicine. Intensive Care Med. 2014, 40, 1189–1209. [Google Scholar] [CrossRef]
- Okonkwo, D.O.; Shutter, L.A.; Moore, C.; Temkin, N.R.; Puccio, A.M.; Madden, C.J.; Andaluz, N.; Chesnut, R.M.; Bullock, M.R.; Grant, G.A.; et al. Brain Oxygen Optimization in Severe Traumatic Brain Injury Phase-II: A Phase II Randomized Trial. Crit. Care Med. 2017, 45, 1907–1914. [Google Scholar] [CrossRef]
- Stocchetti, N.; Carbonara, M.; Citerio, G.; Ercole, A.; Skrifvars, M.B.; Smielewski, P.; Zoerle, T.; Menon, D.K. Severe Traumatic Brain Injury: Targeted Management in the Intensive Care Unit. Lancet Neurol. 2017, 16, 452–464. [Google Scholar] [CrossRef]
- Czosnyka, M.; Balestreri, M.; Steiner, L.; Smielewski, P.; Hutchinson, P.J.; Matta, B.; Pickard, J.D. Age, Intracranial Pressure, Autoregulation, and Outcome after Brain Trauma. J. Neurosurg. 2005, 102, 450–454. [Google Scholar] [CrossRef] [PubMed]
- Czosnyka, M.; Radolovich, D.; Balestreri, M.; Lavinio, A.; Hutchinson, P.; Timofeev, I.; Smielewski, P.; Pickard, J.D. Gender-Related Differences in Intracranial Hypertension and Outcome after Traumatic Brain Injury. Acta Neurochir. Suppl. 2008, 102, 25–28. [Google Scholar] [CrossRef] [PubMed]
- Zhou, W.; Xu, D.; Peng, X.; Zhang, Q.; Jia, J.; Crutcher, K.A. Meta-Analysis of APOE4 Allele and Outcome after Traumatic Brain Injury. J. Neurotrauma 2008, 25, 279–290. [Google Scholar] [CrossRef] [PubMed]
- Åkerlund, C.A.I.; Holst, A.; Stocchetti, N.; Steyerberg, E.W.; Menon, D.K.; Ercole, A.; Nelson, D.W. CENTER-TBI Participants and Investigators Clustering Identifies Endotypes of Traumatic Brain Injury in an Intensive Care Cohort: A CENTER-TBI Study. Crit. Care 2022, 26, 228. [Google Scholar] [CrossRef]
- Froese, L.; Batson, C.; Gomez, A.; Dian, J.; Zeiler, F.A. The Limited Impact of Current Therapeutic Interventions on Cerebrovascular Reactivity in Traumatic Brain Injury: A Narrative Overview. Neurocrit. Care 2021, 34, 325–335. [Google Scholar] [CrossRef]
- Tang, S.-C.; Lin, R.-J.; Shieh, J.-S.; Wu, A.-Y.; Lai, D.-M.; Huang, S.-J.; Jeng, J.-S. Effect of Mannitol on Cerebrovascular Pressure Reactivity in Patients with Intracranial Hypertension. J. Formos. Med. Assoc. 2015, 114, 842–848. [Google Scholar] [CrossRef]
- Dias, C.; Silva, M.J.; Pereira, E.; Silva, S.; Cerejo, A.; Smielewski, P.; Rocha, A.P.; Gaio, A.R.; Paiva, J.-A.; Czosnyka, M. Post-Traumatic Multimodal Brain Monitoring: Response to Hypertonic Saline. J. Neurotrauma 2014, 31, 1872–1880. [Google Scholar] [CrossRef]
- Timofeev, I.; Czosnyka, M.; Nortje, J.; Smielewski, P.; Kirkpatrick, P.; Gupta, A.; Hutchinson, P. Effect of Decompressive Craniectomy on Intracranial Pressure and Cerebrospinal Compensation Following Traumatic Brain Injury. J. Neurosurg. 2008, 108, 66–73. [Google Scholar] [CrossRef]
- Wettervik, T.S.; Howells, T.; Hillered, L.; Nilsson, P.; Engquist, H.; Lewén, A.; Enblad, P.; Rostami, E. Mild Hyperventilation in Traumatic Brain Injury-Relation to Cerebral Energy Metabolism, Pressure Autoregulation, and Clinical Outcome. World Neurosurg. 2020, 133, e567–e575. [Google Scholar] [CrossRef]
- Steiner, L.A.; Czosnyka, M.; Piechnik, S.K.; Smielewski, P.; Chatfield, D.; Menon, D.K.; Pickard, J.D. Continuous Monitoring of Cerebrovascular Pressure Reactivity Allows Determination of Optimal Cerebral Perfusion Pressure in Patients with Traumatic Brain Injury. Crit. Care Med. 2002, 30, 733–738. [Google Scholar] [CrossRef]
- Aries, M.J.H.; Czosnyka, M.; Budohoski, K.P.; Steiner, L.A.; Lavinio, A.; Kolias, A.G.; Hutchinson, P.J.; Brady, K.M.; Menon, D.K.; Pickard, J.D.; et al. Continuous Determination of Optimal Cerebral Perfusion Pressure in Traumatic Brain Injury. Crit. Care Med. 2012, 40, 2456–2463. [Google Scholar] [CrossRef] [PubMed]
- Lazaridis, C.; DeSantis, S.M.; Smielewski, P.; Menon, D.K.; Hutchinson, P.; Pickard, J.D.; Czosnyka, M. Patient-Specific Thresholds of Intracranial Pressure in Severe Traumatic Brain Injury. J. Neurosurg. 2014, 120, 893–900. [Google Scholar] [CrossRef] [PubMed]
- Zeiler, F.A.; Ercole, A.; Cabeleira, M.; Beqiri, E.; Zoerle, T.; Carbonara, M.; Stocchetti, N.; Menon, D.K.; Lazaridis, C.; Smielewski, P.; et al. Patient-Specific ICP Epidemiologic Thresholds in Adult Traumatic Brain Injury: A CENTER-TBI Validation Study. J. Neurosurg. Anesthesiol. 2021, 33, 28–38. [Google Scholar] [CrossRef] [PubMed]
- Depreitere, B.; Güiza, F.; Van den Berghe, G.; Schuhmann, M.U.; Maier, G.; Piper, I.; Meyfroidt, G. Pressure Autoregulation Monitoring and Cerebral Perfusion Pressure Target Recommendation in Patients with Severe Traumatic Brain Injury Based on Minute-by-Minute Monitoring Data. J. Neurosurg. 2014, 120, 1451–1457. [Google Scholar] [CrossRef]
- Liu, X.; Maurits, N.M.; Aries, M.J.H.; Czosnyka, M.; Ercole, A.; Donnelly, J.; Cardim, D.; Kim, D.-J.; Dias, C.; Cabeleira, M.; et al. Monitoring of Optimal Cerebral Perfusion Pressure in Traumatic Brain Injured Patients Using a Multi-Window Weighting Algorithm. J. Neurotrauma 2017, 34, 3081–3088. [Google Scholar] [CrossRef]
- Beqiri, E.; Ercole, A.; Aries, M.J.; Cabeleira, M.; Czigler, A.; Liberti, A.; Tas, J.; Donnelly, J.; Liu, X.; Fedriga, M.; et al. Optimal Cerebral Perfusion Pressure Assessed with a Multi-Window Weighted Approach Adapted for Prospective Use: A Validation Study. Acta Neurochir. Suppl. 2021, 131, 181–185. [Google Scholar] [CrossRef]
- Aries, M.J.H.; Czosnyka, M.; Budohoski, K.P.; Kolias, A.G.; Radolovich, D.K.; Lavinio, A.; Pickard, J.D.; Smielewski, P. Continuous Monitoring of Cerebrovascular Reactivity Using Pulse Waveform of Intracranial Pressure. Neurocrit. Care 2012, 17, 67–76. [Google Scholar] [CrossRef]
- Zeiler, F.A.; Ercole, A.; Cabeleira, M.; Zoerle, T.; Stocchetti, N.; Menon, D.K.; Smielewski, P.; Czosnyka, M. Univariate Comparison of Performance of Different Cerebrovascular Reactivity Indices for Outcome Association in Adult TBI: A CENTER-TBI Study. Acta Neurochir. 2019, 161, 1217–1227. [Google Scholar] [CrossRef]
- Gomez, A.; Dian, J.; Froese, L.; Zeiler, F.A. Near-Infrared Cerebrovascular Reactivity for Monitoring Cerebral Autoregulation and Predicting Outcomes in Moderate to Severe Traumatic Brain Injury: Proposal for a Pilot Observational Study. JMIR Res. Protoc. 2020, 9, e18740. [Google Scholar] [CrossRef]
- Chesnut, R.; Videtta, W.; Vespa, P.; Le Roux, P. Participants in the International Multidisciplinary Consensus Conference on Multimodality Monitoring Intracranial Pressure Monitoring: Fundamental Considerations and Rationale for Monitoring. Neurocrit. Care 2014, 21 (Suppl. S2), S64–S84. [Google Scholar] [CrossRef]
- Thomas, E.; NACCS; Czosnyka, M.; Hutchinson, P. SBNS Calculation of Cerebral Perfusion Pressure in the Management of Traumatic Brain Injury: Joint Position Statement by the Councils of the Neuroanaesthesia and Critical Care Society of Great Britain and Ireland (NACCS) and the Society of British Neurological Surgeons (SBNS). Br. J. Anaesth. 2015, 115, 487–488. [Google Scholar] [CrossRef] [PubMed]
- Jennett, B. Assessment of Outcome After Severe Brain Injury. Lancet 1975, 305, 480–484. [Google Scholar] [CrossRef] [PubMed]
- Fraser, C.D.; Brady, K.M.; Rhee, C.J.; Easley, R.B.; Kibler, K.; Smielewski, P.; Czosnyka, M.; Kaczka, D.W.; Andropoulos, D.B.; Rusin, C. The Frequency Response of Cerebral Autoregulation. J. Appl. Physiol. 2013, 115, 52–56. [Google Scholar] [CrossRef] [PubMed]
- Howells, T.; Johnson, U.; McKelvey, T.; Enblad, P. An Optimal Frequency Range for Assessing the Pressure Reactivity Index in Patients with Traumatic Brain Injury. J. Clin. Monit. Comput. 2015, 29, 97–105. [Google Scholar] [CrossRef]
- Czosnyka, M.; Smielewski, P.; Kirkpatrick, P.; Laing, R.J.; Menon, D.; Pickard, J.D. Continuous Assessment of the Cerebral Vasomotor Reactivity in Head Injury. Neurosurgery 1997, 41, 11–17; discussion 17–19. [Google Scholar] [CrossRef]
- Thelin, E.P.; Raj, R.; Bellander, B.-M.; Nelson, D.; Piippo-Karjalainen, A.; Siironen, J.; Tanskanen, P.; Hawryluk, G.; Hasen, M.; Unger, B.; et al. Comparison of High versus Low Frequency Cerebral Physiology for Cerebrovascular Reactivity Assessment in Traumatic Brain Injury: A Multi-Center Pilot Study. J. Clin. Monit. Comput. 2020, 34, 971–994. [Google Scholar] [CrossRef]
- Zeiler, F.A.; Donnelly, J.; Menon, D.K.; Smielewski, P.; Hutchinson, P.J.A.; Czosnyka, M. A Description of a New Continuous Physiological Index in Traumatic Brain Injury Using the Correlation between Pulse Amplitude of Intracranial Pressure and Cerebral Perfusion Pressure. J. Neurotrauma 2018, 35, 963–974. [Google Scholar] [CrossRef]
- Sorrentino, E.; Diedler, J.; Kasprowicz, M.; Budohoski, K.P.; Haubrich, C.; Smielewski, P.; Outtrim, J.G.; Manktelow, A.; Hutchinson, P.J.; Pickard, J.D.; et al. Critical Thresholds for Cerebrovascular Reactivity After Traumatic Brain Injury. Neurocrit. Care 2012, 16, 258–266. [Google Scholar] [CrossRef]
- Stein, K.; Froese, L.; Sekhon, M.S.; Griesdale, D.E.; Thelin, E.P.; Raj, R.; Tas, J.; Aries, M.; Gallagher, C.N.; Bernard, F.; et al. Intracranial Pressure-Derived Cerebrovascular Reactivity Indices and Their Critical Thresholds: A CAnadian High Resolution-TBI (CAHR-TBI) Validation Study. J. Neurotrauma 2023, 41, 910–923. [Google Scholar] [CrossRef]
- Zeiler, F.A.; Donnelly, J.; Smielewski, P.; Menon, D.K.; Hutchinson, P.J.; Czosnyka, M. Critical Thresholds of Intracranial Pressure-Derived Continuous Cerebrovascular Reactivity Indices for Outcome Prediction in Noncraniectomized Patients with Traumatic Brain Injury. J. Neurotrauma 2018, 35, 1107–1115. [Google Scholar] [CrossRef]
- Lingsma, H.; Andriessen, T.M.J.C.; Haitsema, I.; Horn, J.; van der Naalt, J.; Franschman, G.; Maas, A.I.R.; Vos, P.E.; Steyerberg, E.W. Prognosis in Moderate and Severe Traumatic Brain Injury: External Validation of the IMPACT Models and the Role of Extracranial Injuries. J. Trauma Acute Care Surg. 2013, 74, 639–646. [Google Scholar] [CrossRef] [PubMed]
- Steyerberg, E.W.; Mushkudiani, N.; Perel, P.; Butcher, I.; Lu, J.; McHugh, G.S.; Murray, G.D.; Marmarou, A.; Roberts, I.; Habbema, J.D.F.; et al. Predicting Outcome after Traumatic Brain Injury: Development and International Validation of Prognostic Scores Based on Admission Characteristics. PLoS Med. 2008, 5, e165. [Google Scholar] [CrossRef] [PubMed]
- Liu, H.; Pan, F.; Lei, X.; Hui, J.; Gong, R.; Feng, J.; Zheng, D. Effect of Intracranial Pressure on Photoplethysmographic Waveform in Different Cerebral Perfusion Territories: A Computational Study. Front. Physiol. 2023, 14, 1085871. [Google Scholar] [CrossRef]
- Eide, P.K.; Czosnyka, M.; Sorteberg, W.; Pickard, J.D.; Smielewski, P. Association between Intracranial, Arterial Pulse Pressure Amplitudes and Cerebral Autoregulation in Head Injury Patients. Neurol. Res. 2007, 29, 578–582. [Google Scholar] [CrossRef]
- Mowery, N.T.; Norris, P.R.; Riordan, W.; Jenkins, J.M.; Williams, A.E.; Morris, J.A. Cardiac Uncoupling and Heart Rate Variability Are Associated With Intracranial Hypertension and Mortality: A Study of 145 Trauma Patients With Continuous Monitoring. J. Trauma Inj. Infect. Crit. Care 2008, 65, 621–627. [Google Scholar] [CrossRef]
- Qiao, Z.; Wang, L.; Li, S.; Li, Y.; Gao, N.; Jia, L.; Liu, C.; Zhai, L.; Li, F. Ultrasonic Measurement of Optic Nerve Sheath Diameter in Elderly Patients with Craniocerebral Injury. Am. J. Transl. Res. 2021, 13, 3466–3472. [Google Scholar]


| Index-Threshold Used | % Yield | ||
|---|---|---|---|
| iICP | iICP.ci | iICP.5-25 | |
| PRx > 0 | 49.19 | 44.35 | 37.90 |
| PRx > 0.25 | 69.35 | 53.23 | 51.61 |
| PRx > 0.35 | 72.58 | 50.00 | 52.42 |
| PAx > 0 | 62.10 | 44.35 | 45.16 |
| PAx > 0.20 | 51.61 | 29.03 | 29.03 |
| PAx > 0.25 | 48.39 | 24.19 | 25.81 |
| RAC > 0 | 39.52 | 20.16 | 25.00 |
| Variable | Alive/Dead Outcome Groups | Favorable/Unfavorable Outcome Groups | ||||
|---|---|---|---|---|---|---|
| Alive Median (IQR) | Dead Median (IQR) | p-Value | Favorable Median (IQR) | Unfavorable Median (IQR) | p-Value | |
| Age (years) | 38.5 (25.8–50) | 59.5 (36–67) | <0.0001 | 39 (27–50) | 58 (34–67) | 0.0002 |
| Sex (% Male) | 83.80% | 81% | 0.8990 | 84.60% | 80% | 0.7090 |
| Admission GCS Total | 7 (5.75–8) | 6 (4–8) | 0.0528 | 7 (5–8) | 6 (4–8) | 0.0743 |
| Admission GCS Motor | 5 (3–5) | 3.5 (1–5) | 0.0062 | 5 (3–5) | 4 (1–5) | 0.0165 |
| Admission GCS Eyes | 1 (1–2) | 1 (1–2) | 0.8170 | 1 (1–2) | 1 (1–2) | 0.8730 |
| Admission GCS Verbal | 1 (1–2) | 1 (1–1.75) | 0.6670 | 1 (1–2) | 1 (1–1) | 0.4380 |
| Admission Pupil Response (% Bilaterally Reactive) | 63.20% | 59.50% | 0.9240 | 64.60% | 57.80% | 0.6970 |
| Marshall CT Grade | 4 (3–5) | 5 (4–5) | 0.0476 | 4 (3–5) | 5 (4–5) | 0.0257 |
| Rotterdam CT Grade | 4 (3–5) | 5 (4–6) | 0.0722 | 4 (3–5) | 5 (4–6) | 0.0601 |
| Helsinki CT Score | 5 (3.75–9) | 7.5 (6–9) | 0.0063 | 5 (3–9) | 7 (5–9) | 0.0064 |
| Stockholm CT Score | 3.1 (2.4–3.55) | 3.45 (2.58–4) | 0.1120 | 3 (2.4–3.5) | 3.5 (2.8–4) | 0.0351 |
| Number with Hypoxia Episode | 33.80% | 33.30% | 1.000 | 32.30% | 35.60% | 0.8810 |
| Number with Hypotension Episode | 13.20% | 7.10% | 0.4960 | 12.30% | 8.90% | 0.7990 |
| Number with Traumatic SAH | 95.60% | 97.60% | 0.9770 | 95.40% | 97.80% | 0.8880 |
| Number with Epidural Hematoma | 14.70% | 4.80% | 0.1900 | 13.80% | 6.70% | 0.3810 |
| Admission Hemoglobin | 135 (115–148) | 128 (114–143) | 0.3260 | 135 (114–148) | 129 (119–143) | 0.5330 |
| Admission Serum Glucose | 8.05 (6.9–10.3) | 9.8 (7.2–12.1) | 0.1110 | 8.2 (6.9–10.5) | 9.4 (7.18–11.5) | 0.2320 |
| Length of Hospital Stay | 34 (20–59.2) | 8 (4–14) | <0.0001 | 32 (20–54) | 9 (4–15) | <0.0001 |
| Length of SICU Stay | 8.5 (4–15.2) | 7 (4–11) | 0.3500 | 8 (4–15) | 7 (4–14) | 0.8670 |
| Mean MAP (mmHg) | 84.3 (80.1–87.1) | 84.4 (79–90.2) | 0.9680 | 84.4 (80.1–87.2) | 84.1 (79–90.2) | 0.9280 |
| Mean ICP (mmHg) | 8.92 (5.21–12.2) | 10.4 (6.82–16.2) | 0.1130 | 8.55 (4.75–12.1) | 10.5 (7.02–16.1) | 0.0522 |
| % Time ICP > 20 mmHg | 1.09 (0–5.09) | 1.7 (0.209–21.3) | 0.0564 | 1.06 (0–5.03) | 1.74 (0.208–18.6) | 0.0372 |
| % Time ICP > 22 mmHg | 0.575 (0–2.52) | 0.961 (0.117–11) | 0.0385 | 0.545 (0–2.57) | 0.947 (0.113–7.32) | 0.0464 |
| Mean Hourly Dose of ICP > 20 mmHg | 2.56 (0–10.4) | 3.39 (0.738–48.1) | 0.0435 | 2.35 (0–10.8) | 3.49 (0.634–44.7) | 0.0491 |
| Mean Hourly Dose of ICP > 22 mmHg | 1.12 (0–6.41) | 2.07 (0.403–34.9) | 0.0292 | 1.21 (0–7.25) | 1.82 (0.237–32.1) | 0.0583 |
| Mean CPP (mmHg) | 74.5 (71.1–80.6) | 73.6 (68.7–77.5) | 0.1220 | 75.1 (71.2–80.7) | 73.4 (68.9–76.9) | 0.0432 |
| % Time CPP < 60 mmHg | 4.1 (0.932–7.53) | 3.37 (0.48–16.4) | 0.4240 | 4.13 (0.494–7.71) | 3.54 (0.496–14.5) | 0.4270 |
| % Time CPP > 70 mmHg | 64 (51.8–83) | 61.5 (37.6–77) | 0.1630 | 66.2 (52.3–83.9) | 58.9 (37.5–74) | 0.0672 |
| Mean PRx | 0.136 (0.0299–0.27) | 0.202 (0.119–0.37) | 0.0173 | 0.152 (0.0372–0.272) | 0.192 (0.1–0.339) | 0.0911 |
| % Time PRx > 0 | 63.1 (52–82) | 70.7 (64.5–87.4) | 0.0326 | 63.9 (52.1–82) | 69.6 (60–86.6) | 0.1270 |
| % Time PRx > 0.25 | 39.8 (27.3–57.2) | 46.5 (36.5–68.9) | 0.0342 | 40.2 (27.8–57.3) | 45.8 (32.5–64.1) | 0.1680 |
| % Time PRx > 0.35 | 29.2 (19–42.1) | 37.7 (27–57.8) | 0.0222 | 30.3 (19.5–44.2) | 35.5 (23.5–53.4) | 0.1240 |
| Mean PAx | −0.0387 (−0.133–0.0735) | 0.0713 (−0.0443–0.31) | 0.0017 | −0.00816 (−0.127–0.0803) | 0.051 (−0.094–0.268) | 0.0132 |
| % Time PAx > 0 | 46.5 (34.7–60.8) | 60.9 (43.8–79.2) | 0.0033 | 48.2 (34.8–62.3) | 59.2 (39.3–77.6) | 0.0201 |
| % Time PAx > 0.20 | 24.7 (15.3–37.4) | 39.3 (23.4–64.7) | 0.0016 | 27.9 (15.8–37.5) | 36.7 (21.8–60.2) | 0.0127 |
| % Time PAx > 0.25 | 20.3 (12.4–32.4) | 33.8 (19.4–60.1) | 0.0014 | 23.1 (12.7–33.7) | 31.8 (17.3–56) | 0.0114 |
| Mean RAC | −0.276 (−0.437–−0.132) | −0.118 (−0.279–0.0974) | <0.0001 | −0.272 (−0.436–−0.125) | −0.123 (−0.284–0.0614) | 0.0006 |
| % Time RAC > 0 | 21.6 (10.6–36.2) | 36.7 (23–60.8) | 0.0002 | 21.7 (11–36.5) | 34.7 (21.1–53.9) | 0.0015 |
| iICP (PRx > 0) | 14.9 (6.77–19.2) | 7.01 (5.16–10.9) | 0.0639 | 14.9 (7.6–18.5) | 7.01 (4.84–11) | 0.0571 |
| % Time ICP > iICP (PRx > 0) | 13.5 (3.11–45.6) | 58.2 (16.2–87.2) | 0.0823 | 13.5 (3.11–40.5) | 58.2 (12.7–87.7) | 0.0458 |
| Mean Hourly Dose of ICP > iICP (PRx > 0) | 31.9 (5.39–115) | 134 (19.7–389) | 0.0586 | 31.9 (6.53–110) | 134 (16.4–415) | 0.0523 |
| iICP (PRx > 0.25) | 15.3 (10.7–19.9) | 13.9 (9.56–19.2) | 0.5810 | 15.3 (10.6–19.7) | 14.6 (9.86–19.6) | 0.7860 |
| % Time ICP > iICP (PRx > 0.25) | 2.12 (0.424–19.5) | 6.21 (0.562–34.6) | 0.7010 | 2.61 (0.452–23) | 5.43 (0.497–34.1) | 0.9340 |
| Mean Hourly Dose of ICP > iICP (PRx > 0.25) | 6.77 (0.921–62) | 8.01 (1.42–74.8) | 0.6680 | 8.04 (1.08–63.2) | 7.68 (1.27–74.2) | 0.8720 |
| iICP (PRx > 0.35) | 17.4 (11.3–23.3) | 16.5 (11.3–21.6) | 0.7220 | 17.1 (11.2–22.6) | 16.8 (11.6–22) | 0.9400 |
| % Time ICP > iICP (PRx > 0.35) | 1.18 (0.439–6.34) | 1.66 (0.393–21.2) | 0.7690 | 1.2 (0.507–6.8) | 1.4 (0.333–20.9) | 1.0000 |
| Mean Hourly Dose of ICP > iICP (PRx > 0.35) | 2.88 (0.756–20.3) | 2.03 (0.936–48.8) | 0.9680 | 3.68 (0.826–22.8) | 1.98 (0.708–48.1) | 0.8360 |
| iICP (PAx > 0) | 14.7 (8.27–21.3) | 12.1 (9.91–15) | 0.9180 | 14 (8.14–20.9) | 12.3 (10.2–16.9) | 0.8530 |
| % Time ICP > iICP (PAx > 0) | 3.52 (0.49–65.2) | 11.4 (1.03–71.1) | 0.4790 | 3.77 (0.543–66.3) | 10.3 (0.801–71) | 0.7360 |
| Mean Hourly Dose of ICP > iICP (PAx > 0) | 14.6 (1.42–121) | 20 (0.853–261) | 0.6620 | 16.6 (1.49–121) | 19.1 (0.575–260) | 0.9440 |
| iICP (PAx > 0.20) | 19 (13.4–33.2) | 16.2 (14.4–28.6) | 0.9020 | 18.7 (13.3–33.4) | 17.9 (14.5–29) | 0.9290 |
| % Time ICP > iICP (PAx > 0.20) | 0.519 (0.15–4.01) | 0.438 (0.144–1.19) | 0.7740 | 0.521 (0.17–4.38) | 0.357 (0.14–1.17) | 0.5310 |
| Mean Hourly Dose of ICP > iICP (PAx > 0.20) | 1.02 (0.363–6.59) | 1.11 (0.115–3.24) | 0.8250 | 1.08 (0.392–6.71) | 0.927 (0.106–3.11) | 0.5530 |
| iICP (PAx > 0.25) | 20.7 (15.5–36.3) | 16.6 (15.1–27.7) | 0.3350 | 20.4 (15.4–36.8) | 16.7 (15.1–30) | 0.4740 |
| % Time ICP > iICP (PAx > 0.25) | 0.343 (0.114–1.31) | 0.466 (0.146–31) | 0.4060 | 0.388 (0.129–1.51) | 0.371 (0.131–26.5) | 0.7210 |
| Mean Hourly Dose of ICP > iICP (PAx > 0.25) | 0.633 (0.263–1.74) | 1.46 (0.429–104) | 0.1480 | 0.65 (0.264–1.82) | 1.31 (0.256–75.6) | 0.3260 |
| iICP (RAC > 0) | 18.8 (11.7–27.6) | 17.8 (14.2–25.8) | 0.7960 | 18.7 (11.5–24.9) | 20.2 (14.2–26.7) | 0.5660 |
| % Time ICP > iICP (RAC > 0) | 0.615 (0.179–0.846) | 1.05 (0.194–24.2) | 0.4500 | 0.627 (0.203–0.973) | 0.84 (0.0774–18.8) | 0.7790 |
| Mean Hourly Dose of ICP > iICP (RAC > 0) | 1.04 (0.21–2.78) | 1.85 (0.132–31) | 0.5500 | 1.07 (0.303–2.8) | 1.4 (0.0958–25.6) | 0.8660 |
| Alive/Dead Outcome Groups | ||||
| Model | AUC (95% CI) | AIC | p-Value | Nagelkerke’s R2 |
| Mean Hourly Dose of ICP > 20 mmHg | 0.614 (0.508–0.716) | 138.3 | 0.0217 | 0.140 |
| Mean Hourly Dose of ICP > 22 mmHg | 0.623 (0.513–0.728) | 139.4 | 0.0146 | 0.128 |
| Mean Hourly Dose of ICP > iICP (PRx > 0) | 0.660 (0.508–0.813) | 68.6 | 0.0293 | 0.085 |
| Mean Hourly Dose of ICP > iICP (PRx > 0.25) | 0.530 (0.391–0.661) | 102.8 | 0.3339 | 0.002 |
| Mean Hourly Dose of ICP > iICP (PRx > 0.35) | 0.503 (0.364–0.631) | 108.7 | 0.4838 | 0.002 |
| Mean Hourly Dose of ICP > iICP (PAx > 0) | 0.533 (0.373–0.677) | 89.2 | 0.3309 | 0.036 |
| Mean Hourly Dose of ICP > iICP (PAx > 0.20) | 0.481 (0.320–0.646) | 77.4 | 0.5940 | 0.039 |
| Mean Hourly Dose of ICP > iICP (PAx > 0.25) | 0.624 (0.457–0.783) | 66.2 | 0.0738 | 0.123 |
| Mean Hourly Dose of ICP > iICP (RAC > 0) | 0.554 (0.373–0.726) | 63.7 | 0.2751 | 0.071 |
| Favorable/Unfavorable Outcome Groups | ||||
| Model | AUC (95% CI) | AIC | p-Value | Nagelkerke’s R2 |
| Mean Hourly Dose of ICP > 20 mmHg | 0.610 (0.500–0.719) | 142.3 | 0.0246 | 0.123 |
| Mean Hourly Dose of ICP > 22 mmHg | 0.605 (0.490–0.711) | 143.4 | 0.0291 | 0.111 |
| Mean Hourly Dose of ICP > iICP (PRx > 0) | 0.661 (0.492–0.808) | 68.8 | 0.0262 | 0.134 |
| Mean Hourly Dose of ICP > iICP (PRx > 0.25) | 0.512 (0.353–0.628) | 103.5 | 0.4361 | 0.001 |
| Mean Hourly Dose of ICP > iICP (PRx > 0.35) | 0.486 (0.384–0.642) | 109.5 | 0.5859 | 0.001 |
| Mean Hourly Dose of ICP > iICP (PAx > 0) | 0.506 (0.351–0.665) | 90.9 | 0.4721 | 0.027 |
| Mean Hourly Dose of ICP > iICP (PAx > 0.20) | 0.452 (0.384–0.719) | 78.7 | 0.7291 | 0.032 |
| Mean Hourly Dose of ICP > iICP (PAx > 0.25) | 0.584 (0.403–0.748) | 67.9 | 0.1631 | 0.109 |
| Mean Hourly Dose of ICP > iICP (RAC > 0) | 0.516 (0.338–0.694) | 64.2 | 0.4331 | 0.062 |
| Alive/Dead Outcome Groups | |||||
| Model | AUC (95% CI) | AIC | p-Value | Nagelkerke’s R2 | Δ Nagelkerke’s R2 |
| IMPACT Core | 0.793 (0.698–0.879) | 124.2 | <0.0001 | 0.344 | - |
| +Mean Hourly Dose of ICP > 20 mmHg | 0.855 (0.773–0.926) | 107.9 | <0.0001 | 0.500 | 0.156 |
| +Mean Hourly Dose of ICP > 22 mmHg | 0.852 (0.768–0.925) | 109.5 | <0.0001 | 0.487 | 0.143 |
| +Mean Hourly Dose of ICP > iICP (PRx > 0) | 0.914 (0.817–0.984) | 49.3 | <0.0001 | 0.607 | 0.263 |
| +Mean Hourly Dose of ICP > iICP (PRx > 0.25) | 0.801 (0.684–0.904) | 88.3 | <0.0001 | 0.358 | 0.014 |
| +Mean Hourly Dose of ICP > iICP (PRx > 0.35) | 0.788 (0.672–0.883) | 93.8 | <0.0001 | 0.346 | 0.002 |
| +Mean Hourly Dose of ICP > iICP (PAx > 0) | 0.708 (0.570–0.827) | 86.3 | 0.0024 | 0.237 | −0.107 |
| +Mean Hourly Dose of ICP > iICP (PAx > 0.20) | 0.698 (0.545–0.827) | 77.2 | 0.0063 | 0.217 | −0.127 |
| +Mean Hourly Dose of ICP > iICP (PAx > 0.25) | 0.742 (0.585–0.869) | 66.8 | 0.0019 | 0.290 | −0.054 |
| +Mean Hourly Dose of ICP > iICP (RAC > 0) | 0.756 (0.601–0.893) | 64.5 | 0.0014 | 0.259 | −0.085 |
| Favorable/Unfavorable Outcome Groups | |||||
| Model | AUC (95% CI) | AIC | p-value | Nagelkerke’s R2 | Δ Nagelkerke’s R2 |
| IMPACT Core | 0.753 (0.653–0.845) | 135.1 | <0.0001 | 0.262 | - |
| +Mean Hourly Dose of ICP > 20 mmHg | 0.801 (0.706–0.884) | 123.1 | <0.0001 | 0.392 | 0.130 |
| +Mean Hourly Dose of ICP > 22 mmHg | 0.799 (0.701–0.889) | 124.7 | <0.0001 | 0.378 | 0.116 |
| +Mean Hourly Dose of ICP > iICP (PRx > 0) | 0.871 (0.752–0.965) | 56.6 | <0.0001 | 0.523 | 0.261 |
| +Mean Hourly Dose of ICP > iICP (PRx > 0.25) | 0.780 (0.662–0.889) | 91.3 | <0.0001 | 0.325 | 0.063 |
| +Mean Hourly Dose of ICP > iICP (PRx > 0.35) | 0.770 (0.647–0.872) | 96.7 | <0.0001 | 0.317 | 0.055 |
| +Mean Hourly Dose of ICP > iICP (PAx > 0) | 0.705 (0.565–0.824) | 89.1 | 0.0024 | 0.208 | −0.054 |
| +Mean Hourly Dose of ICP > iICP (PAx > 0.20) | 0.684 (0.542–0.814) | 80.0 | 0.0097 | 0.179 | −0.083 |
| +Mean Hourly Dose of ICP > iICP (PAx > 0.25) | 0.726 (0.574–0.858) | 69.8 | 0.0033 | 0.250 | −0.012 |
| +Mean Hourly Dose of ICP > iICP (RAC > 0) | 0.739 (0.575–0.874) | 65.4 | 0.0027 | 0.241 | −0.021 |
Disclaimer/Publisher’s Note: The statements, opinions and data contained in all publications are solely those of the individual author(s) and contributor(s) and not of MDPI and/or the editor(s). MDPI and/or the editor(s) disclaim responsibility for any injury to people or property resulting from any ideas, methods, instructions or products referred to in the content. |
© 2025 by the authors. Licensee MDPI, Basel, Switzerland. This article is an open access article distributed under the terms and conditions of the Creative Commons Attribution (CC BY) license (https://creativecommons.org/licenses/by/4.0/).
Share and Cite
Stein, K.Y.; Froese, L.; Gomez, A.; Sainbhi, A.S.; Vakitbilir, N.; Islam, A.; Bergmann, T.; Zeiler, F.A. Leveraging Function Intersectionality and Multi-Modal Cerebrovascular Reactivity Measures for the Derivation of Individualized Intracranial Pressure Thresholds in Acute Traumatic Neural Injury. Bioengineering 2025, 12, 485. https://doi.org/10.3390/bioengineering12050485
Stein KY, Froese L, Gomez A, Sainbhi AS, Vakitbilir N, Islam A, Bergmann T, Zeiler FA. Leveraging Function Intersectionality and Multi-Modal Cerebrovascular Reactivity Measures for the Derivation of Individualized Intracranial Pressure Thresholds in Acute Traumatic Neural Injury. Bioengineering. 2025; 12(5):485. https://doi.org/10.3390/bioengineering12050485
Chicago/Turabian StyleStein, Kevin Y., Logan Froese, Alwyn Gomez, Amanjyot Singh Sainbhi, Nuray Vakitbilir, Abrar Islam, Tobias Bergmann, and Frederick A. Zeiler. 2025. "Leveraging Function Intersectionality and Multi-Modal Cerebrovascular Reactivity Measures for the Derivation of Individualized Intracranial Pressure Thresholds in Acute Traumatic Neural Injury" Bioengineering 12, no. 5: 485. https://doi.org/10.3390/bioengineering12050485
APA StyleStein, K. Y., Froese, L., Gomez, A., Sainbhi, A. S., Vakitbilir, N., Islam, A., Bergmann, T., & Zeiler, F. A. (2025). Leveraging Function Intersectionality and Multi-Modal Cerebrovascular Reactivity Measures for the Derivation of Individualized Intracranial Pressure Thresholds in Acute Traumatic Neural Injury. Bioengineering, 12(5), 485. https://doi.org/10.3390/bioengineering12050485