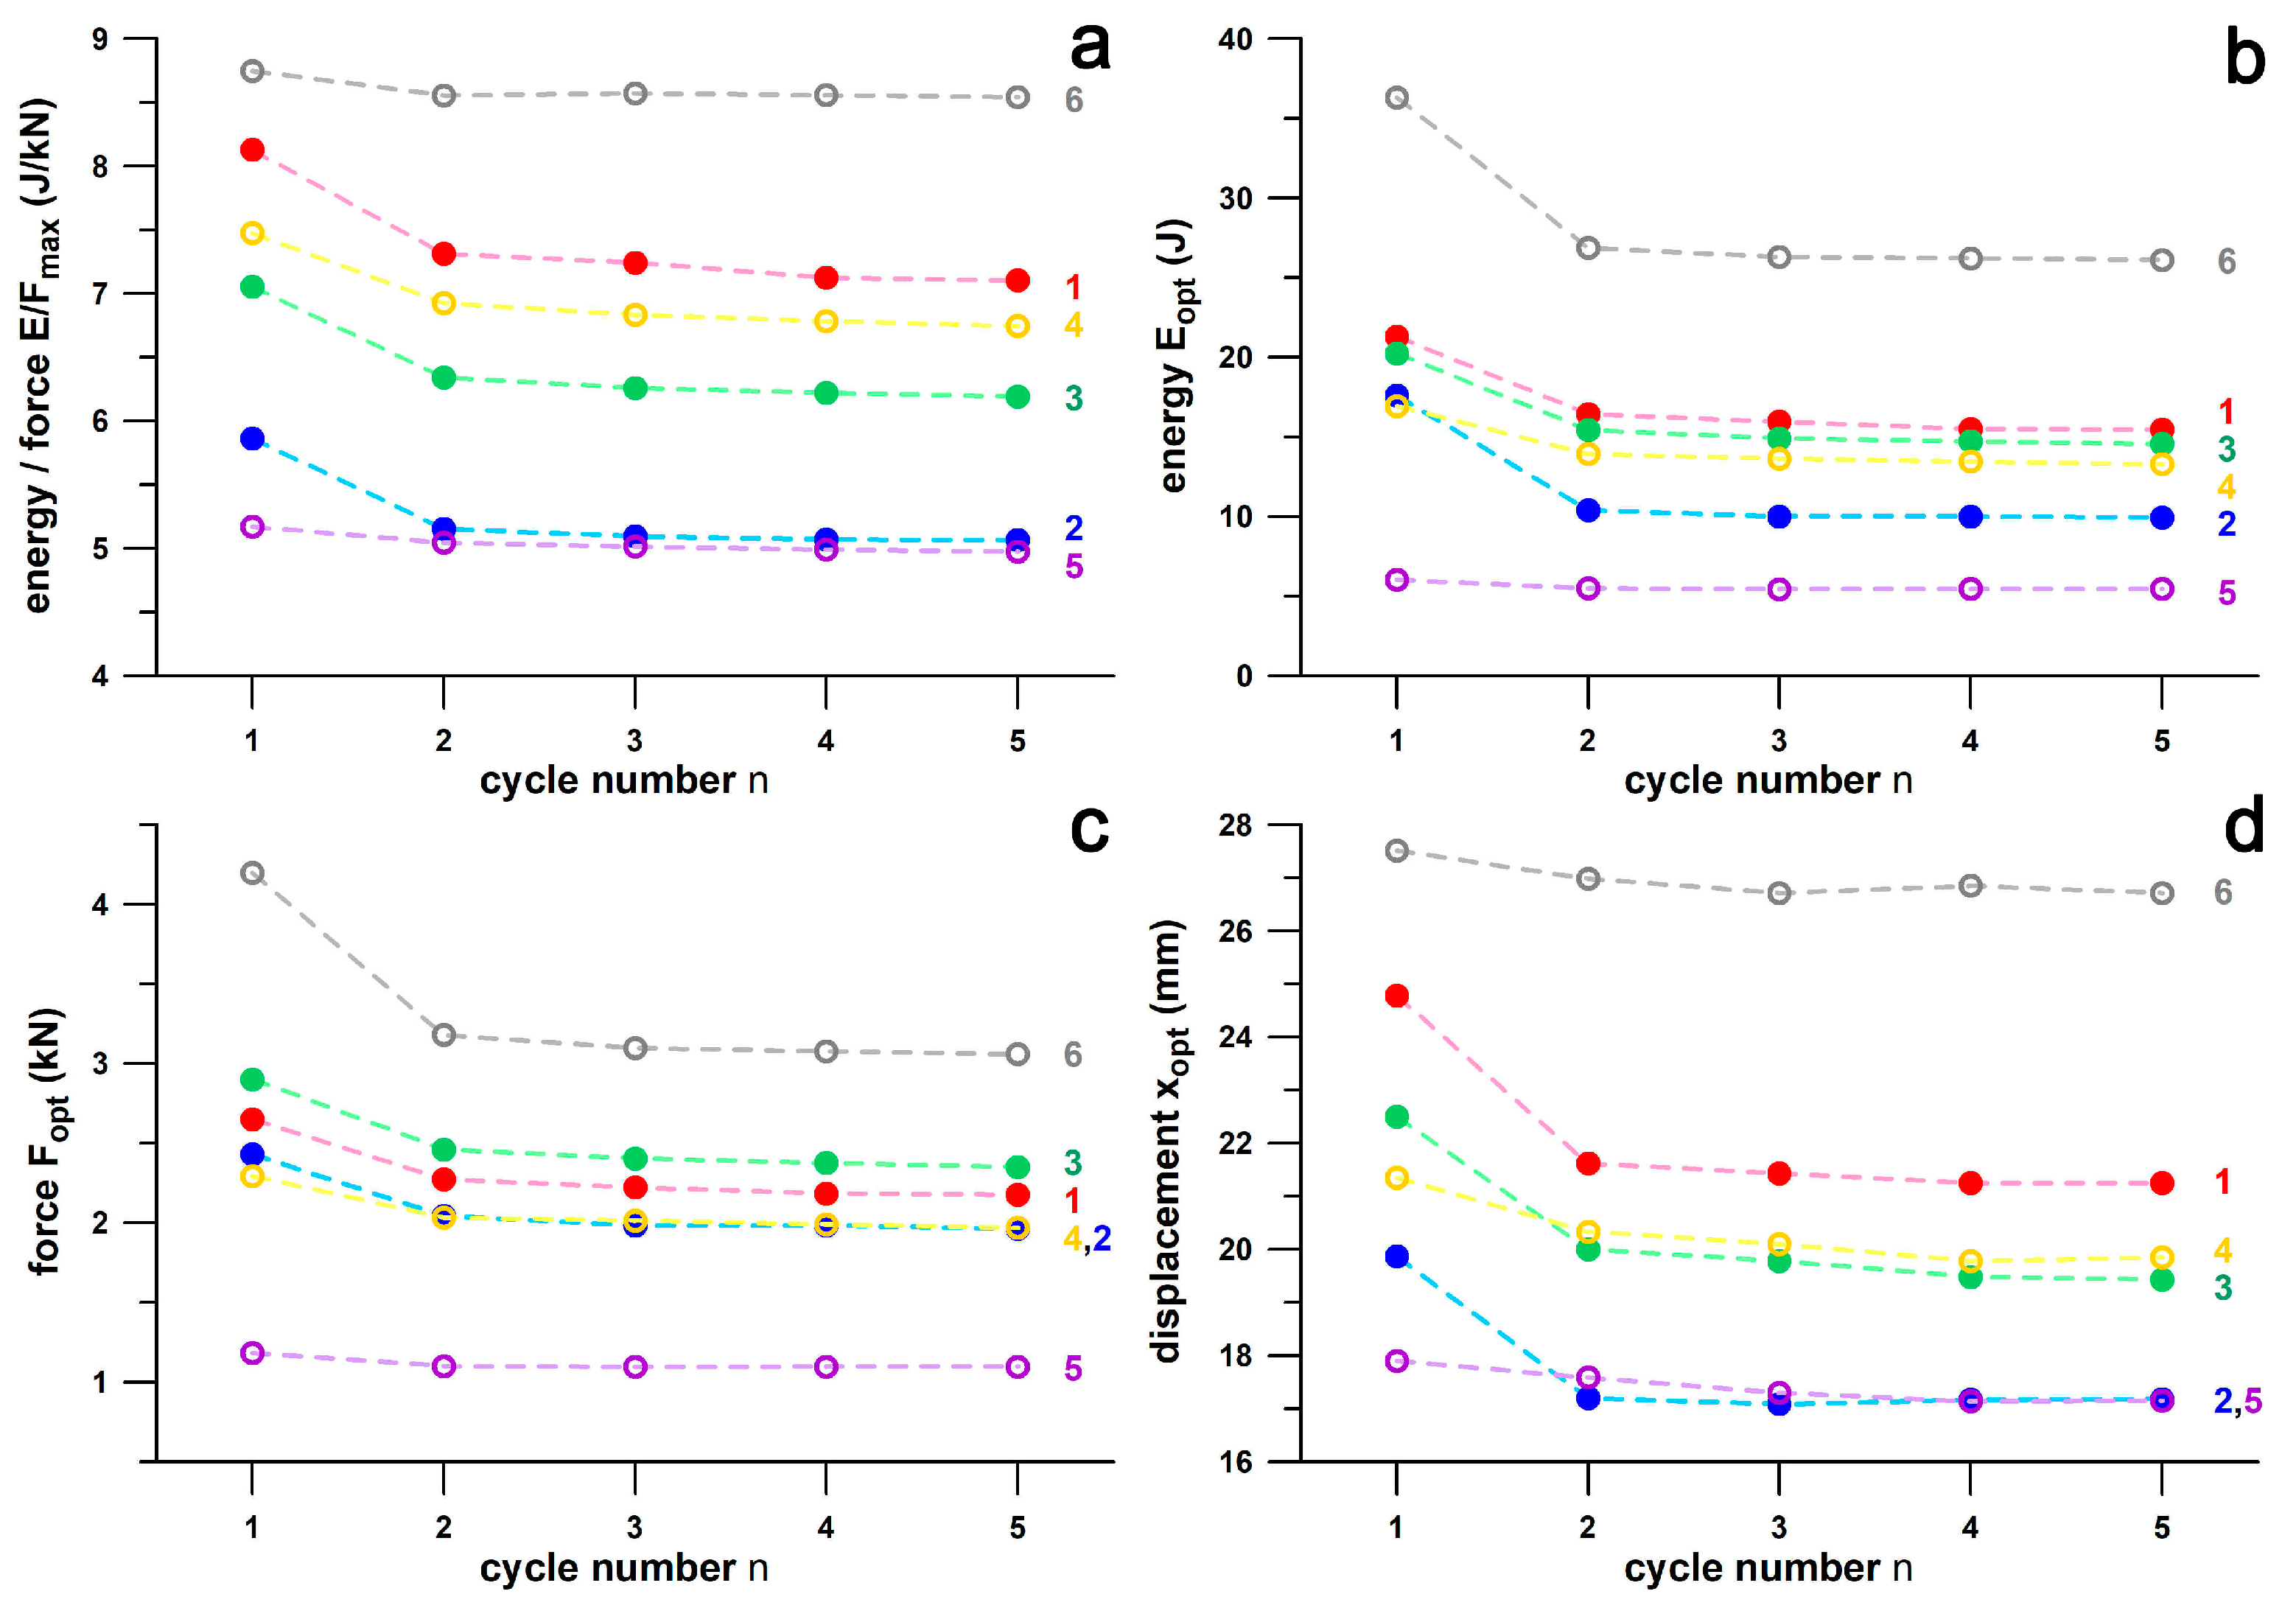
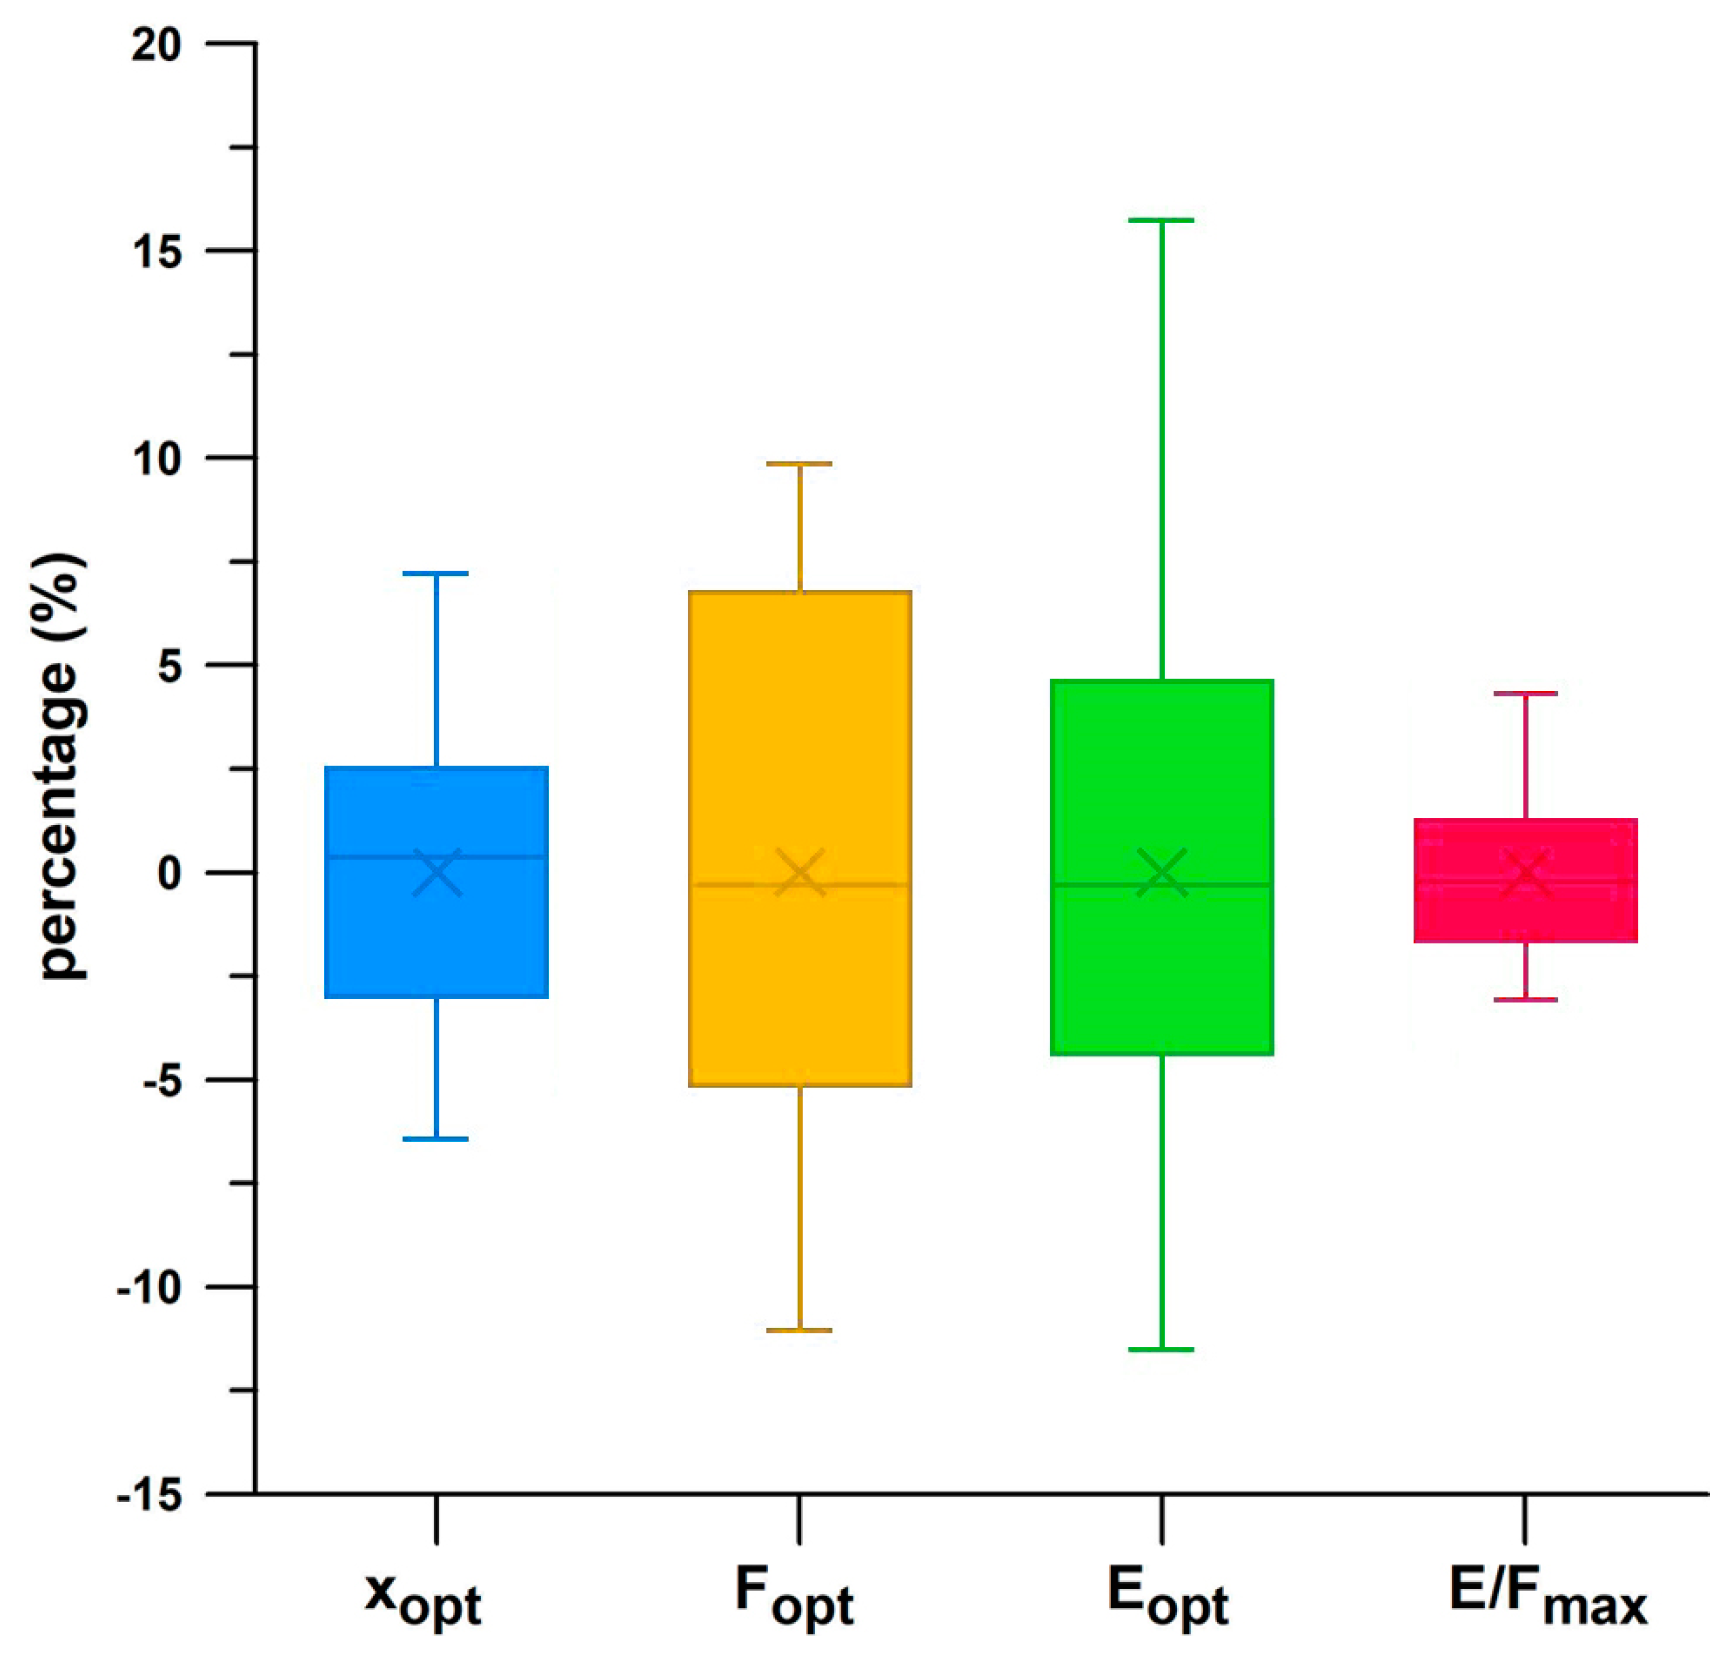
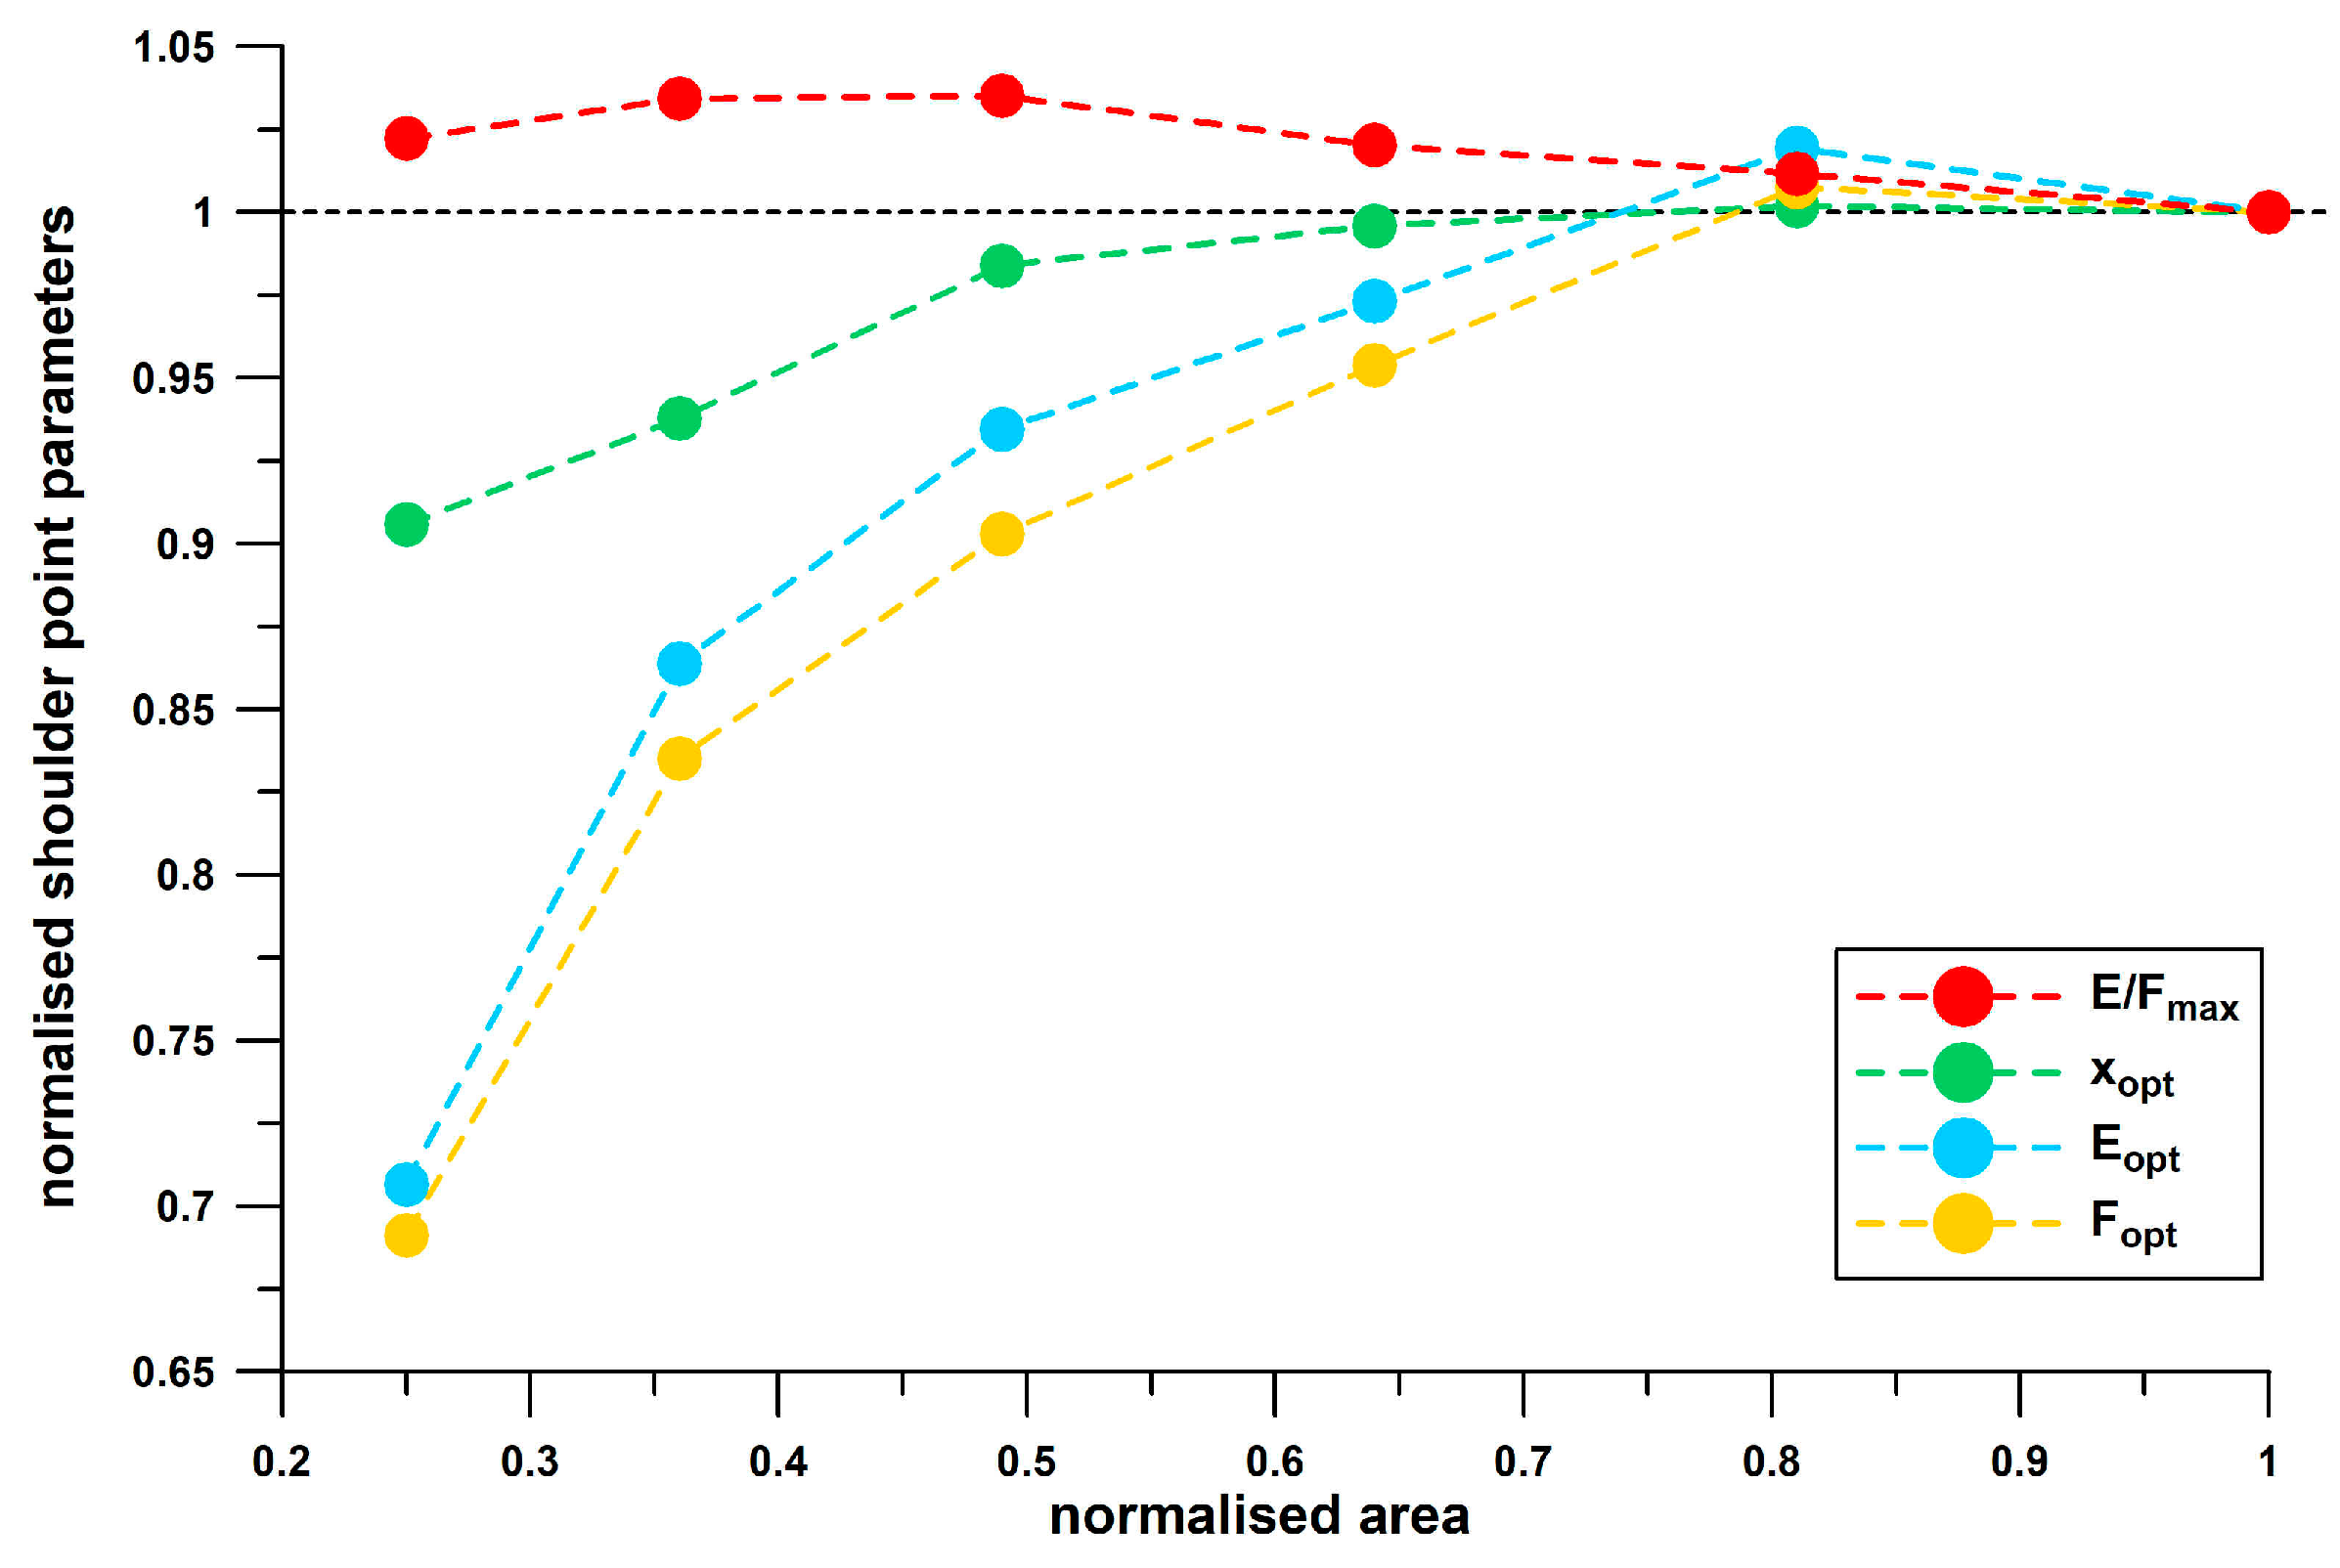
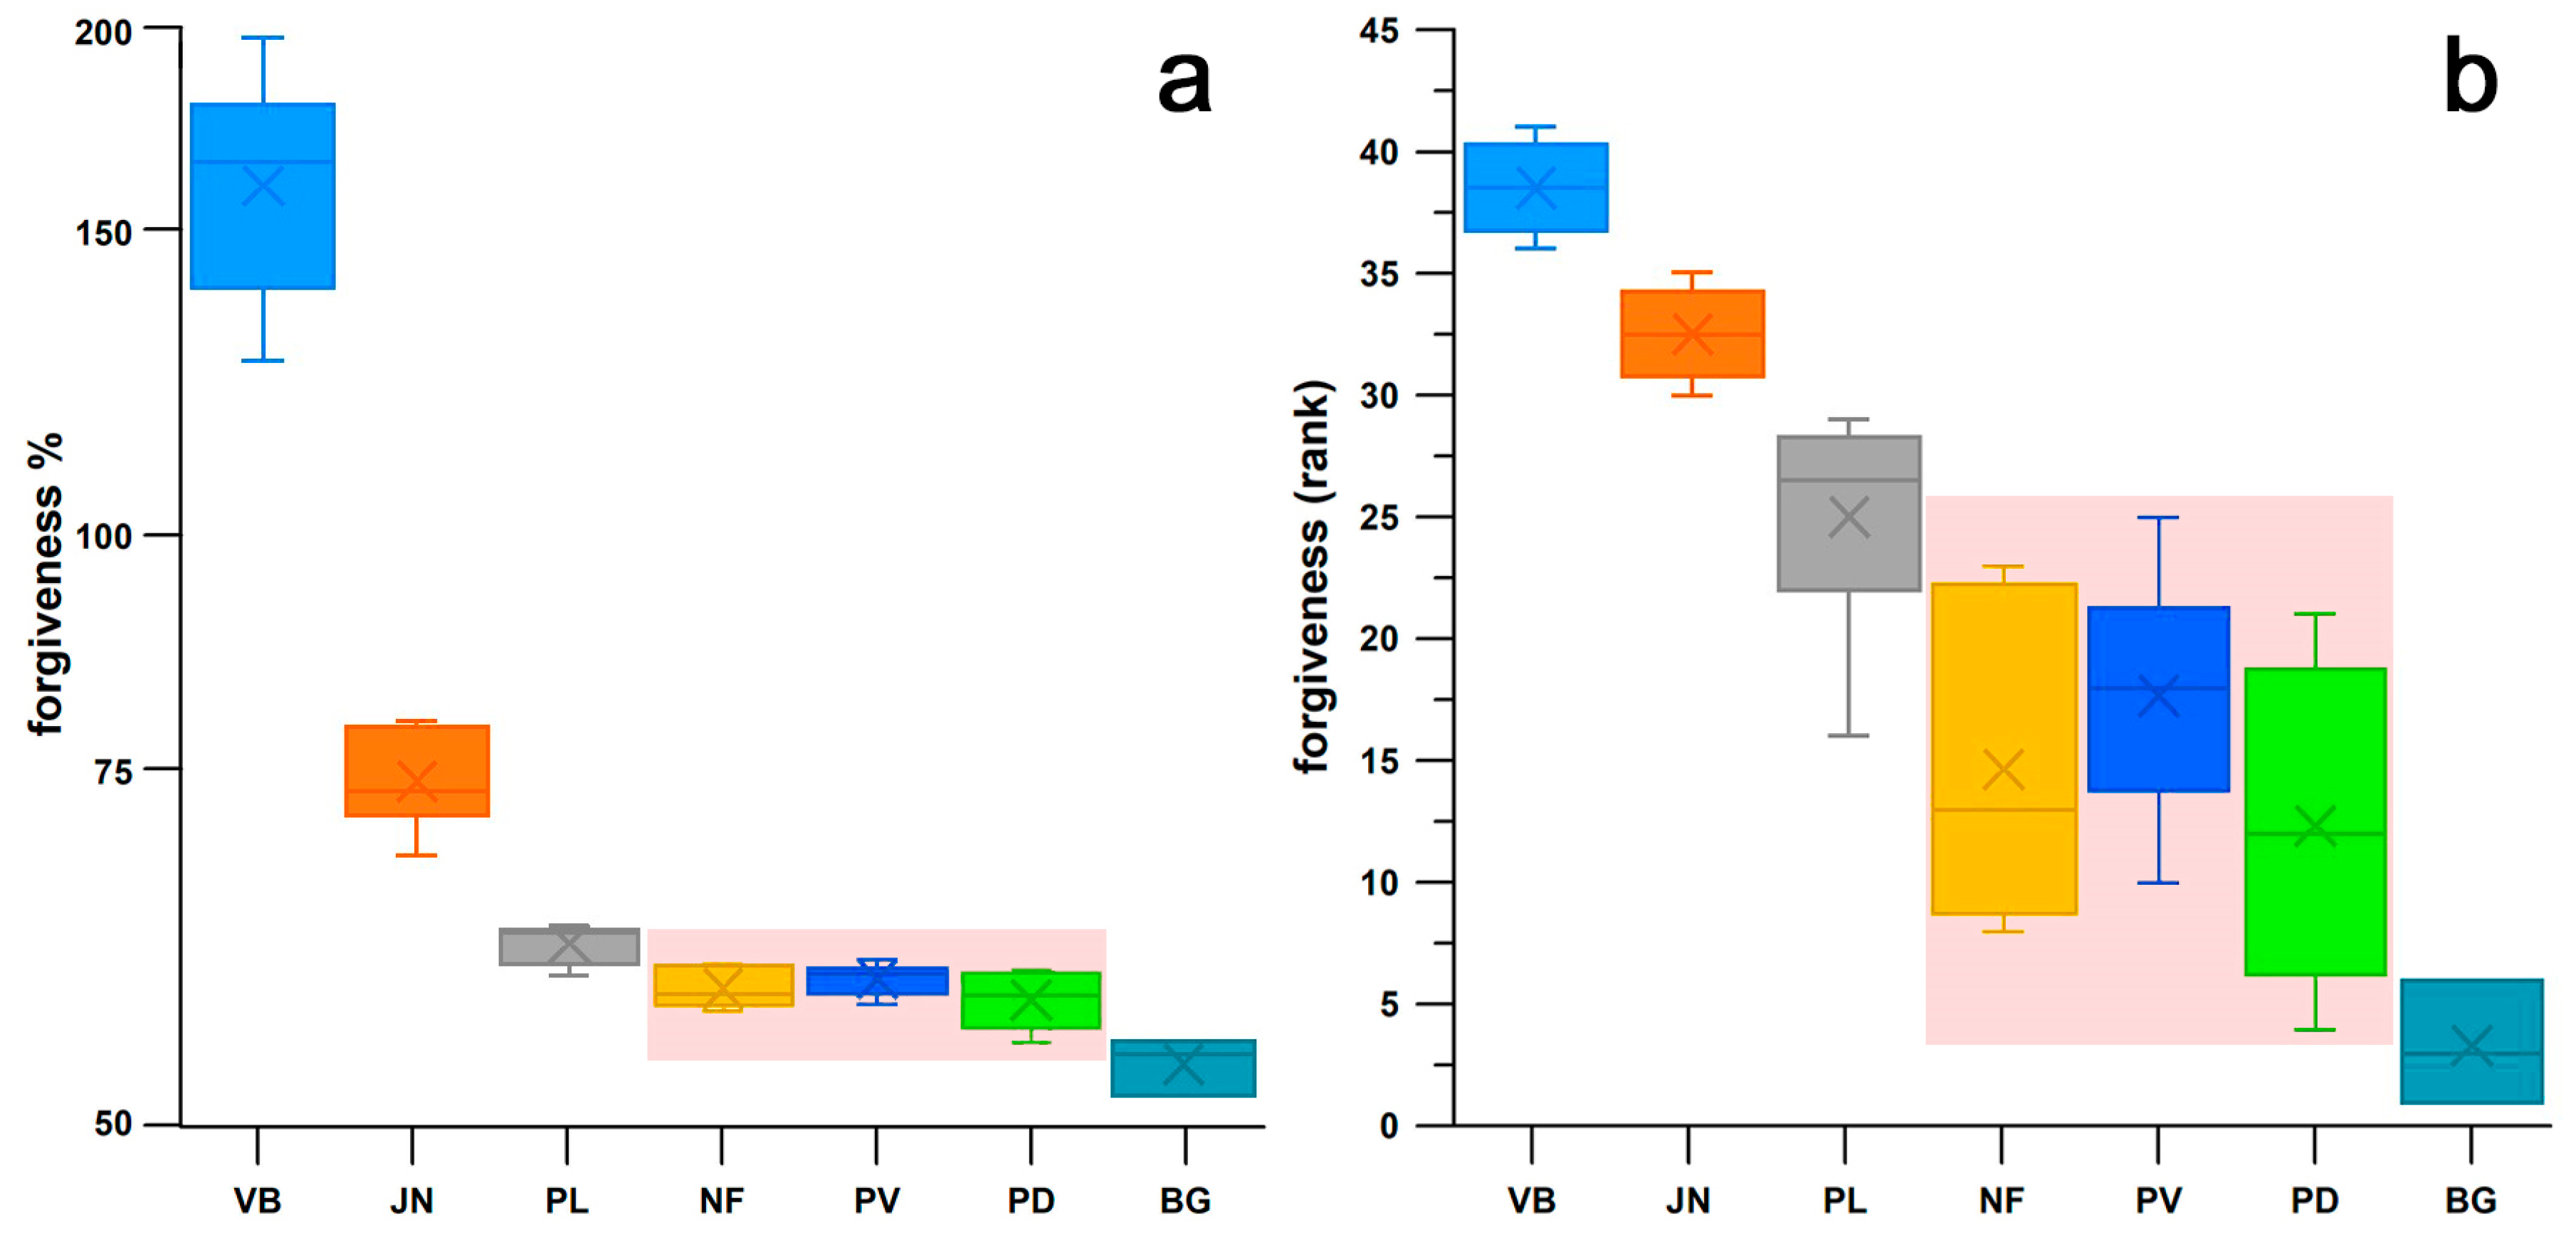
3.2. Comparison of Shoes by Shoulder Point Parameters
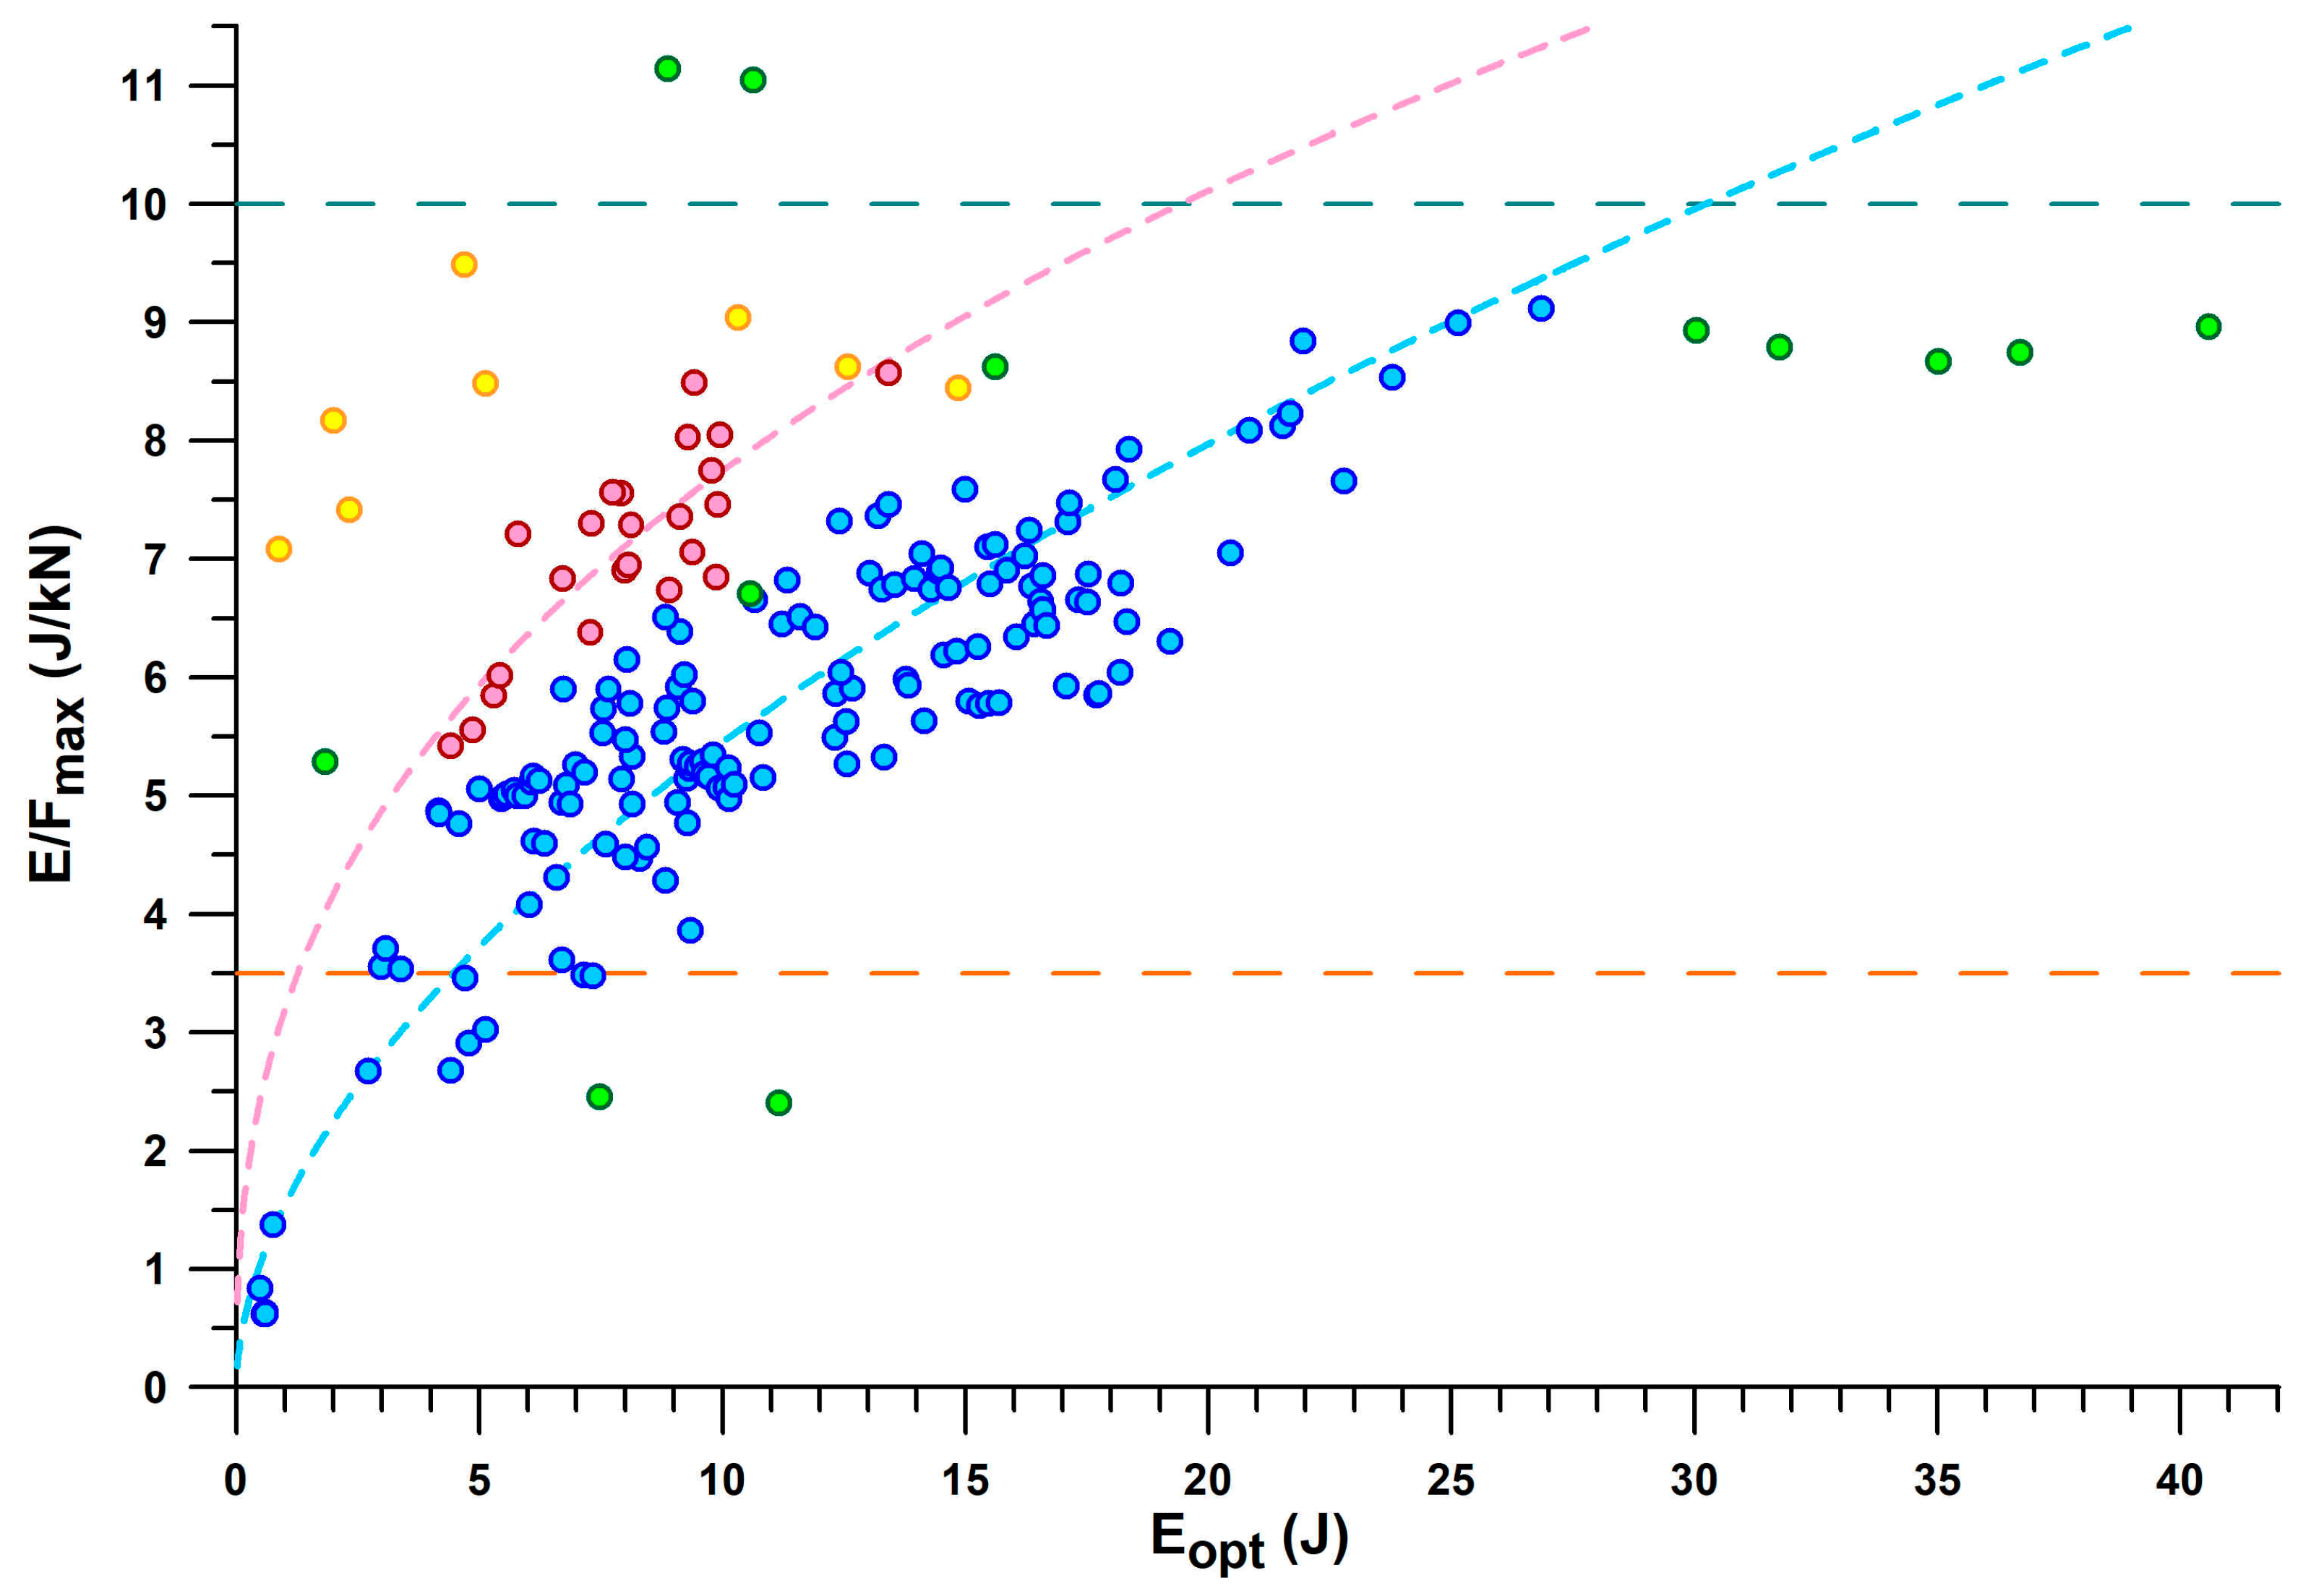
Figure 9 provides a comprehensive overview of all shoes by their
E/
Fmax vs.
Eopt. The general principle of the main fit line (blue dots) and the secondary fit line (red dots) is that the more energy is absorbed, the greater the
E/
Fmax. For the same energy absorption between 4.5 and 13.5 J,
E/
Fmax of the secondary line is 1.6–1.4 larger than that of the main line. The shoes located on the secondary line are mainly PUMA shoes (Puma_Deviate Elite 2, Puma_Liberate, Puma_Velocity 2, PumaFastR), as well as Brooks Ghost 11, CEP Omnispeed, On_Cloudneo (PEBAX foam), and Saucony_Endorphin.
Minimalist shoes are at the lower end of the E/Fmax and Eopt scale, such as Vibram Bikla (“5 fingers”), Vivobarefoot, and Joe Nimble. The best shoe in the main line is the ASICS GelKayano17, with a maximum E/Fmax of 9.1 J/kN. The best shoe on the secondary line is the CEP Omnispeed (prototype v5) shoe with a maximum E/Fmax of 8.6 J/kN.
As can be seen in
Figure 9, there are a few outliers. One Nike Airmax appears to be on the secondary line, but its cushioning technology is based on a pneumatic damper rather than closed-cell foam technology. Another Nike Airmax250 had its air bubble burst, so its
Eopt was only 1.8 J, and its
Fopt was only 0.35 kN, but its
E/
Fmax was still an acceptable value of 5.29 J/kN compared to other shoes. The intact shoe of the same pair showed the following values:
Eopt: 10.6 J;
Fopt: 1.58 kN; and 6.71 J/kN.
Adidas Nitrocharge is an indoor soccer shoe with a thin sole and thus a very low
E/
Fmax (2.4 J/kN) typical for minimalist shoes, but with a larger energy absorption than minimalist shoes. Nike ZoomAir is a skateboarding shoe with a stiffer heel segment. Adidas Bounce Tube shoes (MegaBounce and BounceTitan) absorb more energy (30.0–40.5 J) than other shoes with the same
E/
Fmax ratio (8.8 J/kN on average), which is because the excessive
Fopt ranges between 3.4 and 4.5 kN (
Figure 10). A similar excessive
Fopt is found in the Adidas Nitrocharge shoe with 4.6 kN, the largest
Fopt force in the dataset, despite the smaller
Eopt (11.2 J).
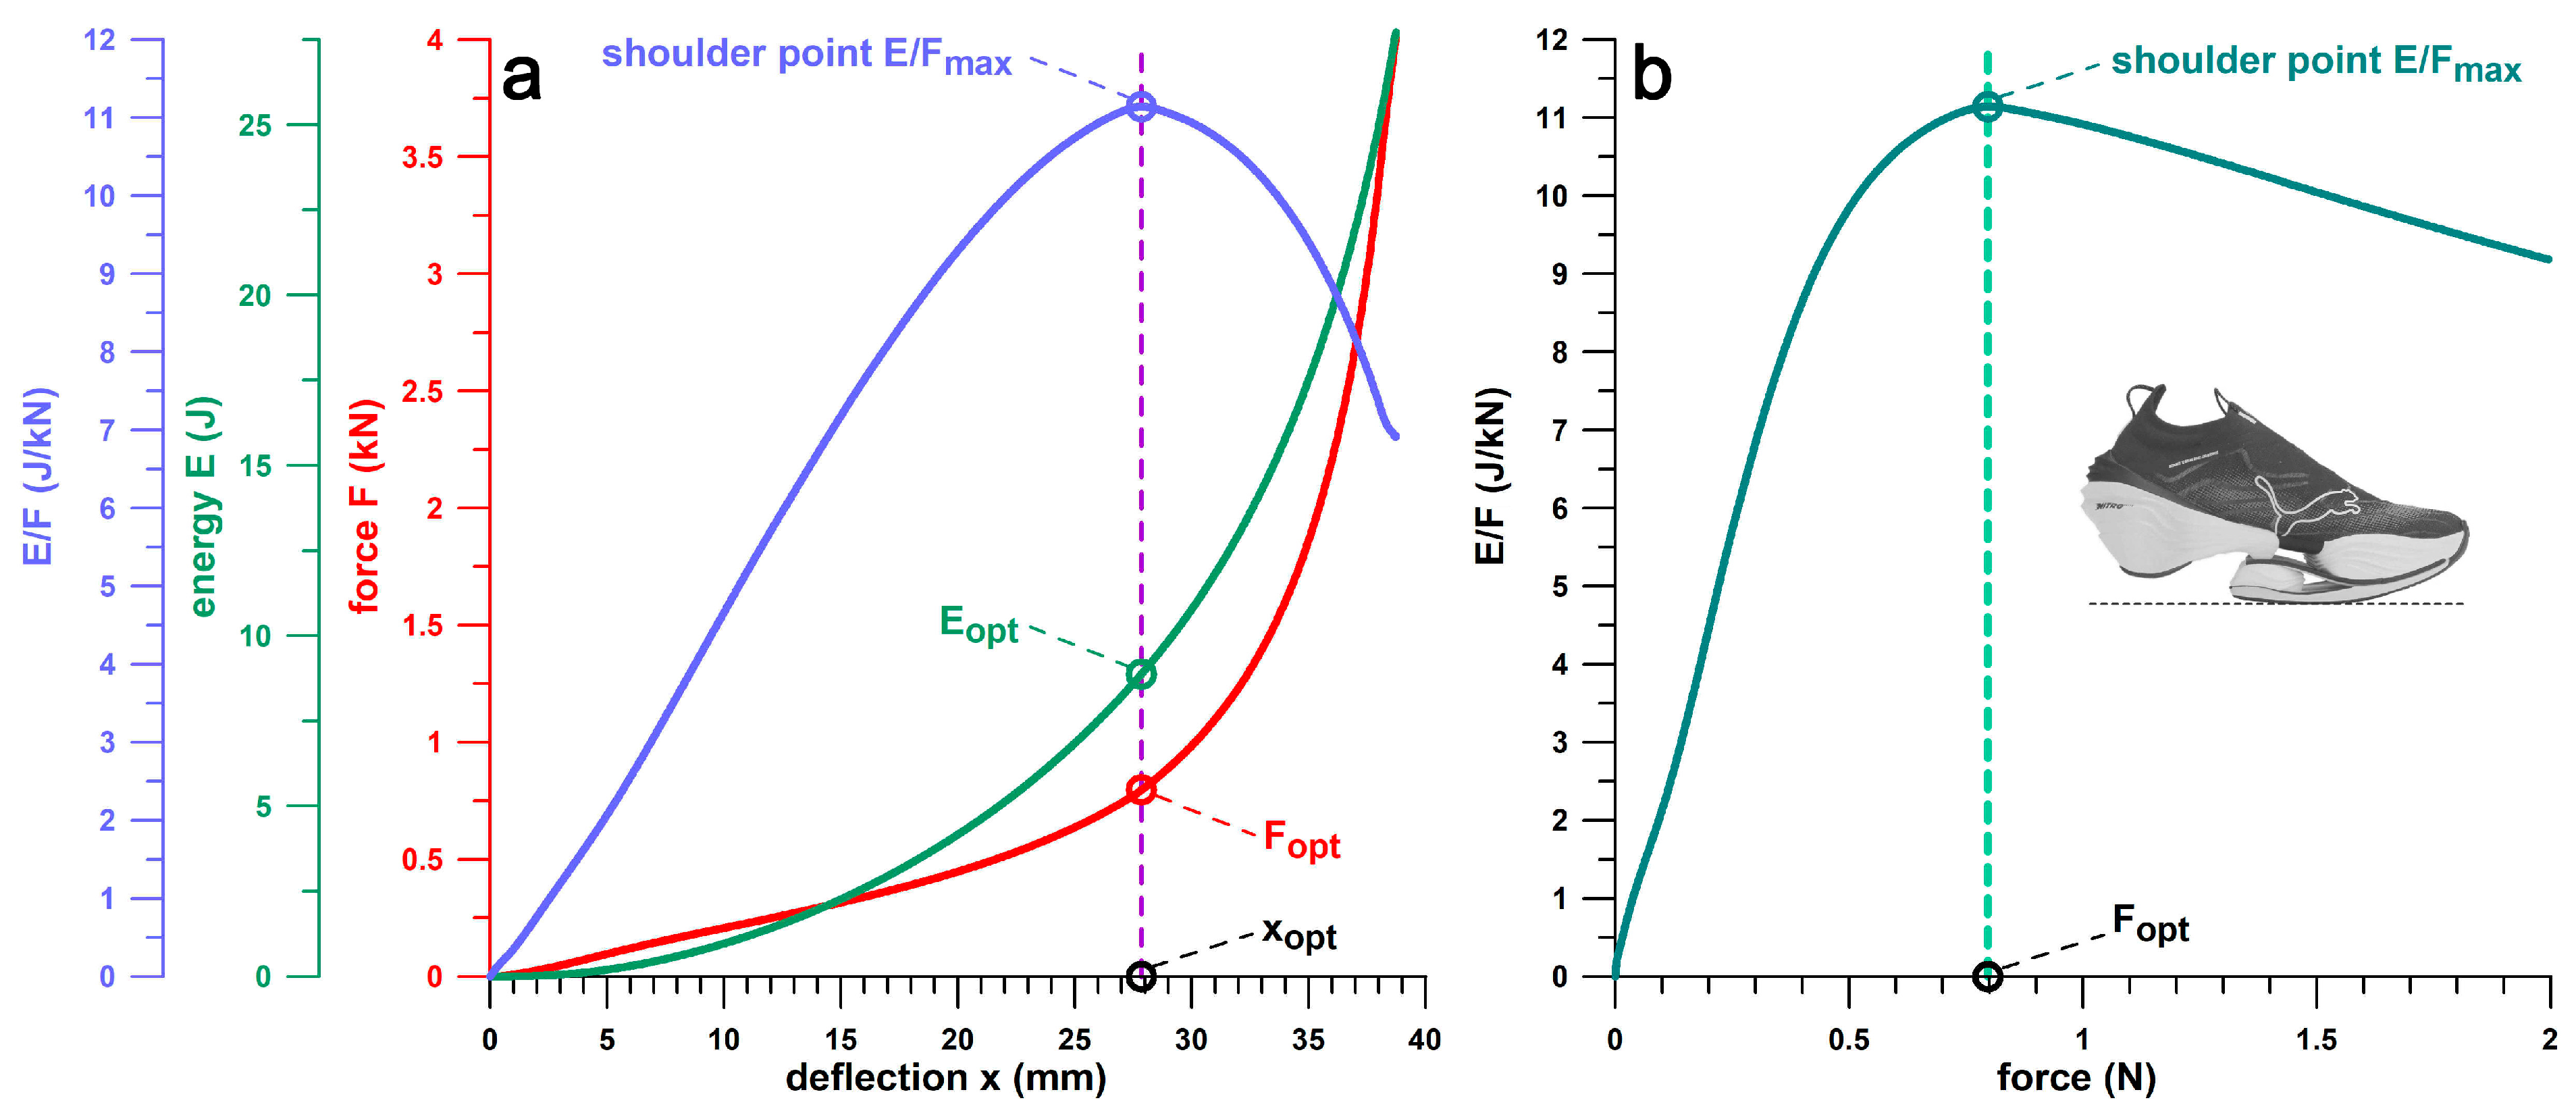
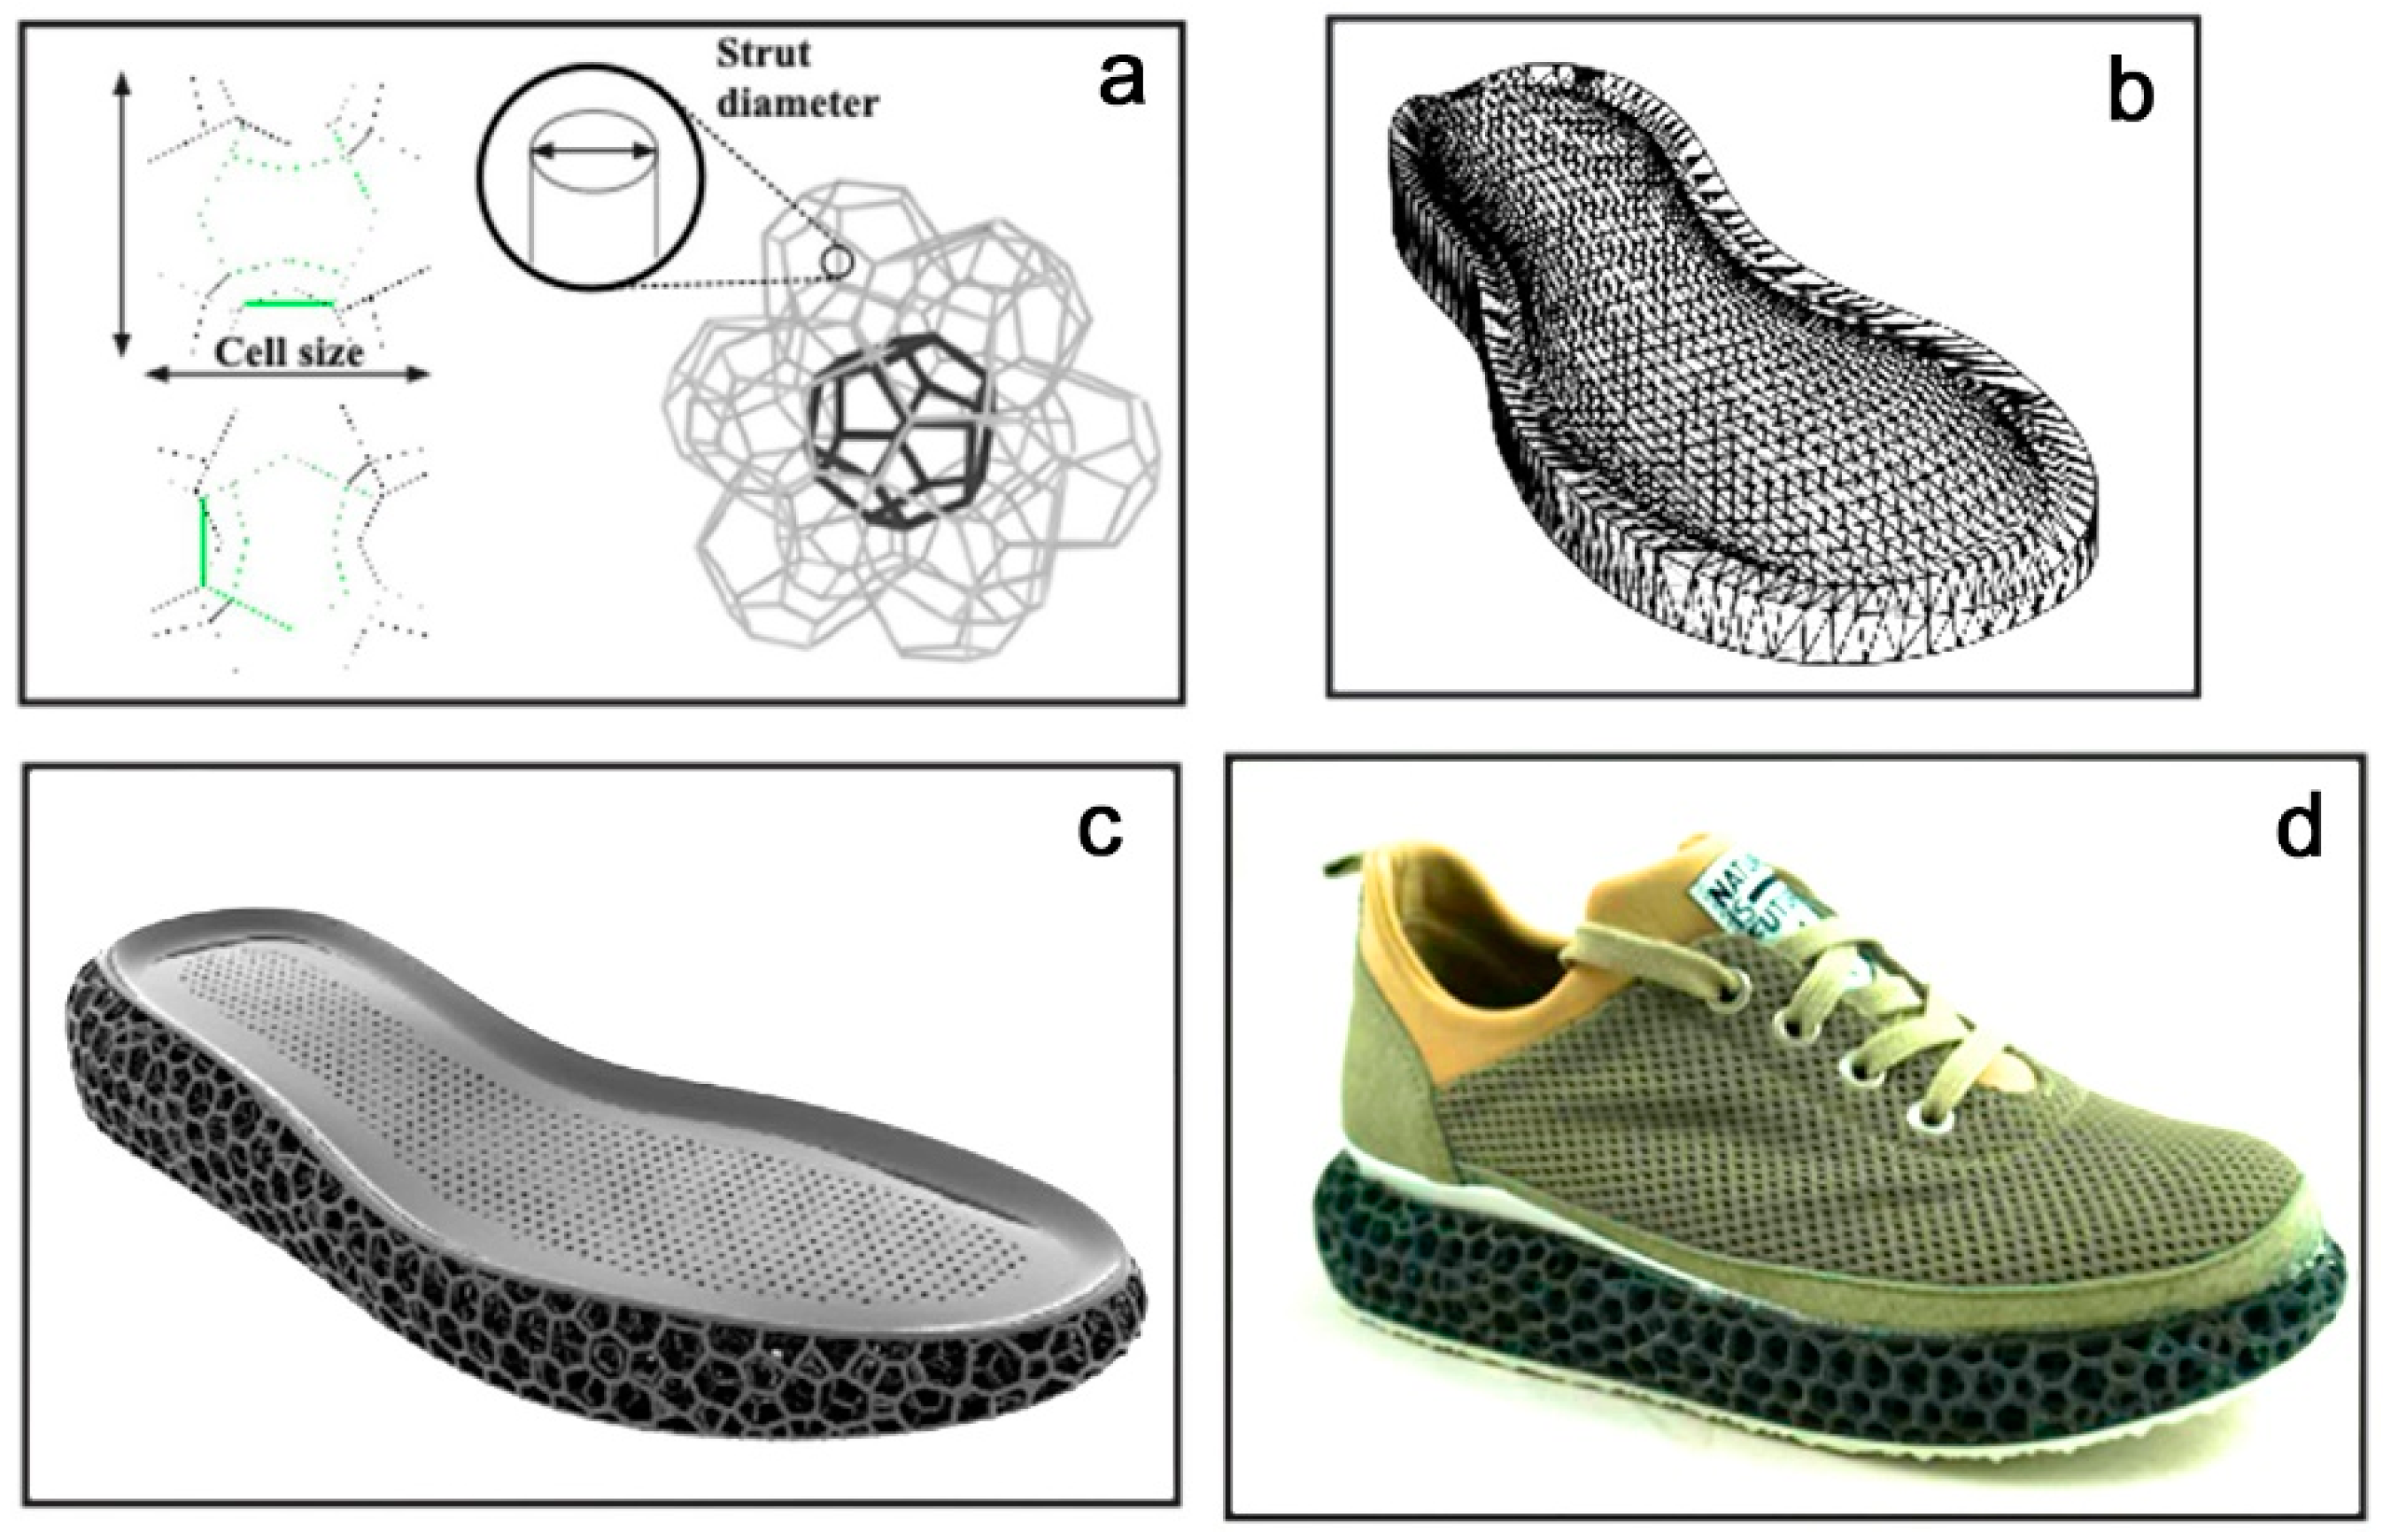
The largest E/Fmax of the dataset is found in the PUMA RuleBreaker shoe, with 11.1 J/kN (presumably due to the increased sole thickness), at an Eopt of 8.9 J and 10.3 J (heel only, and heel + midsole pad, respectively) and an Fopt of 0.80 kN and 0.96 kN, respectively. The 3D-printed shoes consist of two batches characterised by Eopt < and > 7.5 J, due to smaller and thicker strut diameters. All 3D-printed shoes have a large E/Fmax between 7 and 9.5 J/kN.
A cluster of shoes with
E/
Fmax < 3.5 J/kN (
Figure 9) and
xopt < 13.5 mm is considered as shoes with insufficient energy absorption. This cluster consists of the following shoes: Vivobarefoot_Primus Lite (minimalist shoe), Vibram Bikla (minimalist shoe), Bugatti (dress shoe), Adidas Nitrocharge (indoor soccer shoe), Nike ZoomAir (skateboard shoe), INov-8-roadx233, Nike Jordan1 Zoom (worn), Nike HyperVenom (soccer shoe), Adidas Fluidstreet (minimalist shoe, worn), Nike Total90 (soccer shoe), and Brooks Adrenalin. The insufficient energy absorption could have different reasons: (1) the shoes were not designed for energy absorption (soccer and skateboard shoes; minimalist shoes; dress shoes); (2) the shoes were worn regularly for more than one year; or (3) the low energy absorption is an inadvertent effect of the shoe design.
The shoes that were just outside the group of shoes with insufficient energy absorption were Joe Nimble Addict, Nike ZoomHyperfuse, and NewBalance (550 and 1150).
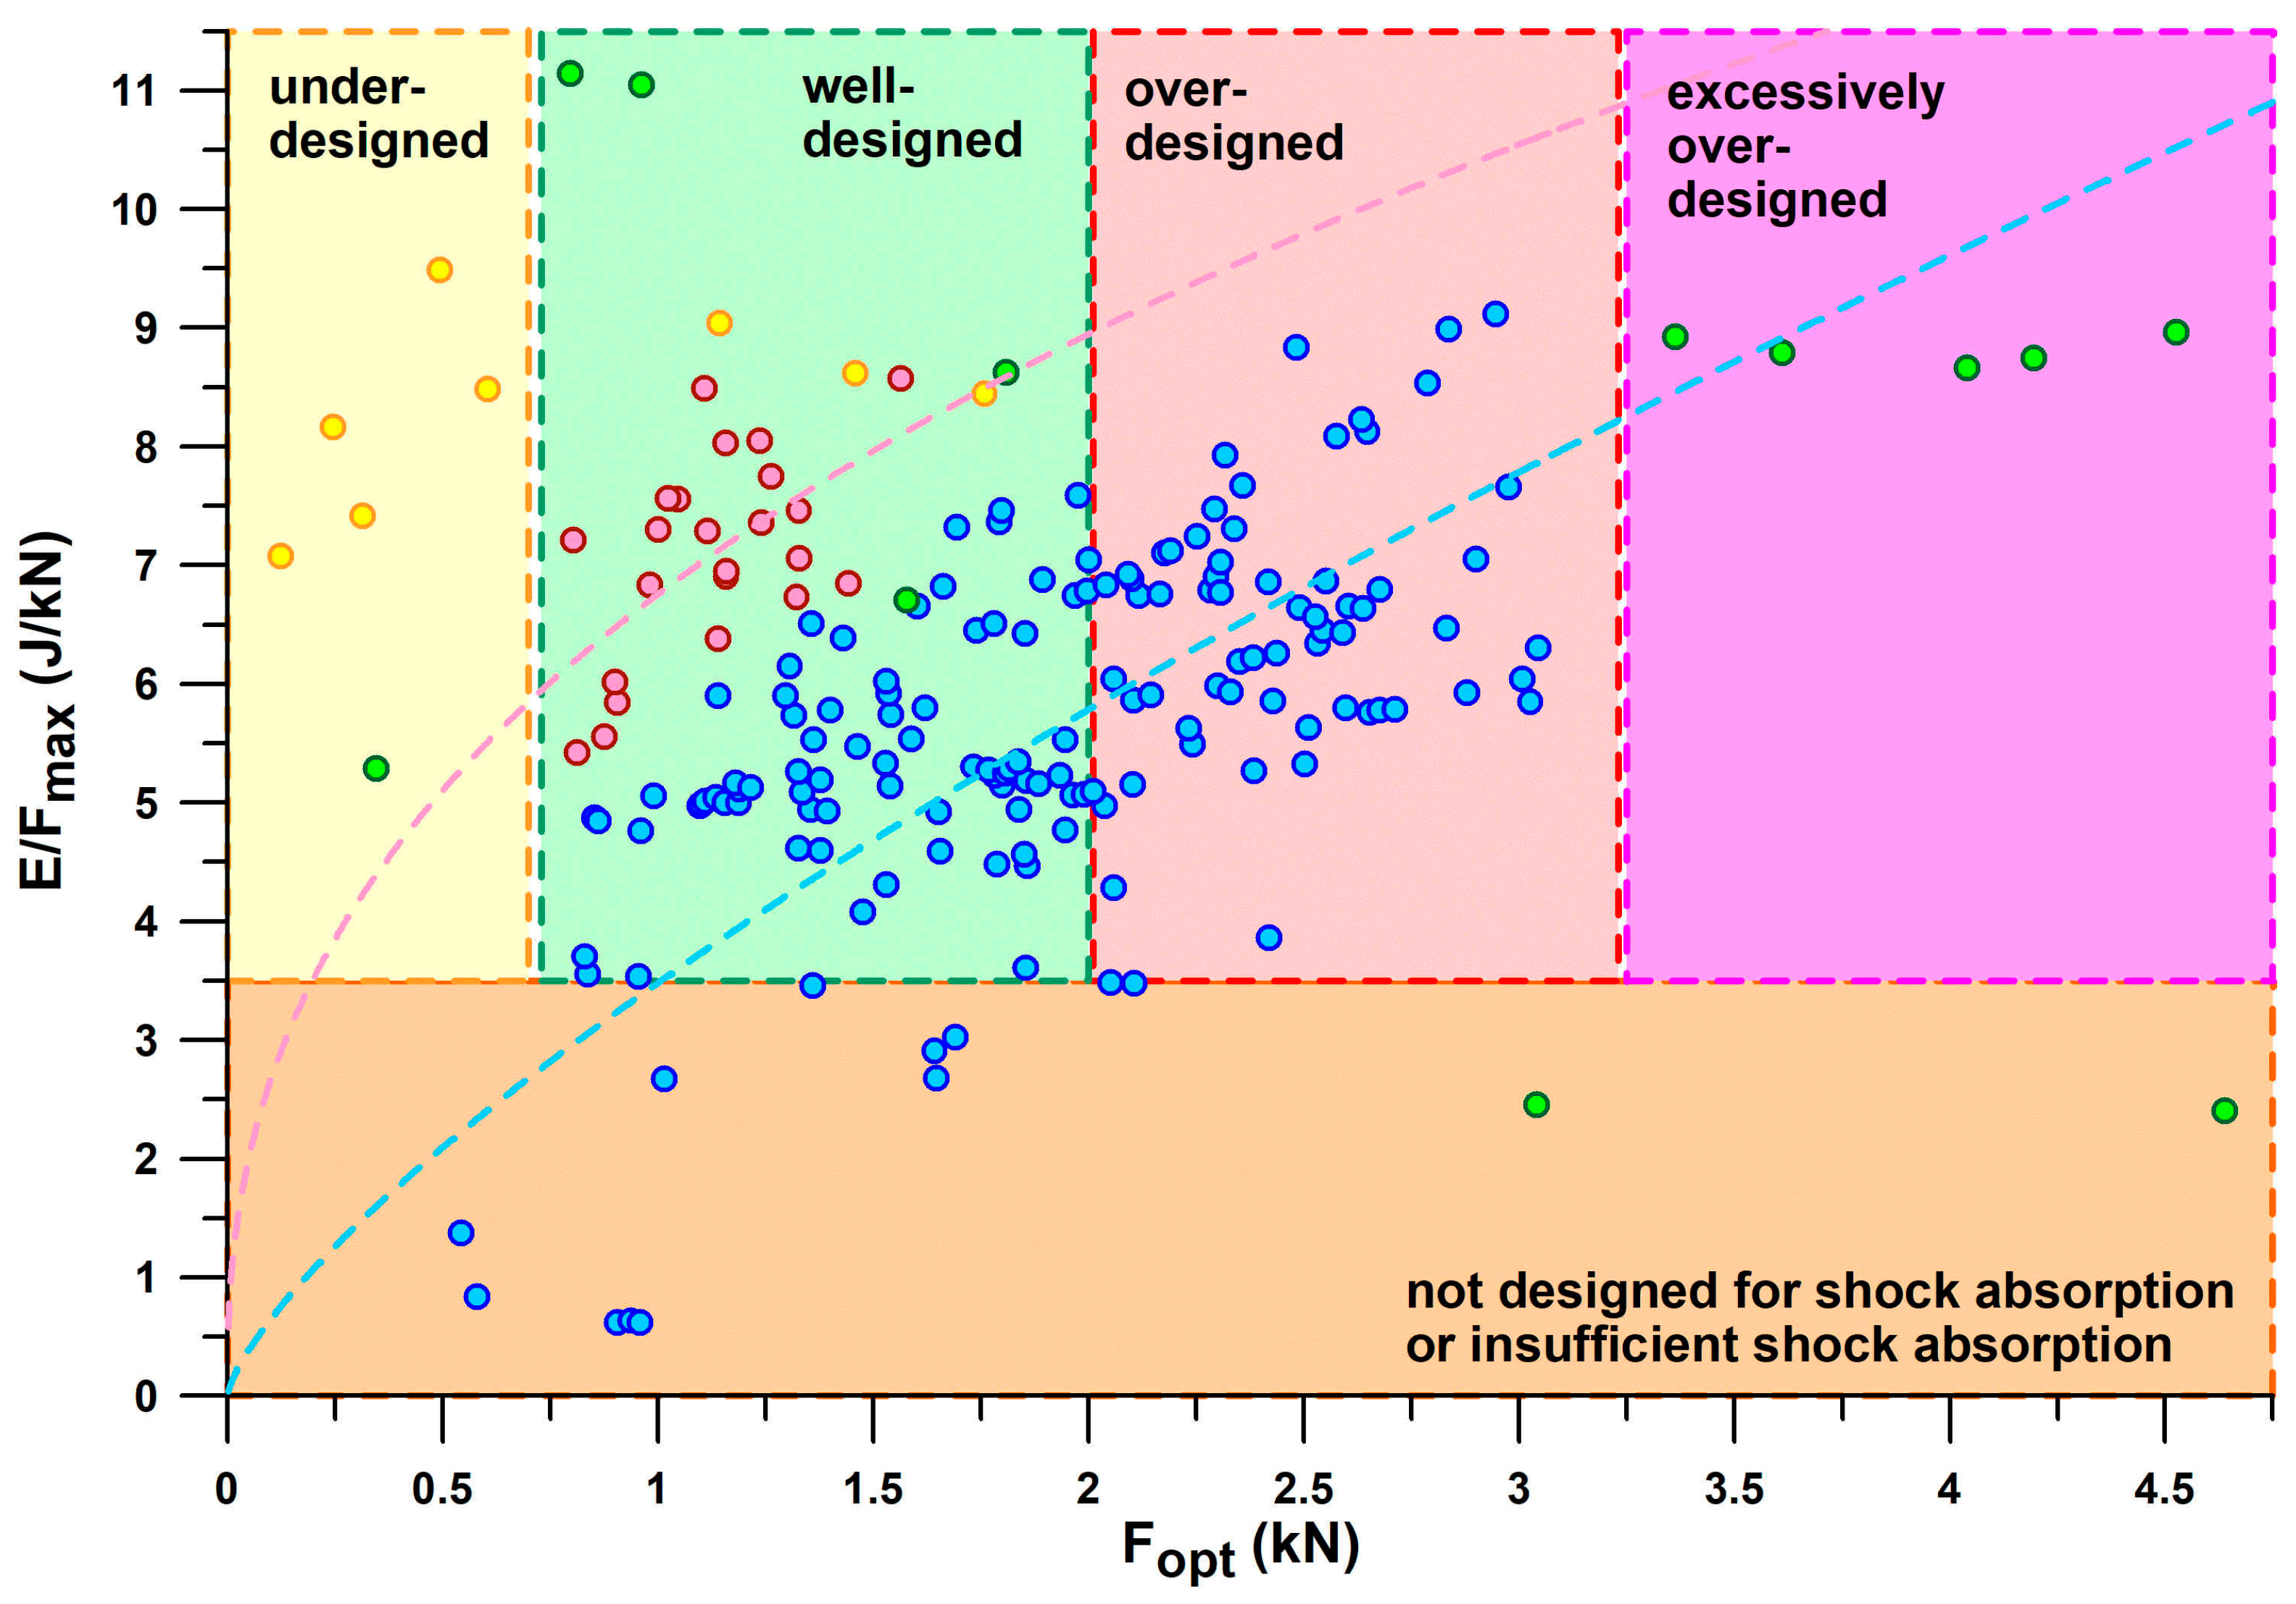
Figure 10 shows
E/
Fmax versus
Fopt, taking the information provided in
Figure 9 one step further. Based on the threshold of
E/
Fmax < 3.5 J/kN to define shoes with insufficient energy absorption, and the window of the first peak force (
PF1) of the vertical ground reaction force during running, the shoes can be further classified.
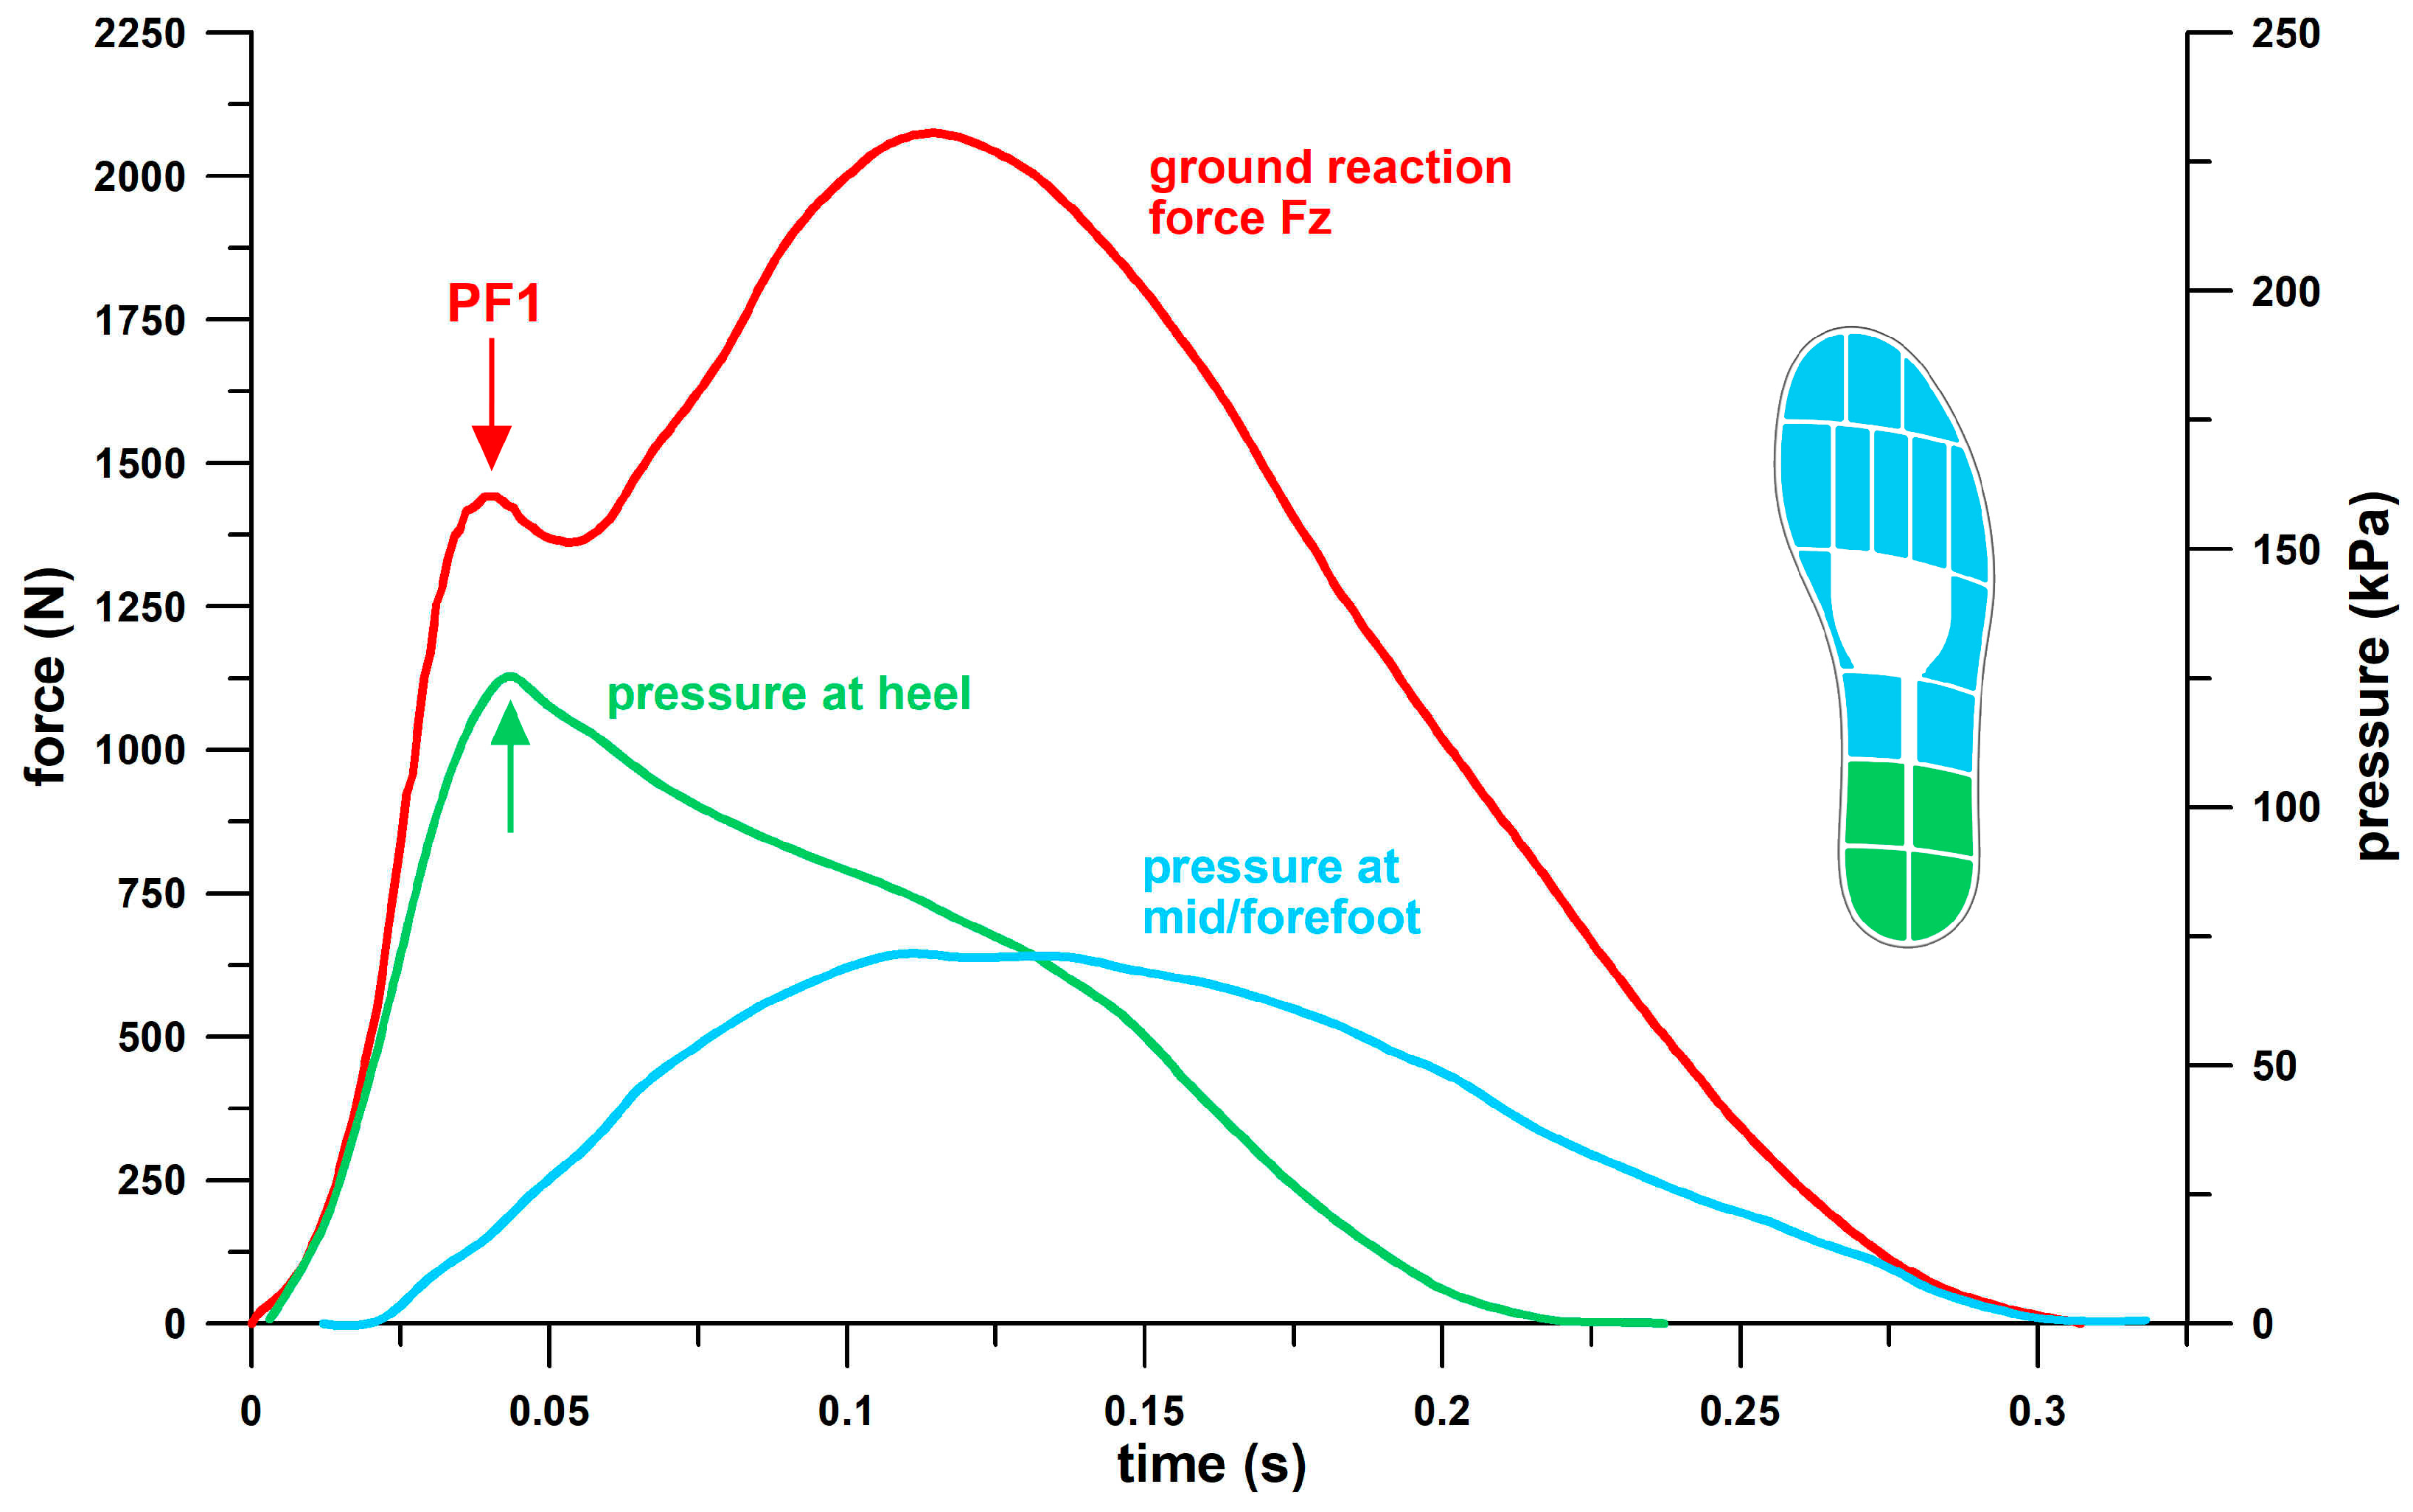
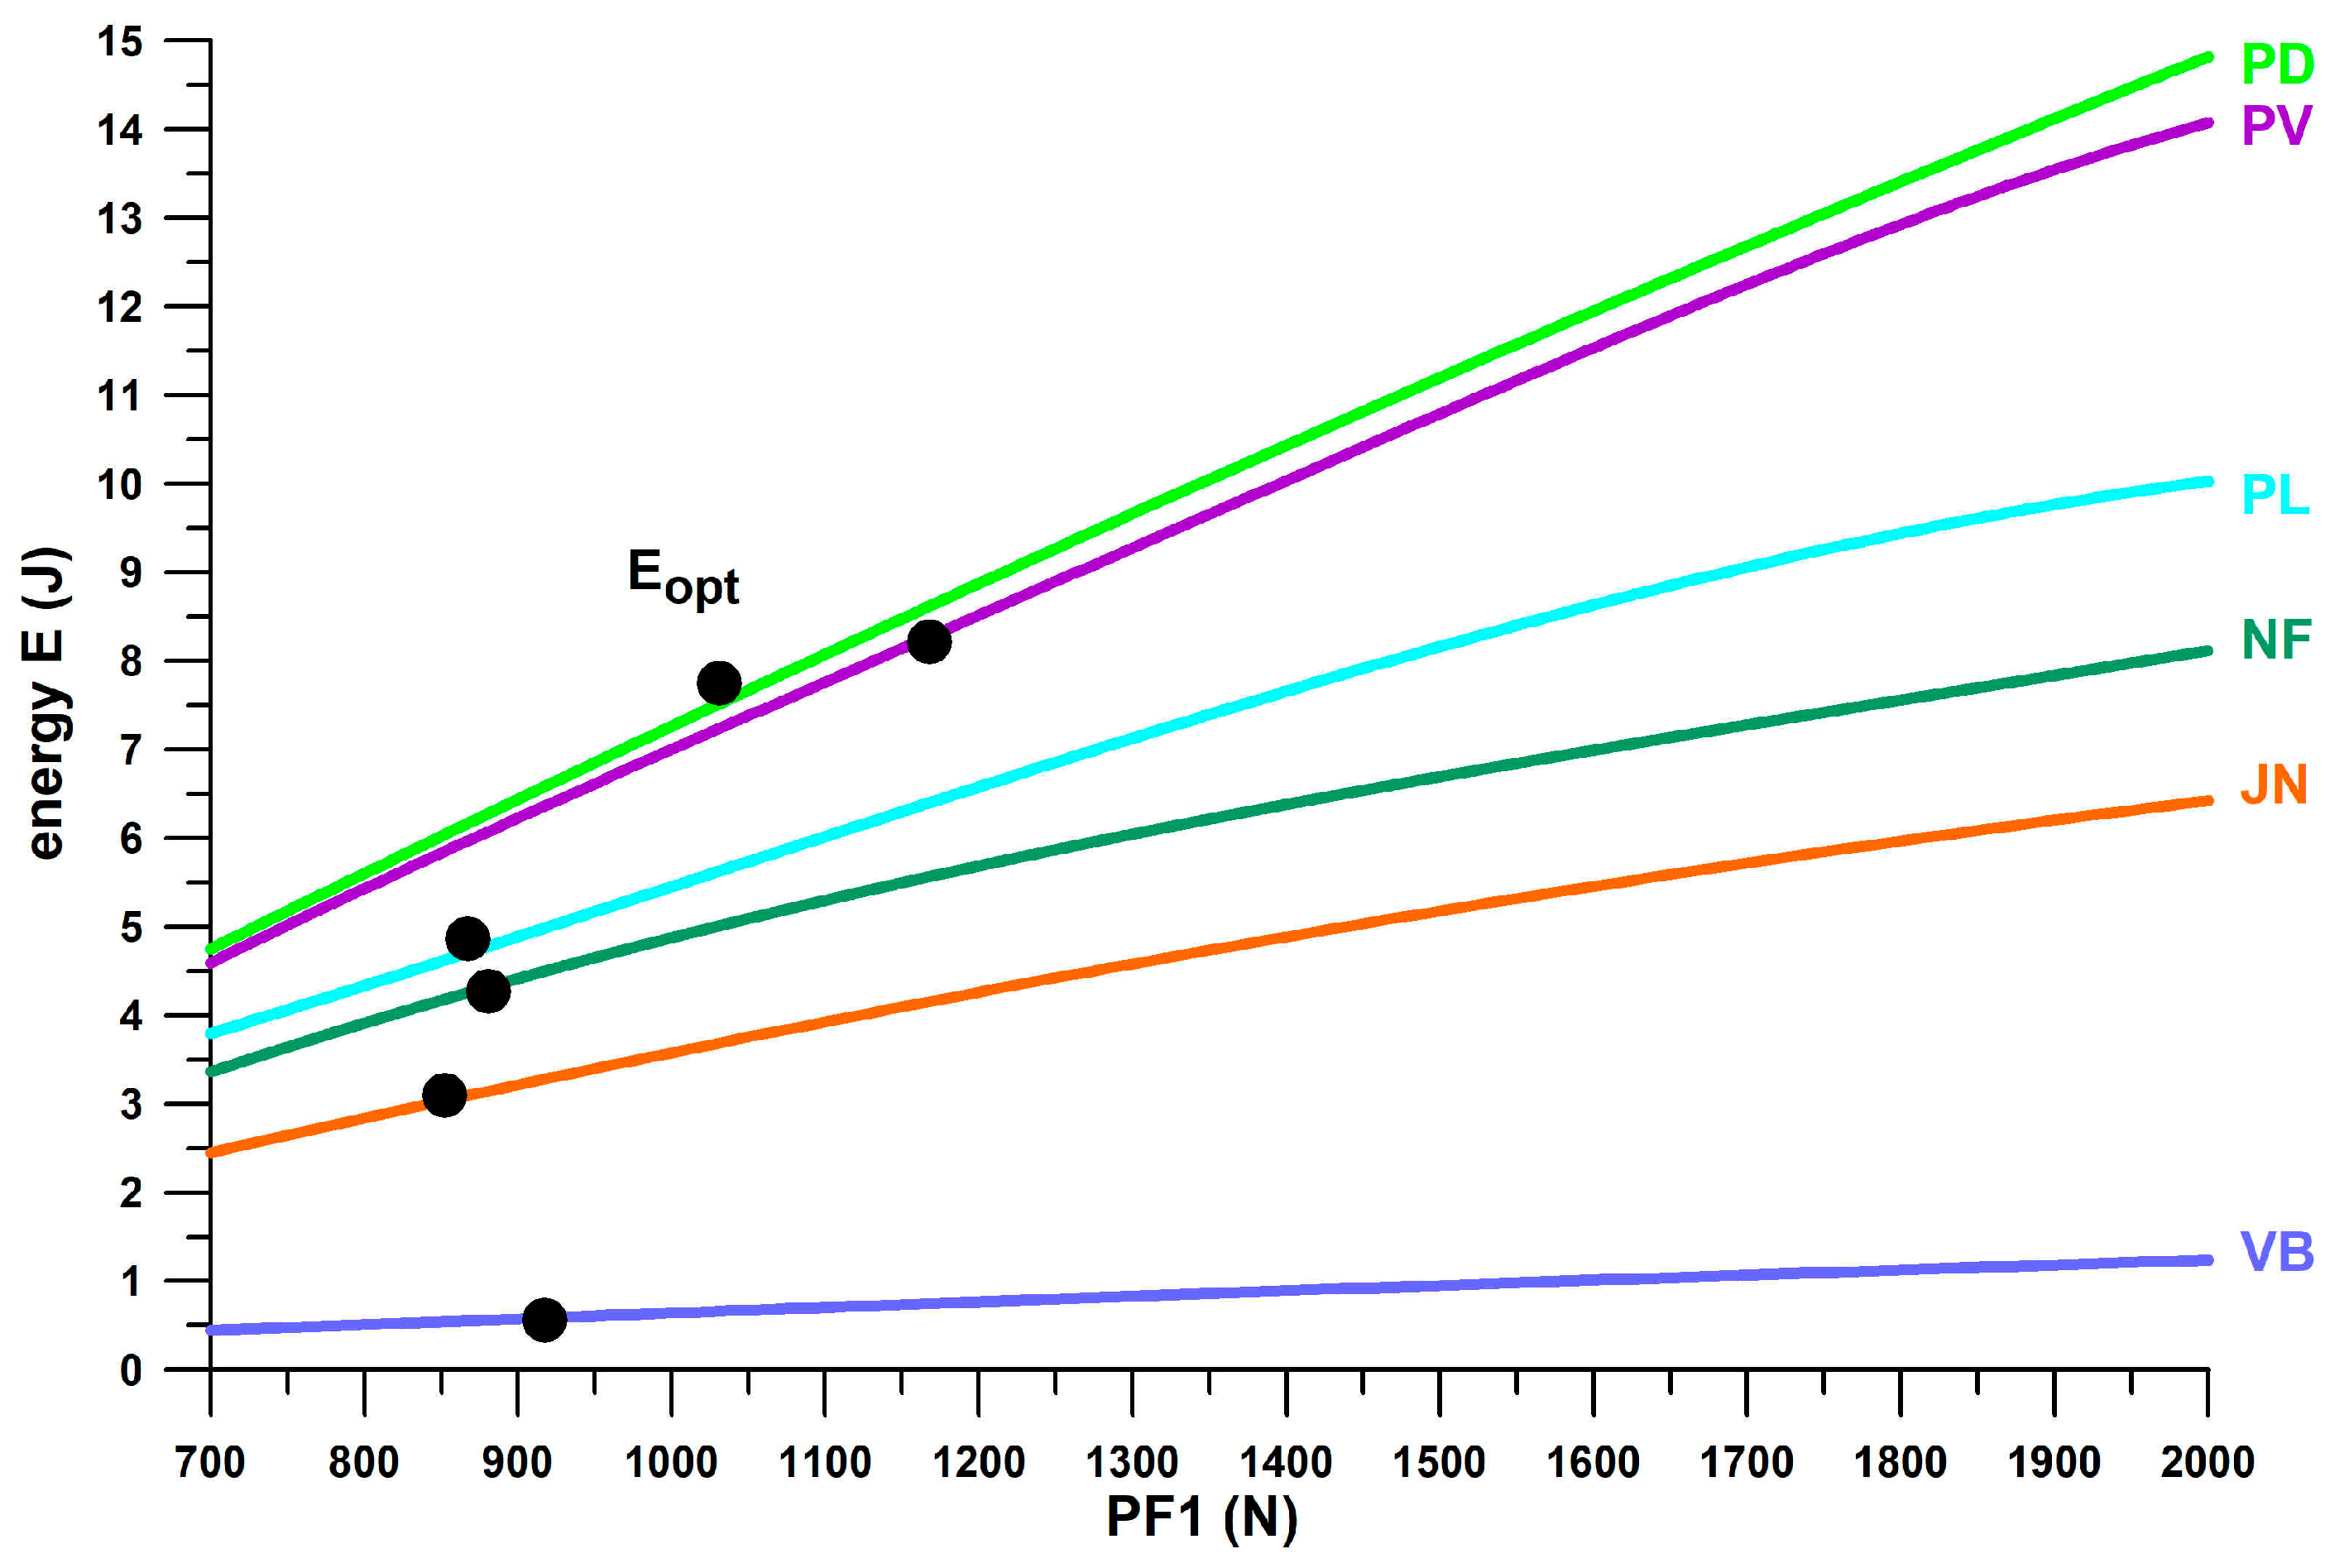
PF1 ranged from 0.69–1.97 kN (1.17 ± 0.28 kN) during valid heel strikes of the participants studied. Based on these limits (0.7 and 2 kN), we can define a shoe range suitable for well-designed heel segments for running. Well-designed means that
PF1 is close to
Fopt within this range, depending on body weight, running motion (within the heel-striker cohort), and running speed. Shoes with Fopt < 0.7 kN are under-designed (first batch of 3D-printed shoe soles with thinner struts; also Nike Airmax 270 with a perforated bladder), which leads to running after the shoulder point, where energy absorber densifies and eventually maxes out. Heels with 2 kN <
Fopt < 3.2 kN are over-designed, leading to running before the shoulder point and thus the runner cannot reach this optimum point. This means that runners run at
E/
F values smaller than the
E/
Fmax value. Heels with
Fopt > 3.2 kN are excessively over-designed, which only applies to Adidas Bounce Tube shoes. The classification of the shoes into under-, well-, and over-designed heel segments only applies to the group of participants studied (body mass: 68.4 ± 10.4 kg, range 47–91.8 kg), who were normal-weight recreational runners. As will be shown later in this document, runners with a higher body mass run with a higher
PF1.
If only shoes that are in the range of well-designed heel segments (0.7 kN <
Fopt < 2.0 kN) are considered, the best-performing shoes of the major sports shoe manufacturers examined (
Figure 11), from largest best to smallest best
E/
Fmax per manufacturer, are as follows:
Puma: Rulebreaker, E/Fmax = 11.05–11.14 (J/kN).
Nike: Airmax, E/Fmax = 8.63 (J/kN).
Brooks: Ghost15, E/Fmax = 7.75 (J/kN).
Mizuno: Wave Rider, E/Fmax = 7.59 (J/kN) for Fopt < 2 kN. The largest E/Fmax of WaveElixir4, namely 8.09, is not applicable, as the shoe is over-designed (Fopt > 2 kN), which means that runners cannot reach the shoulder point.
Adidas: Yeezy Slide at the lower limit of the PF1 range with an E/Fmax of 7.21 (J/kN); the largest E/Fmax of Bounce Tube shoes ranging from 8.54 to 8.97 (no other Adidas shoe within this range) is not applicable, as these shoes are excessively over-designed (Fopt > 3.2 kN).
Asics: Nimbus, E/Fmax = 6.66; Gel Kayano17 with the largest E/Fmax of 7.1–9.12 (no other Asics shoe within this range) is not applicable as the shoe is over-designed (Fopt > 2 kN).
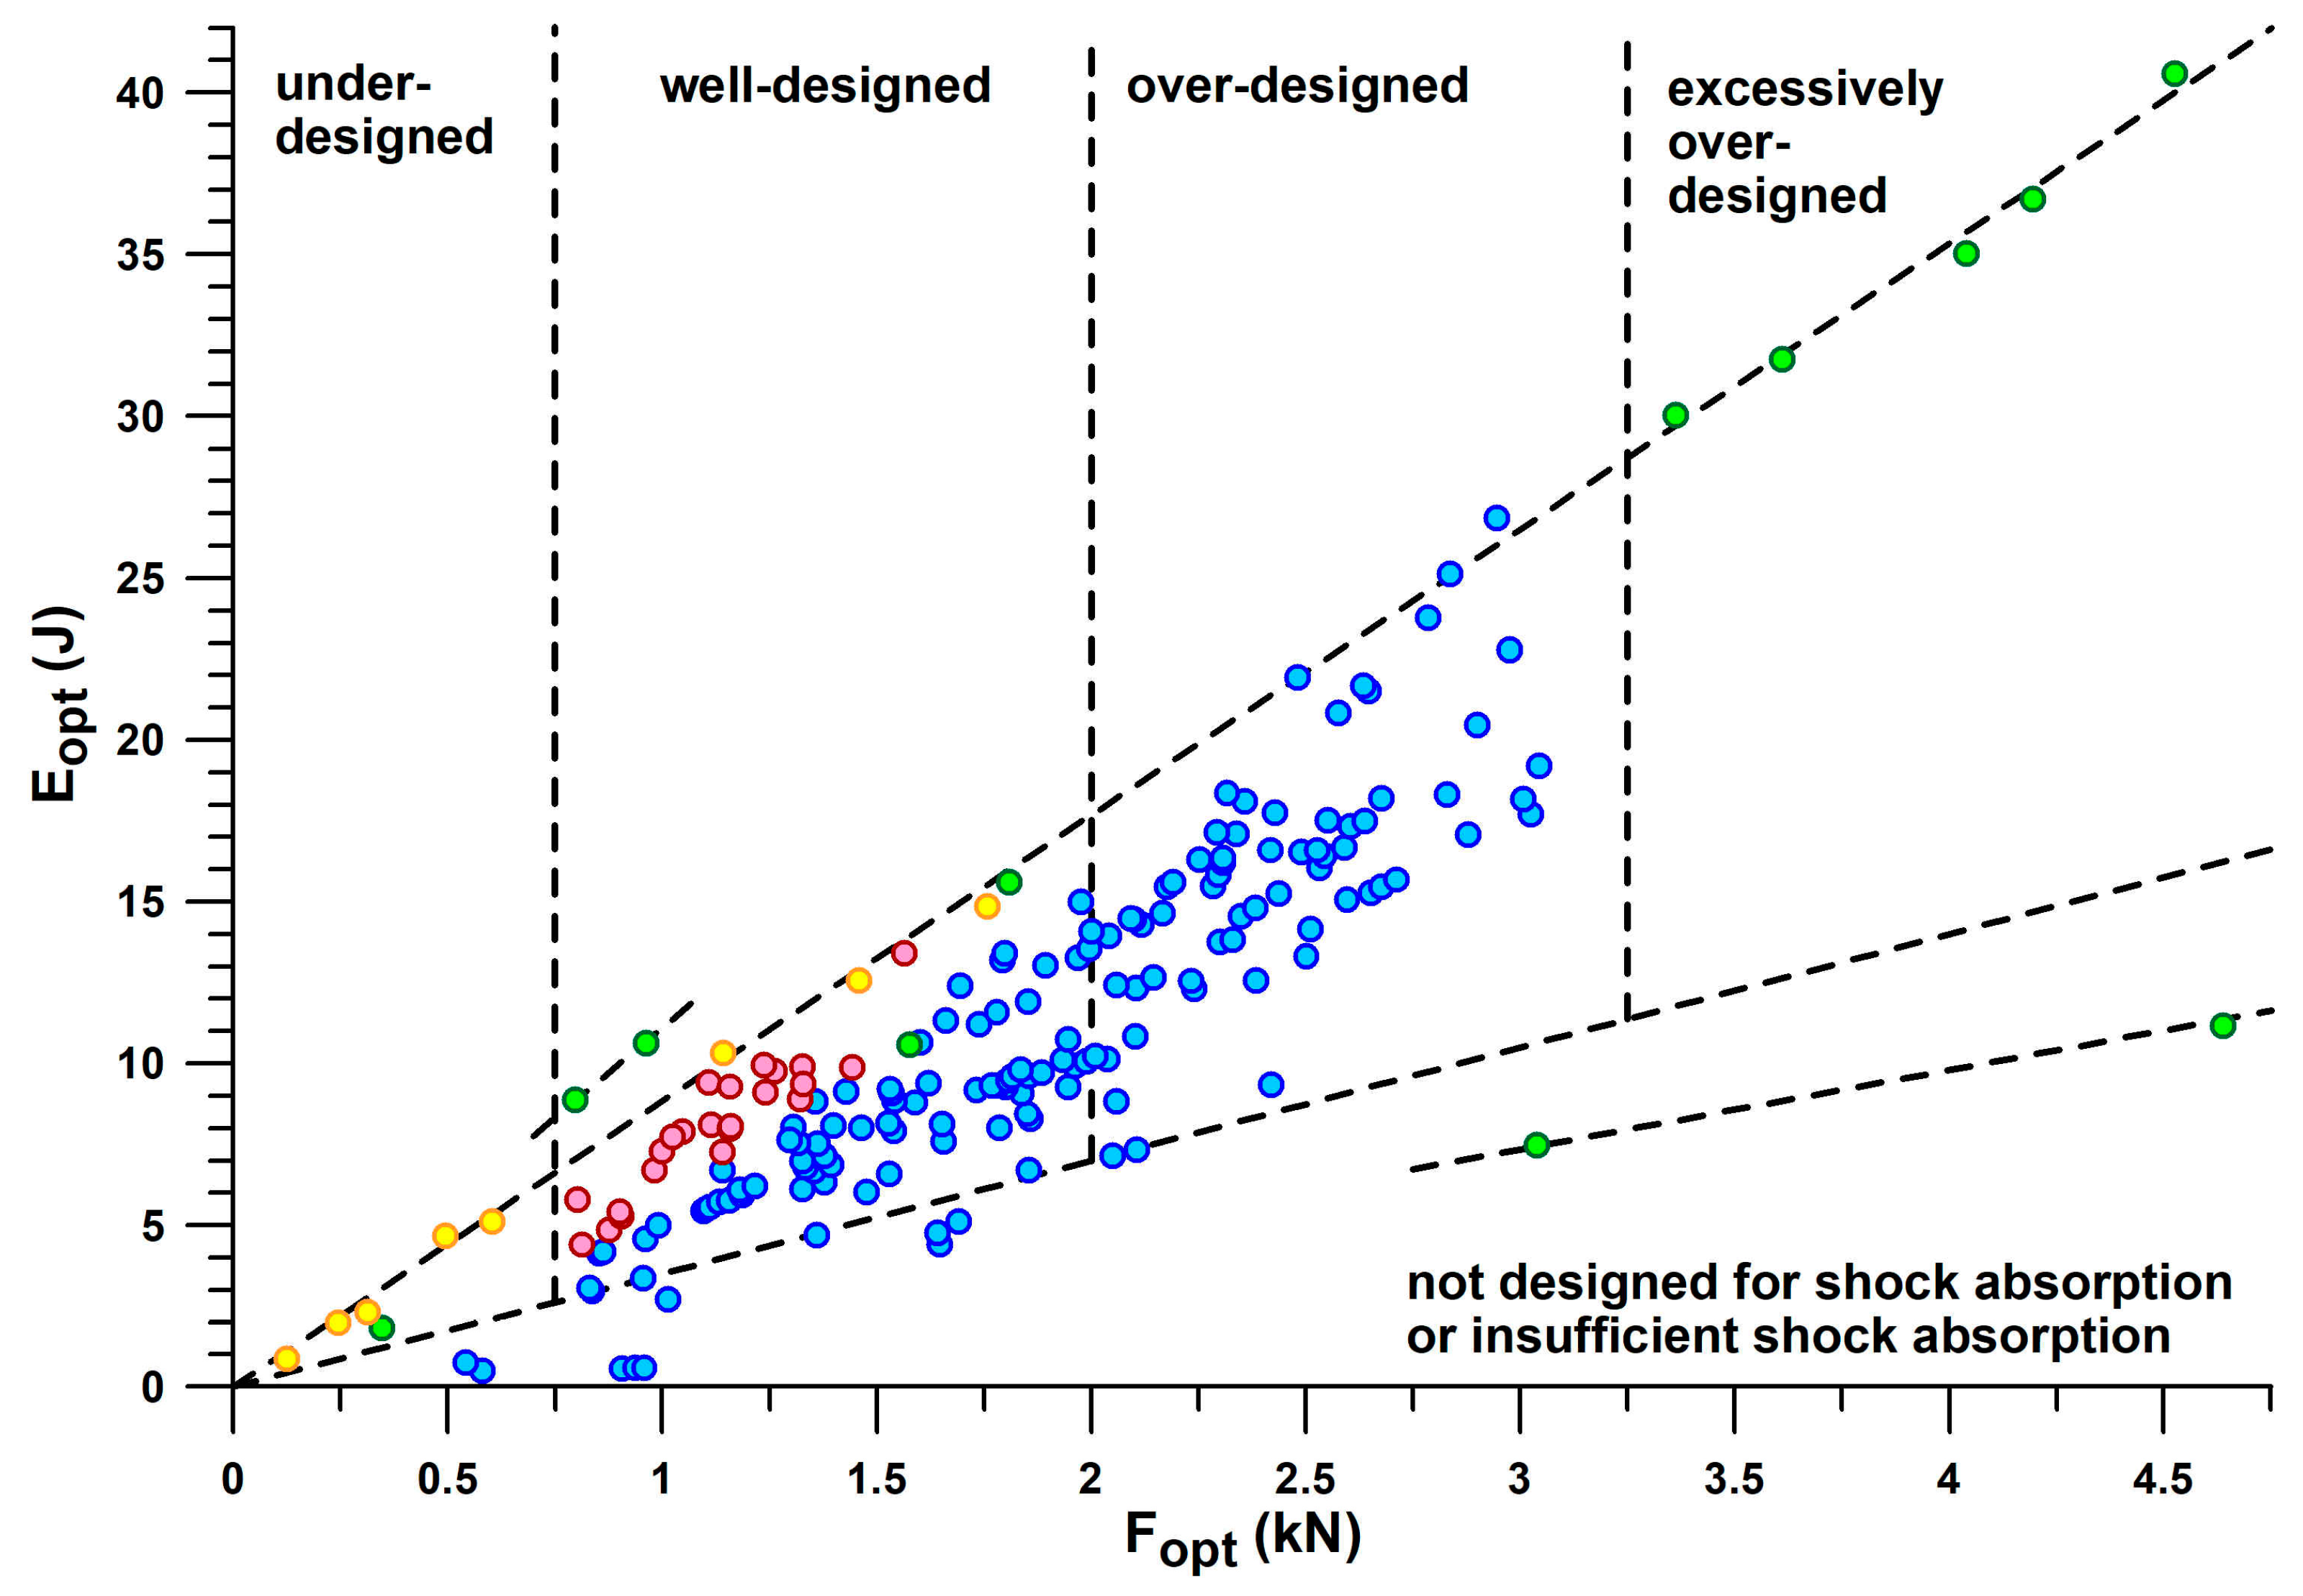
Figure 12 combines the information contained in
Figure 10 and
Figure 11 individually by plotting
Eopt vs.
Fopt, which reflects the mechanical principle that the greater the force applied to a shock absorber, the more energy is absorbed. Any straight line through the origin of the graph shown in
Figure 12 has a slope equal to
E/
Fmax. Shoes located on steeper lines have a better energy absorption at the heel sole. The advantage of
Figure 12 is that it graphically reduces the
E/
Fmax-variation of 3D-printed soles, CEP Omnispeed (prototype 5), Nike Airmax, Asics Gel Kayano 17 and Adidas Bounce Tube shoes, so that they appear to lie on a line of
E/
Fmax ≈ 8.834 J/kN.
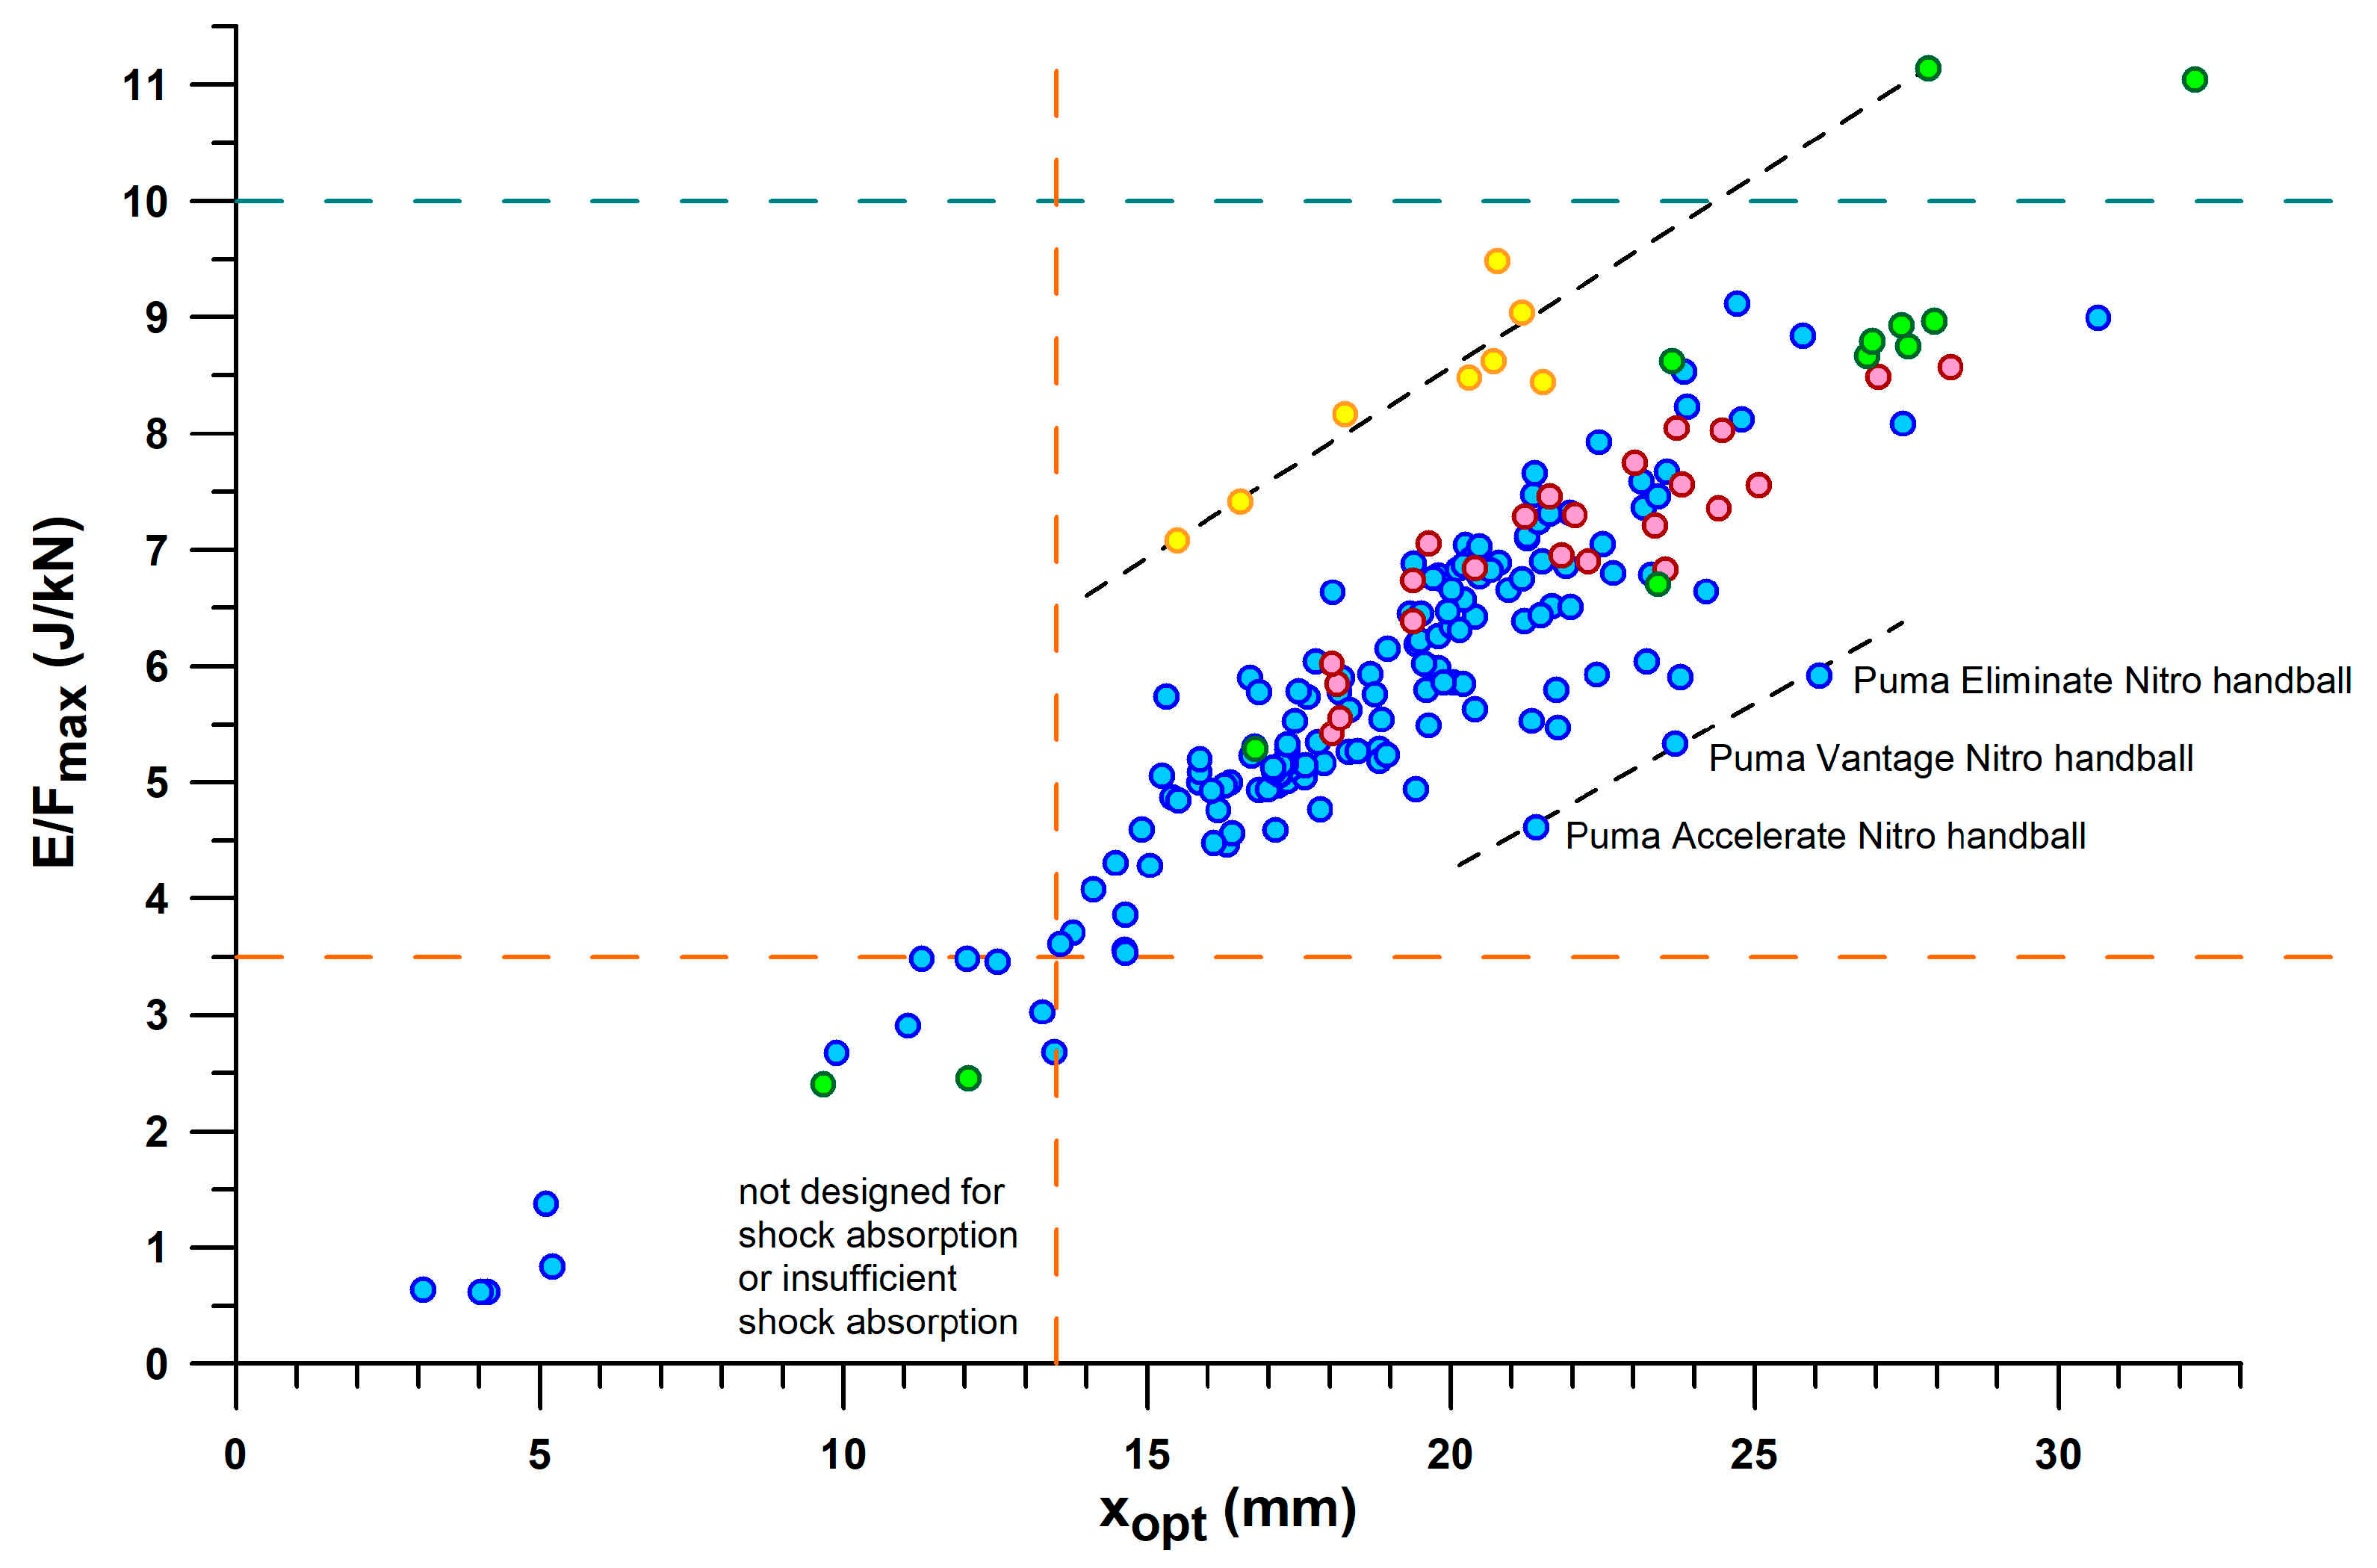
Figure 13 shows the plot of
E/
Fmax vs.
xopt. Any straight line through the origin of the graph (
Figure 13) has a slope equal to
E/
Fmax/
xopt. This diagram adds another dimension to the shoulder point parameters. While the shoes of main and secondary lines now overlap, other shoes are separated from the two lines, namely 3D-printed shoes with the largest ratio of
E/
Fmax to
xopt, which deflect less than other shoes with the same
E/
Fmax (this also includes the Puma Rulebreaker shoe, heel only, without midsole pad). Another sequence of three shoes at the lower end of
E/
Fmax/
xopt have a common feature: they are all Puma handball shoes which deflect more than other shoes with the same
E/
Fmax. The separation of the cluster of shoes with inadequate energy absorption, defined above by
E/
Fmax < 3.5 J/kN (
Figure 9)
and xopt < 13.5 mm, is now clearly visible in
Figure 13.
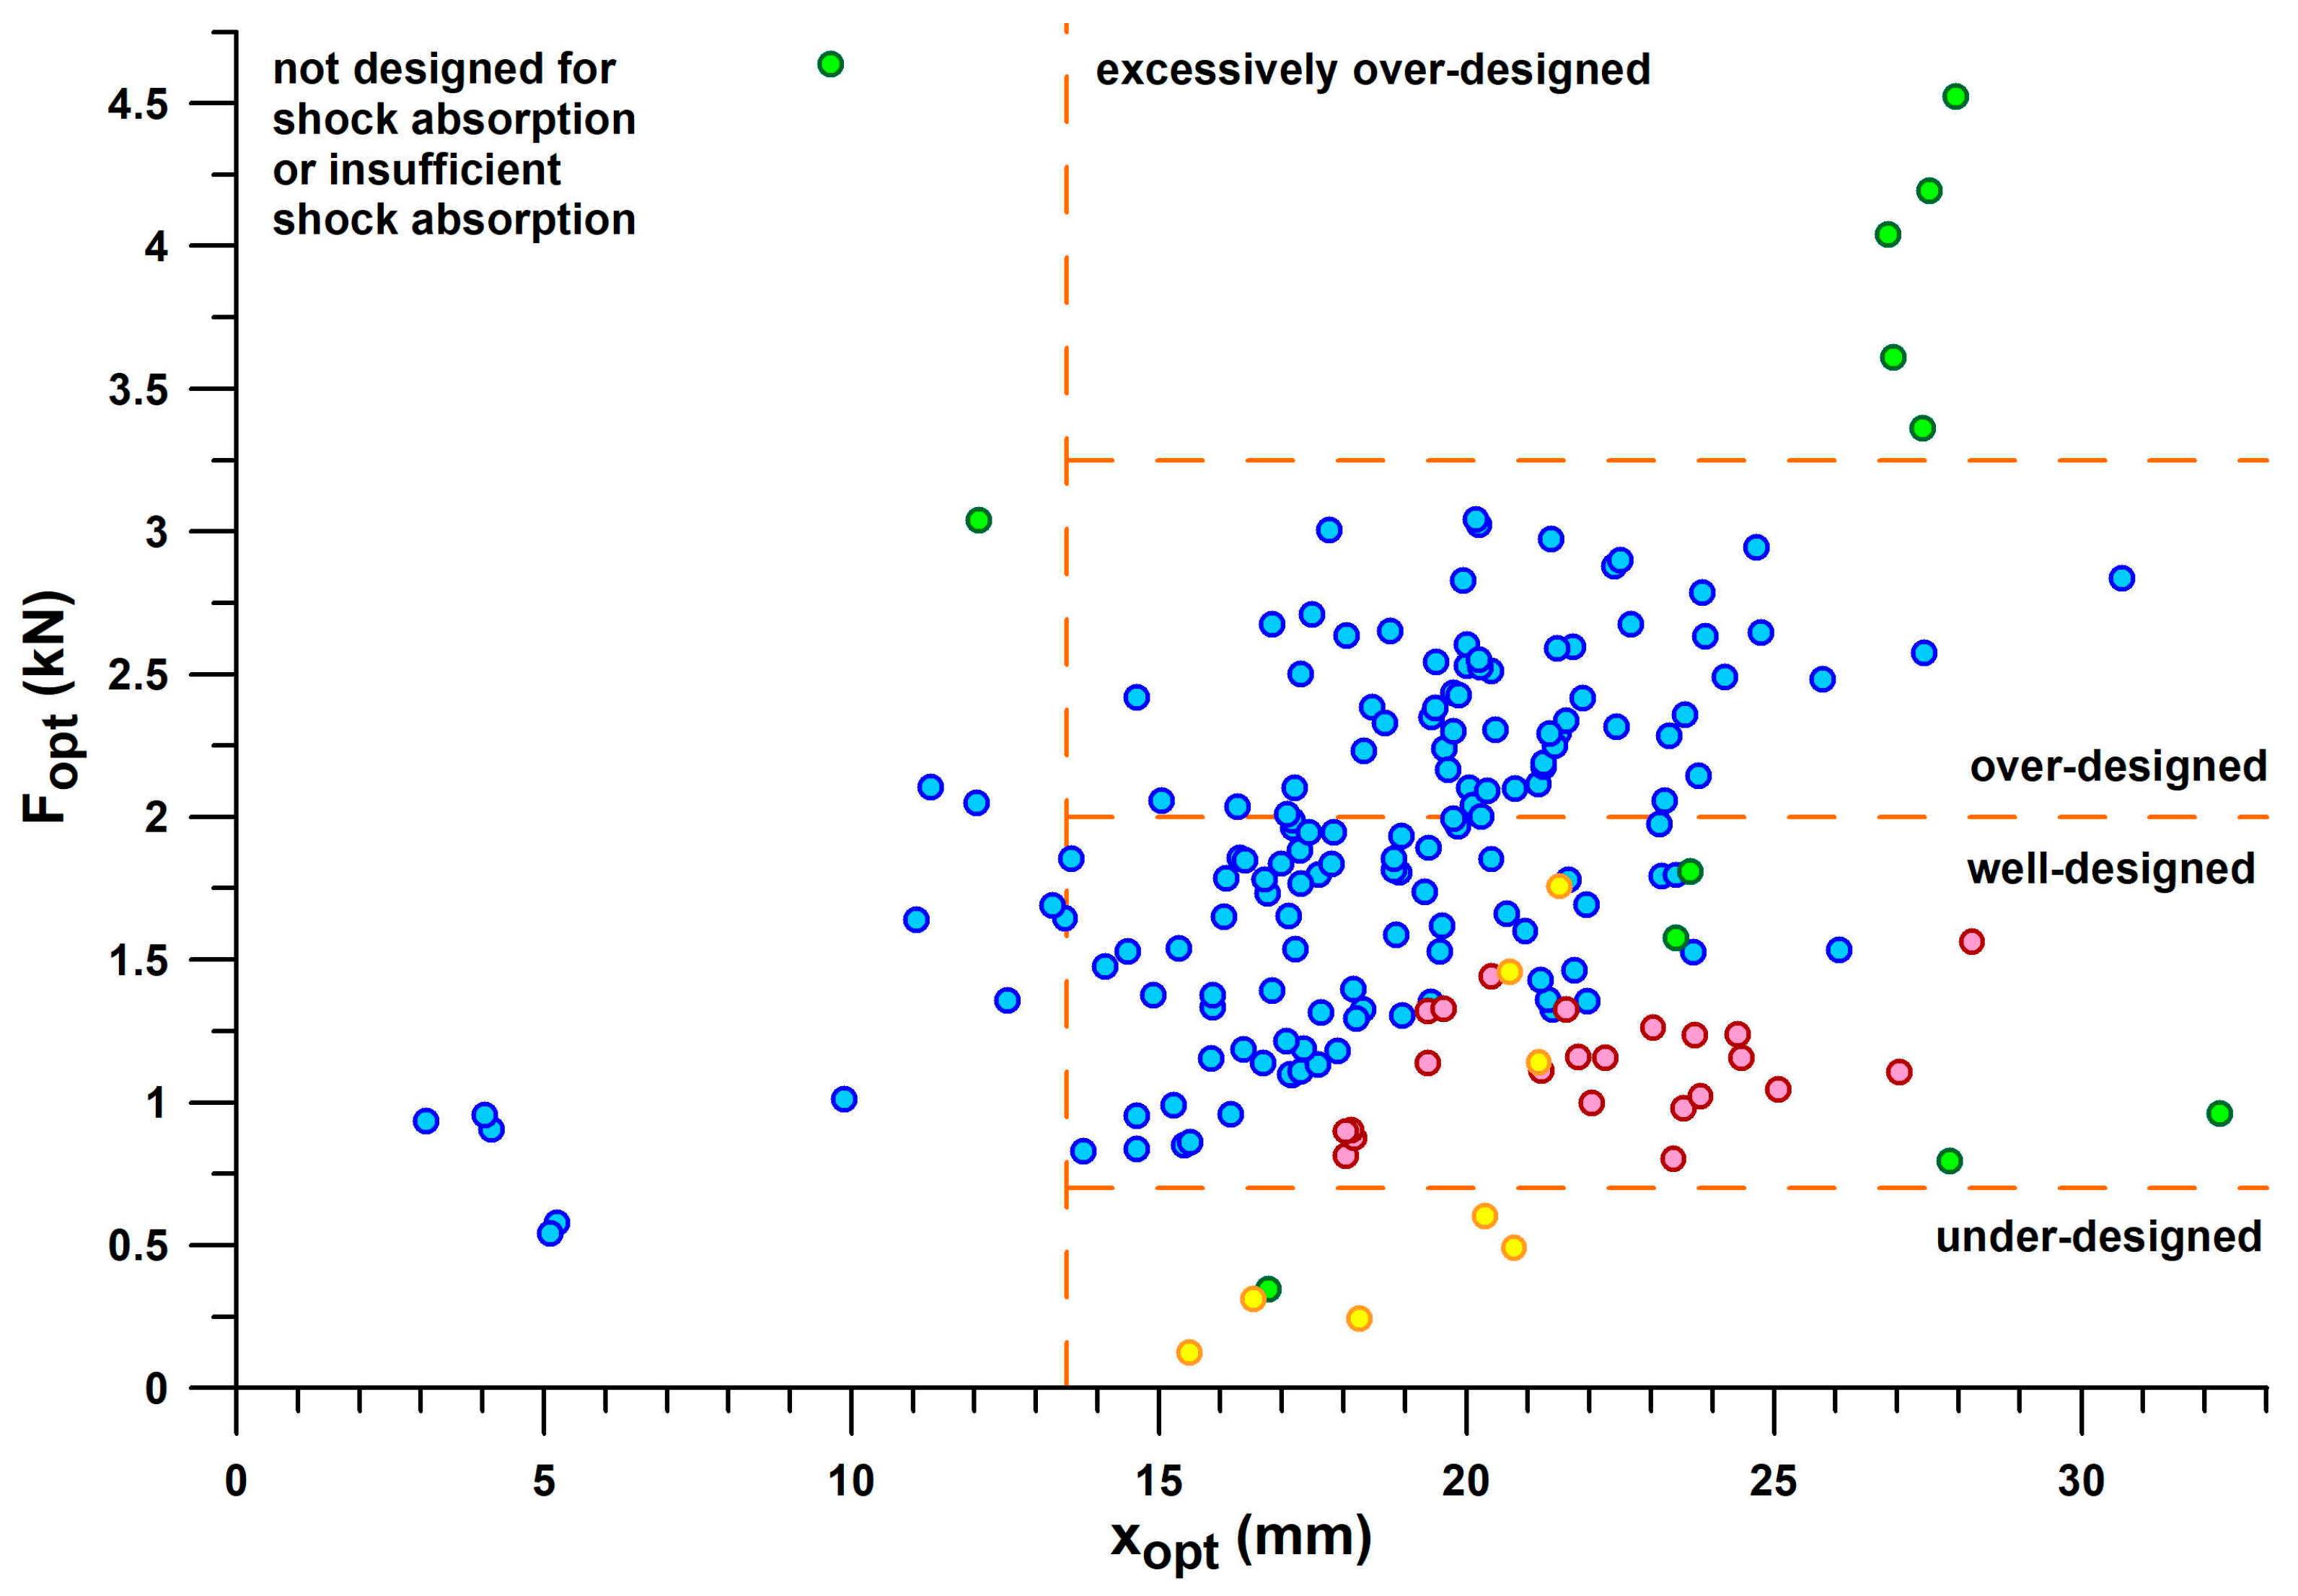
Figure 14 shows the plot of
Fopt vs.
xopt. This graph divides the shoes into clusters with insufficient energy absorption (
xopt < 13.5 mm) and the bulk of shoes, and the latter, in turn, into sections with under-designed, well-designed, and over-designed heel segments. It also shows that the maximum
xopt (>30 mm) is shared by two shoes, Puma Rulebreaker shoe (heel plus midsole pad) with
xopt of 32.2 mm, and Asics Gel Kayano 17 with
xopt of 30.7 mm. At approximately the same
xopt, Asics Gel Kayano 17 produces an
Fopt three times higher than the Puma Rulebreaker.
Comparing minimalist shoes to maximalist shoes (
Figure 15), it appears that
E/
Fmax and
xopt, and
Eopt correlate well (R
2 > 0.92) with the minimalist index and the stack height, but not with
Fopt (R
2 < 0.46). The minimalist index correlated well with the stack height (R
2 = 0.9533). From the Kruskal–Wallis statistic and the post–hoc Conover
p-values,
E/
Fmax (
Figure 15a) was significantly different in all six shoes (
p < 0.0004). For
Eopt (
Figure 15b) there was no significant difference between Puma Velocity and Puma DeviateElite (
p = 0.3228); all other shoes were significantly different (
p < 0.0092). For
Fopt (
Figure 15c), there was no significant difference between Puma Velocity and Puma DeviateElite (
p = 0.1899, although their IQRs only slightly overlapped), and the remaining four shoes (0.0588 <
p < 0.7708). In both
Eopt and
Fopt, the means and averages of Puma DeviateElite were smaller than those of Puma Velocity, although not significantly different. For
xopt (
Figure 15d), there was no significant difference between Puma Velocity and Puma DeviateElite (
p = 0.4112); all other shoes were significantly different (
p < 0.0025).
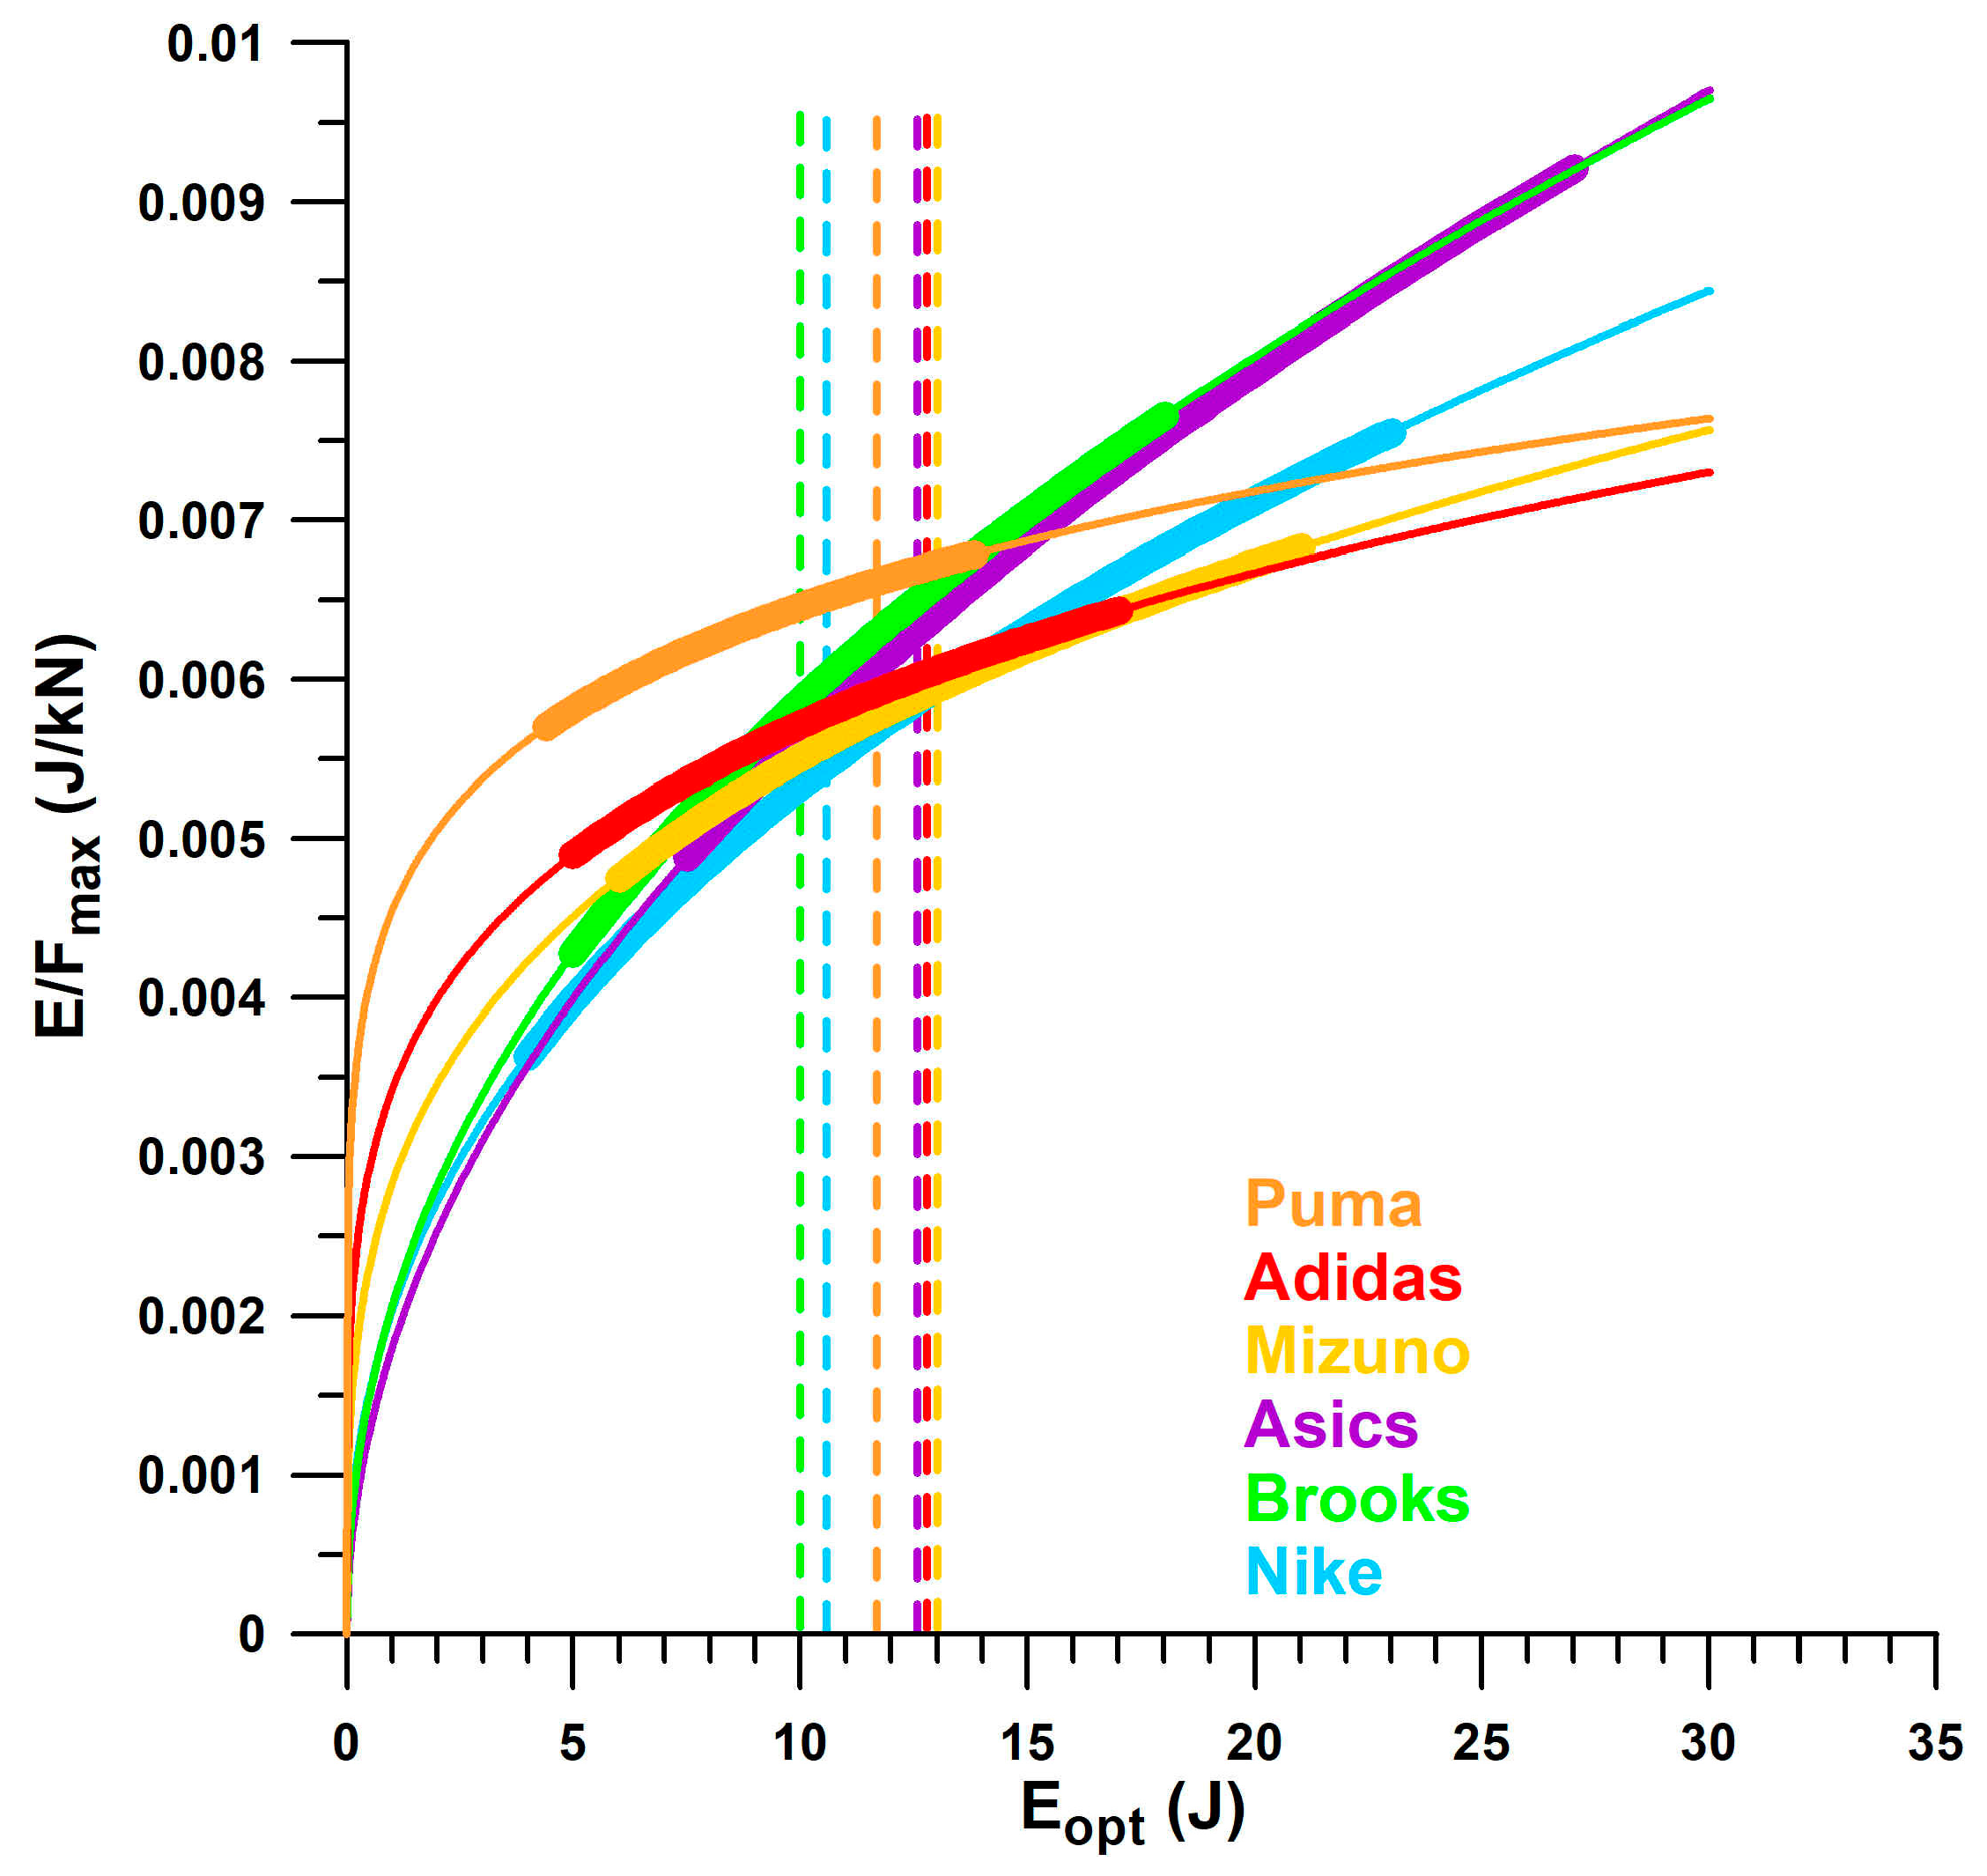
Of the six major companies identified in
Table 1, Asics and Brooks shoes show the same trend of
E/
Fmax vs.
Eopt, while Nike shoes show a slightly smaller
E/
Fmax with a larger
Eopt (
Figure 16). Likewise, Puma, Adidas, and Mizuno share the same trend, with Puma shoes showing on average a 10% to 20% higher
E/
Fmax than Adidas and Mizuno, between 5 J ≤
Eopt ≤ 15 J. Vertical lines mark the beginning of over-designed heels, i.e., from
Fopt ≈ 2 kN. Puma shoes had the smallest
Eopt range within the window of 2 kN ≤
Fopt ≤ 3 kN, while Asics had the widest (i.e., maximum number of over-designed shoes). Of all the shoe models tested across the six major companies, Asics shoes had the lowest number of well-designed heel soles (54%), while Puma had the highest number (93%). In addition, Puma shoes have, on average, the largest
E/
Fmax value within the well-designed range.
3.8. First Peak of the Vertical Ground Reaction Force and Its Relationship to the Forgiveness Range
Figure 24 shows the distribution of the first peak force,
PF1, across six shoes and two velocity groups of heel strikers. The medians of
PF1 when participants ran at 10 kph were generally smaller than those when running at individual speed (9.3–13.3 kph). For both speed groups, the significantly different pairs were (Friedman test, and post–hoc Dunn–Bonferroni test): 10 kph: the medians of Vivobarefoot and Nike Free were significantly smaller than those of Puma Deviate (both at
p = 0.017); individual speed: the median of Vivobarefoot was significantly smaller than that of Joe Nimble (
p = 0.047); and the median of Nike Free was significantly smaller than those of Joe Nimble (
p < 0.001) and Puma Deviate (
p = 0.001). All other pairs showed no significant difference.
When plotting
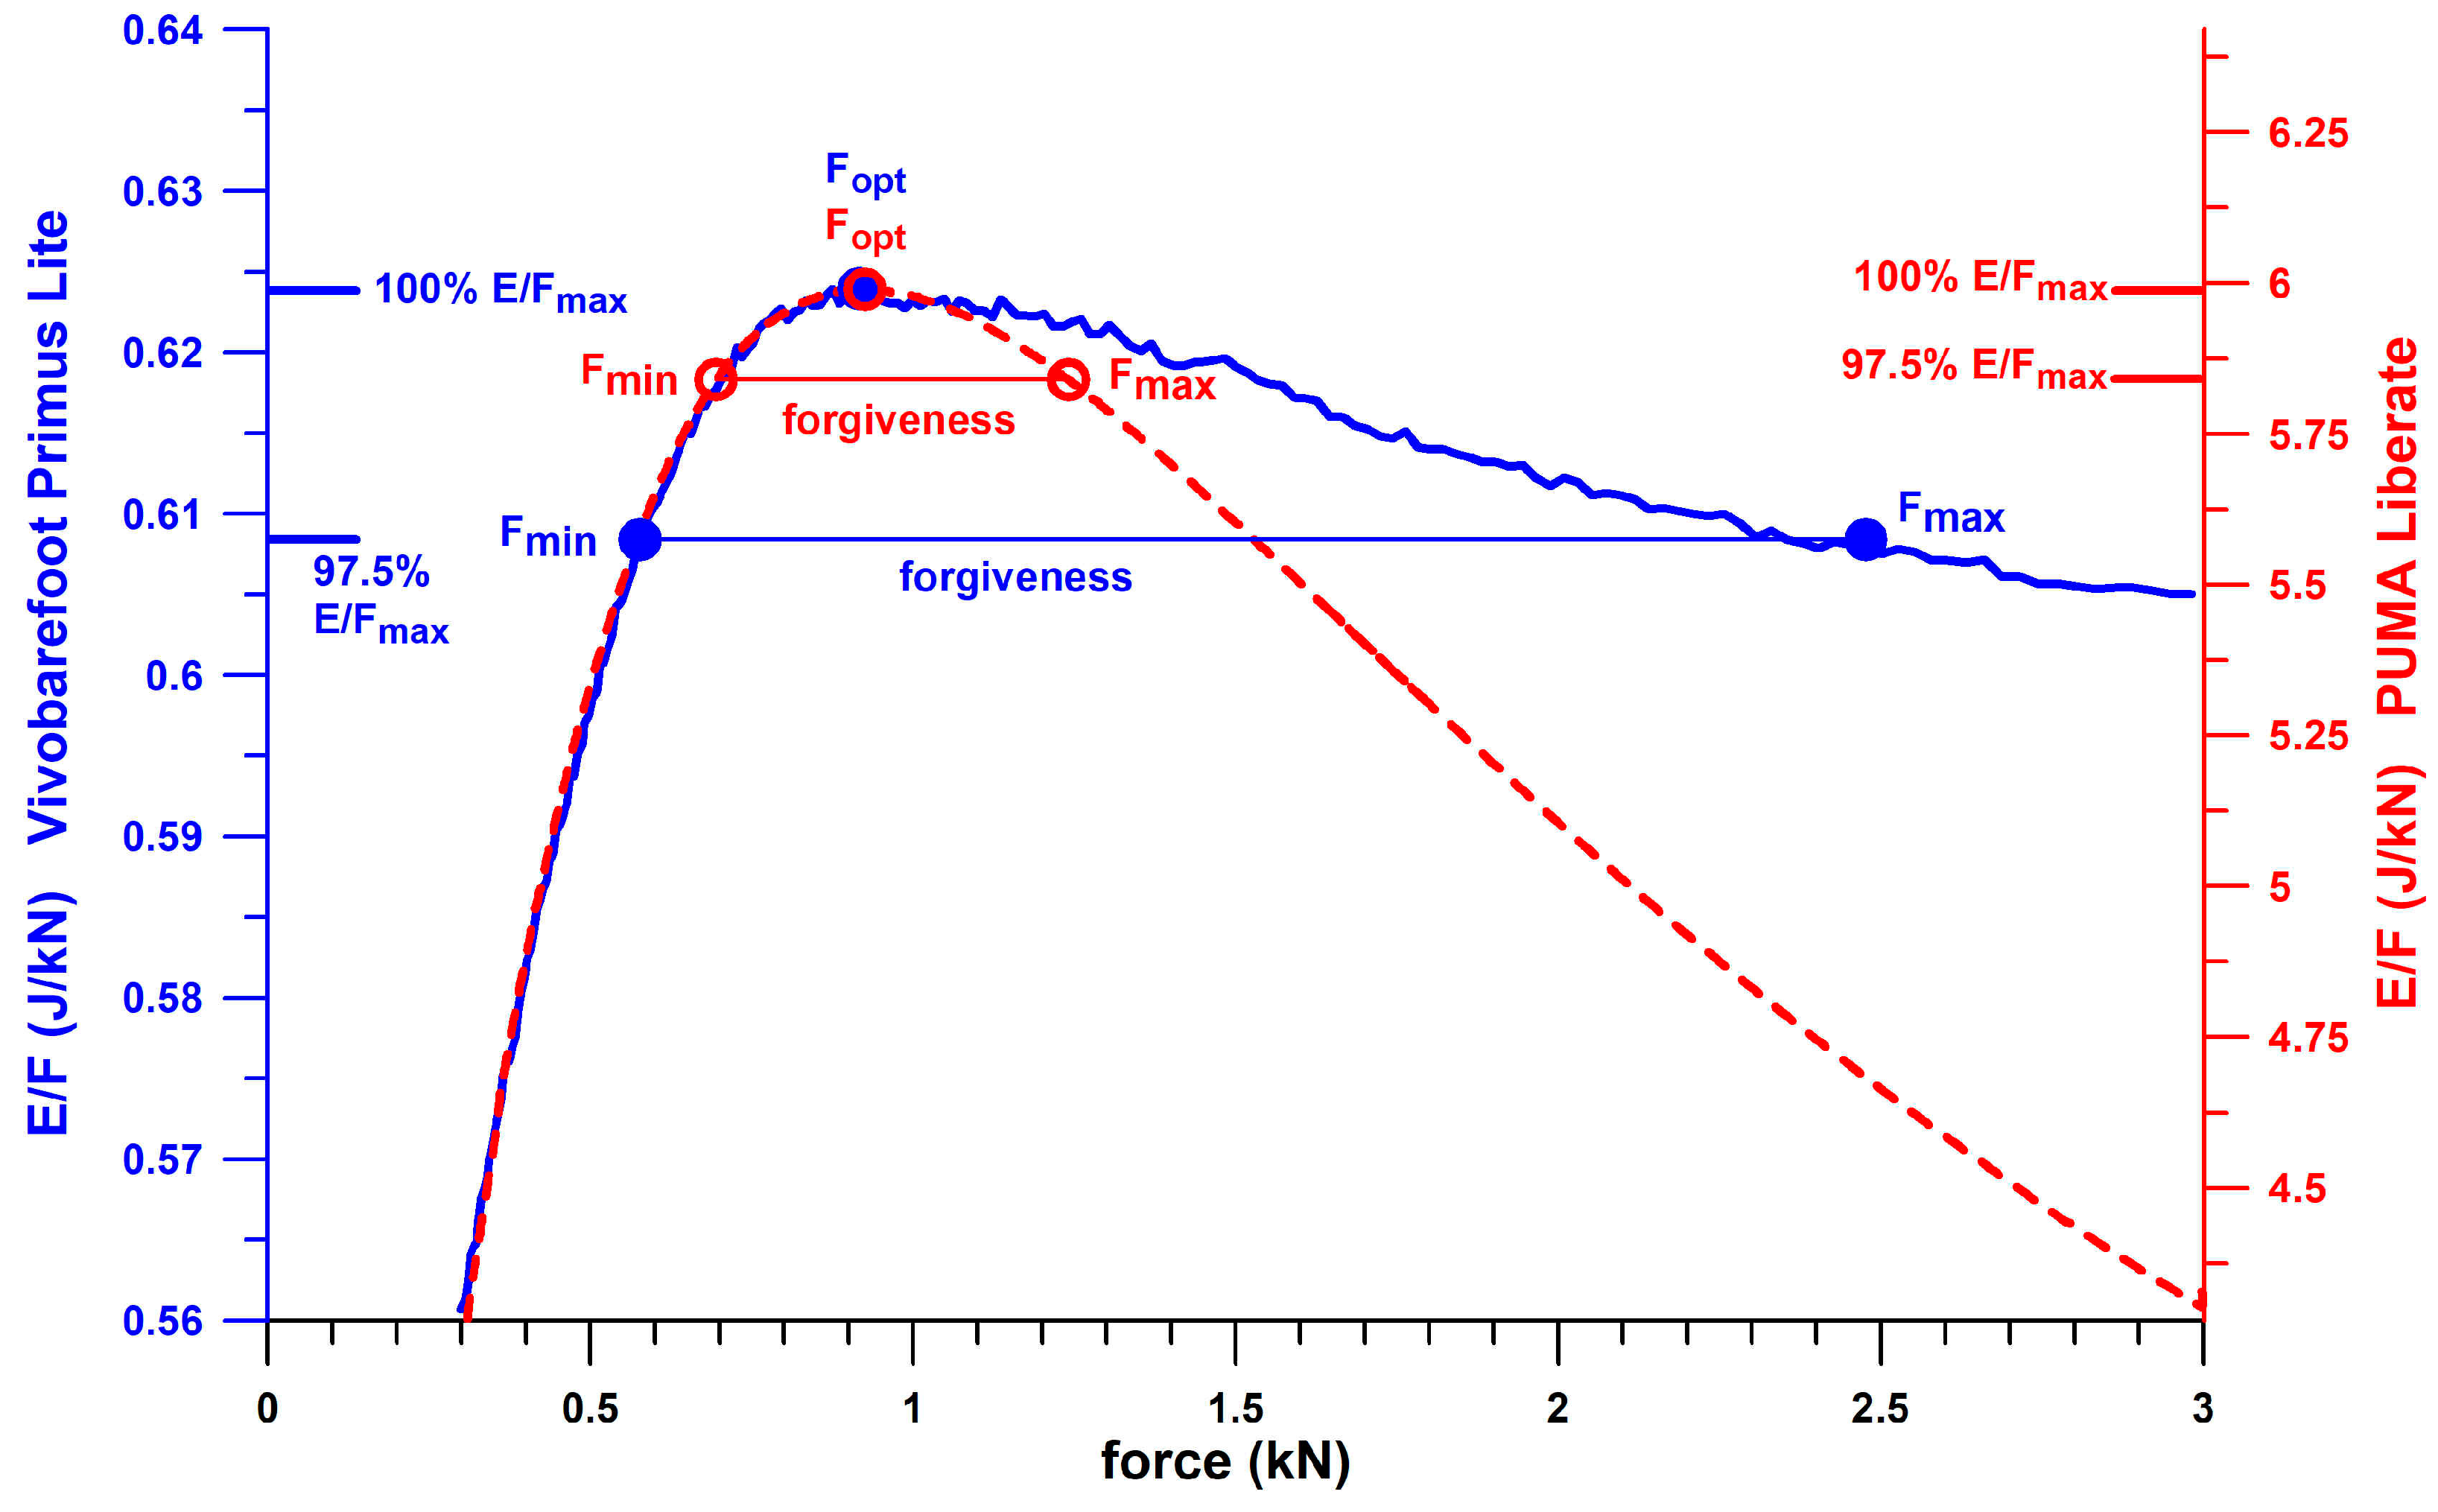
PF1 with respect to the actual forgiveness range, almost all cases of 10 participants with
PF1 across all experiments were within the forgiveness range (
Table 4) when running at 10 kph. The exceptions were Joe Nimble Addict, with four cases of
PF1 larger than
Fmax, and Puma Liberate, with two cases. This result generally indicates that the participants were running at the shoulder point, or at least within the forgiveness range. While this study suggests that the shoulder point represents the optimum point of energy absorption, a parameter related to shoe design, this result provides the evidence that running at the shoulder point actually occurs regardless of the
E/
Fmax ratio.
When running at the individual speed, the
PF1 distribution changed dramatically (
Table 4).
PF1 larger than F
max was found in 17 participants across all experiments. Apart from three cases with
PF1 smaller than
Fmin, only two shoes had a minimum number of cases of
PF1 larger than
Fmax, namely Vivobarefoot, with one case (
Figure 25), and Puma Velocity, with two cases. For the remaining four shoes, approximately 45% of cases were inside the forgiveness range, and 55% were outside, larger than
Fmax (
Figure 25). This result shows that four shoes (
Table 4) are partially under-designed, specifically when running at individual speed and also when running at a higher
BW (
Table 5). In contrast to
Figure 10, which does not identify under-designed commercially available sports shoes across a wide range of
PF1 values, focussing on
PF1 data of individuals (participants of this study) reveals potentially under-designed shoes under certain conditions.
For all six shoes, the 39 cases where the shoes were larger than Fmax were distributed among shoe sizes small, medium, and large, with 1, 17, and 21 cases, respectively. This result suggests that shoe size S and/or body weight BW influence how many cases were outside the forgiveness range. Multiple regressions of two predictors, S and BW, and dependent variable of PF1, revealed that, at a speed of 10 kph and at individual speed, the shared components (combined influence of S and BM on PF1) were 22.33% and 19.24%, respectively; the unique influences of BW on PF1 were 20.19% and 16.32%, respectively; and the unique influences of S on PF1 were 0.11% and 0.89%, respectively. The negligible unique influence of S on PF1 indicates that BW generally contributes the dominant influence.
To address the issue of why larger sizes produce outliers with
PF1 larger than
Fmax (
Table 4 and
Figure 25), the following question arises: which parameter is significantly different between
PF1 outliers and
PF1 data smaller than
Fmax, and, apart from the magnitude of
PF1, which parameter was the larger
PF1 associated with? When dividing the
PF1 data into two groups, based on
PF1 larger or smaller than
Fmax, and comparing the associated medians of
BW, body height
BH, shoe size
S and running speed
v with the Mann–Whitney U test, all medians were significantly different.
PF1 >
Fmax was associated with significantly larger medians of
BW,
BH, body mass index,
S, and
v (
Table 5). Equally, the gender distribution was significantly different between the two groups, with 44% and 0% of female participants in the groups with
PF1 <
Fmax and
PF1 >
Fmax, respectively (
Table 5).
That the medians of the two
PF1 groups were significantly different is evident, since
PF1 (smaller or greater
Fmax) was the decision criterion to separate the two groups. Of the remaining two large effect sizes (
Table 5),
BW has a larger effect on
PF1.
According to
Table 6, the average
BW,
BH,
PF1, and individual velocity increase significantly from small to medium and medium to large sizes (
p < 0.002, Kruskal–Wallis test). The increase in
PF1 relative to size and across the two speeds (10 kph and individual speed) is larger than that of
BW and
BH. This result reflects that shown in
Figure 25, namely, that the change in individual speed relative to the three shoe sizes is responsible for the increased number of outliers, as shown in
Table 4, and not
BW or
BH.
These results can be interpreted in two opposite but complementary ways:
- (1)
The larger shoe sizes were not designed for heavy runners;
- (2)
The participants were too heavy for larger shoe sizes.
Both interpretations are not applicable, as the increased running velocity relative to the three shoe sizes accounts for the increased number of outliers, as shown in
Table 4. The alternative interpretation would be as follows:
- (1)
The larger shoe size design cannot keep up with the faster running speed in addition to the increased BW;
- (2)
The participants were too fast for current larger shoe size design.
3.9. Design Considerations and Strategies for Adapting Shoes to the Shoulder Point Parameters
At this point, the question arises: which design feature should be responsible for a larger PF1 in general and the larger PF1 due to the faster running speed?
The basic design features of energy absorbers are [
14]:
- (1)
The design space: for sports shoes, this is the standardised length (shoe size in relation to the foot size [
28], the width, and the thickness of the shoe sole; the thickness is limited to a maximum of 40 mm in road events (running and race-walking competitions [
29].
- (2)
The peak deceleration (−apeak).
- (3)
The absorber properties, specifically,
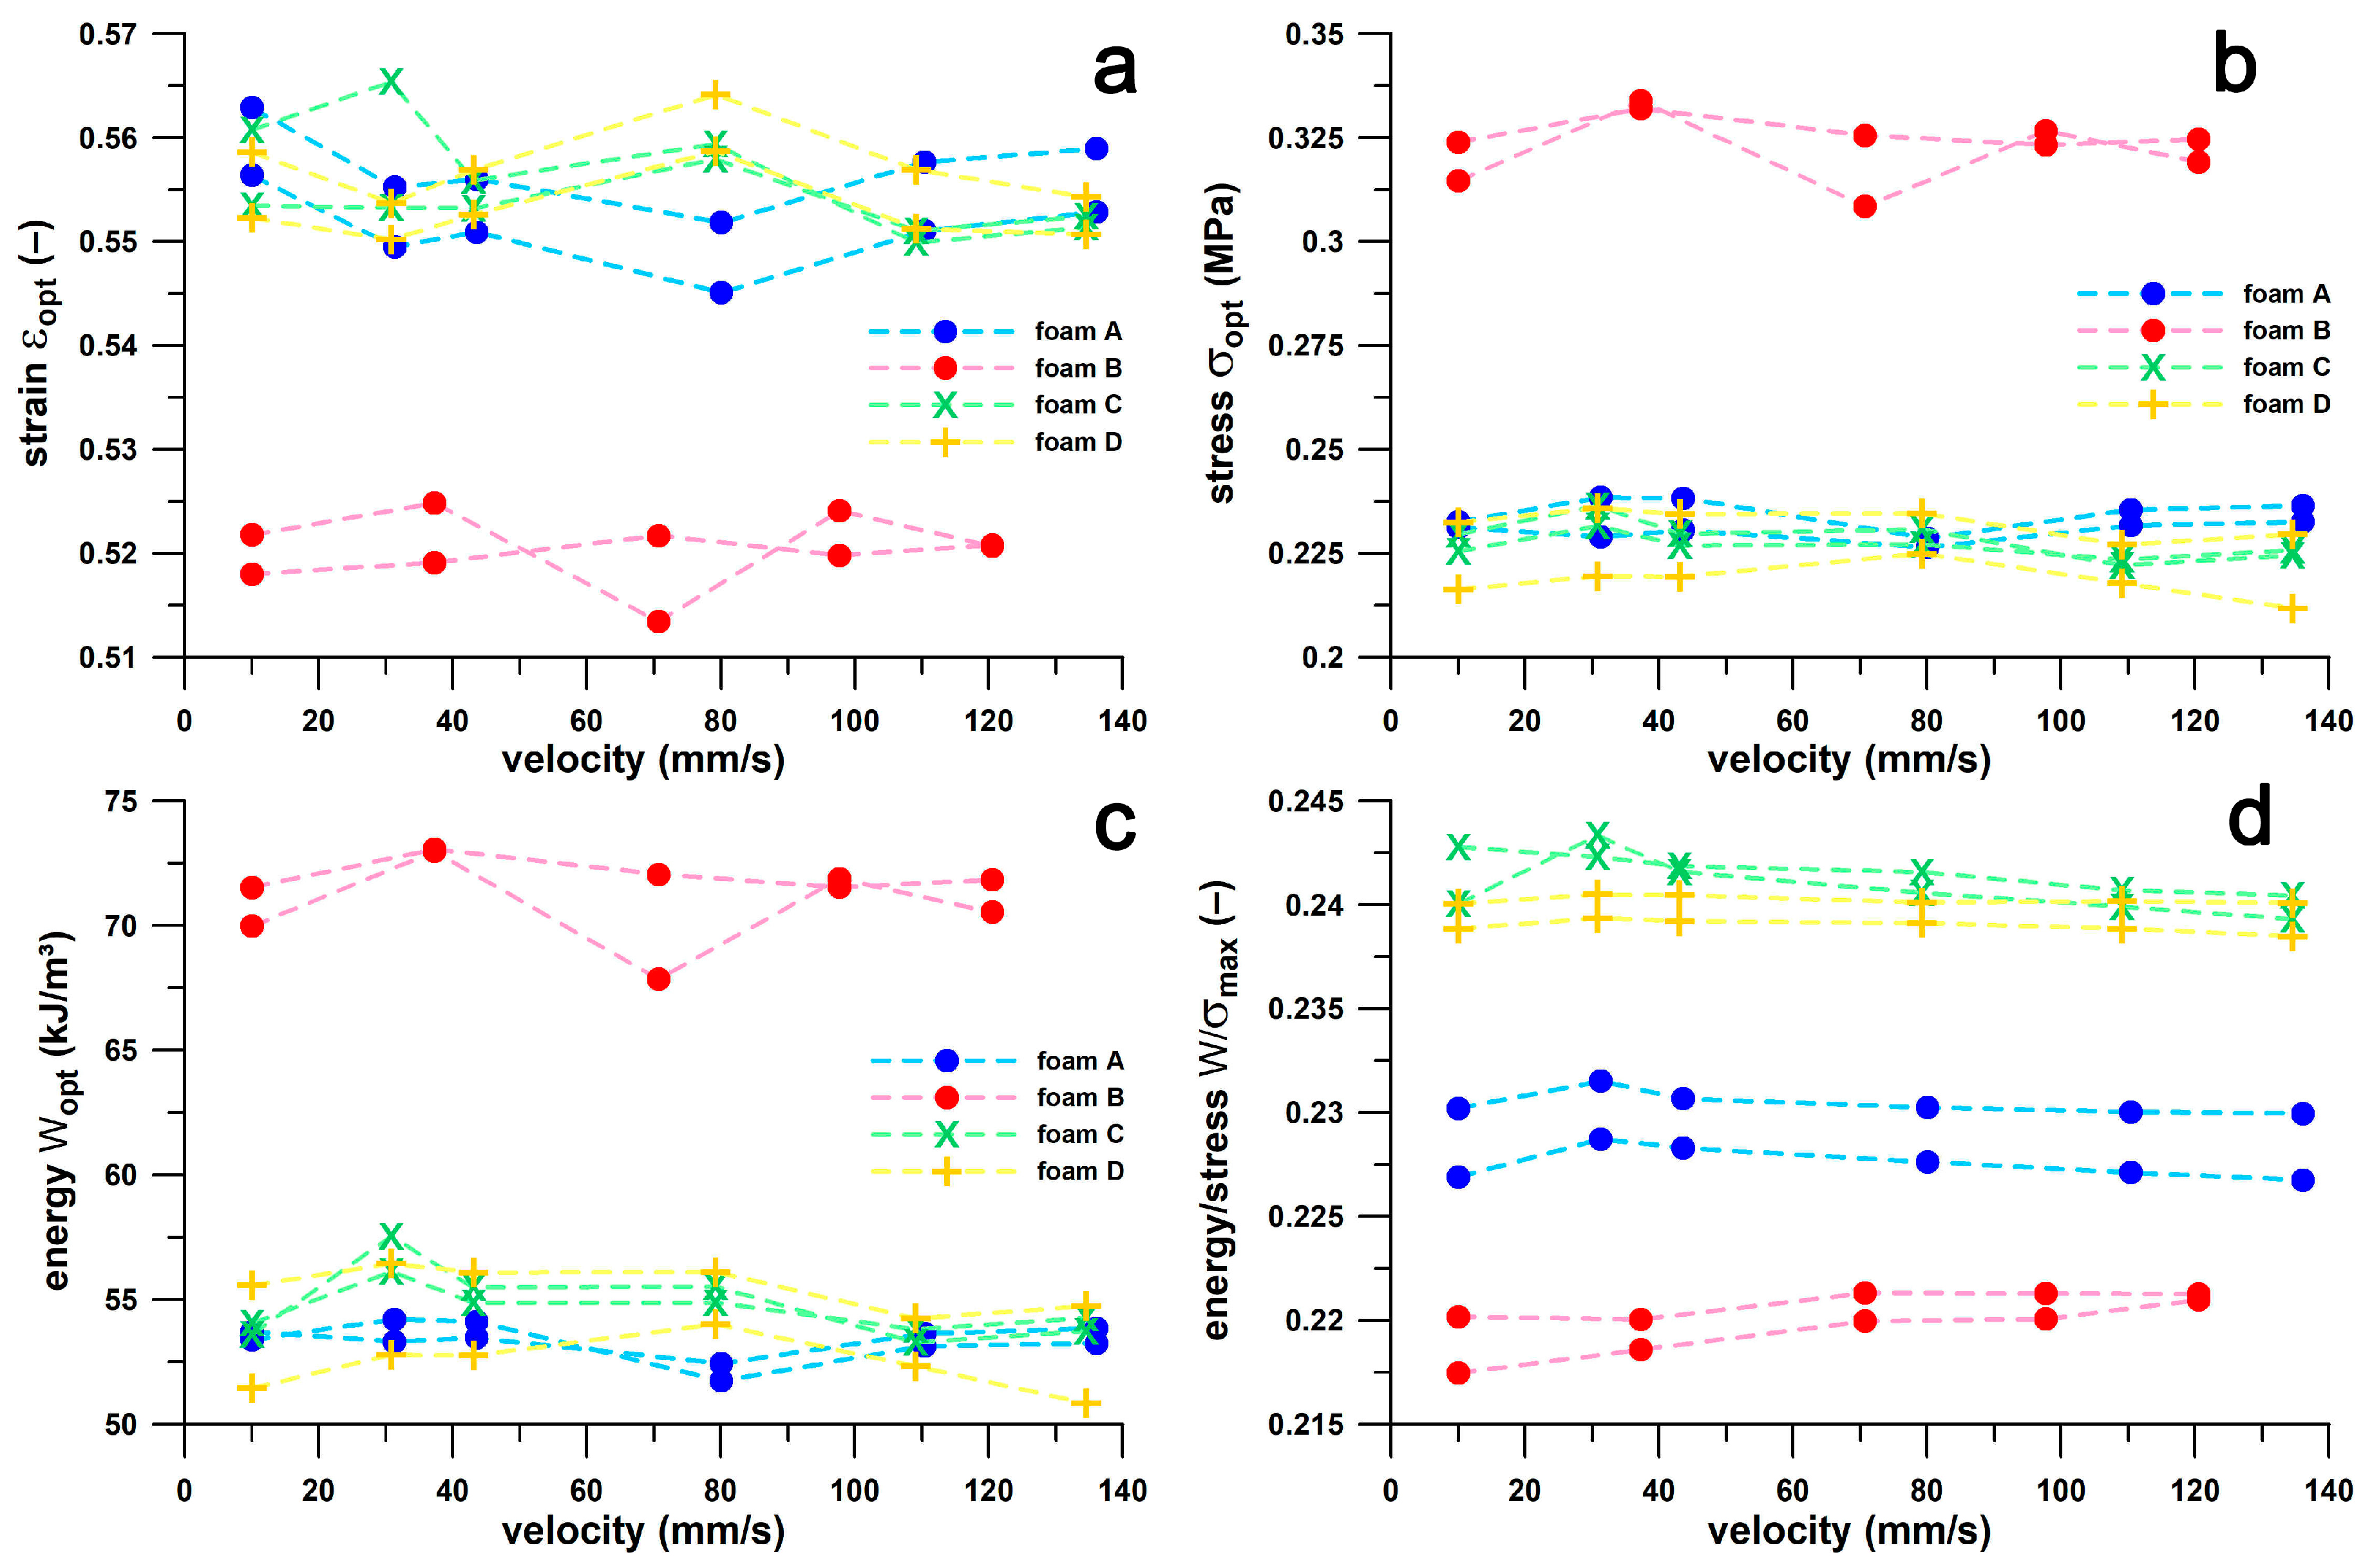
εopt,
σopt,
Wopt, and
W/
σmax (cf.
Section 2.2.) and their non-normalised counterparts of
xopt,
Fopt,
Eopt, and
E/
Fmax.
Using the non-normalised properties of the Puma DeviateElite shoe (xopt = 0.0234 m, Fopt = 1.06 kN, Eopt = 8.10 J, E/Fmax = 7.64 J/kN) and the corresponding design space parameters (stack height d = 0.038 m, approximate heel area A = 0.005 m2, and resulting heel volume V = 0.00019 m3), the normalised absorber properties are εopt = xopt/d = 0.6166 (-), σopt = Fopt/A = 212000 Pa, Wopt = Eopt/V = 42631.6 J/m3, and W/σmax = 0.2011 (-). Assuming an effective mass m of 50 kg that must be decelerated, this results in −apeak = −Fopt/m = 21.2 m/s2. If the normalised absorber properties are assumed to be the standard of the heel material, new non-normalised properties of the heel structure can be calculated if the design space parameters are changed.
The usual method for designing energy-absorbing structures is to calculate the required design thickness of an energy-absorbing material and compare the calculated design thickness with the available design space. Accordingly, we increase the design thickness
d by 15% (scaling factor), i.e., to
d = 0.0437 m. The heel area remains unchanged (0.005 m
2). The absorber volume increases to 0.0002185 m
3. As a result, the non-normalised properties change as follows:
xopt =
0.0269 m,
Fopt = 1.06 kN,
Eopt =
9.32 J, and
E/
Fmax =
8.79 J/kN (
Table 7). Comparing these data to the original non-normalised properties, we find that all parameters have increased (improved) except one, namely,
Fopt. However, it is the force (
PF1) that increases with increasing shoe size (due to the
BW and speed;
Table 6). This design result explains that thickening the heel sole has no effect. Evidently, as the force (
PF1) increases, we also want to improve the energy absorption, which is what actually happened (from 8.10 J to 9.32 J), but the force was not affected. If the force does not keep up with
BW and speed, then the shoe becomes under-designed and bottoms out.
Since the increase in stack height had no effect on the force, the next design step is to change the design area
A by 15% in both dimensions, i.e., to
A = 0.0066 m. The stack height
d remains unchanged (0.005 m
2). The absorber volume increases to 0.0002508 m
3. The unnormalised properties then change to
xopt = 0.0234 m,
Fopt =
1.40 kN,
Eopt =
10.692 J, and
E/
Fmax = 7.64 J/kN (
Table 7). Comparing these data with the original non-normalised properties, an improvement in
Fopt and
Eopt by 32% (or by a factor of 1.32 = 1.15
2) is obtained. As the force increases, the effective mass
m that must be decelerated also increases:
m =
Fopt/
apeak = 66 kg (increase of 32%). By increasing the design area,
Fopt has been successfully improved to accommodate the increased
PF1 and
BW values in larger shoe sizes—in principle. The limitations of this approach are three-fold:
(a) If we increase the size of an object by a scaling factor, the volume of the object is equal to the scaling factor to the power of three. Since the weight is proportional to volume, we expect an improvement of 1.52 (= 1.153) rather than 1.32 (= 1.152). If we correlate the participants’ BW and BH data, we obtain a power-law regression function of BW = 116.49 BH3.1403 (R2 = 0.5208), where the exponent of 3.1 corresponds to the expected exponent (3) of the scaling factor. Thickening the stack height in addition to the already increased area does not solve the problem since the stack height does not change the force. Using an area of 1.15 times the shoe length and 1.32 times the shoe width would solve the problem, with the disadvantage that the width would then increase disproportionately with the scaling factor to the power of two.
(b) We have not yet taken into account the increase in running speed. Since the running distance and speed are unidirectional, and, therefore, we assume an increase in speed and deceleration of the effective mass by the same scaling factor (15%), then the new −
apeak = 24.38 m/s
2. The new effective mass
m to be decelerated is
m =
Fopt/
apeak = 1.4 kN/24.38 m/s
2 = 57.39 kg. This is an increase of only 15%. If we consider that the running speed increases by a factor of 1.077 relative to the increase in
BW, based on the participants’ data, we need a scaling factor of 1.42 (1.32·1.077) for velocity and acceleration. The new effective mass
m to be decelerated is
m =
Fopt/
apeak = 1.4 kN/(21.2·1.077) = 61.28 kg. This is an increase of only 22.6%. Another approach is to derive the scaling factor of the speed from the principle of geometrical similarity. If two geometrically similar objects with different scaling factors
L move with the same Froude number
Fr, then their velocities
v are calculated from
v2 =
Fr g
L, where g is the gravitational acceleration [
30,
31,
32]. Thus,
v ∝ √
L. Therefore, the new effective mass
m that must be decelerated is
m =
Fopt/
apeak = 1.4 kN/(21.2·1.15
0.5) = 61.54 kg. This is the same increase of only 22.6%. At least this result provides a good agreement of theory (principle of geometric similarity) and experimental data.
(c) If we consider that the scaling factor of the originally assumed effective mass m of 50 kg is 1.15
3, i.e., 1.52, then the new mass that must be decelerated by a force of 1.4 kN is 76 kg. Thus, the required deceleration −
apeak = −
Fopt/
m = 1.4 kN/76 kg = 18.41 m/s
2. This means that the original deceleration of 21.2 m/s
2 is reduced by 13.2%, which is counterintuitive, since higher velocities require larger decelerations that must be reduced to zero under the same constraints (same stack height). There is another aspect of designing an energy absorber which helps verify this counterintuitive result. The velocity addressed before is a direct result of the absorbed energy and the effective mass:
v2 = 2
Eopt/
m. Using the original data, √(2·8.1/50) = 0.569 m/s, the initial speed at which the energy absorber (heel sole) is compressed. Using the new data, √(2·10.692/76) = 0.530 m/s, results in a reduction by 6.85%. Since we obtain the same counterintuitive result, the only option left is to increase the area disproportionately to achieve an adequate
Fopt, such that
PF1 is not larger than
Fopt. This was already suggested under a) above. This solution illustrates the dilemma of contemporary shoe design, namely that the width of the shoe sole does not increase more than the length or the shoe size, which is a function of the foot length
lF: size EUR = 3
lF/20 + 2 [
28].
From the outliers in
Table 4 (
PF1 >
Fmax at individual speed), we can calculate the required increase in heel area (expressed as increase in heel width, not heel length, since heel length is a function of shoe length) to have the
PF1 data at the upper boundary of the forgiveness range (
Fmax) or even at the shoulder point (
Fopt). Since
the area increase is given as
where
As is the standard heel area of a shoe, and
An is the new, enlarged area, and the ratio of
An to
As minus 1 and times 100 corresponds to the percentage increase in heel width. When matching
PF1 to
Fmax,
Fopt is replaced by
Fmax in Equations (2) and (3).
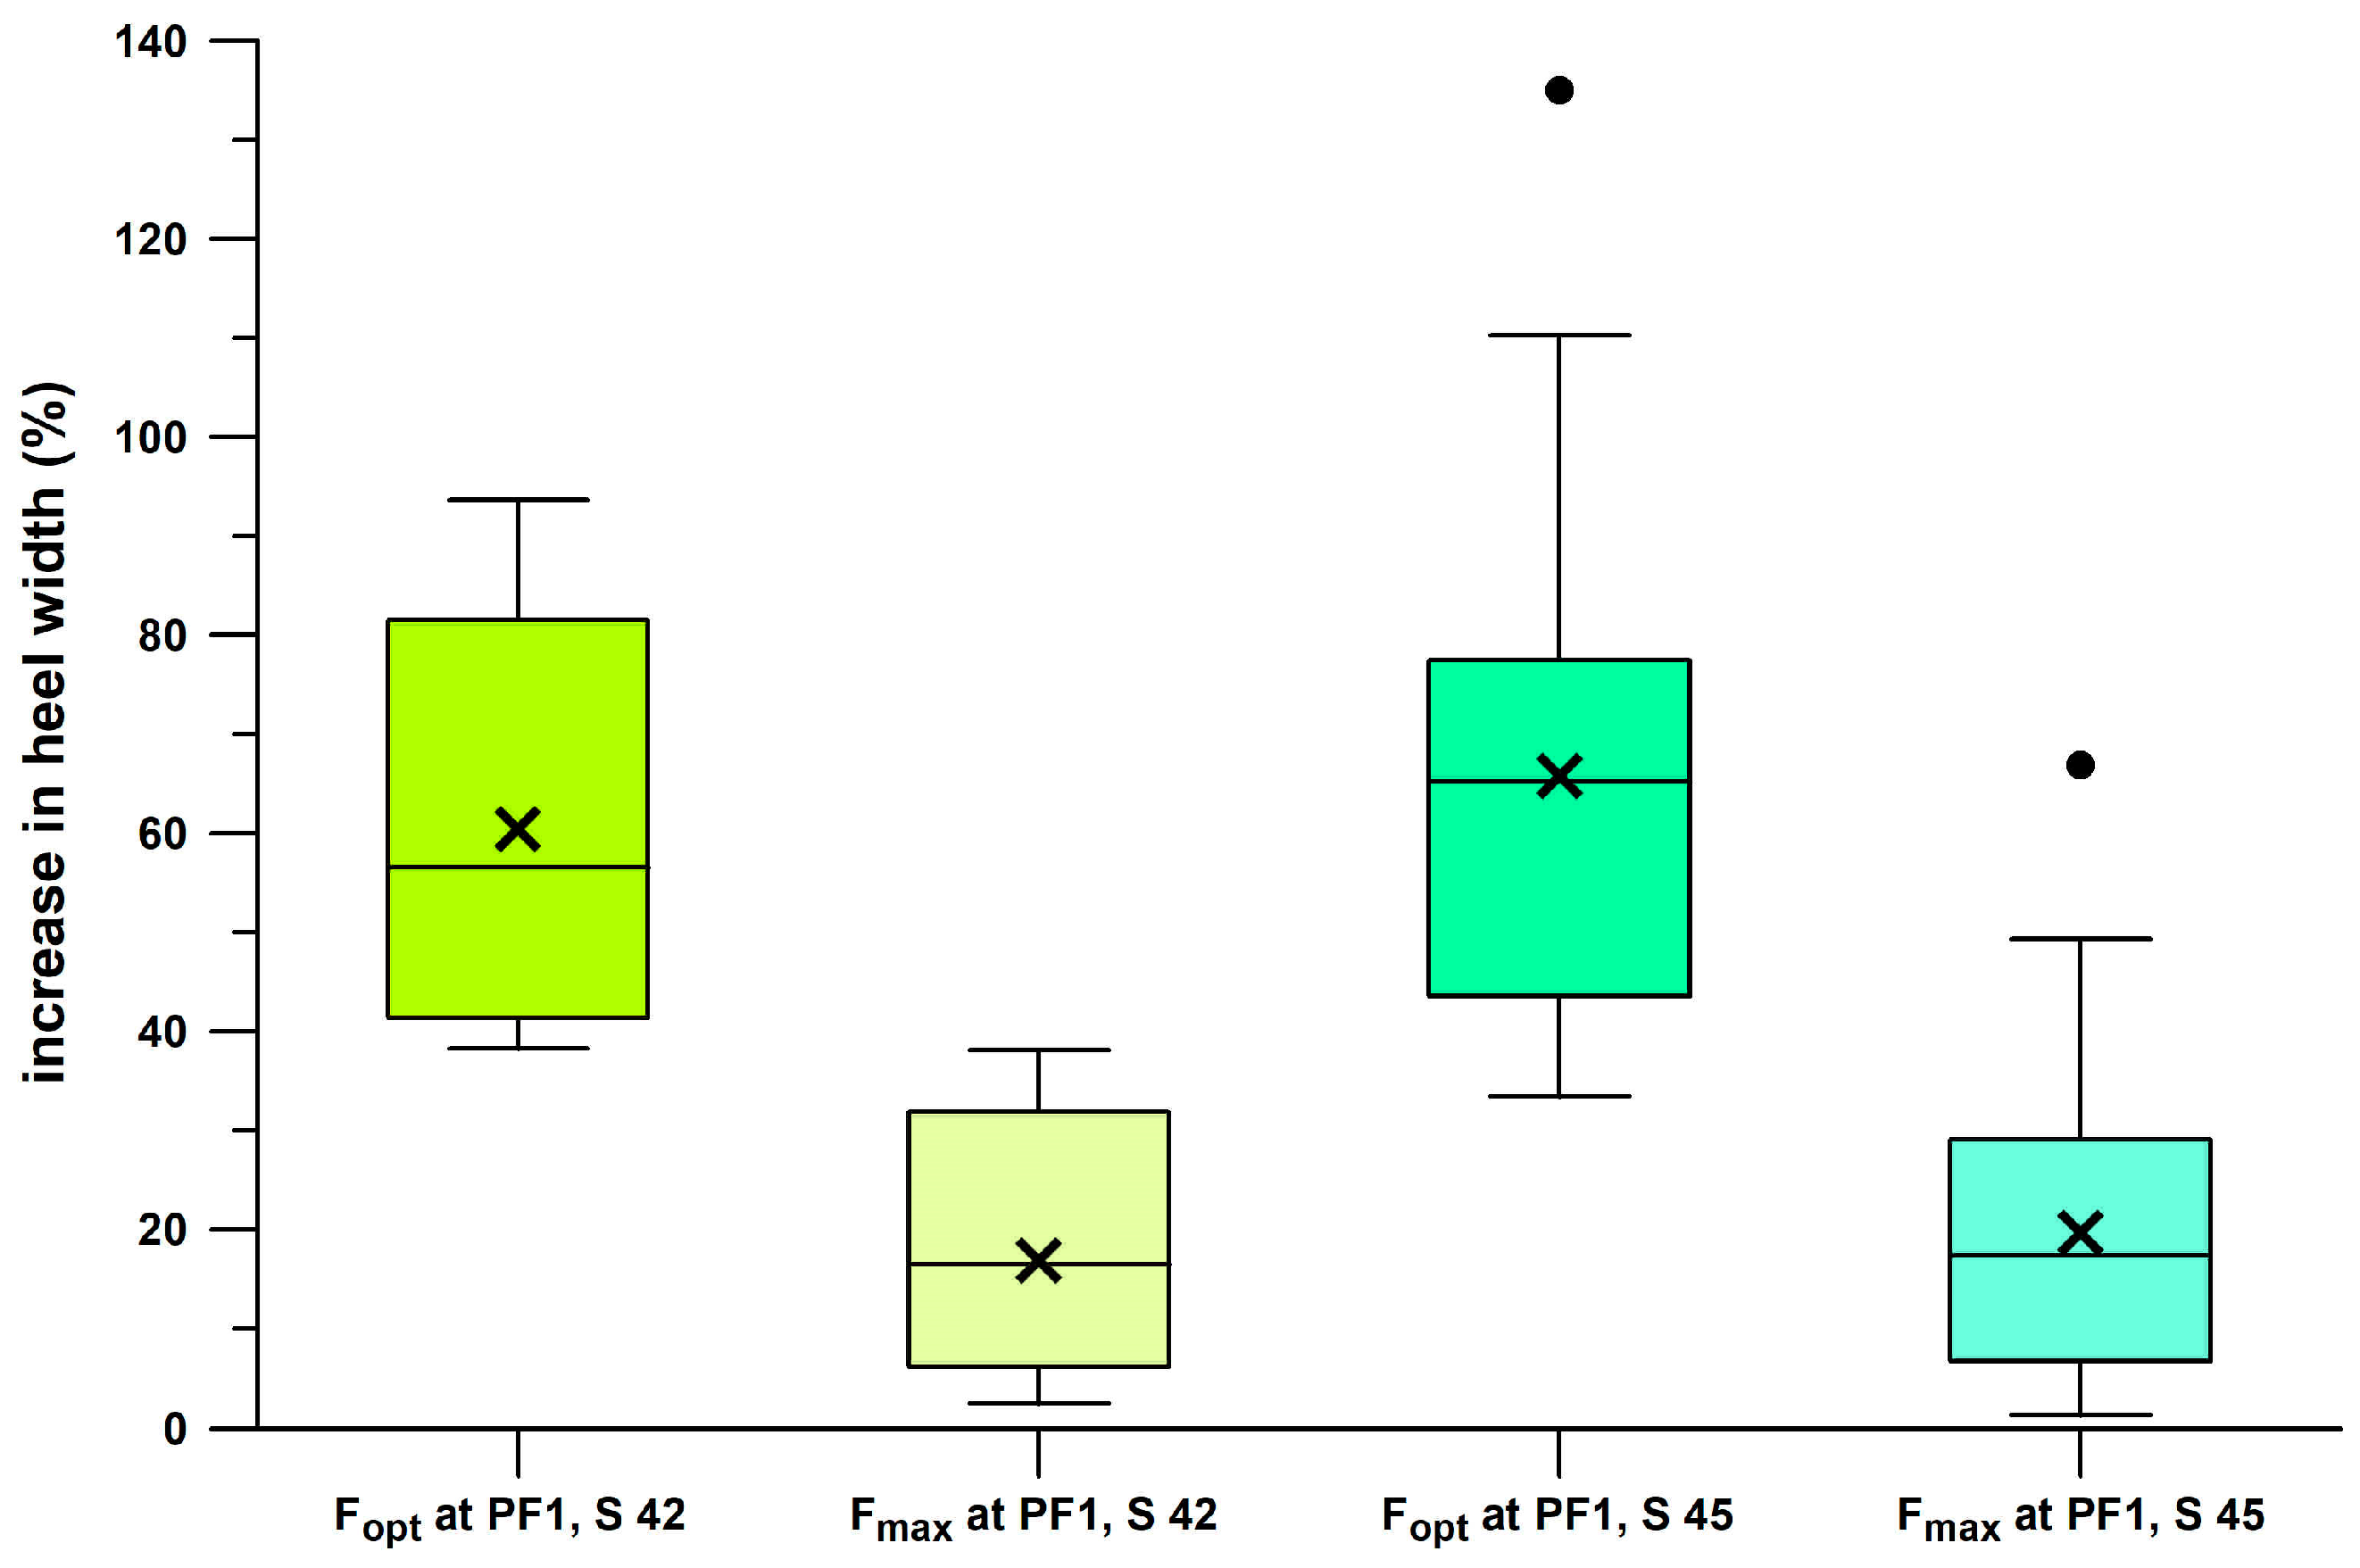
As shown in
Figure 26, when
Fmax is set to
PF1 for each participant and each shoe condition (when
PF1 >
Fmax at the original heel size), the heel width needs to be increased by 16.83% (±12.30%) and 19.65% (±17.25%) for shoe sizes of 42 and 45, respectively. If
Fopt is matched to
PF1, the heel width needs to be increased by even 60.47% (±19.67%) and 65.79% (±27.53%), for shoe sizes of 42 and 45, respectively.
If the scaling factor is the same in all three dimensions, then a 10% increase in foot length means a 10% increase in forefoot width. However, the scaling factors are disproportionate, and, for example, the scaling factor of the forefoot width of the human foot is 0.67 on average (calculated from the data of Domjanic et al. [
33]) relative to a foot length scaling factor of 1.
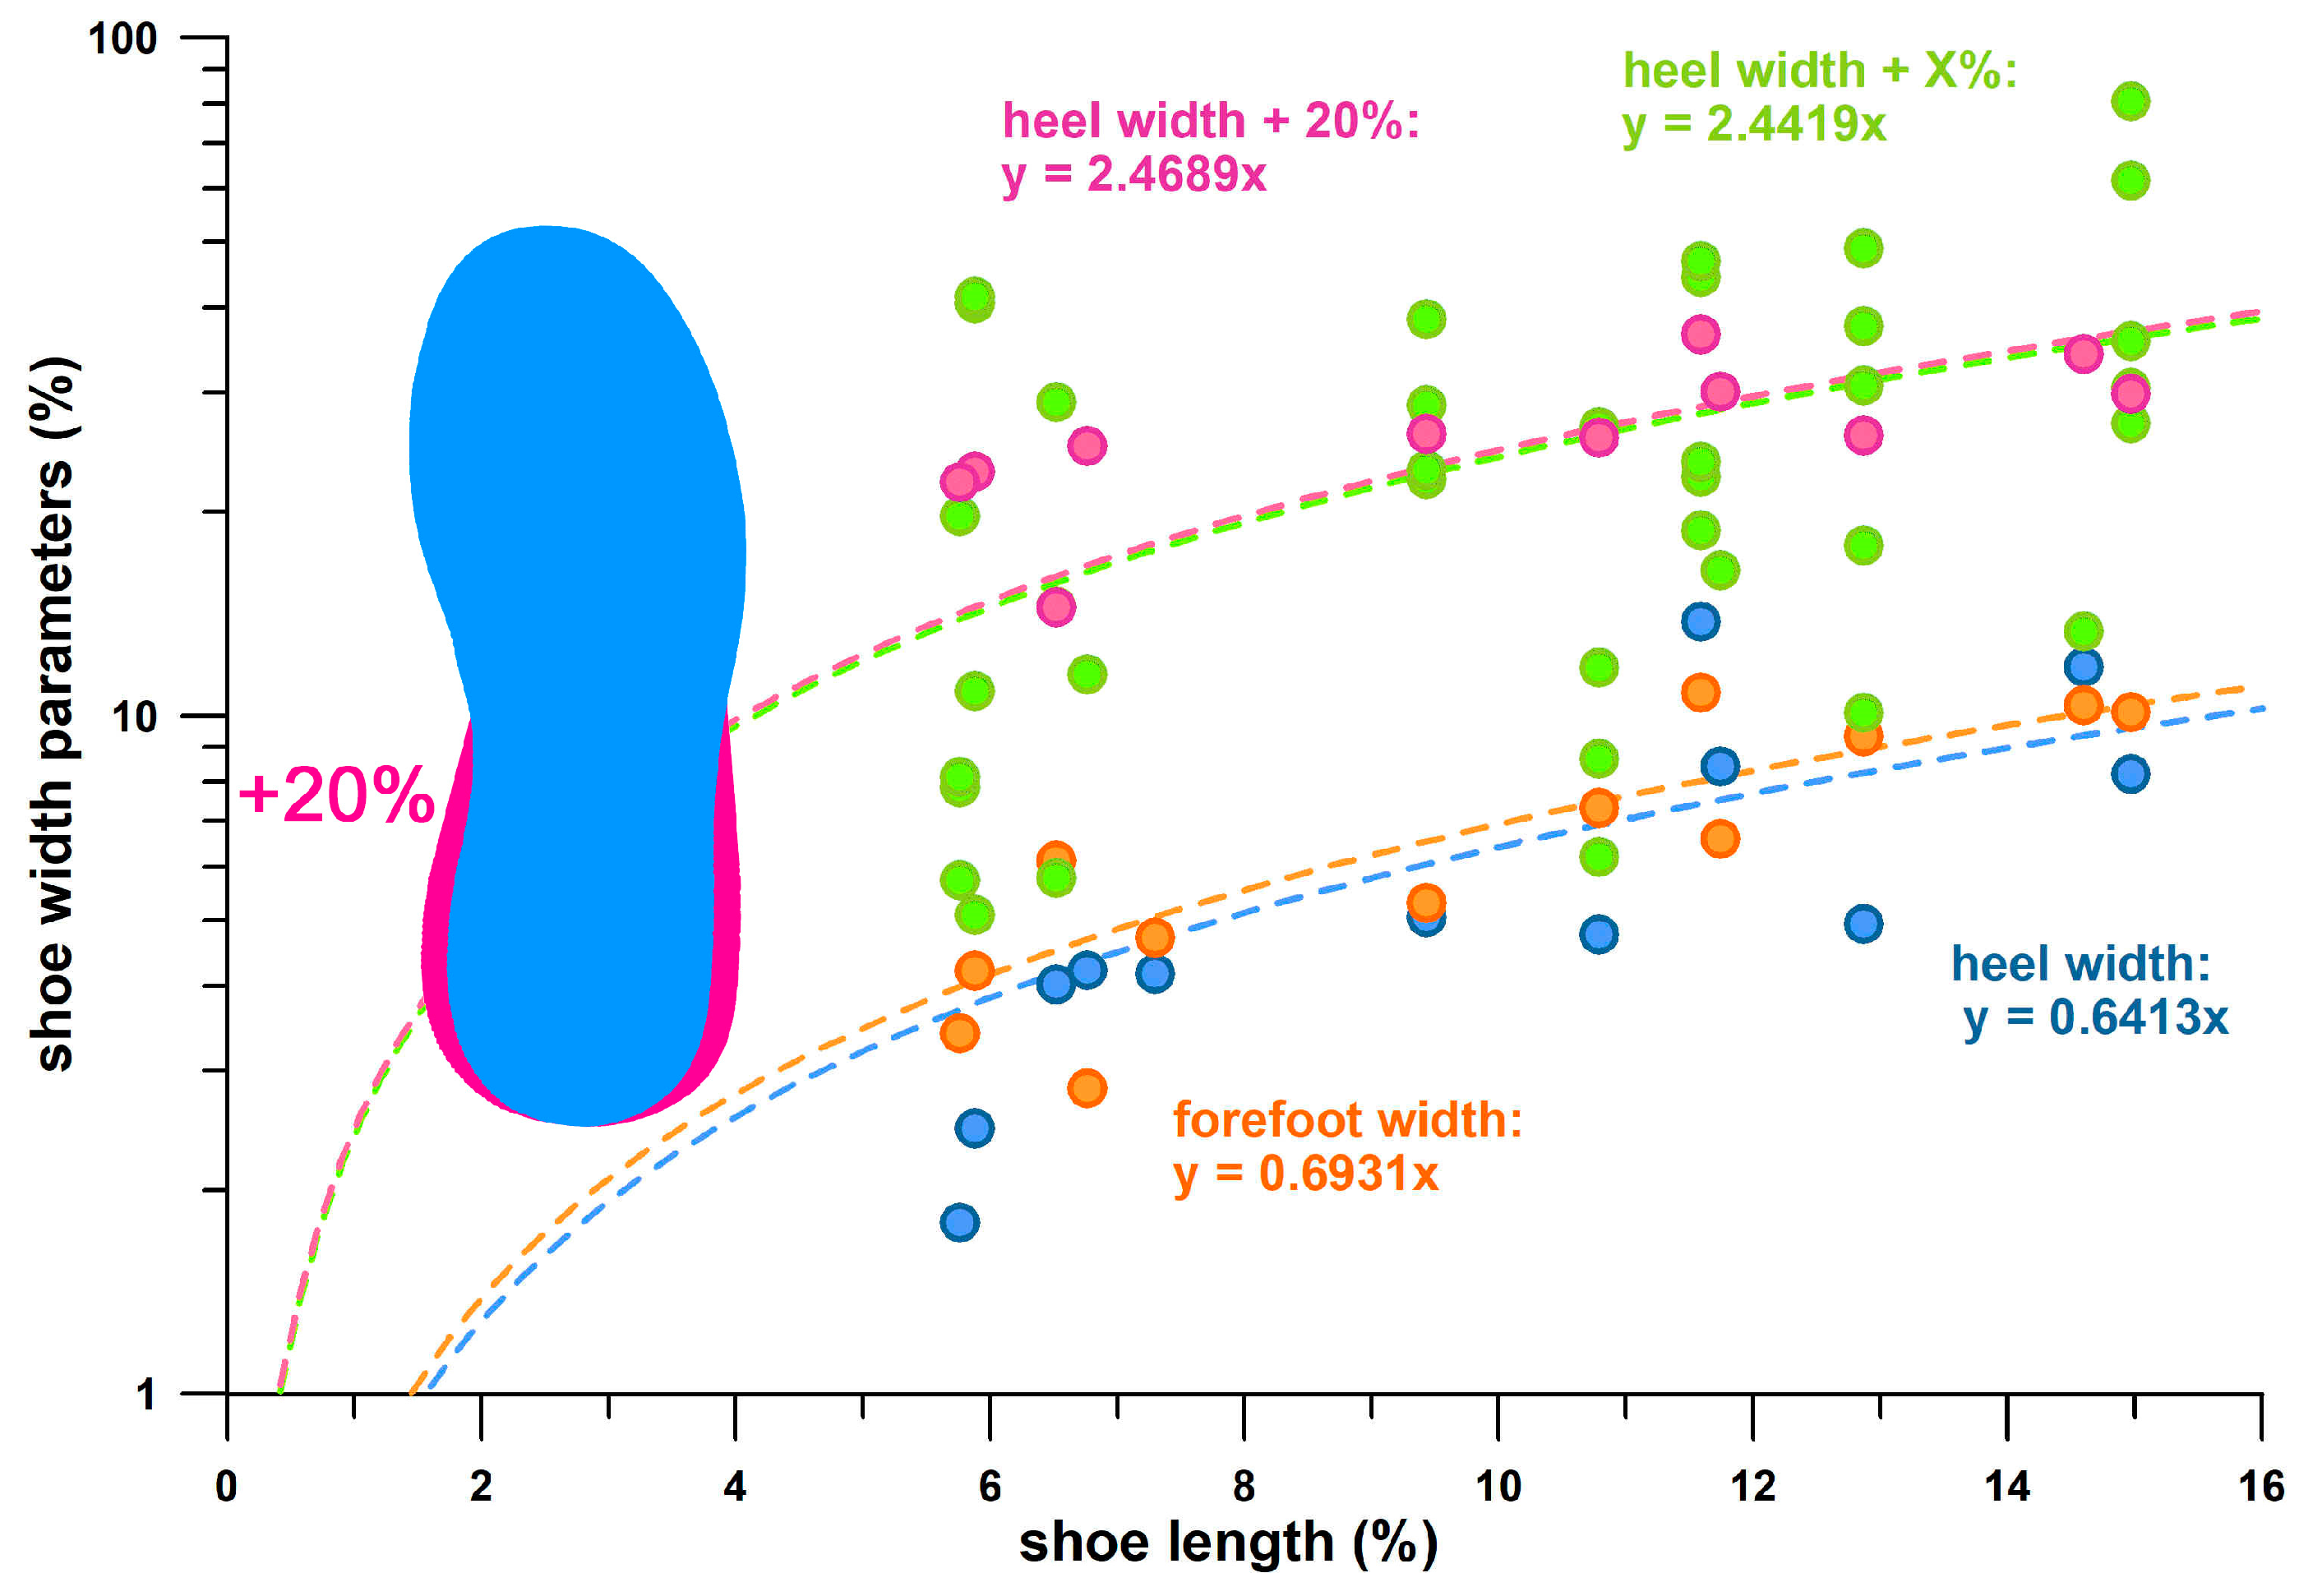
Table 8 shows the relative scaling factors of the measured shoe parameters (six shoes of Cohort 3) relative to the shoe length (scaling factor of 1).
The stack height had the smallest relative scaling factor of only 0.21. This seems to be a surprising result but is quite logical, considering that the stack height does not affect
Fopt (
Table 7). To adapt the heel design for heavier and taller users, the heel width must be changed as already explained above. The relative scaling factors of the forefoot and heel widths were 0.69 and 0.64, respectively (
Table 8, and
Figure 27). The forefoot shoe width scaling factor of 0.69 is close to that of the human forefoot width of 0.67. After increasing the measured heel widths by 20% (predicted maximum average value in
Figure 27 for placement of
PF1 at
Fmax), the relative scaling factor of the heel width increases disproportionately to 2.44 (
Table 8, and
Figure 27). If the measured heel widths are increased according to Equation (3) such that
PF1 =
Fmax for each individual whose
PF1 was greater than
Fmax, the relative scaling factor of the heel width increases disproportionately to 2.47 (
Table 8, and
Figure 26), i.e., very close to 2.44. This result confirms that increasing the heel width by 20% is a viable design strategy to reduce the number of outlier cases (
Table 4 and
Figure 26), i.e., large
PF1 data outside the forgiveness ratio.
Figure 27 also shows a standard shoe sole (blue) with a 20% increase in heel width (10% on either side).
