Abstract
According to standards, the heel soles of running shoes are currently tested with an energy absorption of 5 J. This study offers an alternative method to improve the measurement of cushioning properties. The new method uses the ratio of absorbed energy to applied force and determines the maximum of this ratio (optimum or shoulder point) and the associated optimal force, energy, and displacement. This method was applied to 112 shoe models using compression testing. The method was found to be insensitive to strain rates and identified shoes that were over-, well-, or under-designed (running before, at, or after the shoulder point, respectively) relative to the range of the first ground reaction force peak (0.700–2 kN). The optimum ratio was between 0.6 J/kN (barefoot shoes) and 11.2 J/kN (Puma RuleBreaker), the optimal energy was between 0.5 and 40.6 J, the optimal force was between 0.1 and 4.6 kN, and the optimal displacement was between 3 and 23 mm. Participants ran at or near the shoulder point (within the design forgiveness range) unless they were too heavy and ran at their preferred running speed. This study proposes replacing current standards with the new method, allowing consumers to make informed decisions regarding injury prevention while running.
1. Introduction
Daily physical activity should be an integral part of modern lifestyle, as it “provides significant physical and mental health benefits” [1] and contributes to the prevention of chronic diseases such as cardiovascular disease, cancer, and diabetes [1]. In 2022, almost one third (31%) of the world’s adult population was physically inactive [2]. The WHO recommends that “adults should do at least 150–300 min of moderate-intensity aerobic physical activity; or at least 75–150 min of vigorous-intensity aerobic physical activity per week” [3]. These activities include running. Running is not restricted to special sports facilities (unlike, e.g., climbing, swimming, and other gym activities) and does not require any special sports equipment other than ordinary running shoes. The popularity of running shoes is reflected in the global revenue of the three major athletic footwear giants (Nike, Adidas, and Puma), which totalled $47 billion in 2022 [4].
Running shoes must be designed to alleviate, if not prevent, acute injuries and chronic overuse/overstrain syndromes. In fact, the one-year injury incidence among recreational runners has been reported to be about 45% [5,6], with approximately 50% of all injuries occurring in the knee and calf muscles [6] or in the foot/ankle and knee [5]. In particular, the heel segment of running shoes must be able to absorb sufficient energy during heel strike that would otherwise be absorbed by the leg. This expectation may only apply to heel strikers and not to midfoot strikers; however, it has been reported [7] that observational data found that 94% of all investigated runners were heel strikers, while self-reported data showed that only 32% of all investigated runners considered themselves heel strikers.
The design and development of running shoes should therefore be an integral bioengineering process comparable to the development of orthoses and prostheses, based on biomechanical data from test persons, and material data from mechanical testing. The corresponding testing of running shoes for their properties and quality and the design of these tests are also bioengineering tasks, considering that their results will have an effect on the human body. These test data should be made available to customers to help them make informed decisions when selecting a running shoe, particularly for the prevention of running injuries. Subsequently, the current standard tests for athletic shoes are explained and reviewed.
ASTM (F1614-99 [8] and F1976-24 [9]) is the standard for testing the heel segment of athletic shoes. ASTM F1614-99 (1999; Standard Test Method for Shock Attenuating Properties of Materials Systems for Athletic Footwear) offered three procedures [8]:
- -
- A for falling weight impact machines
- -
- B for compression force-controlled machines, and
- -
- C for compression displacement-controlled machines.
ASTM F1976-24 (2024; Standard Test Method for Impact Attenuation of Athletic Shoe Cushioning Systems and Materials [9]) was limited to procedure A.
The main feature common to both ASTM versions is that the standard or nominal value of the reference maximum total energy input applied by this test method is set at 5 J. The rationale for this method is explained in Note 3 of ASTM F1614-99 [8]: “There is no evidence to support comparisons of data for tests which used … different reference maximum energy applied values…”. However, the reason for the specific value of 5 J was not explained. Another method for testing shoes (DIN EN 12743:1999; Footwear—Test methods for outsoles—Compression energy [10]) uses a maximum force set at 5000 N and a deflection rate at 0.167 mm/s.
Other test standards for shock-absorbing materials use the same approach:
- -
- ISO 3386-1:1986 (Polymeric materials, cellular flexible—Determination of stress–strain characteristics in compression [11]) serves to compare stress data of foams at a strain value set to 40% (“CV40%”).
- -
- ASTM D3574 C (Foam Force Deflection Testing, ASTM, [12]) “specifies a method for measuring the compression force necessary to produce a 50% deflection … of the foam test specimen. … This test is very similar to ISO 3386, but with slight technical differences that prohibit a direct comparison” [13].
The criticism of directly comparing results obtained using different methods or even different standards is reflected in note 3 of ASTM F1614-99 [8]. This principle justifies the need to set reference test parameters with a fixed value. The counterargument for a different approach, however, is that runners do not apply exactly 5 J of energy to the heel segment during heel or foot strike, nor does the optimal point of shock absorption lie exactly at 40% or 50% of the strain. Energy absorption models such as the buckling element or the pneumatic element (airbag), for example, have their optimum at 50% or 68.38% of the strain, respectively [14]. The maximum optimal strain range determined by Fuss [14] for 88 different shock-absorbing materials and structures was 48.5–81%.
Nevertheless, there are several literature sources that used ASTM F1614-99 [8] or ASTM F1976-24 [9] to test athletic shoe heels. Delattre et al. [15] used ASTM F1614 and concluded that results are not comparable when using different variables and test methods. Delattre and Cariou. [16] used ASTM F1976 to mechanically characterise shoes. They discovered a relationship that allowed them to predict 75% of the variance in “heel penetration” (shoe cushioning in industry-defined terms) from women’s perception of running, using a mechanical parameter, namely the absolute maximum shoe compression value. Determan et al. [17] used ASTM F1614-99 and studied the impact energy generated by skateboarders, which can be as high as 40–50 J. Accordingly, they applied an alternative impact test procedure at 44 J. Their results showed that the shoe that responded best to 5 J impacts performed worst under 44 J impacts. Conversely, the shoe that performed worst under 5 J impacts responded best to 44 J impacts. The authors recommended caution when applying standard low-impact methods to athletic shoes. They criticised that “testing methods and standards such as ASTM F1614 may be appropriate for low-load activities such as walking or running, but provide a poor indicator for shock attenuation capability for higher-impact sports such as skateboarding”. Finally, they suggested that “a new test method should be developed for evaluating the shock attenuation properties of footwear for sports where athletes experience relatively high impact forces to their feet”, but without quantifying the actual impact energy experienced when running at different speeds.
Lloria-Varella et al. [18] used ASTM F1614-99 and detected significant changes in shoe properties such as reduced thickness and increased stiffness after running with the individual running shoes. For example, the heel sole thickness decreased from pre-race to post-race (38 km), while stiffness and peak force increased, and energy loss decreased.
Shorten [19] used the ASTM F1976-13 impact test with the prescribed total impact energy of 5 J in three marathon racing shoes. The author investigated peak compression and force, as well as energy loss among other energy parameters, and concluded that measurement results are sensitive to variations in the test protocol.
Schwanitz et al. [20] compared three methods, namely ASTM F1614 Procedure A, ASTM F1614 Procedure B (energy set at 5 J for both methods), and the HIT method (hydraulic impact test [21]) with a peak force set at 1500 N. The authors criticised that the results of the three methods were not comparable because the HIT method produced an impact energy of 8.11 J compared to preset energy of 5 J for ASTM F1614 [8,9]. Similarly, the peak forces of ASTM F1614 procedures A and B were 992 N and 985 N, respectively, compared to the preset peak force of 1500 N for HIT.
Pisciotta and Shorten [22] used ASTM F1976 to calculate a “peak impact shock score” (maximum deceleration in g; gmax), which corresponds to peak impact forces of 809–1259 N (calculated from Pisciotta and Shorten’s data [22]), at 5 J of energy input. As a result of their user experience study, after approximately one month and 160 km of running, the shoe testers reported their overall rating of the shoe as well as their ratings of specific shoe characteristics, including perceptions of heel and forefoot cushioning, from “low” to “high” on a seven-point Likert-type rating scale. Pisciotta and Shorten’s results [22] showed that there was no significant difference between the ranks of four shoes with average ranks between 5 and 6, while the fifth shoe was rated significantly lower than the other four shoes, averaging 3.8. These ratings corresponded to gmax of 9.7–12.6 g for the first four shoes compared to an average gmax of 15.1 g for shoe number five. This result suggests that participants rate shoes lower when they are associated with a greater impact force.
Based on the results from literature sources using ASTM standards F1614-99 [8] and F1976-24 [9], as well as the critical statements of the authors, the following knowledge gaps can be defined:
- -
- Gap 1: Current standards and methods for assessing shoe heel mechanics rely either on compression with a constant and standardised energy level (e.g., 5 J [8,9]) or with a constant force (e.g., 5000 N [10] or 1500 N [21]). The reason for this choice is the comparability of test results. However, it is a fact that runners do not run with the same energy level or the same force level. An equal energy level can be ruled out a priori, as heels of different thicknesses absorb different amounts of energy at the same force. The obvious knowledge gap in this context is the search for an alternative method. The contribution to the literature and lateral innovation of an alternative method could be that it is independent of energy and force levels and yet suitable for comparing test results using new reference parameters.
- -
- Gap 2: It is well known in the literature that energy-absorbing materials have an optimal energy absorption point, namely the maximum ratio of absorbed energy to applied force. The knowledge gap in athletic footwear, particularly running shoes, is that this approach has not previously been used to evaluate and assess the mechanics of the heel segment of shoes. The contribution to the literature and the innovation of this study are the application of the optimal point method to shoe heel testing and the use of the test results to evaluate energy absorption relative to the load applied to the heel.
The aim of this study was therefore to develop a new concept and method to measure the cushioning potential of the heel of an athletic shoe independent of preset energy [8,9] or force values [10,21]. The force data or “peak impact shock score” data obtained from the current standards are only valid when runners run at 5 J compression energy at the heel.
The new concept and method developed in this study are applied to experimental aspects and conditions as well as to a variety of different athletic shoes to understand the potential and the limitations of the method for future shoe testing protocols.
2. Materials and Methods
2.1. Rationale of the Methods Used in This Study
While ASTM standards [8,9] take care of the proper impact scenario when loading the heel, the preset level of 5 J actually prevents the direct comparison of different shock-absorbing materials and structures. These shock absorbers are highly non-linear. Fixed and inflexible testing conditions are only appropriate for linear materials. Based on these issues, this study proposes to compare the damping parameters of shoe heels at the individual optimum points of energy absorption.
This optimum point, also referred to as the “shoulder point” [14,23,24], is found at the peak ratio of energy per unit volume (W) to stress (σ) in materials, and energy-absorbing structures exhibit this peak ratio of energy (E) to force (F). If an energy-absorbing structure is loaded with less force than the optimum force Fopt at the shoulder point, the structure will feel too hard due to insufficient compression. If a structure is loaded with more force than the optimum force Fopt at the shoulder point, the compression level would suggest a softer feel, but the structure is already compressed in the densification regime, bottoming out, and therefore feels too hard. Between these two extreme conditions, i.e., the optimum force Fopt before or after the shoulder point, the structure is expected to provide a “better” feel. In design terms, the two extreme conditions can be described as over- and under-designed, respectively. This method, previously applied to energy-absorbing materials [14,23,24], namely mechanical elements considered as materials [14] and structures treated as materials [14,24], opens a new perspective when applied to the energy-absorption or cushioning potential of the heel sole of sports shoes, especially running shoes. Note that the terms “energy absorption” and “cushioning” used in this study refer to large peak ratios (maximum of Eopt/Fopt) at the shoulder point and to large energy absorption Eopt at the shoulder point, regardless of whether the users are actually running at the shoulder point. What the two terms, energy absorption and cushioning, do not refer to is the reduction of the peak force at the heel, previously incorrectly referred to as the shock spike [25], because the first peak of the vertical ground reaction force during running is not a transient spike but represents the full load experienced by the heel as a loadbearing structure (referred to in this study as the first peak force, PF1; Figure 1).
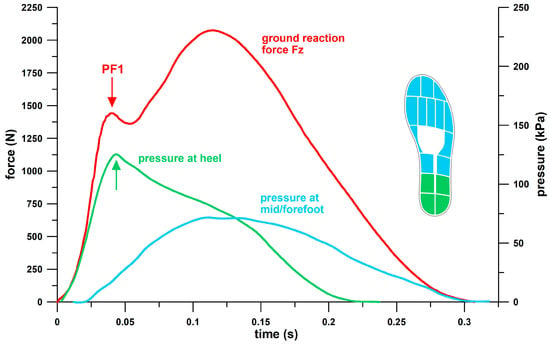
Figure 1.
Vertical ground reaction force Fz (force plate data) and foot sole pressure (Moticon insole, Moticon ReGo AG, Munich, Germany) vs. time of a participant running with a heel strike pattern at 10 kph; the pressure data were averaged (weighted by sensor areas) across the heel and mid/forefoot areas; the arrows indicate the alignment of Fz and peak heel pressure data; PF1: peak force 1, i.e., first force peak of the Fz force.
In contrast to this new method, the ASTM standard [8,9] misses much valuable information, as human runners generally do not run with heel–sole energy absorption of exactly 5 J. As shown in the Results section, different shoe models have different Eopt/Fopt ratios, as well as different Fopt and Eopt values. The reason for this variety is often due to inadvertent designs, i.e., shoes not specifically designed for defined shoulder point parameters, as the shoulder point principle was not previously known in sports shoes.
The different aspects to be considered in this context were realised through various sub-studies focusing on specific topics and research questions:
- -
- Are the shoulder point parameters affected by the compression speed? If they are insensitive to compression speed, can we use a single speed for testing?
- -
- How are the shoulder point parameters related to each other? Can we identify shoes with optimal cushioning, design flaws, and shoe groups that are better suited for cushioning? Are the shoulder point parameters different for minimal and maximal shoes? Can we identify corporate design trends related to the shoulder point parameters?
- -
- How many compression cycles do we need until a steady state of the shoulder point parameters is reached?
- -
- What is the repeatability and uncertainty of shoulder point parameters?
- -
- Does the shoe size affect the shoulder point parameters?
- -
- Does the removable insole of the shoes affect the shoulder point parameters?
- -
- Can we identify a design forgiveness parameter that provides approximately the same feeling when running with different body weight but the same shoe size?
- -
- How is PF1 (formerly: shock spike) related to Fopt, and can we identify under- and over-designed shoes?
Subsequently, the mechanics of shoulder point parameters are explained in detail.
2.2. Shoulder Point Parameters
If a function through the origin has a positive slope and the slope increases continuously, then the ratio of the integral of this function to the original function has a maximum. This is especially true for functions that asymptotically approach infinity, such as reciprocal, tangent, and circular functions, but also for xx, for example. When compressing materials or structures, the sample cannot be compressed more than its original thickness. This principle reflects the fact that the stress–strain curve asymptotically approaches infinity, actually even before the strain reaches unity. Functions such as exponentials or polynomials do not apply, since the ratio of the integral to the original function is either constant or a linear function, respectively.
Since the integral of the force F or stress σ with the deflection x or strain ε is the energy E or energy per unit volume W, the ratio of the integral to the original function is either E/F or W/σ, respectively. The maximum or peak value of these ratios is commonly referred to as the “shoulder point” ([14,23,24]). While the properties of materials are commonly reported based on the stress σ–strain ε curve, the non-normalised properties of shoes, particularly the heel segment of athletic shoes, are derived from the force F–deflection x curve. To avoid confusion, note that the first deflection or strain derivatives of F and σ are the stiffness k or the modulus E, respectively. As the energy E and the modulus E could be confused in this study, E primarily refers to energy unless explicitly referred to as modulus E.
In this study, the key performance parameters of the heel of sports shoes are as follows:
- (1)
- The maximum ratio of E to F is the ratio at the optimum point, also referred to as the shoulder point, which is used to define the remaining three parameters. Its symbol should be correctly written as (E/F)max, (= Eopt/Fopt; cf. below) but is shortened to E/Fmax in this document. E/Fmax is the optimum point of energy absorption, which is convincingly explained by Figure 2. The unit of E/Fmax used in this study for shoes is joules per kilonewton (J/kN), which collapses to a displacement after cancellation of accelerations and masses. Note that this displacement is the ratio of E at the shoulder point to F at the shoulder point (i.e., ΔE/ΔF, where Emax of ΔE = Eopt and Fmax of ΔF = Fopt, and Emin of ΔE = 0 and Fmin of ΔF = 0), and not the actual displacement x of the structure (where dx = dE/F, or x = ∫F−1 dE). The biomechanical significance of E/Fmax in the context of athletic shoes lies in the principle that the energy absorbed by the human leg during barefoot running should be absorbed as much as possible by the heel of the shoe, with the least possible load on the heel. E/Fmax provides the data for this principle.
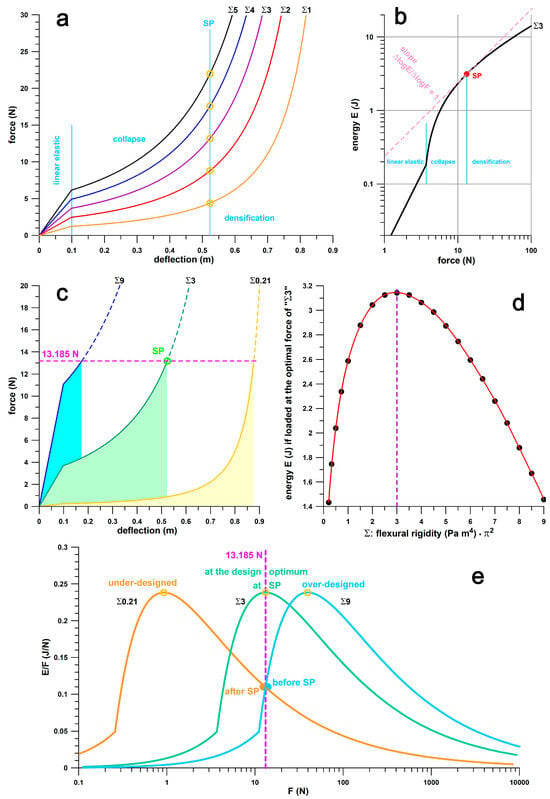 Figure 2. Shoulder point principle: (a) force vs. deflection, SP = shoulder point, Σ = flexural rigidity (Young’s modulus times the second moment of area) times π2 of the buckling element of the shock absorber; (b) energy vs. force, identification of the shoulder point from a tangent with slope =1; (c) force vs. deflection, the coloured areas under the curve correspond to the energy absorbed at a load of 13.2 N; Σ3 is loaded at the shoulder point; Σ9 is loaded before the shoulder point; Σ0.21 is loaded after the shoulder point; (d) energy E (absorbed up to a load of 13.2 N) vs. Σ; (e) ratio of energy E to force F versus force F; the three E/F vs. F curves are geometrically identical when plotted on a single logarithmic coordinate system (logF).
 - (2)
- Fopt, the force F of the structure at the shoulder point expressed in kilonewtons (kN). The biomechanical significance of Fopt in the context of athletic shoes lies in the fact that Fopt should be close to PF1 (Figure 1). The magnitude of Fopt opens the possibility of a design classification (under-, well-, over-designed heels).
- (3)
- xopt, the displacement x of the structure at the shoulder point in millimeters (mm). The biomechanical significance of xopt in the context of athletic shoes lies in the fact that the larger xopt the more energy is absorbed (since the energy absorption of a Hookean spring is E = kx2/2, where k is the stiffness of the heel). xopt is constrained by the design thickness of the heel. Minimalist shoes have a smaller xopt than maximal shoes.
- (4)
- Eopt, the energy E absorbed by the structure at the shoulder point expressed in joules (J). The biomechanical significance of Eopt in the context of athletic footwear lies in the fact that, theoretically, there is no upper limit. The higher the Eopt, the better. However, Eopt is limited by the thickness of the heel and the proximity of Fopt to PF1.
To illustrate the concept of the above key performance parameters, Figure 2 shows the shoulder point parameters of a theoretical energy absorber modelled as a buckling element [14] in series with a Hookean spring. The latter maxes out at x = 0.1 m, and the buckling element starts to buckle at the force generated at x = 0.1. Figure 2a shows the force–deflection curves of the energy absorbers whose range of flexural rigidity (EI, modulus E times second moment of area I) times π2 is 1 ≤ Σ ≤ 5 Pa m4 (where Σ = EI π2). Figure 2a shows the linear elastic phase enabled by the Hookean spring, the collapse phase after the onset of buckling, the shoulder point, and the densification phase after the shoulder point. The shoulder point is detailed in Figure 2b by plotting E vs. F on a double-logarithmic graph. The shoulder point, which is usually defined from E/Fmax, is identified here by the unique feature of d(log E)/d(log F) = unity [14]. If the energy absorber is loaded exactly at the shoulder point, Fopt equals 13.185 N in the example shown in Figure 2c. If the other energy absorbers with 0.21 ≤ Σ ≤ 9 are loaded with the same force (13.185 N) and evidently not at the shoulder point, but rather before or after, the energy E absorbed by the energy absorber (i.e., the area under the force–deflection curve) is smaller than the corresponding energy of the absorber with Σ = 3 (Figure 2c). The energy absorbed by all absorbers (0.21 ≤ Σ ≤ 9) versus Σ (Figure 2d) shows that the maximum energy is absorbed precisely at the shoulder point, compared to the energy absorbed before or after the shoulder point. The three absorbers of Figure 2c are shown on an E/Fmax vs. Fopt plot in Figure 2e. The absorber with Σ = 3 is loaded at the shoulder point, while the absorbers with Σ = 0.21 and 9 are loaded after and before the shoulder point, respectively. Figure 2c, in combination with Figure 2d,e, illustrates the importance of the shoulder point, and the optimum energy absorption at the shoulder point. Absorber Σ9 is too stiff, with a steep linear-elastic phase, so it cannot absorb enough energy. The peak load of 13.185 N results in a deflection of only 174 mm and the absorber should feel hard well before the shoulder point. Absorber Σ0.21 is too soft, so it bottoms out quickly and reaches the densification phase where the force increases steeply. Despite a deflection of 873 mm, the absorber cannot absorb enough energy either, and would therefore feel just as stiff when bottoming out well after the shoulder point. Only the Σ3 absorber can store a decent amount of energy over a deflection of 523 mm, and is assumed to feel right, or soft compared to the other two absorbers. If the chosen absorber is to cushion a force of 13.185 N, the Σ0.21 absorber is comparatively under-designed (designed for smaller forces), the Σ9 absorber is over-designed (designed for larger forces), while the Σ3 absorber is at the design optimum. If the designer is not familiar with the principles of optimum energy absorption and the shoulder point principle, the design is obviously an unwitting or inadvertent design rather than a strategic design.
Figure 3 shows the derivation of the shoulder point parameters using the PUMA RuleBreaker shoe as an example. Figure 3a combines all 4 shoulder parameters in a single diagram. Figure 3b is particularly useful for the assessment of the design outcome, as it shows E/F versus force F. In the specific case of the PUMA RuleBreaker shoe, the optimum force at the shoulder point, Fopt, is approximately 800 N. Although this force could correspond to a runner’s body weight, it is still in the PF1 range (cf. Section 2.12 and Section 3.8). However, the RuleBreaker shoe was developed for mid-foot strikers, and the heel segment does not touch the ground when standing. Even when running with a heel strike, it is very likely that the forces are distributed more between heel and midfoot than in other running shoes. In this case, Fopt is appropriate.
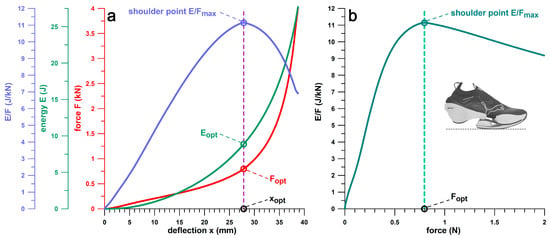
Figure 3.
Shoulder point parameters exemplified by means of the PUMA RuleBreaker heel segment: (a) ratio of energy E to force F, energy E, and force F vs. deflection x; (b) ratio of energy E to force F versus force F; E/Fmax = maximum ratio E/F at the shoulder point; Eopt, Fopt, xopt = E, F, x at the shoulder point.
2.3. Test for Compression Speed Dependence of Shoulder Point Parameters
Different test methods, such as impact tests (e.g., ASTM F1614-99 [8], procedure A) and static testing (e.g., ASTM F1614-99 [8], procedure B) are expected to generate different results, primarily because the modulus E of a viscoelastic solid increases as a function of the strain rate [26], as does the stress σ and the energy per unit volume, W, at a given strain ε. However, at the optimum (maximum) ratio of W to σ (shoulder point), the modulus E as a multiplier of the stress–strain curve (σ = E ε) cancels out in the ratio W/σ.
Two samples (70 × 70 × 10 mm) of each of four different closed cell foams were tested: A: Pebax, 160 kg/m3; B: EVA Profoam, 210 kg/m3; C: Develite, 135 kg/m3; D: Pebax, 127 kg/m3. All four foams are suitable for the manufacture of soles for sports shoes. The test methods included a static compression test (10 cycles, triangular displacement profile, constant compression speed of 10 mm/s, maximum compression of 9 mm; Z050, ZwickRoell GmbH & Co. KG, Ulm, Germany) and a dynamic one (NMB/Schenck PL10N, New Materials Bayreuth, Bayreuth, Germany). The dynamic displacement profile was sinusoidal (10 cycles), but only half of the cycle amplitude was used for compression. The four foams were tested at different cycle frequencies f (0.83, 1, 1.67, 2.27, 2.78 Hz) and corresponding compression values x (A: 6–7.79 mm, B: 5–6.9 mm, C + D: 5.9–7.7 mm), resulting in compression speeds of 2πfx mm/s (A: 31.3–136.1 mm/s, B: 26.1–120.5 mm/s, C + D: 30.8–134.5 mm/s). The range of compression velocities (static, lowest velocities; and dynamic, five velocities) was therefore larger than one order of magnitude, which is sufficient to detect any velocity dependence [26]. The cycle frequencies and compression amplitude were chosen so that the compression period and peak force resemble those during running at different speeds.
The force–displacement data were converted to stress–strain data, and the following four parameters were extracted, based on the method explained above: maximum W/σ (optimum, shoulder point value), ε at optimum, σ at optimum, and W at optimum. The slowest dynamic speed had to be excluded because the corresponding displacement did not reach the shoulder point. The velocity dependence was tested with the Friedman rank sum test for correlated samples from five groups (static speed and four dynamic speeds), with the hypothesis that the four shoulder point parameters are not velocity dependent (p-value > 0.05). In the case of p < 0.05, the post–hoc Dunn–Bonferroni test was used to identify the significantly different groups.
2.4. Shoes Tested in This Study
We tested 112 shoe models (Table 1) from 6 main brands (Puma, Adidas, Asics, Brooks, Mizuno, and Nike) and 18 other brands in this study. Most of these were running shoes; some shoes were from other sports (basketball, handball, futsal); and two shoes were for hiking and walking.

Table 1.
Overview of shoes investigated; HSS = high-speed sintering; LS = laser sintering; MJF = multi-jet fusion.
Cohort 1 consisted of shoes from Mizuno Oceania Corporation as part of the Mizuno-funded research grant “Kansei Engineering of Running Shoes” (RMIT University, 2010–2012). The specific testing method using shoulder point principles was not part of the funded project.
Cohort 2 consisted of personal sports shoes of master’s students, tested during the laboratory unit of the “sports shoe technologies” courses within the “MSc in International Sports Technology” (RMIT University, Melbourne, Australia; 2012–2016) and “MSc in Sports Technology” (University of Bayreuth, Bayreuth, Germany; 2023–2025) programs.
Cohort 3 consisted of 6 running shoes varying in their minimalist index studied for a PUMA funded project [27]: Vivobarefoot, Joe Nimble, Nike Free, Puma Liberate, Puma Velocity, and Puma Deviate Elite.
Cohort 4 included shoes used for smaller research projects such as PUMA shoes (running, handball, and basketball), Brooks shoes, and prototype CEP Omnispeed shoes. The specific testing method described below was not part of these funded projects.
Cohort 5 included shoes originally purchased for specific research projects and teaching purposes (Adidas MegaBounce, Adidas BounceTitan, Adidas SpringBlade), or received from PUMA (PUMA Rulebreaker, PUMA FastR), and were not related to a funded project.
Cohort 6 consisted of experimental shoes with additively manufactured shoe soles (Figure 4) with three different 3D-printing methods (LS, MJF, HSS), funded within the MONOMAT project (German Federal Ministry for Economic Affairs and Climate Action, Berlin, Germany). The specific test method described below was not part of the funded project, as per the funding application.
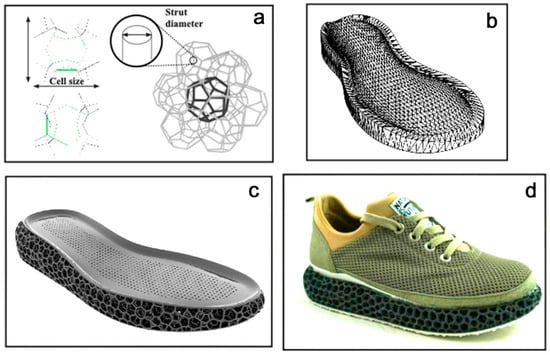
Figure 4.
Development process of the shoes with 3D-printed midsoles: (a) Weaire–Phelan unit cells; (b) 3D model of the midsole; (c) 3D-printed midsole; (d) assembled experimental running shoe.
The integral 3D structure was an open-cell structure consisting of cell edges of a Weaire–Phelan foam. The computational tessellation of a Weaire–Phelan unit cell with a corresponding cell size and strut diameter was flexibly implemented by the CAD-scripting plug-in Grasshopper (McNeel, Seattle, WA, USA) into the mid-sole geometry. Two versions (1.1 and 1.2) were manufactured with cell sizes of 15 mm × 15 mm × 15 mm and 20 mm × 20 mm × 20 mm as well as strut diameters of 16 mm and 25 mm, respectively. Three different printing processes were used: Laser Sintering (LS), High-Speed Sintering (HSS), and Multi-Jet Fusion (MJF). Due to an extremely soft feel in the preliminary test, HSS 1.1 was eliminated from the test series in the following test scenarios. The laser-sintered (LS) and high-speed-sintered (HSS) midsoles were fabricated from Rolaserit TPU PB01 powder (AM Polymers, Willich, Germany) together with a 3D Systems Vanguard HS (Vanguard, Philadelphia, PA, USA) or VX 200 (Voxeljet, Friedberg, Germany), respectively. The MJF sole was manufactured from Ultrasint TPU1 powder (BASF, Ludwigshafen, Germany) via the MJF machine HP 5200 (HP, Palo Alto, Santa Clara, CA, USA). A conventional carbon rubber sheet, commonly used in running shoes, was glued to the underside of the 3D-printed midsole. A textile mesh based on polyester fibers was used for the shoe’s upper, which was glued to the midsole.
2.5. Test Method
The shoes were tested (Figure 5) using a modified ASTM-F1614-99 [8], Procedure B (force-controlled). The following modifications were required:
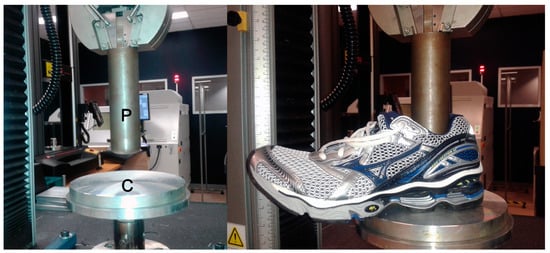
Figure 5.
Test procedure for heel compression (Mizuno Wave Creation 12); P = plunger; C = compression platen.
- (1)
- ASTM-F1614-99 [8] specifies that a maximum energy in the range of 5 ± 0.5 J be applied to the shoes. Since the optimum point of energy absorption is not necessarily at or before the 5 J limit, the heel segment of the shoes was compressed up to 3 kN, and when the optimum point was not within this force range, larger compression forces up to 5 kN were applied. Note 3 of ASTM-F1614-99 (There is no evidence to support comparisons of data for tests which used … different reference maximum energy … [8]) is not applicable because the shoulder point parameters remain the same regardless of the maximum compression force as long as it exceeds the optimum point. In contrast to this note, in light of the results of the present study, we consider a limit of 5 J as inappropriate, since the optimum point in terms of optimum displacement x, force F, and energy E varies from shoe to shoe.
- (2)
- Anticipating the results of Section 2.3. (test for compression speed dependence of shoulder point parameters), the displacement profile used for heel compression was triangular (rise, fall, dwell), with a constant deflection rate of 10 mm/s up to the selected maximum force, programmed on static material testing machines (Instron 5569, Norwood, MA, USA; Z050, ZwickRoell GmbH & Co. KG, Ulm, Germany). The dwell segment resulted from the air gap between the plunger and the inner sole. The displacement profile was applied for 5 cycles, and the data from the last cycle were processed to calculate the shoulder point data. The data sampling frequency was 200 Hz.
This method was applied to 7 sub-studies to address specific aspects of this method, which are explained below.
2.6. Influence of Conditioning and the Minimum Number of Cycles Required for Testing
For viscoelastic solids, repeated loading cycles at small cycle numbers show a transient phase, e.g., decreasing peak forces, before reaching a steady state. This sub-study was designed to test whether the shoulder point parameters also undergo a transient phase and how many cycles are required to reach the steady state. A visual inspection of pre-test data showed that the steady state starts with the fifth cycle. To verify this result, six shoes (Asics GelKayano17, Mizuno WaveCreation 12, Nike Free, Brooks GTS, Adidas SpringBlade and Adidas MegaBounce) were tested. The four shoulder point parameters of each shoe were normalised to the reference value of cycle 5, and the following reciprocal function
was fitted to the data, where P denotes any shoulder point parameter, a is the amplitude parameter, n is the cycle number, b denotes the phase shift, and c is the offset. A difference of 0.01 (1%) between the normalised parameter at n = 4 predicted from Equation (1) and the normalised parameter at n = 5, which was equal to 1, was considered acceptable to identify cycle 5 as the beginning of steady state.
2.7. Repeatability of Shoulder Point Parameters
The six shoes used in the previous sub-study were each tested 10 times, with a rest period of at least 24 h between each test. Each shoulder point parameter was normalised to the mean of each shoe, expressed as a percentage minus 100%, i.e., the percentage difference between individual data and their mean. The uncertainty was calculated from the standard deviation of this difference. The standard error of the mean (=0%) was calculated from the uncertainty divided by √60.
2.8. Comparison of Shoulder Point Parameters of Different Shoes
The shoulder point parameters of all shoes were plotted against each other (e.g., E/Fmax vs. Eopt) to identify various design trends, outliers, and classification schemes (e.g., not or poorly designed for energy absorption, under-designed, well-designed, over-designed), and to determine how these trends and classifications relate to the leading athletic shoe companies. This graphical and interpretation-based approach is used to understand the dynamic interaction between shoulder point parameters and the design of a shoe heel. Since the six shoes in Cohort 3 represent a defined range from minimum to maximum shoes, we examined how the shoulder point parameters relate to, and vary within, this range.
The shoulder point parameters of the Cohort 3 shoes (3 sizes, left and right) were compared using the Kruskal–Wallis rank sum test for multiple independent samples, and the post–hoc Conover p-values of all possible pairs of the six groups were additionally adjusted using the Benjamini–Hochberg FDR method.
2.9. Influence of Shoe Size on Shoulder Point Parameters
If shoes of the same model but different size are tested with the same plunger size, we can assume that the magnitude of the shoulder point parameters depends on the shoe size S to some extent.
The following shoes and EU-sizes were available for this sub-study: Asics GelKayano17 (40.5, 47), Brooks GTS11 (40.5, 45.5), Mizuno WaveCreation12 (38.5, 46.5), Mizuno WaveElixir4 (39, 43), Mizuno WaveMusha3 (38.5, 42.5), Nike Free (40.5, 47), Joe Nimble Addict (39, 42, 45), Nike Free5.0 (40, 42.5, 45), Puma DeviateElite 2 (39, 42, 44.5), Puma Liberate (39, 42, 44.5), Puma Velocity2 (39, 42, 44.5), Vivobarefoot PrimusLite (40, 43, 46), Brooks Ghost15 (36.5, 40.5, 42). A total of 27 pairs (smaller and larger S) were tested, with a size difference, ΔS, between 1.5 and 8 (median 4, IQR 2.5). Shoes with 2 sizes counted as 1 pair, shoes with 3 sizes as 3 pairs. The calculated shoulder point parameters were compared using the Wilcoxon signed rank test (for correlated samples) to determine if the mean difference (between pairs) was equal to zero. To understand the effect of different sample areas, tested with the same plunger size, on the shoulder point parameters, samples of the same foam with areas of 25, 36, 49, 64, 81, and 100 cm2 and a thickness of 20 mm were tested using the same test procedure as described above (Figure 5), and the shoulder point parameters were calculated.
2.10. Influence of the Insole on the Shoulder Point Parameters
Sports shoes are usually equipped with a removable insole. The following available shoes were tested with and without an insole: Asics GelKayano17 (EU 40.5), Brooks Ghost15 (EU 36.5), Brooks Ghost15 (EU40.5), Brooks Ghost15 (EU42), Brooks GTS11 (EU 45.5), Mizuno WaveMusha3 (EU 41), Mizuno WaveRider12 (EU 43), Nike Free (EU 43). The calculated shoulder point parameters were compared using the Wilcoxon signed rank test (for correlated samples) to assess whether the mean difference (between shoes with and without an insole) is equal to zero.
2.11. Proposal for a Design Forgiveness Measure
Figure 6 shows the E/F vs. F curves of two shoes. The selected shoes, Vivobarefoot Primus Lite and PUMA Liberate, share the same Fopt (≈920 N), and the same ascending shank of the E/F vs. F curve, when plotting E/F with different scaling. A line at 97.5% of E/F vs. F intersects the E/F vs. F curve twice, before (Fmin) and after (Fmax) the shoulder point (peak). As explained in Section 2.2, heel soles are expected to feel softer when compressed to the shoulder point, compared to a harder feel well before or after the shoulder point. However, near the shoulder point, just before and after, when the E/F vs. F curve flattens out, there is probably no noticeable difference in hardness/softness. Therefore, if we reduce E/Fmax by, say, 2.5%, and use the force window that is valid for 0.975 E/Fmax ≤ E/F ≤ E/Fmax, that is, Fmax–Fmin, we get a measure of how compliant or forgiving the heel sole is designed to accommodate design errors. The forgiveness ϝ parameter is equal to the difference of Fmax–Fmin. A heel sole with a platykurtic shape of the E/F vs. F curve is more forgiving than that of a leptokurtic shape. Rather than using the actual kurtosis value of the E/F vs. F curve, a force window is more comprehensible and practically applicable. The reason for selecting the force window across and above a level of E/Fmax minus 2.5% resulted from the problem that the heel soles had to be compressed to acquire force data covering the Fmax reference point after the shoulder point. As shown in Figure 6, the PUMA Liberate shoe is less forgiving (ϝ = 546 N) than the Vivobarefoot shoe (ϝ = 1801 N) with more than three-times-larger ϝ. Fmin, Fmax, and ϝ were normalised to Fopt, expressed as a percentage, to effectively compare shoes with different Fopt. The forgiveness factors ϝ% of the following shoes (3 sizes, left and right) were compared using the Kruskal–Wallis rank sum test for multiple independent samples, and the post–hoc Conover p-values of all possible pairs of the seven groups were additionally adjusted using the Benjamini–Hochberg FDR method: Vivobarefoot PrimusLite, Joe Nimble Addict, Nike Free5.0, Puma Liberate, Puma Velocity2, Puma DeviateElite 2, Brooks Ghost15.
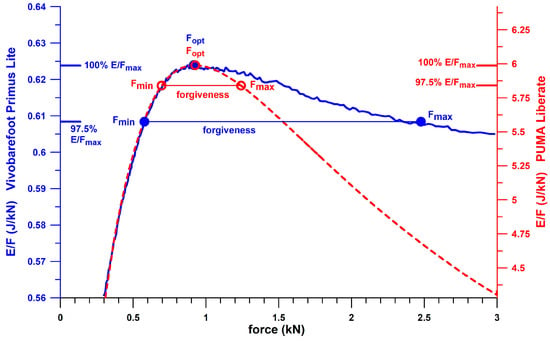
Figure 6.
Forgiveness range of two shoes; ratio of energy E to force F versus force F; E/Fmax = maximum ratio E/F at the shoulder point; Fopt = F at the shoulder point; Fmin, Fmax = lower and upper boundary of the forgiveness range (= Fmax–Fmin).
2.12. Measurement of the First Force Peak
The first force peak of the vertical ground reaction force, PF1, was measured when running over a force plate [27]. For this purpose, 19 female and 18 male runners were recruited (age 23.05 ± 1.99 yr and 26.50 ± 7.23 yr, respectively). The inclusion criteria were an age between 20 and 45 years and a minimum weekly running distance of 12 km. All participants gave their informed consent for inclusion in the study before participating in the study. The study was conducted in accordance with the Declaration of Helsinki and approved by the Ethics Committee of the University of Bayreuth (Approval-No. 23–041).
The participants were asked to run with six predefined shoe models ranging from minimalist to maximalist running shoes (Cohort 3, Section 2.4) as well as barefoot and with their personal running shoes. Ground reaction forces and centre of pressure (COP) were recorded using two 3D force plates (9287, Kistler Instruments AG, Winterthur, Switzerland). Each participant’s running speed was measured using two light barriers (Speedtrap 2, Brower Timing Systems, Draper, UT, USA) placed 4 m apart with the force plate in between.
After a five-minute warm-up with the subject’s personal running shoes, runs were performed in a random order with the eight footwear conditions. For each condition, the participant first ran for one minute each on a treadmill (stellar med, h/p/cosmos sports & medical GmbH, Nussdorf-Traunstein, Germany) at 80% and 100% of their individual training speed and at 10 kph. Subsequently, six valid runs over ground were recorded at the individual training speed and a running speed of 10 kph. Based on the data on the vertical ground reaction force, the magnitude of first peak force PF1 was determined and measured and finally compared with Fopt of the shoe models.
2.13. Summary of the Sub-Studies Described in the Methods Section
Figure 7 summarises the various components of the study. It is divided into the main study, which directly addresses the evaluation of footwear using the shoulder point parameters, and three clusters of sub-studies addressing defined research questions necessary for a better understanding and practical applicability of the shoulder point parameters.
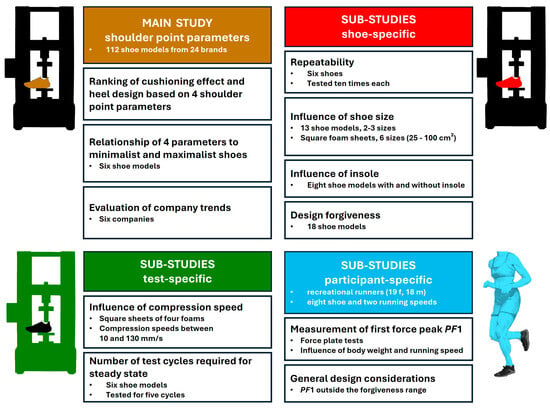
Figure 7.
Flowchart of the study process; PF1: peak force 1, the first force peak of the Fz force.
3. Results
3.1. Influence of Compression Velocity on Shoulder Point Parameters
Figure 8 shows the four shoulder point parameters (maximum W/σ; and ε, σ, and W at the optimum) compared to compression speed. No clear velocity-dependent trend is evident. The Friedman rank sum test for correlated samples showed that no pair of velocity groups in ε and σ showed a velocity dependence (p = 0.423 and 0.107, respectively), while only one pair (out of 10) of W/σ and W showed a significant velocity dependence (p = 0.036 in both cases). The W/σ median (0.2349) at speed 2 (37–44 mm/s) was significantly larger than that (0.2342) at speed 5 (121–136 mm/s); and the W-median (55.2 kJ/m3) at speed 2 (37–44 mm/s) was significantly greater than that (53.7 kJ/m3) at speed 4 (98–110 mm/s). The significant velocity dependence in only two pairs compared to insignificant dependence in 38 pairs suggests that a static test is sufficiently accurate to calculate the four shoulder point parameters related to the optimal cushioning effect of sports shoes, and therefore confirms the hypothesis stated in Section 3.2.
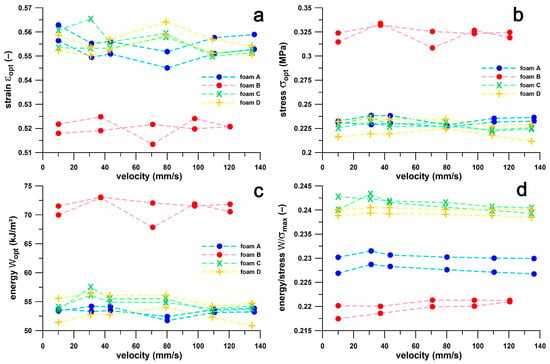
Figure 8.
Shoulder point parameters of four foams (A, B, C, D; two samples each) versus crosshead speed (mm/s).
3.2. Comparison of Shoes by Shoulder Point Parameters
Figure 9 provides a comprehensive overview of all shoes by their E/Fmax vs. Eopt. The general principle of the main fit line (blue dots) and the secondary fit line (red dots) is that the more energy is absorbed, the greater the E/Fmax. For the same energy absorption between 4.5 and 13.5 J, E/Fmax of the secondary line is 1.6–1.4 larger than that of the main line. The shoes located on the secondary line are mainly PUMA shoes (Puma_Deviate Elite 2, Puma_Liberate, Puma_Velocity 2, PumaFastR), as well as Brooks Ghost 11, CEP Omnispeed, On_Cloudneo (PEBAX foam), and Saucony_Endorphin.
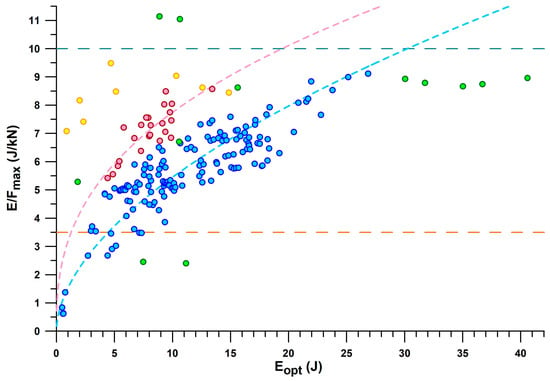
Figure 9.
E/Fmax versus Eopt; blue dots: main line (cf. text of Section 3.2); red dots: secondary line; green dots: outliers (shoes that do not fit into main and secondary lines); yellow dots: additively manufactured shoe soles; dashed curves: power-law fits of main and secondary lines.
Minimalist shoes are at the lower end of the E/Fmax and Eopt scale, such as Vibram Bikla (“5 fingers”), Vivobarefoot, and Joe Nimble. The best shoe in the main line is the ASICS GelKayano17, with a maximum E/Fmax of 9.1 J/kN. The best shoe on the secondary line is the CEP Omnispeed (prototype v5) shoe with a maximum E/Fmax of 8.6 J/kN.
As can be seen in Figure 9, there are a few outliers. One Nike Airmax appears to be on the secondary line, but its cushioning technology is based on a pneumatic damper rather than closed-cell foam technology. Another Nike Airmax250 had its air bubble burst, so its Eopt was only 1.8 J, and its Fopt was only 0.35 kN, but its E/Fmax was still an acceptable value of 5.29 J/kN compared to other shoes. The intact shoe of the same pair showed the following values: Eopt: 10.6 J; Fopt: 1.58 kN; and 6.71 J/kN.
Adidas Nitrocharge is an indoor soccer shoe with a thin sole and thus a very low E/Fmax (2.4 J/kN) typical for minimalist shoes, but with a larger energy absorption than minimalist shoes. Nike ZoomAir is a skateboarding shoe with a stiffer heel segment. Adidas Bounce Tube shoes (MegaBounce and BounceTitan) absorb more energy (30.0–40.5 J) than other shoes with the same E/Fmax ratio (8.8 J/kN on average), which is because the excessive Fopt ranges between 3.4 and 4.5 kN (Figure 10). A similar excessive Fopt is found in the Adidas Nitrocharge shoe with 4.6 kN, the largest Fopt force in the dataset, despite the smaller Eopt (11.2 J).
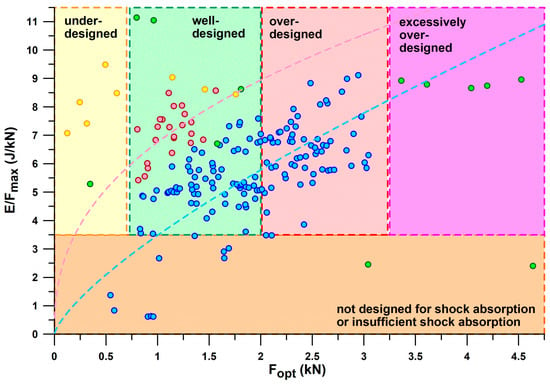
Figure 10.
E/Fmax versus Eopt; blue dots: main line (cf. text of Section 3.2); red dots: secondary line; green dots: outliers; yellow dots: additively manufactured shoe soles; dashed curves: power-law fits of main and secondary lines.
The largest E/Fmax of the dataset is found in the PUMA RuleBreaker shoe, with 11.1 J/kN (presumably due to the increased sole thickness), at an Eopt of 8.9 J and 10.3 J (heel only, and heel + midsole pad, respectively) and an Fopt of 0.80 kN and 0.96 kN, respectively. The 3D-printed shoes consist of two batches characterised by Eopt < and > 7.5 J, due to smaller and thicker strut diameters. All 3D-printed shoes have a large E/Fmax between 7 and 9.5 J/kN.
A cluster of shoes with E/Fmax < 3.5 J/kN (Figure 9) and xopt < 13.5 mm is considered as shoes with insufficient energy absorption. This cluster consists of the following shoes: Vivobarefoot_Primus Lite (minimalist shoe), Vibram Bikla (minimalist shoe), Bugatti (dress shoe), Adidas Nitrocharge (indoor soccer shoe), Nike ZoomAir (skateboard shoe), INov-8-roadx233, Nike Jordan1 Zoom (worn), Nike HyperVenom (soccer shoe), Adidas Fluidstreet (minimalist shoe, worn), Nike Total90 (soccer shoe), and Brooks Adrenalin. The insufficient energy absorption could have different reasons: (1) the shoes were not designed for energy absorption (soccer and skateboard shoes; minimalist shoes; dress shoes); (2) the shoes were worn regularly for more than one year; or (3) the low energy absorption is an inadvertent effect of the shoe design.
The shoes that were just outside the group of shoes with insufficient energy absorption were Joe Nimble Addict, Nike ZoomHyperfuse, and NewBalance (550 and 1150).
Figure 10 shows E/Fmax versus Fopt, taking the information provided in Figure 9 one step further. Based on the threshold of E/Fmax < 3.5 J/kN to define shoes with insufficient energy absorption, and the window of the first peak force (PF1) of the vertical ground reaction force during running, the shoes can be further classified. PF1 ranged from 0.69–1.97 kN (1.17 ± 0.28 kN) during valid heel strikes of the participants studied. Based on these limits (0.7 and 2 kN), we can define a shoe range suitable for well-designed heel segments for running. Well-designed means that PF1 is close to Fopt within this range, depending on body weight, running motion (within the heel-striker cohort), and running speed. Shoes with Fopt < 0.7 kN are under-designed (first batch of 3D-printed shoe soles with thinner struts; also Nike Airmax 270 with a perforated bladder), which leads to running after the shoulder point, where energy absorber densifies and eventually maxes out. Heels with 2 kN < Fopt < 3.2 kN are over-designed, leading to running before the shoulder point and thus the runner cannot reach this optimum point. This means that runners run at E/F values smaller than the E/Fmax value. Heels with Fopt > 3.2 kN are excessively over-designed, which only applies to Adidas Bounce Tube shoes. The classification of the shoes into under-, well-, and over-designed heel segments only applies to the group of participants studied (body mass: 68.4 ± 10.4 kg, range 47–91.8 kg), who were normal-weight recreational runners. As will be shown later in this document, runners with a higher body mass run with a higher PF1.
If only shoes that are in the range of well-designed heel segments (0.7 kN < Fopt < 2.0 kN) are considered, the best-performing shoes of the major sports shoe manufacturers examined (Figure 11), from largest best to smallest best E/Fmax per manufacturer, are as follows:
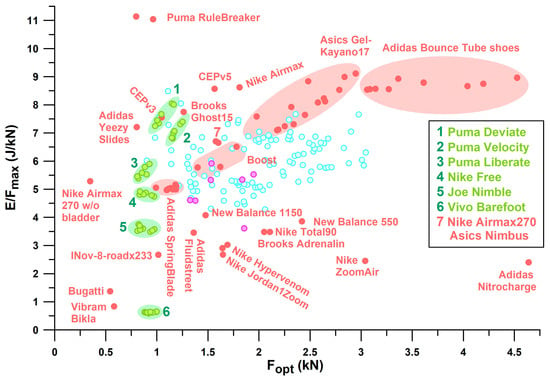
Figure 11.
E/Fmax versus Eopt; identification of selected shoes; purple dots: basketball and handball shoes; blue dots: remaining shoes not further specified; Boost: thermoplastic polyurethane particle foam (one Puma shoe, two Adidas shoes).
Puma: Rulebreaker, E/Fmax = 11.05–11.14 (J/kN).
Nike: Airmax, E/Fmax = 8.63 (J/kN).
Brooks: Ghost15, E/Fmax = 7.75 (J/kN).
Mizuno: Wave Rider, E/Fmax = 7.59 (J/kN) for Fopt < 2 kN. The largest E/Fmax of WaveElixir4, namely 8.09, is not applicable, as the shoe is over-designed (Fopt > 2 kN), which means that runners cannot reach the shoulder point.
Adidas: Yeezy Slide at the lower limit of the PF1 range with an E/Fmax of 7.21 (J/kN); the largest E/Fmax of Bounce Tube shoes ranging from 8.54 to 8.97 (no other Adidas shoe within this range) is not applicable, as these shoes are excessively over-designed (Fopt > 3.2 kN).
Asics: Nimbus, E/Fmax = 6.66; Gel Kayano17 with the largest E/Fmax of 7.1–9.12 (no other Asics shoe within this range) is not applicable as the shoe is over-designed (Fopt > 2 kN).
Figure 12 combines the information contained in Figure 10 and Figure 11 individually by plotting Eopt vs. Fopt, which reflects the mechanical principle that the greater the force applied to a shock absorber, the more energy is absorbed. Any straight line through the origin of the graph shown in Figure 12 has a slope equal to E/Fmax. Shoes located on steeper lines have a better energy absorption at the heel sole. The advantage of Figure 12 is that it graphically reduces the E/Fmax-variation of 3D-printed soles, CEP Omnispeed (prototype 5), Nike Airmax, Asics Gel Kayano 17 and Adidas Bounce Tube shoes, so that they appear to lie on a line of E/Fmax ≈ 8.834 J/kN.
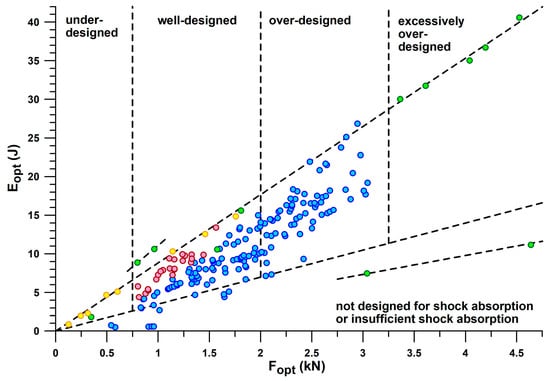
Figure 12.
Eopt versus Fopt; blue dots: main line; red dots: secondary line; green dots: outliers; yellow dots: additively manufactured shoe soles.
Figure 13 shows the plot of E/Fmax vs. xopt. Any straight line through the origin of the graph (Figure 13) has a slope equal to E/Fmax/xopt. This diagram adds another dimension to the shoulder point parameters. While the shoes of main and secondary lines now overlap, other shoes are separated from the two lines, namely 3D-printed shoes with the largest ratio of E/Fmax to xopt, which deflect less than other shoes with the same E/Fmax (this also includes the Puma Rulebreaker shoe, heel only, without midsole pad). Another sequence of three shoes at the lower end of E/Fmax/xopt have a common feature: they are all Puma handball shoes which deflect more than other shoes with the same E/Fmax. The separation of the cluster of shoes with inadequate energy absorption, defined above by E/Fmax < 3.5 J/kN (Figure 9) and xopt < 13.5 mm, is now clearly visible in Figure 13.
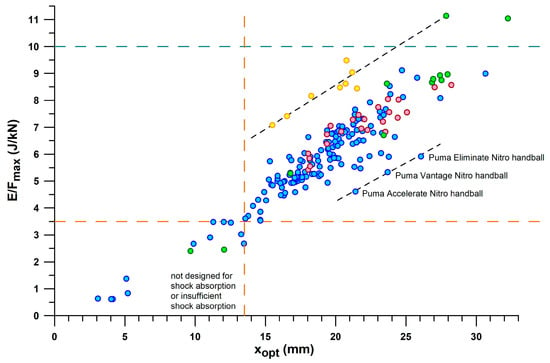
Figure 13.
E/Fmax versus xopt; identification of selected shoes; blue dots: main line; red dots: secondary line; green dots: outliers; yellow dots: additively manufactured shoe soles; the dashed lines show that three Puma shoes are located on one line at the lower end of the point cloud, and 3D-printed shoes plus the Puma Rulebreaker shoe (heel only) on another line at the upper end.
Figure 14 shows the plot of Fopt vs. xopt. This graph divides the shoes into clusters with insufficient energy absorption (xopt < 13.5 mm) and the bulk of shoes, and the latter, in turn, into sections with under-designed, well-designed, and over-designed heel segments. It also shows that the maximum xopt (>30 mm) is shared by two shoes, Puma Rulebreaker shoe (heel plus midsole pad) with xopt of 32.2 mm, and Asics Gel Kayano 17 with xopt of 30.7 mm. At approximately the same xopt, Asics Gel Kayano 17 produces an Fopt three times higher than the Puma Rulebreaker.
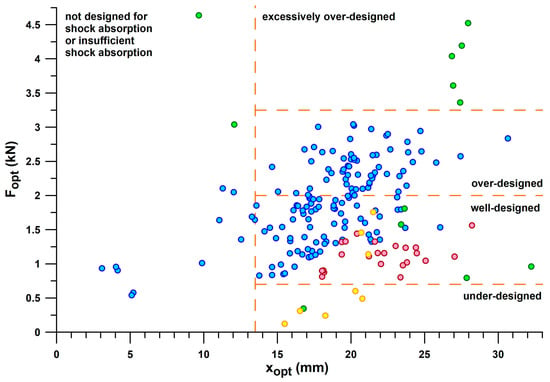
Figure 14.
Fopt versus xopt; blue dots: main line; red dots: secondary line; green dots: outliers; yellow dots: additively manufactured shoe soles.
Comparing minimalist shoes to maximalist shoes (Figure 15), it appears that E/Fmax and xopt, and Eopt correlate well (R2 > 0.92) with the minimalist index and the stack height, but not with Fopt (R2 < 0.46). The minimalist index correlated well with the stack height (R2 = 0.9533). From the Kruskal–Wallis statistic and the post–hoc Conover p-values, E/Fmax (Figure 15a) was significantly different in all six shoes (p < 0.0004). For Eopt (Figure 15b) there was no significant difference between Puma Velocity and Puma DeviateElite (p = 0.3228); all other shoes were significantly different (p < 0.0092). For Fopt (Figure 15c), there was no significant difference between Puma Velocity and Puma DeviateElite (p = 0.1899, although their IQRs only slightly overlapped), and the remaining four shoes (0.0588 < p < 0.7708). In both Eopt and Fopt, the means and averages of Puma DeviateElite were smaller than those of Puma Velocity, although not significantly different. For xopt (Figure 15d), there was no significant difference between Puma Velocity and Puma DeviateElite (p = 0.4112); all other shoes were significantly different (p < 0.0025).
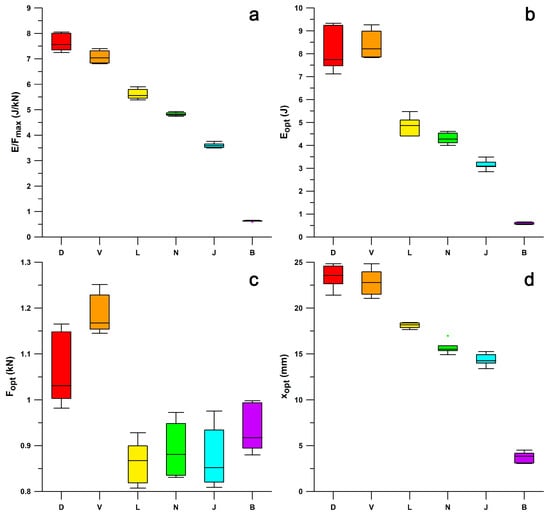
Figure 15.
Shoulder point parameters of shoes of Cohort 3; boxplots of (a) E/Fmax, (b) Eopt, (c) Fopt, (d) xopt; ● = outlier; B = Vivobarefoot, J = Joe Nimble, N = Nike Free, L = Puma Liberate, V = Puma Velocity, D = Puma Deviate Elite.
Of the six major companies identified in Table 1, Asics and Brooks shoes show the same trend of E/Fmax vs. Eopt, while Nike shoes show a slightly smaller E/Fmax with a larger Eopt (Figure 16). Likewise, Puma, Adidas, and Mizuno share the same trend, with Puma shoes showing on average a 10% to 20% higher E/Fmax than Adidas and Mizuno, between 5 J ≤ Eopt ≤ 15 J. Vertical lines mark the beginning of over-designed heels, i.e., from Fopt ≈ 2 kN. Puma shoes had the smallest Eopt range within the window of 2 kN ≤ Fopt ≤ 3 kN, while Asics had the widest (i.e., maximum number of over-designed shoes). Of all the shoe models tested across the six major companies, Asics shoes had the lowest number of well-designed heel soles (54%), while Puma had the highest number (93%). In addition, Puma shoes have, on average, the largest E/Fmax value within the well-designed range.
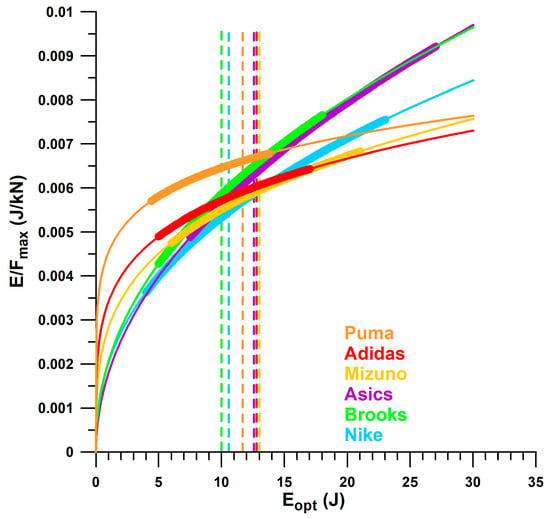
Figure 16.
Company trends (refers only to the shoes tested in this publication; Puma shoes without Rulebreaker; Adidas shoes without Bounce Tube shoes); thin curves = general power law trend; bold curves = curve segment for the actual Eopt range; vertical dashed lines = energy value approximately corresponding to Fopt at 2 kN.
3.3. Transient Phase and Steady State of Shoulder Point Parameters with Respect to the Test Cycle Numbers
Figure 17 shows the shoulder point parameters versus cycle numbers from 1 to 5. The data are generally larger in the first cycle. Figure 18 shows the data from Figure 17 normalised to the data of the fifth cycle and the fit function according to Equation (1). The differentials between the normalised parameter at n = 4 predicted from Equation (1) and the normalised parameter at n = 5 (at unity) were generally less than 0.01, and specifically 0.0032, 0.0051, 0.0040, and 0.0025 for E/F, E, F, and x, respectively. These results are less than 1% of the parameter size in the fifth cycle.
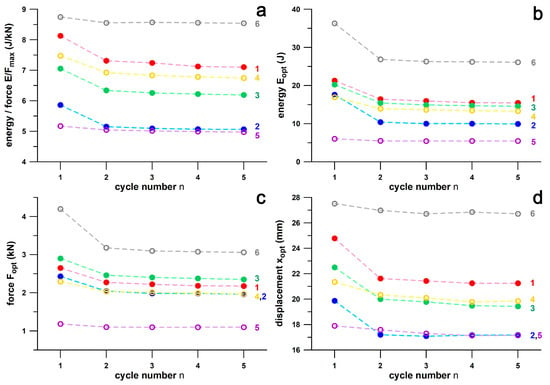
Figure 17.
Shoulder point parameters vs. cycle number; (a) energy/force; (b) energy; (c) force; (d) displacement; 1: Asics GelKayano17, 2: Mizuno WaveCreation12, 3: Nike Free, 4: Brooks GTS, 5: Adidas SpringBlade, 6: Adidas MegaBounce.
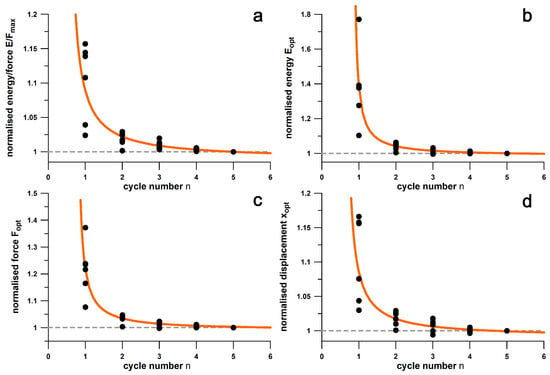
Figure 18.
Normalised shoulder point parameters vs. cycle number; (a) normalised energy/force; (b) normalised energy; (c) normalised force; (d) normalised displacement; E: energy; F: force; x: displacement; ●: data of six shoes (cf. Figure 17); orange curve: fit function according to Equation (1).
3.4. Repeatability Results of Shoulder Point Parameters
Figure 19 shows the data distribution of ten tests per shoe about the mean of six shoes (percent deviation from the mean of each shoe). The uncertainty of xopt, Fopt, Eopt, and E/Fmax was 3.24%, 6.01%, 6.32%, and 1.89%, respectively. The standard error of the mean of xopt, Fopt, Eopt, and E/Fmax was 0.418%, 0.776%, 0.816%, and 0.244%, respectively. Table 2 shows the individual repeatability of the six shoes. Nike Free had the best repeatability on average, while Adidas MegaBounce had the worst.
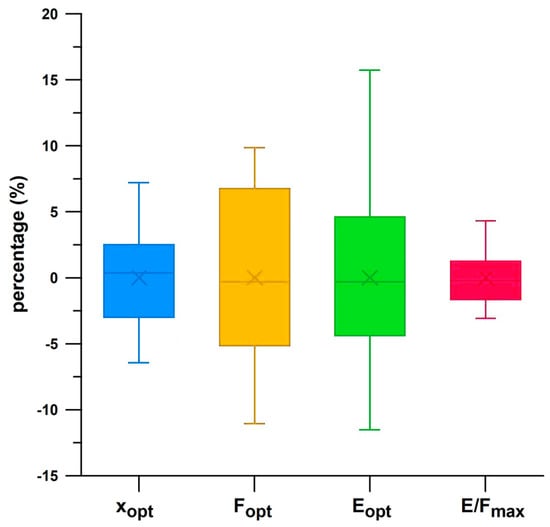
Figure 19.
Repeatability of shoulder point parameters from six shoes combined, expressed as the percent deviation from the mean of each shoe.

Table 2.
Repeatability of six shoes expressed as the interquartile range (IQR) as a percentage; the data under “ALL” shoes correspond to those shown in Figure 19; the IQR data are colour coded in each row (red: high, green: low).
3.5. Influence of the Shoe Size on Shoulder Point Parameters
The difference in shoulder point parameters between two shoes of sizes S was calculated from the differential between magnitude of larger S parameter and magnitude of smaller S parameter. The results of the Wilcoxon test showed that there were significant differences in all four shoulder point parameters (between two shoe sizes). For a mean ΔS of 4.15 (p < 0.0001), the mean of ΔE/F was 0.29 J/kN (p = 0.0003), the mean of ΔE was 1.21 J (p = 0.0002), the mean of ΔF was 0.11 kN (p = 0.0018), and the mean of Δx was 1.13 mm (p = 0.0027). Note that all means were positive, which explains that larger shoe sizes correlate with larger E/F, E, F, and x. This means that when testing shoes with the same plunger dimensions, the shoulder point parameters of larger shoe sizes are overestimated compared to smaller sizes, or parameters of smaller shoe sizes are underestimated compared to larger sizes.
Across a mean ΔS of 4.15, which corresponds to 8.8% of the maximum size of S, i.e., 47, the changes in the shoulder point parameters are relatively small (after excluding Adidas Bounce Tube and Nitrocharge shoes with excessive Fopt):
- -
- ΔF of 0.11 kN corresponds to 3.6% of maximum Fopt (3.044 kN);
- -
- ΔE of 1.21 J corresponds to 4.5% of maximum Eopt (26.85 J);
- -
- Δx of 1.13 mm corresponds to 3.5% of maximum xopt (32.25 mm);
- -
- ΔE/F of 0.29 J/kN corresponds to 2.6% of maximum E/Fmax (11.14 J/kN).
To understand the dynamics of testing different shoe sizes, square sheet samples of the same foam material but with varying side length were tested with the same plunger size (50 mm in diameter). Table 3 lists the sample area and the corresponding values of the shoulder point parameters. In Figure 20, the data are normalised to the values obtained at maximum area.

Table 3.
Shoulder point parameters and area of foam sheets.
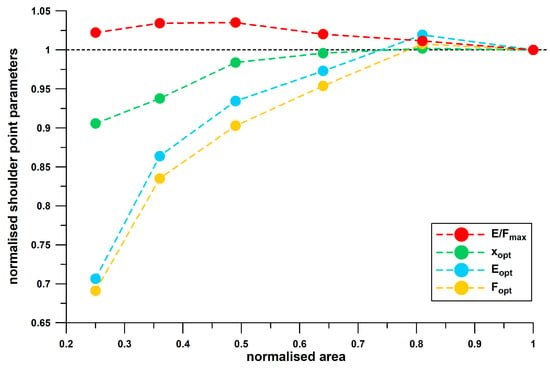
Figure 20.
Normalised shoulder point parameters versus normalised area of foam sheets (100 cm2 corresponds to 1).
Figure 20 shows that the normalised shoulder point parameters, xopt, Fopt and Eopt, increase nonlinearly with area, until the second largest area, where the data appear to asymptotically approach unity. This behaviour confirms the result obtained from the heel soles. Since the normalised Eopt data are slightly larger than the Fopt data, the normalised E/Fmax values are greater than 1 and decrease with increasing area, and asymptotically approach 1 starting at the second largest area. This behaviour contrasts with the result obtained from the heel soles, where E/Fmax increases with increasing size.
3.6. Influence of the Insole on Shoulder Point Parameters
The difference in the shoulder point parameters between two pairs was calculated as follows: the magnitude of the shoe parameter with insole minus magnitude of the shoe parameter without insole. The results of the Wilcoxon test showed that there were significant differences in all four shoulder point parameters (between with and without insoles). The mean of ΔE/F was 0.65 J/kN (p = 0.0005), the mean of ΔE was 0.67 J (p = 0.0271), the mean of ΔF was –49.3 N (p = 0.0308), and the mean of Δx was 4.17 mm (p = 0.0005). While the means of ΔE/F, ΔE, and Δx were larger than zero, the mean of ΔF was slightly but still significantly less than zero.
3.7. Design Forgiveness Parameter
In general, the larger Fopt, the larger the Fmin, Fmax, and forgiveness ϝ (Figure 21a). However, the R2 value of Fopt vs. ϝ is only 0.1270 (p = 0.0047). The correlations shown in Figure 21a are influenced by a cluster of outliers (highlighted with coloured ellipses in Figure 21a). These outliers are exclusively the Vivobarefoot Primus Lite shoes, with an excessive ϝ between 1 and 2 kN, a range expected by the linear regression function at 0.6 kN. When the Vivobarefoot outliers are excluded, R2 improves to 0.7478. The same outlier problem occurs when plotting ϝ vs. Fmin and Fmax. However, when plotting the normalised parameters ϝ% against Fmin% and Fmax% (Figure 21b), non-linear regressions (second-order polynomial) reduce the outliers to a minimum. The normalised forgiveness ϝ% of Vivobarefoot Primus Lite shoes ranges from 100% to 200%, while ϝ% of most of the other shoes range between 45% and 85% (Figure 21b).
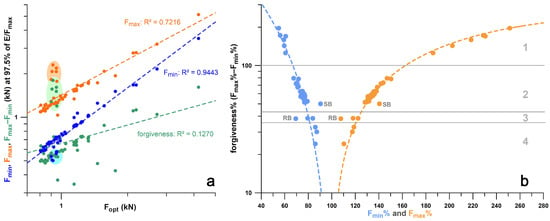
Figure 21.
Correlations of force markers (cf. Figure 5) at E/F > 0.975 E/Fmax: (a) minimum (min) and maximum (max) forces and their differential (forgiveness) vs. Fopt; the ellipses shaded in light orange; green and blue indicate the outliers (Vivobarefoot Primus Lite); (b) forgiveness as percentage of Fopt vs. Fmin and Fmax as percentages of Fopt; the second-order regression functions (dashed) converge to 100% at a forgiveness at 0 N; SB = Adidas SpringBlade; RB = PUMA RuleBreaker (heel only); zones 1,2,3,4 categorise different clusters of shoes; zone 1: Vivobarefoot Primus Lite; zone 2: main bulk of shoes (PUMA: Deviate, Liberate, Velocity, FastR, RuleBreaker with midsole; Joe Nimble Addict; Nike Free; Gel Kayano; Nike Airmax; CEP Omnispeed Bowtech Bounce; Saucony Endorphin; Brooks Ghost); zone 3: PUMA RuleBreaker (heel only), NikeAirVisiPro, Adidas MegaBounce; zone 4: 3D-printed shoe soles.
Figure 22 shows the boxplots of the actual values and the corresponding ranks of seven groups of shoes (cohort 3, and Brooks shoes of cohort 4). The ranks were used to calculate the Kruskal–Wallis statistic. From the post–hoc Conover p-values, it was found that there was no significant difference between three shoes (Figure 22): Nike Free, Puma Velocity, and Puma DeviateElite. Averaging the ϝ% data of these three groups as well as the corresponding minimalist indices MI [27], and adding the ϝ% data and MI of the remaining four significantly different groups, reveals that ϝ% appears to be an exponential function of MI (Figure 23).
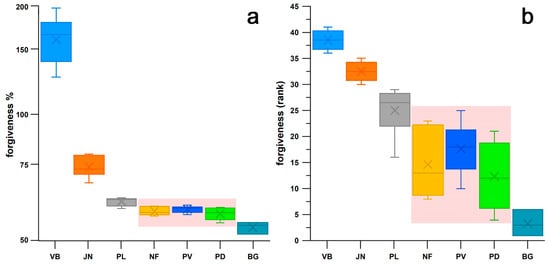
Figure 22.
Box-and-whisker plots of the forgiveness factor ((a) as a percentage of Fopt, and (b) as rank numbers); the area shaded in pink indicates that forgiveness factor of these three shoes is not significantly different; VB: Vivobarefoot PrimusLite, JN: Joe Nimble Addict, NF: Nike Free5.0, PL: Puma Liberate, PV: Puma Velocity2, PD: Puma DeviateElite 2, BG: Brooks Ghost15.
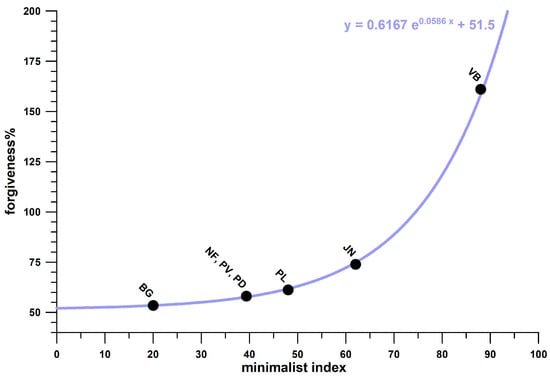
Figure 23.
Normalised and averaged forgiveness factors (as a percentage of Fopt) vs. minimalist index (index reported by [27]); VB: Vivobarefoot PrimusLite, JN: Joe Nimble Addict, NF: Nike Free5.0, PL: Puma Liberate, PV: Puma Velocity2, PD: Puma DeviateElite 2, BG: Brooks Ghost15; NF, PV, and PD are considered as a single group since their forgiveness medians are not significantly different (cf. Figure 22).
3.8. First Peak of the Vertical Ground Reaction Force and Its Relationship to the Forgiveness Range
Figure 24 shows the distribution of the first peak force, PF1, across six shoes and two velocity groups of heel strikers. The medians of PF1 when participants ran at 10 kph were generally smaller than those when running at individual speed (9.3–13.3 kph). For both speed groups, the significantly different pairs were (Friedman test, and post–hoc Dunn–Bonferroni test): 10 kph: the medians of Vivobarefoot and Nike Free were significantly smaller than those of Puma Deviate (both at p = 0.017); individual speed: the median of Vivobarefoot was significantly smaller than that of Joe Nimble (p = 0.047); and the median of Nike Free was significantly smaller than those of Joe Nimble (p < 0.001) and Puma Deviate (p = 0.001). All other pairs showed no significant difference.
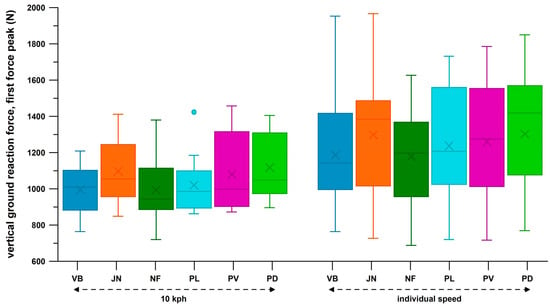
Figure 24.
Box-and-whisker plot of the first force peak of the vertical ground reaction force across six shoes and two running velocities; VB: Vivobarefoot PrimusLite, JN: Joe Nimble Addict, NF: Nike Free5.0, PL: Puma Liberate, PV: Puma Velocity2, PD: Puma DeviateElite 2.
When plotting PF1 with respect to the actual forgiveness range, almost all cases of 10 participants with PF1 across all experiments were within the forgiveness range (Table 4) when running at 10 kph. The exceptions were Joe Nimble Addict, with four cases of PF1 larger than Fmax, and Puma Liberate, with two cases. This result generally indicates that the participants were running at the shoulder point, or at least within the forgiveness range. While this study suggests that the shoulder point represents the optimum point of energy absorption, a parameter related to shoe design, this result provides the evidence that running at the shoulder point actually occurs regardless of the E/Fmax ratio.

Table 4.
Number of participants who had the magnitude of their PF1 inside, or after the shoulder point; VB: Vivobarefoot PrimusLite, JN: Joe Nimble Addict, NF: Nike Free5.0, PL: Puma Liberate, PV: Puma Velocity2, PD: Puma DeviateElite 2.
When running at the individual speed, the PF1 distribution changed dramatically (Table 4). PF1 larger than Fmax was found in 17 participants across all experiments. Apart from three cases with PF1 smaller than Fmin, only two shoes had a minimum number of cases of PF1 larger than Fmax, namely Vivobarefoot, with one case (Figure 25), and Puma Velocity, with two cases. For the remaining four shoes, approximately 45% of cases were inside the forgiveness range, and 55% were outside, larger than Fmax (Figure 25). This result shows that four shoes (Table 4) are partially under-designed, specifically when running at individual speed and also when running at a higher BW (Table 5). In contrast to Figure 10, which does not identify under-designed commercially available sports shoes across a wide range of PF1 values, focussing on PF1 data of individuals (participants of this study) reveals potentially under-designed shoes under certain conditions.
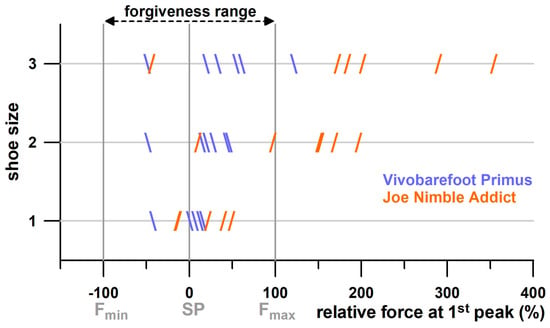
Figure 25.
Size of two shoes, run at individual speed, against the position of the force at the first peak (PF1) relative to the shoulder point and the forgiveness range; Fmin (beginning of forgiveness range) is set to −100%; and Fmax (end of forgiveness range) is set to +100%; SP = shoulder point; shoe sizes of 1, 2, and 3 correspond to small, medium, and large sizes.

Table 5.
Comparison of participant-specific attributes for 2 groups: PF1 before or inside the forgiveness range (n = 64), and PF1 past the forgiveness range (n = 38); data for individual speed only, as 10 kph running speed showed a negligible number of outliers; PF1 = first force peak of the vertical ground rection force; Fmax = upper boundary of the forgiveness range; p = p-value; U = U-statistic of the Mann–Whitney test; r = effect size.
For all six shoes, the 39 cases where the shoes were larger than Fmax were distributed among shoe sizes small, medium, and large, with 1, 17, and 21 cases, respectively. This result suggests that shoe size S and/or body weight BW influence how many cases were outside the forgiveness range. Multiple regressions of two predictors, S and BW, and dependent variable of PF1, revealed that, at a speed of 10 kph and at individual speed, the shared components (combined influence of S and BM on PF1) were 22.33% and 19.24%, respectively; the unique influences of BW on PF1 were 20.19% and 16.32%, respectively; and the unique influences of S on PF1 were 0.11% and 0.89%, respectively. The negligible unique influence of S on PF1 indicates that BW generally contributes the dominant influence.
To address the issue of why larger sizes produce outliers with PF1 larger than Fmax (Table 4 and Figure 25), the following question arises: which parameter is significantly different between PF1 outliers and PF1 data smaller than Fmax, and, apart from the magnitude of PF1, which parameter was the larger PF1 associated with? When dividing the PF1 data into two groups, based on PF1 larger or smaller than Fmax, and comparing the associated medians of BW, body height BH, shoe size S and running speed v with the Mann–Whitney U test, all medians were significantly different. PF1 > Fmax was associated with significantly larger medians of BW, BH, body mass index, S, and v (Table 5). Equally, the gender distribution was significantly different between the two groups, with 44% and 0% of female participants in the groups with PF1 < Fmax and PF1 > Fmax, respectively (Table 5).
That the medians of the two PF1 groups were significantly different is evident, since PF1 (smaller or greater Fmax) was the decision criterion to separate the two groups. Of the remaining two large effect sizes (Table 5), BW has a larger effect on PF1.
According to Table 6, the average BW, BH, PF1, and individual velocity increase significantly from small to medium and medium to large sizes (p < 0.002, Kruskal–Wallis test). The increase in PF1 relative to size and across the two speeds (10 kph and individual speed) is larger than that of BW and BH. This result reflects that shown in Figure 25, namely, that the change in individual speed relative to the three shoe sizes is responsible for the increased number of outliers, as shown in Table 4, and not BW or BH.

Table 6.
Averages of participant’s attributes for three shoe sizes and three running speeds.
These results can be interpreted in two opposite but complementary ways:
- (1)
- The larger shoe sizes were not designed for heavy runners;
- (2)
- The participants were too heavy for larger shoe sizes.
Both interpretations are not applicable, as the increased running velocity relative to the three shoe sizes accounts for the increased number of outliers, as shown in Table 4. The alternative interpretation would be as follows:
- (1)
- The larger shoe size design cannot keep up with the faster running speed in addition to the increased BW;
- (2)
- The participants were too fast for current larger shoe size design.
3.9. Design Considerations and Strategies for Adapting Shoes to the Shoulder Point Parameters
At this point, the question arises: which design feature should be responsible for a larger PF1 in general and the larger PF1 due to the faster running speed?
The basic design features of energy absorbers are [14]:
- (1)
- The design space: for sports shoes, this is the standardised length (shoe size in relation to the foot size [28], the width, and the thickness of the shoe sole; the thickness is limited to a maximum of 40 mm in road events (running and race-walking competitions [29].
- (2)
- The peak deceleration (−apeak).
- (3)
- The absorber properties, specifically, εopt, σopt, Wopt, and W/σmax (cf. Section 2.2.) and their non-normalised counterparts of xopt, Fopt, Eopt, and E/Fmax.
Using the non-normalised properties of the Puma DeviateElite shoe (xopt = 0.0234 m, Fopt = 1.06 kN, Eopt = 8.10 J, E/Fmax = 7.64 J/kN) and the corresponding design space parameters (stack height d = 0.038 m, approximate heel area A = 0.005 m2, and resulting heel volume V = 0.00019 m3), the normalised absorber properties are εopt = xopt/d = 0.6166 (-), σopt = Fopt/A = 212000 Pa, Wopt = Eopt/V = 42631.6 J/m3, and W/σmax = 0.2011 (-). Assuming an effective mass m of 50 kg that must be decelerated, this results in −apeak = −Fopt/m = 21.2 m/s2. If the normalised absorber properties are assumed to be the standard of the heel material, new non-normalised properties of the heel structure can be calculated if the design space parameters are changed.
The usual method for designing energy-absorbing structures is to calculate the required design thickness of an energy-absorbing material and compare the calculated design thickness with the available design space. Accordingly, we increase the design thickness d by 15% (scaling factor), i.e., to d = 0.0437 m. The heel area remains unchanged (0.005 m2). The absorber volume increases to 0.0002185 m3. As a result, the non-normalised properties change as follows: xopt = 0.0269 m, Fopt = 1.06 kN, Eopt = 9.32 J, and E/Fmax = 8.79 J/kN (Table 7). Comparing these data to the original non-normalised properties, we find that all parameters have increased (improved) except one, namely, Fopt. However, it is the force (PF1) that increases with increasing shoe size (due to the BW and speed; Table 6). This design result explains that thickening the heel sole has no effect. Evidently, as the force (PF1) increases, we also want to improve the energy absorption, which is what actually happened (from 8.10 J to 9.32 J), but the force was not affected. If the force does not keep up with BW and speed, then the shoe becomes under-designed and bottoms out.

Table 7.
Shoulder point data of Puma Deviate Elite; standard: original data; stack + 15%: change of the shoulder point data when increasing the stack height by 15%; area + 15%2 each: change in the shoulder point data when increasing the heel length and width by 15%; xopt, Fopt, Eopt = deflection, force, and energy at the shoulder point; E/Fmax = maximum ratio of energy to force.
Since the increase in stack height had no effect on the force, the next design step is to change the design area A by 15% in both dimensions, i.e., to A = 0.0066 m. The stack height d remains unchanged (0.005 m2). The absorber volume increases to 0.0002508 m3. The unnormalised properties then change to xopt = 0.0234 m, Fopt = 1.40 kN, Eopt = 10.692 J, and E/Fmax = 7.64 J/kN (Table 7). Comparing these data with the original non-normalised properties, an improvement in Fopt and Eopt by 32% (or by a factor of 1.32 = 1.152) is obtained. As the force increases, the effective mass m that must be decelerated also increases: m = Fopt/apeak = 66 kg (increase of 32%). By increasing the design area, Fopt has been successfully improved to accommodate the increased PF1 and BW values in larger shoe sizes—in principle. The limitations of this approach are three-fold:
(a) If we increase the size of an object by a scaling factor, the volume of the object is equal to the scaling factor to the power of three. Since the weight is proportional to volume, we expect an improvement of 1.52 (= 1.153) rather than 1.32 (= 1.152). If we correlate the participants’ BW and BH data, we obtain a power-law regression function of BW = 116.49 BH3.1403 (R2 = 0.5208), where the exponent of 3.1 corresponds to the expected exponent (3) of the scaling factor. Thickening the stack height in addition to the already increased area does not solve the problem since the stack height does not change the force. Using an area of 1.15 times the shoe length and 1.32 times the shoe width would solve the problem, with the disadvantage that the width would then increase disproportionately with the scaling factor to the power of two.
(b) We have not yet taken into account the increase in running speed. Since the running distance and speed are unidirectional, and, therefore, we assume an increase in speed and deceleration of the effective mass by the same scaling factor (15%), then the new −apeak = 24.38 m/s2. The new effective mass m to be decelerated is m = Fopt/apeak = 1.4 kN/24.38 m/s2 = 57.39 kg. This is an increase of only 15%. If we consider that the running speed increases by a factor of 1.077 relative to the increase in BW, based on the participants’ data, we need a scaling factor of 1.42 (1.32·1.077) for velocity and acceleration. The new effective mass m to be decelerated is m = Fopt/apeak = 1.4 kN/(21.2·1.077) = 61.28 kg. This is an increase of only 22.6%. Another approach is to derive the scaling factor of the speed from the principle of geometrical similarity. If two geometrically similar objects with different scaling factors L move with the same Froude number Fr, then their velocities v are calculated from v2 = Fr g L, where g is the gravitational acceleration [30,31,32]. Thus, v ∝ √L. Therefore, the new effective mass m that must be decelerated is m = Fopt/apeak = 1.4 kN/(21.2·1.150.5) = 61.54 kg. This is the same increase of only 22.6%. At least this result provides a good agreement of theory (principle of geometric similarity) and experimental data.
(c) If we consider that the scaling factor of the originally assumed effective mass m of 50 kg is 1.153, i.e., 1.52, then the new mass that must be decelerated by a force of 1.4 kN is 76 kg. Thus, the required deceleration −apeak = −Fopt/m = 1.4 kN/76 kg = 18.41 m/s2. This means that the original deceleration of 21.2 m/s2 is reduced by 13.2%, which is counterintuitive, since higher velocities require larger decelerations that must be reduced to zero under the same constraints (same stack height). There is another aspect of designing an energy absorber which helps verify this counterintuitive result. The velocity addressed before is a direct result of the absorbed energy and the effective mass: v2 = 2 Eopt/m. Using the original data, √(2·8.1/50) = 0.569 m/s, the initial speed at which the energy absorber (heel sole) is compressed. Using the new data, √(2·10.692/76) = 0.530 m/s, results in a reduction by 6.85%. Since we obtain the same counterintuitive result, the only option left is to increase the area disproportionately to achieve an adequate Fopt, such that PF1 is not larger than Fopt. This was already suggested under a) above. This solution illustrates the dilemma of contemporary shoe design, namely that the width of the shoe sole does not increase more than the length or the shoe size, which is a function of the foot length lF: size EUR = 3 lF/20 + 2 [28].
From the outliers in Table 4 (PF1 > Fmax at individual speed), we can calculate the required increase in heel area (expressed as increase in heel width, not heel length, since heel length is a function of shoe length) to have the PF1 data at the upper boundary of the forgiveness range (Fmax) or even at the shoulder point (Fopt). Since
the area increase is given as
where As is the standard heel area of a shoe, and An is the new, enlarged area, and the ratio of An to As minus 1 and times 100 corresponds to the percentage increase in heel width. When matching PF1 to Fmax, Fopt is replaced by Fmax in Equations (2) and (3).
As shown in Figure 26, when Fmax is set to PF1 for each participant and each shoe condition (when PF1 > Fmax at the original heel size), the heel width needs to be increased by 16.83% (±12.30%) and 19.65% (±17.25%) for shoe sizes of 42 and 45, respectively. If Fopt is matched to PF1, the heel width needs to be increased by even 60.47% (±19.67%) and 65.79% (±27.53%), for shoe sizes of 42 and 45, respectively.
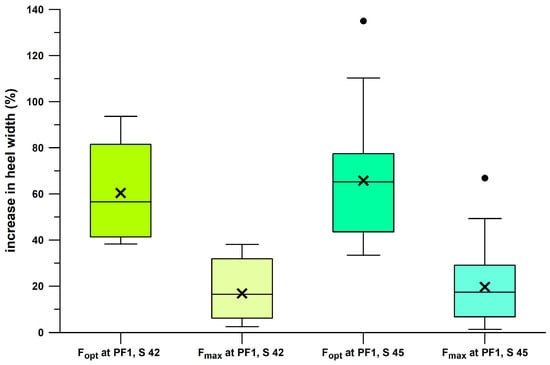
Figure 26.
Boxplots of the percent increase in the heel width after matching Fopt (optimal force at the shoulder point) to PF1 (first peak of the vertical ground reaction force), and Fmax (upper limit of forgiveness range) to PF1; S = shoe size (EU); ✖ = average; ● = outlier.
If the scaling factor is the same in all three dimensions, then a 10% increase in foot length means a 10% increase in forefoot width. However, the scaling factors are disproportionate, and, for example, the scaling factor of the forefoot width of the human foot is 0.67 on average (calculated from the data of Domjanic et al. [33]) relative to a foot length scaling factor of 1. Table 8 shows the relative scaling factors of the measured shoe parameters (six shoes of Cohort 3) relative to the shoe length (scaling factor of 1).

Table 8.
R2 of linear regression (increase in shoe parameters relative to shoe length versus increase in shoe length) explains by how much (percentage if R2·100) the increase in a dependent shoe parameter (relative to the shoe length) is explained by the increase in the independent shoe length (linear regression); p of R2 indicates whether the apparent trend of the regression slope is real, i.e., positive slope significantly different from a zero slope or a negative slope, if p ≤ 0.1 (one-tailed, alpha = 0.1); the scaling factor is the regression slope trough origin, relative to a shoe length scaling factor of 1.
The stack height had the smallest relative scaling factor of only 0.21. This seems to be a surprising result but is quite logical, considering that the stack height does not affect Fopt (Table 7). To adapt the heel design for heavier and taller users, the heel width must be changed as already explained above. The relative scaling factors of the forefoot and heel widths were 0.69 and 0.64, respectively (Table 8, and Figure 27). The forefoot shoe width scaling factor of 0.69 is close to that of the human forefoot width of 0.67. After increasing the measured heel widths by 20% (predicted maximum average value in Figure 27 for placement of PF1 at Fmax), the relative scaling factor of the heel width increases disproportionately to 2.44 (Table 8, and Figure 27). If the measured heel widths are increased according to Equation (3) such that PF1 = Fmax for each individual whose PF1 was greater than Fmax, the relative scaling factor of the heel width increases disproportionately to 2.47 (Table 8, and Figure 26), i.e., very close to 2.44. This result confirms that increasing the heel width by 20% is a viable design strategy to reduce the number of outlier cases (Table 4 and Figure 26), i.e., large PF1 data outside the forgiveness ratio. Figure 27 also shows a standard shoe sole (blue) with a 20% increase in heel width (10% on either side).
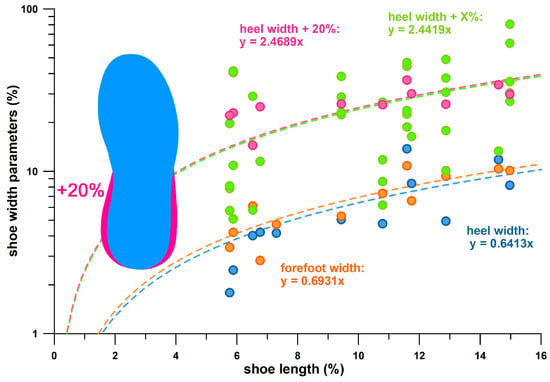
Figure 27.
Increase in shoe width parameters (%) relative to shoe length versus increase in shoe length (%); x = shoe length (%); y = shoe width parameter (%); “y = 0.6413x” = the heel width increases by 6.4% if the shoe length increases by 10%; “+X%” = increase in heel width when matching Fmax to PF1; dashed lines: linear fit functions corresponding to the four linear equations; inset: shoe print (blue) with heel enlarged by 20% (red).
4. Discussion
This study offers a new concept and method for evaluating the cushioning potential of athletic shoes. This method is independent of preset energy (ASTM [8,9]) or force values [21], and instead measures and examines the shoe-specific data at the optimum (“shoulder”) point of impact absorption, i.e., the maximum ratio of absorbed energy to applied force (E/Fmax). Thereby, ratios of high energy to low force are preferred. In addition, these ratios are related to the actual loading forces encountered at the heel during running. Excellent E/Fmax values are useless if the corresponding force (Fopt, at E/Fmax) is too low or too high. If the Fopt value is too low, the heel segment is under-designed; if it is too high, the heel is over-designed. This relationship connects the E/Fmax value to the underlying design of the heel segment, which is likely an inadvertent or unwitting design, if the shoulder point principle is not known. In any case, the heel feels harder when running before or after the shoulder point (or at least outside of the forgiveness range), than when running at the shoulder point. The logical question to ask in this context is: do runners prefer to run at the shoulder point? This is the same question that came up in the introductory section of this article: do runners run with exactly 5 J of impact energy as required by ASTM test standards [8,9]? The counterargument to this is that poorly designed shoes, i.e., those not designed for running at the shoulder point, would prevent runners from running at that exact point. The present study provides at least partial evidence that runners run at the shoulder point (Table 4): at a running speed of 10 kph, the peak force at the heel (PF1) of all runners was within the forgiveness range in all shoes except the Joe Nimble shoe, whereas at individual running speed, only participants wearing Vivobarefoot and Puma Velocity shoes had their PF1 within the forgiveness range. The reason why many participants wearing any of the other four shoes at individual speed ran past the shoulder point was because they were too fast, in combination with being too heavy and too tall (Table 5 and Table 6), and, consequently, the shoes were not designed for these conditions.
Based on these results, our recommendation is to replace the ASTM test standards [8,9] with the new method. The new method uses floating parameters instead of preset values (such as the 5 J impact energy [8,9]). As already mentioned in the introductory section, other standards use similar methods to assess the hardness of foams, namely, the ISO and ASTM-C standards, which measure the stress of foams precisely at 40% and 50% strain, respectively. These preset strain values are unrealistic, as the optimum strain of shock absorbers (including foams) found by Fuss [14] ranged between 48.5% and 81%.
The new method presented in this article does not require realistic input parameters, and the heels of sports shoes can be compressed up to a force that allows us to find the shoulder point as well as the upper limit of the forgiveness range (Fmax). For most shoes, a force of 3 kN is sufficient. In addition, this method is not affected by the strain rate, so a deflection rate of 10 mm/s for 5 cycles suffices to obtain reliable results. A dynamic method, e.g., “an 8.5-kg mass dropped from 50 mm” [8,9], is therefore no longer required.
The energy absorption in the heel segment of a sports shoe under the new method does not imply a reduction in shock spike, or, generally, a reduction in ground reaction force. As already mentioned in the introductory section, the first force peak, PF1, of the vertical ground reaction force is not a transient spike, but rather represents the weightbearing force of the heel (Figure 1). When comparing two size 39 shoes, namely Vivobarefoot and Puma Liberate, the medians of PF1 did not differ significantly when running at 10 kph or at individual speed (10 kph: 0.96 kN and 0.92 kN, respectively; individual speed: 1.03 kN and 1.03 kN, respectively). These PF1 data were within the forgiveness range. However, the average energy absorbed by the heel segment of these two shoes at the shoulder point was completely different, namely, 0.6 J and 8 J for Vivobarefoot and Puma Liberate, respectively. What happens to the 7.4 J difference in energy absorption between Vivobarefoot and Puma Liberate that is not absorbed by Vivobarefoot? If the 7.4 J are not absorbed by the heel segment, this energy difference must be absorbed by the lower limbs. This means that the energy is dissipated in the body’s own tissues, such as muscles (e.g., through concentric contraction), tendons, bones, and joints (articular cartilage, ligaments). This redistribution of energy from the shoe sole to the human leg can lead to increased fatigue and more frequent overuse/overstrain syndromes. Therefore, the shoulder point parameters are ideal for shoe testing and selection. If a runner’s variation in PF1 is known, e.g., from previous force plate tests with different shoes, then diagrams such as Figure 10 and Figure 12 facilitate the informed selection of shoes with large E/Fmax and large Eopt within the given PF1 window. In this context, the shoulder point parameters could initiate a healthy competition between the leading shoe companies to improve the cushioning properties of heel segments and promote the spirit of innovation.
Figure 28 addresses the problem with standards [8,9,10] and other methods [21], as mentioned in the Introduction section, and provides evidence regarding their applicability. Testing shoe heels at a fixed energy level of 5 J [8,9] is not applicable, as Puma Velocity and Deviate shoes absorb less than 5 J of energy only at a PF1 of less than 0.75 kN, and the energy absorbed by Vivobarefoot is less than 1.5 J up to 2 kN. Energy absorption therefore depends on the shoe type (the more minimalist and thinner the sole, the less energy is absorbed) and the PF1. A fixed force level of 5 kN [10] is not applicable, either, as the maximum PF1 determined in this study was less than 2 kN. Although a fixed force level of 1.5 kN [21] is well within the PF1 range determined in this study, Eopt lies in a window between 0.85 and 1.17 kN (Figure 28), and thus well before 1.5 kN.
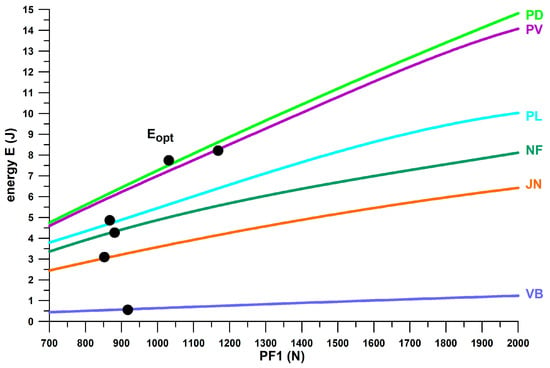
Figure 28.
Energy absorbed vs. PF1 (first peak of the vertical ground reaction force); VB: Vivobarefoot PrimusLite, JN: Joe Nimble Addict, NF: Nike Free5.0, PL: Puma Liberate, PV: Puma Velocity2, PD: Puma DeviateElite 2; the black dots identify the optimum energy Eopt at maximum E/F (at the shoulder point).
Figure 9 and Figure 10 show a main line (blue dots) and a secondary line (red dots), with the shoes on the secondary line having an E/Fmax ratio 1.6–1.4 higher than the shoes on the main line. Most of the shoes on the secondary line are PUMA shoes (Puma Deviate Elite 2, Puma Liberate, Puma Velocity 2, and PumaFastR), which have one thing in common: the midsole of these shoes is made from polymers saturated with supercritical CO2 under high pressure and temperature, which expands rapidly upon cooling or depressurization, resulting in a foam with a uniform cell structure, low weight, good cushioning, and high elasticity [34]. It is therefore likely that autoclave foaming results in better E/Fmax ratios.
The forgiveness parameter ϝ describes the range between two force limits, Fmin and Fmax, where E/F is greater than 97.5% of E/Fmax. This measure provides an optimum range rather than an optimum point. The larger the ϝ, the greater the force range in which the shoe shows its individual optimal and constant cushioning properties—or, conversely, the more compliant a heel sole segment is when exposed to widely varying PF1. However, despite its advantages, the forgiveness ϝ is not intended as a selection criterion of running shoes. For example, a rearfoot striker has a PF1 of 1.5 kN, due to his/her body mass, running speed, and running style. This value is within the optimum range for the Vivobarefoot heel (0.65–2.45 kN) but outside the optimum range for the Puma Liberate heel (0.70–1.25 kN). This does not mean that the athlete should choose the Vivobarefoot shoe over the Puma Liberate because it has a larger forgiveness range. Rather, the Puma Liberate should be preferred over the Vivobarefoot because it has a higher absolute energy absorption at PF1 (8.5 vs. 0.9 J). This comparison shows that forgiveness should be considered a supporting parameter for E/Fmax and Fopt. While E/Fmax describes the performance of the shoe as an energy absorber, Fopt defines the design classification (Figure 10), and the forgiveness ϝ indicates the optimal force range within a given design classification. Nevertheless, there is evidence that the more minimalist a shoe is, the wider the forgiveness range is (Figure 23). Considering that heels of minimalist shoes are the worst energy absorbers due to their low stack height, and considering that shoes with less energy absorption result in lower PF1 anyway, as shown in Figure 24, a wider forgiveness range may better compensate for a randomly higher PF1.
The strategies for adjusting Fopt by adapting the shoe sole geometry in Section 3.9 are based on the principle that energy absorption increases linearly with the increase in heel volume. Thus, doubling the heel area increases energy absorption by a factor of two. This principle implies that the heel area of the human foot must increase by the same factor. However, if the human heel area remains constant but body mass increases, we can expect a non-linear, asymptotic rise in Fopt and Eopt as the sole area increases, based on the testing of foam sheets with different area sizes (Figure 20). This result is due to the fact that shoe soles are point-elastic and not area-elastic. We can therefore assume that adjusting the width of shoe heel will result in a limited adaptation of Fopt.
The inclusion of shoes with 3D-printed midsoles was essential for the understanding of heel segment mechanics as well as for their practical application. Versions 1.1, with strut diameters of 16 mm, were the only under-designed shoes in this study (Figure 10). All 3D-printed midsoles (together with the Puma RuleBreaker shoe) exhibited the best E/Fmax values of all shoes compressed at the same xopt level (Figure 13). The additive manufacturing method enables the customised and personalised production of running shoes by simply adjusting the strut diameter of the unit cells. This principle was already illustrated in Figure 10 by shifting the under-designed shoes into the well-designed zone. Furthermore, the shoes identified in Table 4 and Figure 25, which were over-designed (beyond the shoulder point) at higher running speeds, can be easily adapted by increasing the strut diameter instead of increasing the heel area suggested for conventional running shoes (Figure 27). Increasing the stiffness of foam soles would be another option, but it is not suitable for the mass market. Increasing the strut diameter in 3D-printed midsoles stiffens the structure. Furthermore, the high-speed sintering (HSS) process with VX 200 (Voxeljet, Friedberg, Germany) allows for continuous variation of the stiffness within a 3D-printed object by controlling the selective energy input for particle fusion with infrared-absorbing ink in different shades of grey [35]. This specific process enables the integration of zones of different stiffness into the midsole of a running shoe, in addition to selectively changing the strut diameters. By selecting the optimal unit cell geometry and properties from hypothetical shape and material databases, a 3D-printed midsole could literally be customised (designed and manufactured) on-site to a runner, with the desired shoulder point parameters. There is limited literature on 3D-printed shoe midsoles which focuses on simulating plantar pressure distribution [36,37]. However, these studies did not address the cushioning properties and energy absorption of 3D-printed shoe midsoles.
A limitation of this new method is the repeatability of the shoulder point data. According to the repeatability tests, the uncertainty of xopt, Fopt, Eopt, and E/Fmax was 3.24%, 6.01%, 6.32%, and 1.89%, respectively. The worst repeatability was seen in Fopt and Eopt; however, although E/Fmax is the ratio of Eopt to Fopt, E/Fmax had the least uncertainty. E/Fmax is the most important shoulder point parameter. Testing a shoe multiple times (at least five times), with a 24 h rest between repetitions, and calculating the average values of the shoulder point parameters mitigates the problem.
5. Conclusions
This research study shows that existing standards [8,9], which simulate 5 J of energy absorption at the heel sole, are unsuitable because energy absorption depends on the construction of the heel sole and therefore cannot be a constant. The shoulder point method introduced in this study for running shoes identifies the optimal running point with maximum energy absorption at minimal force. Participants actually ran at the shoulder point (or at least within the forgiveness range) unless they were too heavy and ran at their preferred speed. The shoulder point parameters E/Fmax, Eopt, Fopt, and xopt allow the classification of heel soles in terms of running before the shoulder point (over-designed), at the shoulder point (well-designed), and after the shoulder point (under-designed), thus assisting consumers in making informed choices. The shoulder point method also proved to be insensitive to strain rates, which improves shoe testing, as a standard compression testing machine is sufficient.
This research study proposes a revision of the current standards, and the adoption of the method described and explained above.
Author Contributions
Conceptualisation, F.K.F.; methodology, F.K.F.; development (3D-printed shoes), N.N.; validation, F.K.F., T.S. and N.N.; formal analysis, F.K.F., T.S. and N.N.; investigation, F.K.F., T.S. and N.N.; resources, F.K.F., T.S. and N.N.; data curation, F.K.F., T.S. and N.N.; writing—original draft preparation, F.K.F.; writing—review and editing, F.K.F., T.S. and N.N.; visualisation, F.K.F.; supervision, F.K.F.; project administration, F.K.F., T.S. and N.N.; funding acquisition, F.K.F., T.S. and N.N. All authors have read and agreed to the published version of the manuscript.
Funding
Parts of this research were funded by Puma SE (experimental study with participants; Section 2.12), and the provision of shoes identified in Section 2.3 (cohort 3).
Institutional Review Board Statement
The sub-study involving participants (Section 2.12) was conducted in accordance with the Declaration of Helsinki and approved by the Ethics Committee of the University of Bayreuth (approval number 23–041, date of approval 16 January 2024).
Informed Consent Statement
Informed consent was obtained from all subjects involved in this study.
Data Availability Statement
The data presented in this study are available on request from the first author to any qualified researcher who has obtained Ethics Approval for secondary use of existing data through a Consent Waiver.
Acknowledgments
The authors would like to thank the Mizuno Oceania Corporation, PUMA SE, CEP medi, the German Federal Ministry for Economic Affairs and Climate Action, and the master’s students of the Sports Technology programs in Australia and Germany who directly or indirectly provided shoes for testing purposes.
Conflicts of Interest
The authors declare no conflicts of interest. The funders had no role in the design of the study; in the collection, analyses, or interpretation of data; in the writing of the manuscript; or in the decision to publish the results.
References
- World Health Organization. Physical Activity; WHO: Geneva, Switzerland, 2024; Available online: https://www.who.int/news-room/fact-sheets/detail/physical-activity (accessed on 16 March 2025).
- Strain, T.; Flaxman, S.; Guthold, R.; Semenova, E.; Cowan, M.; Riley, L.M.; Bull, F.C.; Stevens, G.A.; Country Data Author Group. National, regional, and global trends in insufficient physical activity among adults from 2000 to 2022: A pooled analysis of 507 population-based surveys with 5·7 million participants. Lancet Glob. Health 2024, 12, e1232–e1243. [Google Scholar] [CrossRef] [PubMed]
- World Health Organization. WHO Guidelines on Physical Activity and Sedentary Behaviour; WHO: Geneva, Switzerland, 2020; Available online: https://www.who.int/publications/i/item/9789241550536 (accessed on 16 March 2025).
- Davies, K. Footwear Segment Revenue of Nike, Adidas & Puma 2010–2022; Statista, Inc.: New York, NY, USA, 2025; Available online: https://www.statista.com/statistics/278834/revenue-nike-adidas-puma-footwear-segment/ (accessed on 16 March 2025).
- Stenerson, L.R.; Melton, B.F.; Bland, H.W.; Ryan, G.A. Running-Related Overuse Injuries and Their Relationship with Run and Resistance Training Characteristics in Adult Recreational Runners: A Cross-Sectional Study. J. Funct. Morphol. Kinesiol. 2023, 8, 128. [Google Scholar] [CrossRef] [PubMed]
- Jungmalm, J. Running-Related Injuries Among Recreational Runners. How Many, Who, and Why? Ph.D. Thesis, University of Gothenburg, Gothenburg, Sweden, 2021. Available online: https://gupea.ub.gu.se/handle/2077/67446 (accessed on 16 March 2025).
- Shorten, M.; Pisciotta, E. Running Biomechanics: What did we miss? In Proceedings of the 35th Conference of the International Society of Biomechanics in Sports (ISBS), Cologne, Germany, 14–18 June 2017; pp. 34–37. [Google Scholar]
- ASTM F1614-99; Standard Test Method for Shock Attenuating Properties of Materials Systems for Athletic Footwear. ASTM International: West Conshohocken, PA, USA, 1999.
- ASTM F1976-24; Standard Test Method for Impact Attenuation of Athletic Shoe Cushioning Systems and Materials. ASTM International: West Conshohocken, PA, USA, 2024.
- DIN EN 12743:1999-11; Footwear—Test Methods for Outsoles—Compression Energy; German Version EN 12743:1999. DIN Media GmbH (German Industry Standard): Berlin, Germany, 1999.
- ISO 3386-1; Polymeric Materials, Cellular Flexible—Determination of Stress-Strain Characteristics in Compression. International Organization for Standardization: Geneva, Switzerland, 1986.
- ASTM D3574 C; Stress-Strain Characteristic in Compression; Standard Test Methods for Flexible Cellular Materials—Slab, Bonded and Molded Urethane Foams—Test C: Compression Force Deflection Test. ASTM International: West Conshohocken, PA, USA, 2017.
- ADMET. ASTM D3574 C Foam Force Deflection Testing. 2024. Available online: https://www.admet.com/testing-applications/testing-standards/astm-d3574-c-foam-force-deflection-testing/ (accessed on 26 January 2025).
- Fuss, F.K. The Design Strain and Dead Mass of Energy Absorbing Materials and Structures: Mathematical Principles and Experimental Determination. Procedia Eng. 2015, 112, 116–121. [Google Scholar] [CrossRef]
- Delattre, N.; Cariou, A.; Guéguen, N.; Baudry, P. Test methods and observed parameters for the mechanical characterization of footwear cushioning. Footwear Sci. 2015, 7 (Suppl. S1), S43–S45. [Google Scholar] [CrossRef]
- Delattre, N.; Cariou, A. Women perception of shoe cushioning as a function of mechanical properties of footwear using a sensory trained panel method. Footwear Sci. 2017, 10, 11–19. [Google Scholar] [CrossRef]
- Determan, J.; Nevitt, M.; Frederick, E.C. Measuring the shock attenuation properties of skateboarding shoes. Footwear Sci. 2009, 1 (Suppl. S1), 126–128. [Google Scholar] [CrossRef]
- Lloria-Varella, J.; Besson, T.; Varesco, G.; Espeit, L.; Kennouche, D.; Delattre, N.; Millet, G.Y.; Morio, C.; Rossi, J. Running pattern changes after a 38-km trail running race: Does shoe fatigue play a role? Footwear Sci. 2022, 14, 185–197. [Google Scholar] [CrossRef]
- Shorten, M.R. Energy return in footwear—Revisited. Footwear Sci. 2024, 16, 149–162. [Google Scholar] [CrossRef]
- Schwanitz, S.; Möser, S.; Odenwald, S. Comparison of test methods to quantify shock attenuating properties of athletic footwear. Procedia Eng. 2010, 2, 2805–2810. [Google Scholar] [CrossRef]
- Schwanitz, S.; Odenwald, S. Long-term Cushioning Properties of Running Shoes. In The Engineering of Sport; Estivalet, M., Brisson, P., Eds.; Springer: Berlin/Heidelberg, Germany, 2008. [Google Scholar]
- Pisciotta, E.; Shorten, M. Perception of running shoe cushioning: Wear test vs. controlled experiment. Footwear Sci. 2018, 10, 69–75. [Google Scholar] [CrossRef]
- Gibson, L.J.; Ashby, M.F. Cellular Solids: Structure and Properties; Cambridge University Press: Cambridge, UK, 1997. [Google Scholar]
- Fuss, F.K.; Belbasis, A.; van den Hazel, B.; Ketabi, A. Design strategy for selecting appropriate energy absorbing materials and structures: Data library and customised selection criteria. Procedia Technol. 2015, 20, 98–103. [Google Scholar] [CrossRef][Green Version]
- Shorten, M.; Mientjes, M.I.V. The ‘heel impact’ force peak during running is neither ‘heel’ nor ‘impact’ and does not quantify shoe cushioning effects. Footwear Sci. 2011, 3, 41–58. [Google Scholar] [CrossRef]
- Fuss, F.K. Nonlinear visco-elastic materials: Stress relaxation and strain rate dependency. In Nonlinear Approaches in Engineering Applications; Dai, L., Jazar, R.N., Eds.; Springer: New York, NY, USA, 2012; pp. 135–170. [Google Scholar] [CrossRef]
- Scharl, T.; Frisch, M.; Fuss, F.K. Gender differences in the dynamics and kinematics of running and their dependence on footwear. Bioengineering 2024, 11, 1261. [Google Scholar] [CrossRef]
- ISO 19407:2023; Footwear—Sizing—Conversion of Sizing Systems. International Organization for Standardization: Geneva, Switzerland, 2023.
- World Athletics. World Athletics Athletic Shoe Regulations, Approved by Council on 22 December 2021, effective from 01 January 2022. In Athletic Shoe Regulations; Book C—C2.1A, Appendix 3, Athletic Shoe Sole Thickness Table; World Athletics: Monaco, 2022. [Google Scholar]
- Alexander, R.M. Estimates of speeds of dinosaurs. Nature 1976, 261, 129–130. [Google Scholar] [CrossRef]
- Alexander, R.M. How Dinosaurs Ran. Sci. Am. 1991, 264, 130–137. [Google Scholar] [CrossRef]
- Alexander, R.M. Walking and Running. Math. Gaz. 1996, 80, 262–266. [Google Scholar] [CrossRef]
- Domjanic, J.; Seidler, H.; Mitteroecker, P. A combined morphometric analysis of foot form and its association with sex, stature, and body mass: Morphometric analysis of footprint form. Am. J. Phys. Anthropol. 2015, 157, 582–591. [Google Scholar] [CrossRef] [PubMed]
- Hartmann, M. (Puma, Herzogenaurach, Germany). Supercritical foaming, 2025. Personal communication, 2025.
- Kemnitzer, J.; Wimmer, M.; Tarasova, A.; Döpper, F. High Speed Sintering of Polyamide 12: From Powder to Part Properties. Polymers 2024, 16, 3605. [Google Scholar] [CrossRef]
- Zolfagharian, A.; Lakhi, M.; Ranjbar, S.; Bodaghi, M. Custom shoe sole design and modeling toward 3D printing. Int. J. Bioprinting 2021, 7, 169–178. [Google Scholar] [CrossRef]
- Baranowski, P.; Kapusta, A.; Płatek, P.; Sarzyński, M. Influence of 3D-printed cellular shoe soles on plantar pressure during running—Experimental and numerical studies. Biocybern. Biomed. Eng. 2024, 44, 858–873. [Google Scholar] [CrossRef]
Disclaimer/Publisher’s Note: The statements, opinions and data contained in all publications are solely those of the individual author(s) and contributor(s) and not of MDPI and/or the editor(s). MDPI and/or the editor(s) disclaim responsibility for any injury to people or property resulting from any ideas, methods, instructions or products referred to in the content. |
© 2025 by the authors. Licensee MDPI, Basel, Switzerland. This article is an open access article distributed under the terms and conditions of the Creative Commons Attribution (CC BY) license (https://creativecommons.org/licenses/by/4.0/).