Abstract
Gastric cancer (GC) is a prevalent malignancy, and the discovery of biomarkers plays a crucial role in the diagnosis and prognosis of GC. However, current strategies for identifying GC biomarkers often focus on a single ribonucleic acid (RNA) class, neglecting the potential for multiple RNA types to collectively serve as biomarkers with improved predictive capabilities. To bridge this gap, our study introduces the GC biomarker relation graph convolution neural network (GCBRGCN) model which integrates the competing endogenous RNA (ceRNA) network with GC clinical informations and whole transcriptomics data, leveraging the relational graph convolutional network (RGCN) to predict GC biomarkers. It demonstrates exceptional performance, surpassing traditional machine learning and graph neural network algorithms with an area under the curve (AUC) of 0.8172 in the task of predicting GC biomarkers. Our study identified three unreported potential novel GC biomarkers: CCNG1, CYP1B1, and CITED2. Moreover, FOXC1 and LINC00324 were characterized as biomarkers with significance in both prognosis and diagnosis. Our work offers a novel framework for GC biomarker identification, highlighting the critical role of multiple types RNA interaction in oncological research.
.
1. Introduction
Gastric cancer (GC), a highly prevalent neoplastic disorder, occupies the fifth position in global cancer incidence and the third in cancer-related mortality, with an estimated annual toll of approximately 800,000 fatalities [1]. The discovery and validation of GC biomarkers are of paramount importance for the precise diagnosis and prognostic stratification of patients. Recent advancements in the identification of biomarkers for GC are indeed significant; for instance, the 12-miR analyzer demonstrated a remarkable 87% sensitivity and an exceptional 93.9% specificity within a prospective cohort encompassing 4566 patients [2]. However, the identification of novel biomarkers remains a formidable challenge, attributable to the intrinsic complexity and heterogeneity characterizing GC [3].
With the advent of advanced molecular biology techniques and a more profound comprehension of the mechanisms underlying tumorigenesis, a plethora of methodologies has been developed to identify GC biomarkers. Yang et al. [4] employed Kaplan–Meier and Cox regression analyses to reveal that the over-expression of HAMP could serve as an independent prognostic biomarker for GC patients. Similarly, Azari et al. [5] discovered that elevated expression levels of Mir21, Mir133a, Mir146b, and Mir29c were correlated with higher mortality rates and could potentially serve as early detection biomarkers in early-stage GC patients using the support vector machine (SVM) algorithm. However, these methodologies, which focus on single-class biomarkers, are limited in their ability to capture the intricate interactions among different types of biomarkers. Recent studies have highlighted the potential of competitive endogenous RNA (ceRNA) networks to significantly enhance the predictive power of disease biomarkers [6,7,8]. Recent studies have highlighted the potential of ceRNA networks in significantly enhancing the prediction of disease biomarkers. This approach emphasizes the role of messenger RNAs (mRNAs) and long non-coding RNAs (lncRNAs) in competitively binding microRNAs (miRNAs), forming a complex regulatory network that modulates gene expression through ceRNA interactions. By integrating these complex interactions, it is possible to identify key regulatory RNAs involved in the pathogenesis of GC, offering innovative avenues for biomarker discovery and development.
Furthermore, the advent of artificial intelligence, particularly graph neural networks (GNNs), has heralded a powerful tool for the discovery of network-based biomarkers [9,10,11]. For instance, EMOGI [12] integrates protein–protein interaction (PPI) networks with multi-omics data to identify cancer driver genes. Similarly, MOGONET [13] leverages multi-omics data to identify cancer biomarkers through the application of GNNs. However, these methodologies predominantly utilize homogeneous graphs derived from PPI networks, which limits their applicability to heterogeneous graphs, such as those found in ceRNA networks. In the context of heterogeneous graphs, Gao’s graph autoencoder has demonstrated potential in predicting associations between lncRNA-protein coding gene pairs [14], while Peng et al. [15] constructed three heterogeneous networks to identify cancer driver genes using graph convolution networks. Nevertheless, these methods are constrained in their capacity to uncover multi-RNA type biomarkers, suggesting a need for more sophisticated approaches that can fully exploit the complexity and heterogeneity of biological networks to enhance the discovery of innovative biomarkers.
In this study, we introduce the GC biomarker relation graph convolutional network (GCBRGCN) model, which seamlessly integrates ceRNA networks with clinical informations and whole transcriptomics data specific to GC. Employing the relational graph convolutional network (RGCN), our model is designed to predict GC biomarkers with enhanced accuracy. Our approach innovatively consolidates various RNA types within the biomarker identification process, thereby transcending the limitations inherent in current methodologies when confronting the intricacies of biological networks. We propose a novel and efficacious strategy for the detection of potential biomarkers within the domain of GC research. This strategy not only highlights the potential of multi-RNA type analyses in oncological studies but also underscores the importance of integrating diverse data types to achieve a more comprehensive understanding of the molecular underpinnings of GC.
2. Materials and Methods
2.1. Overview of GCBRGCN
We introduce a pioneering algorithm named GCRGCN which was founded to synergistically merge ceRNA networks on RGCN with GC whole transcriptomics data and clinical informations. The research workflow, as delineated in Figure 1, encompasses three distinct steps. First, clinical data and GC whole transcriptome sequencing data were collected. To facilitate differential expression analysis, samples were stratified based on clinical characteristics, and the edgeR package was employed to identify log-fold change (logFC) values which were extracted as node features. Next, a ceRNA heterogeneous network was constructed using data from the LncACTdb 3.0 database, where nodes represent different RNA molecules, including mRNA, lncRNA, and miRNA, while edges reflect their regulatory interactions. Each node was assigned a 10-dimensional feature vector, incorporating clinical attributes. Subsequently, the RGCN algorithm was applied for node classification, leveraging a multi-layer message passing mechanism to extract higher-order topological features. Based on the classification results, novel biomarkers associated with GC were identified and subsequently used to construct a diagnostic model using logistic regression and a prognostic model using multivariable Cox regression.
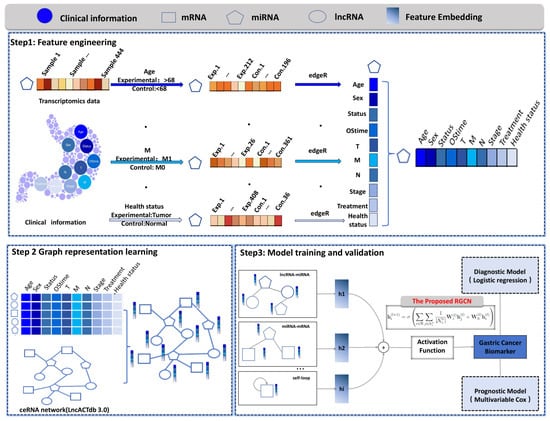
Figure 1.
The workflow of the proposed GCBRGCN model. Step 1: Feature Engineering. Clinical data and GC whole transcriptome sequencing data were collected. Samples were stratified based on clinical information, and differential expression analysis was performed using edgeR. The calculated log-fold change values of differentially expressed genes were utilized as node features. Step 2: Graph Representation Learning. Nodes with ten characteristics were embedded and integrated into a ceRNA heterogeneous network, where nodes represent different RNA molecules, including mRNA, lncRNA, and miRNA. Step 3: Model Training and Validation. The RGCN algorithm was employed for node classification, leveraging a multi-layer message passing mechanism to capture higher-order topological features. Based on the classification results, key biomarkers associated with gastric cancer were identified to construct diagnostic and prognostic models, and their potential molecular mechanisms were further investigated.
2.2. Data Collection and Preprocessing
2.2.1. Construction of the ceRNA Heterogeneous Graph
The ceRNA network used in this study was derived from the LncACTdb 3.0 database [16], which provides experimentally validated interactions among ceRNAs. LncACTdb 3.0 is a comprehensive and well-curated resource offering high-quality data on interactions between mRNAs, miRNAs, and lncRNAs, with a particular focus on their roles in cancer-related regulatory networks. By leveraging this database, we obtained a ceRNA network consisting of 497 nodes, including 163 mRANAs, 151 miRNAs, and 183 lncRNAs, connected to each other by 357 edges. We ensured that the ceRNA network employed in our analysis is biologically relevant and supported by robust experimental evidence, providing a solid foundation for our graph-based approach to biomarker discovery in GC.
2.2.2. Biomarker Annotation for Nodes
Nodes within the ceRNA network were annotated as potential GC biomarkers based on curated information from several well-established databases, including Cancer Gene Census (CGC) [17], BBCancer [18], IntOGen [19], LncRNA-Disease [20], and GeneCard [21]. The CGC (https://cancer.sanger.ac.uk/census/, accessed on 1 January 2020) provides a curated catalog of genes with somatic mutations implicated in GC, which helped identify potential biomarkers. The BBCancer (http://bbcancer.renlab.org/download, accessed on 1 January 2020) integrates cancer gene and biomarker information to annotate nodes based on their association with GC. IntOGen (https://www.intogen.org/, accessed on 1 January 2020), a comprehensive compendium of somatic mutations across cancers, provided insights into cancer-associated genes used for labeling relevant nodes. The LncRNA-Disease database (http://www.rnanut.net/lncrnadisease/, accessed on 1 January 2020) links lncRNAs to diseases, including GC, and was used to annotate lncRNA nodes. Finally, GeneCard (https://www.genecards.org/, accessed on 1 January 2020), a comprehensive human gene database, provides functional annotations for genes involved in cancer and helped label genes in the ceRNA network with potential relevance to GC. Nodes associated with GC were marked as 1, while those not associated with GC were marked as 0.
2.2.3. Transcriptomics Feature Generation
We extracted miRNA-seq, RNA-seq data and clinical information for GC from The Cancer Genome Atlas (TCGA), a comprehensive and widely used resource providing multi-dimensional genomic data for GC. TCGA offers high-quality data, including gene expression, clinical outcomes, mutation profiles, and methylation information, enabling a deeper understanding of cancer biology. These datasets were preprocessed to ensure consistency and quality, including normalization and the removal of low-quality samples. After matching and filtering, we retained only those samples containing both clinical information and both miRNA-seq and RNA-seq data, resulting in a final dataset of 408 GC patients and 36 normal controls. Following the approach outlined in EMOGI [12], we calculated node features based on relative gene expression changes rather than absolute values, with gene expression logFC determined by stratifying the samples according to ten key clinical factors: (1) Age: divided at 68 years, with younger patients as the experimental group and older as the control. (2) Sex: males as the experimental group and females as the control. (3) Survival status: deceased patients as the experimental group and survivors as the control. (4) Overall survival time (OStime): less than 426 days as the experimental group and more than 426 days as the control. (5) Cancer staging: advanced stages (III and IV) characterized by locoregional invasion and distant metastasis as the experimental group and early stages (I and II) as the control. (6) Tumor classification (T): T3 and T4 indicating tumors that have penetrated the serosa or invaded adjacent structures as the experimental group and T1 and T2 tumors as the control. (7) Regional lymph node involvement (N): N1-N3 as the experimental group and N0 as the control. (8) Metastasis (M) Status: M1 (distant metastasis) as the experimental group and M0 (no distant metastasis) as the control. (9) Treatment modalities: radiation therapy as the experimental group and pharmaceutical therapy as the control. (10) Health status: tumor as the experimental group and normal as the control. These classifications generated ten unique features for each node, allowing for an in-depth assessment of how different clinical factors affect gene expression profiles. A comprehensive description of these features is provided in Table 1.

Table 1.
Node characteristic information.
We constructed the adjacency matrix for model training based on the ceRNA network. For each node within the network, a 10-dimensional feature vector was derived by integrating clinical grouping information with GC transcriptomic data. Subsequently, node labels were assigned using known GC biomarkers from databases such as CGC and BBCancer, thereby constructing the expression matrix for model input.
2.2.4. Model Training
We aim to embed the nodes in the graph into the latent space and classify them into two classes, i.e., biomarker and non-biomarker. We adopt the GNNs to model the nodes in the graphs. Previous graph neural networks follow the simple differentiable message-passing framework. It is formulated as follows:
where denotes the latent code of the i-th node in the l-th layer of the neural network. Additionally, denotes the latent dimension number of the l-th layer of the neural network. m denotes the message information, and is the message information set of the i-th node. denotes the aggregation function for the incoming message information. is the activation function, such as ReLU, Sigmoid function, etc. In the classical graph convolutional network (GCN), the incoming messages come from the node neighbors. Neighborhood messages are embedded via a simple linear transformation, i.e., , where denotes the transformation matrix of the l-th layer. Note that all the messages adopt the same transformation. To be specific, the encoding process of the GCN is formulated as follows.
where denotes the activation function, denotes the transformation matrix at the l-layer, and denotes the degree matrix. Note that the GCN models all the relationships between nodes with the same transformation matrix , limiting the representation capability. Additionally, GAT introduces the attention mechanism to improve the modeling of the relationship. It is formulated as follows:
where is the attention coefficient. It is calculated as follows:
where a denotes a single-layer feed-forward neural network. However, GAT still cannot capture the different types of relationships.
In this paper, to better model the various relationships between nodes with different types, we adopt the RGCN as the encoder. The message-passing patter is formulated as follows:
where denotes the the i-th node embedding in the -th neural network layer. denotes the transformation matrix for the relation r in the l-th layer. Additionally, denotes the transformation matrix for the self-message in the l-th layer. In addition, denotes the neighborhood set of the i-th node with the relation r, and is the element number of the set. Moreover, is the relationship set, and is one relationship in all relationships. Different from the simple GCN model, RGCN introduces the relation-specific transformation. Namely, will embed the different relationships into the different latent spaces. Additionally, the self-connection is considered as a special relation for each entity in the graph, and aims to embed them into the latent space. In this manner, we embed the nodes in the graph into latent space and obtain the node embedding , where N denotes the number of the nodes and d denotes the dimension number of latent features. Then, we conduct an entity classification task on learned node embeddings. Specifically, cross-entropy loss is minimized as follows:
where denotes the node embeddings from the R-GCN. N and K denote the number of the nodes and the number of the classes, respectively. With the activation function softmax, the network outputs the probability of each nodes to the classes.
2.2.5. Parameter Configuration in Model Training
Striking a balance between convergence velocity and model performance was crucial, which we addressed through the meticulous hyperparameter optimization of parameters: dropout rate, self-loops, learning rate, embedding dimension, number of hidden layers, and epoch. We set the dropout rate to 0.6 (Table A1), enabled self-loops to be set to TRUE (Table A2), established a learning rate of 0.1 (Table A3), chose an embedding dimension of 100, structured the model with three hidden layers, and determined the epoch count to be 100. This parameter tuning aimed to enhance model performance, ensuring both swift convergence and strong generalization capabilities, especially when dealing with heterogeneous graph-structured data.
2.3. Performance Benchmarking of Different Methods
To establish a benchmark for comparison, we integrated six established algorithms into our study. First, the heterogeneous graph attention network (HAN) [22] is a sophisticated algorithm that extends traditional graph convolutional networks by incorporating attention mechanisms, allowing for the fine-grained capture of complex interactions among various node and edge types in heterogeneous graphs. Second, the GCN [23] adapts convolutional operations to graph-structured data, enabling learning and prediction from graph data. Third, the graph attention network (GAT) [24] employs an attention mechanism within GNNs to dynamically learn node relationships, thereby enhancing model performance and interpretability. Additionally, we also compare K-nearest neighbor (KNN), random forest (RF), and eXtreme Gradient Boosting (XGBoost) algorithms, which are widely used in the field of machine learning.
2.4. Model Evaluation
The dataset was split into training and testing sets with a 7:3 ratio. We utilized key metrics, including accuracy (ACC), recall, precision, and the F1-score. Additionally, we employed the receiver operating characteristic (ROC) curve to assess model effectiveness. The ROC curve is derived by plotting the true-positive rate (TPR) against the false-positive rate (FPR) across a range of thresholds, providing a visual representation of the model’s ability to distinguish between positive and negative classes. We also adopted the area under the ROC curve (AUC) as a quantitative measure of model performance, offering a comprehensive assessment of the model’s predictive power across all classification thresholds.
The results of evaluation indicators can be divided into true positive (TP), false positive (FP), true negative (TN) and false negative (FN).
To evaluate the stability and reliability of the models, a five-fold cross-validation approach was employed. In this process, the dataset was randomly partitioned into five subsets of equal size. For each fold, the model was trained on four subsets and validated on the remaining subset. This procedure was repeated five times, ensuring that each subset was used exactly once as the validation set while the remaining subsets were utilized for training. To facilitate a comprehensive comparison of the models, the mean and standard deviation of the performance metrics were calculated across the five folds for each model. The mean value represents the average performance of the model, while the standard deviation quantifies the variability in performance across the folds, providing insights into the model’s consistency. Models exhibiting lower standard deviations are considered to demonstrate more stable performance, whereas those with higher standard deviations indicate greater variability, which may compromise their generalizability. The mean and standard deviation for each model were computed as follows:
where N is the number of folds (i.e., ), and represents the performance metric (e.g., ACC, precision, recall, etc.) for the i-th fold.
2.5. Novel GC Biomarkers’ Assessment
Genes identified as biomarkers by the GCBRGCN model, but not previously annotated in the aforementioned cancer gene databases, were deemed novel GC biomarkers. To elucidate the biological functions and pathways associated with the novel biomarkers, we performed Kyoto Encyclopedia of Genes and Genomes (KEGG) and Gene Ontology (GO) enrichment analyses using the clusterProfiler package. The KEGG pathway enrichment analysis was conducted to identify potential signaling pathways related to gastric cancer. The novel biomarkers were annotated against the KEGG database, and pathways with a corrected p < 0.05 were considered statistically significant. For GO enrichment analysis, the novel biomarkers were mapped to GO terms across three categories: biological process (BP), cellular component (CC), and molecular function (MF). Terms with a p < 0.05 were considered significantly enriched. The enrichment results were visualized using ggplot2 to comprehensively illustrate the functional annotations and pathway interactions of the novel biomarkers. To visualize the regulatory network of the novel biomarkers, we constructed and analyzed the interaction network using Cytoscape (version 3.10.2). In the network, nodes represent novel biomarkers and their regulatory molecules, while edges represent the interactions between them.
2.5.1. Diagnostic Validation
To ascertain whether novel GC biomarkers are viable for diagnosis, we initially employed the edgeR algorithm to identify differentially expressed genes between GC patients and healthy individuals. The criteria were set at and a false discovery rate (FDR) . Next, we determined the intersection between the differentially expressed genes and the novel GC biomarkers, yielding a set of intersecting genes. The pROC package was then utilized to calculate the ROC curves for these intersecting genes and derive the AUC. Novel GC Biomarkers with AUC values exceeding 0.6 were considered novel diagnostic biomarkers for GC. Biomarkers with and were selected to construct diagnostic models using Logistic regression. Logistic regression allows for the modeling of binary outcomes and is commonly applied in biomarker-based diagnostic prediction. In addition to utilizing internal validation datasets, we procured external validation datasets (GSE184336) from the Gene Expression Omnibus database to bolster the reliability of our findings.
2.5.2. Prognostic Validation
We implemented a stringent approach to confirm the prognostic predictive capacity of the newly identified GC biomarkers. Initially, we developed a multivariable Cox regression model, incorporating patients’ survival data, vital status, and expression levels of the novel GC biomarkers to determine their prognostic predictive value. Subsequently, using the standardized expression levels of these biomarkers along with their regression coefficients, we derived risk scores for individual patients, categorizing them into high- and low-risk groups for GC. Following this, we executed Kaplan–Meier survival analysis to assess survival probabilities over time. Additionally, we conducted univariate Cox regression analysis to reaffirm the prognostic significance of these biomarkers. The univariate Cox regression analysis allows for the evaluation of individual biomarkers’ contribution to survival risk before considering the effects of other variables. Finally, we formulated a nomogram that integrates the prognostic model with clinical information, streamlining its application in clinical settings. All analyses were conducted using R version 4.3.0.
3. Results
3.1. Performance Comparison of GCBRGCN and Existing Methods in Biomarker Discovery of GC
The model was trained on the training set and evaluated on the testing set, with the performance metrics reported in Table 2. When compared to other GNN models, like HAN, GCN, and GAT, GCBRGCN achieved the best results in terms of accuracy (0.7928), precision (0.7500), F1-score (0.8321), and AUC (0.8172), using the same network configurations and node attribute settings (Figure 2). Although the HAN model achieved the highest recall (0.9787), GCBRGCN’s recall (0.9344) was only slightly lower. In comparison with conventional machine learning techniques, such as KNN, RF, and XGBoost, GCBRGCN demonstrated superior performance, highlighting the advantages of GNN algorithms in GC biomarker identification through the integration of graph structures. Further, the five-fold cross-validation results show that GCBRGCN performs well in accuracy (0.798 ± 0.093), precision (0.7419 ± 0.1434), recall (0.8147 ± 0.2265), F1-score (0.8214 ± 0.149), and AUC (0.7358 ± 0.0932) metrics and exhibits stable performance among different folds. The performance is stable between folds with a small standard deviation, demonstrating its strong robustness (Table 3, Table A4, Table A5, Table A6, Table A7, Table A8, Table A9 and Table A10).
Table 2.
Performance comparison of GCBRGCN and existing methods in biomarker discovery of GC.
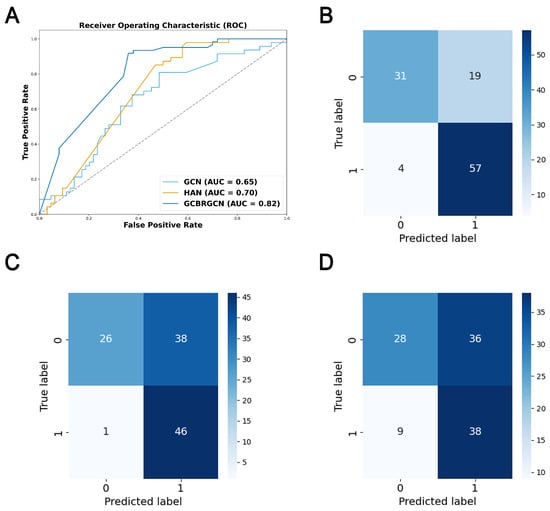
Figure 2.
ROC curve and confusion matrix for model performance evaluation. (A) ROC curves of GCBRGCN, HAN and GCN models. (B) Confusion matrix of the GCBRGCN model. (C) Confusion matrix of the HAN model. (D) Confusion matrix of the GCN model.
Table 3.
Model performance comparison by five-fold cross-validation.
3.2. Ablation Experiments
To assess the individual contributions of mRNA, miRNA, and lncRNA to the GCBRGCN model, we conducted ablation studies, systematically removing one type of node at a time. Consistent with our expectations, we observed that the removal of mRNA nodes had the most significant impact on model performance, resulting in the largest reductions in accuracy (0.2432), precision (0.2005), and AUC (0.3172). This outcome could be attributed to mRNAs being the primary functional RNAs, and the fact that the majority of known GC biomarkers are mRNA-based. LncRNAs had the most substantial impact on the model’s recall (0.5574), and they also significantly affected the accuracy (0.1712) and F1-score (0.3094). Interestingly, miRNAs had a negligible effect on model performance across all metrics, including precision (0.0132), recall (0.0164), F1-score (0.0025), and AUC (0.0090), possibly owing to the inherent stability of miRNA biomarkers (Figure 3).
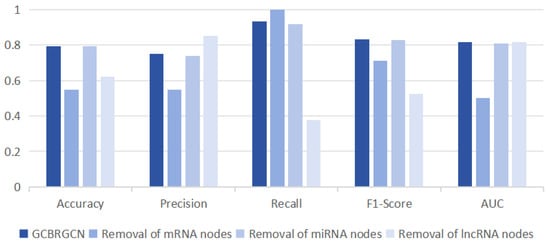
Figure 3.
Comparison of classification results of removing one type of node at a time based on GCBRGCN model.
3.3. Biological Interpretation of Novel GC Biomarkers
Our analysis revealed that novel GC biomarkers were predominantly associated with miRNAs in cancer, the MAPK signaling pathway, and tryptophan metabolism according to KEGG enrichment analysis (Figure 4A). Additionally, they were enriched in endocrine system development, heterochromatin, and DNA-binding transcription factor binding based on GO enrichment analysis (Figure 4B). To elucidate the interactions between novel GC biomarkers and established ones, we constructed three subnetwork focusing on the novel GC biomarkers. Our analysis revealed that the novel GC biomarkers CCNG1, BCL2, and Mir181 were linked to MEG3 and Mir181a which were known as GC biomarkers. MEG3 has been shown to suppress the proliferation and invasion of GC cells in vitro, and it can upregulate BCL2 through its compete combine against Mir181a [25] (Figure 4C). Similarly, the novel GC biomarkers HK2, Mir7, and CYP1B1 were connected with the known GC biomarkers UCA1, Mir513, and circBFAR. The UCA1/Mir513/CYP1B1 axis plays a role in modulating cisplatin resistance in human GC cells [26], and circBFAR has been demonstrated to enhance GC proliferation by targeting the Mir/HK2 axis [27]. Mir7 can bind to specific sites on UCA1, modulating the target EGFR [28] (Figure 4D). Additionally, the novel GC biomarkers Mir101 and ZEB1 emerged as central nodes in the subnetwork. Mir101 can directly target and repress the expression of the novel GC biomarker SRF [29]. Oncogene SNHG6 could regulate the Mir101/ZEB1 axis at the post-transcriptional level and recruit the enhancer of EZH2 to the promoter of P27, thereby silencing P27 expression at the transcriptional level [30] (Figure 4E).
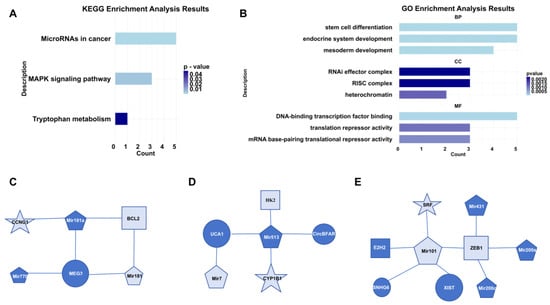
Figure 4.
Biological interpretation of novel GC biomarkers. (A) Results of KEGG pathway enrichment analysis. (B) Results of GO enrichment analysis. (C) Subnetwork of CCNG1. (D) Subnetwork of CYP1B1. (E) Subnetwork of SRF. In these networks, distinct shapes represent different types of RNAs, where the size of each shape corresponds to the degree of connectivity, and dark blue coloring indicates RNAs that are known biomarkers.
3.3.1. Novel Diagnostic Biomarkers
We discovered 14 novel diagnostic biomarkers with an AUC greater than 0.6 (Figure A1). From these, we developed diagnostic model one, which included seven biomarkers with an AUC above 0.7: CITED2 (0.96), HMGA2 (0.86), CCNG1 (0.81), SNHG14 (0.79), LINC00324 (0.76), Mir335 (0.72) and FOXC1 (0.7). This model exhibited an AUC of 0.97 in the TCGA datasets, and the external validation datasets reported an AUC of 0.85. To streamline the model, we then created a second diagnostic model, utilizing only three of the biomarkers: CITED2, HMGA2 and CCNG1. This simplified model achieved an AUC of 0.96 in TCGA datasets, with the external validation datasets indicating an AUC of 0.78, demonstrating significant predictive AUC (Figure 5A,B). The performance of these diagnostic models confirms the efficacy of the GCBRGCN in identifying diagnostic prediction biomarkers.
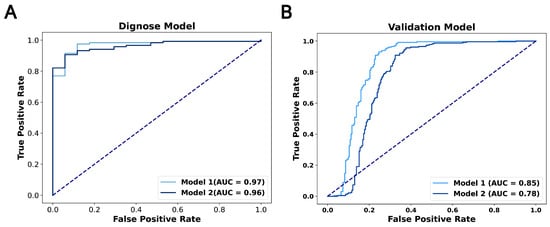
Figure 5.
(A) ROC curves for the diagnosis model using TCGA datasets. (B) ROC curves for the diagnosis model using external validation datasets.
3.3.2. Prognostic Biomarkers
Six novel prognostic biomarkers, including LINC00324, FOXC1, CRKL, SRF, CYP1B1 and CDH2, were assessed via multivariate Cox analysis. The samples were divided into a high-risk group and low-risk group by calculating the risk score, and the prognostic model was constructed. All prognostic biomarkers showed significant differential expression between the high- and low-risk groups (Figure 6A). Through Kaplan–Meier survival, we found that the prognosis of the high-risk group was significantly worse than that of the low-risk group (P = 9.958 ; Figure 6B). Furthermore, univariate Cox regression analysis demonstrated that the risk score, constructed based on six prognostic biomarkers, could serve as an independent prognostic indicator for GC patients, with a hazard ratio of 1.144 (95% CI: 1.087–1.204; Figure 6C). Furthermore, we developed a nomogram to assist clinicians in estimating the 1-year, 3-year, and 5-year survival rates for individual GC patients. For instance, if a patient’s total score is 400 points, calculated based on actual clinical information, the corresponding probabilities of OStime being less than 1 year, 3 years, and 5 years are 0.227, 0.537, and 0.662, respectively (Figure 7).
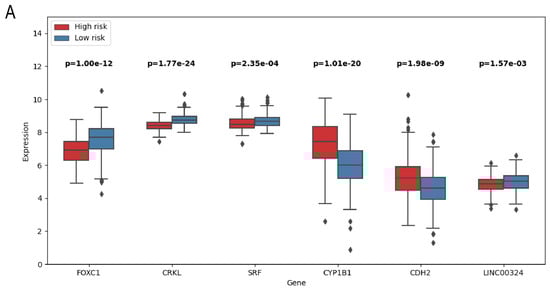
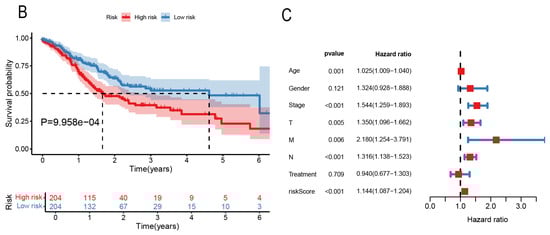
Figure 6.
(A) Boxplot of prognostic related genes in high- and low-risk groups. (B) Kaplan–Meier survival curves of patients in high- and low-risk groups. (C) Forest map of bivariate Cox risk regression analysis of forest map.
Figure 7.
Nomogram to predict the probability of 1-year, 3-year, or 5-year OS in patients with GC. Predictor points are obtained from the points scale according to the prognostic contribution of each variable subset. These, added together, give a total point score which can be translated into probability of survival at a specific timepoint (1-year, 3-year, or 5-year) by charting the score on the total points scale and projecting onto the probability of survival scale. The survival estimates are given as the probability of survival. For instance, if a patient’s total score is 400 points, calculated based on actual clinical information, the corresponding probabilities of OStime being less than 1 year, 3 years, and 5 years are 0.227, 0.537, and 0.662, respectively. Statistical significance of variables is indicated with asterisks, reflecting the strength of the association between the variable and OStime. * means p < 0.05; *** means p < 0.001.
4. Discussion
The significance of different RNA-type biomarkers in GC diagnostics and prognostics is garnering increasing attention within the scientific community. However, the development of comprehensive, multi-molecular biomarker prediction models in this field remains a less-researched area. Addressing this research gap, our study introduces the GCBRGCN model, which has shown superior performance in the discovery of novel GC biomarkers, outperforming both heterogeneous and traditional GNNs as well as conventional machine learning algorithms.
The GCBRGCN model constructs a network based on ceRNA interactions and incorporates critical transcriptomic features alongside pertinent clinical informations, including tumor staging and survival duration. By harnessing the complexity of these interactions through sophisticated heterogeneous GNN analysis, GCBRGCN is capable of uncovering potential novel biomarkers and deciphering their biological significance. This approach offers novel insights into the identification of new GC diagnostic and prognostic biomarkers.
We have identified Mir335, CCNG1, HMGA2, SNHG14, and CITED2 as potential new diagnostic biomarkers for GC. Mir335, recognized as a tumor suppressor gene in GC, is significantly down-regulated in GC compared to normal gastric tissue [31,32]. Furthermore, CCNG1, which is up-regulated in various tumor tissues [33,34], has not yet been identified as a GC diagnosis biomarker. However, our analysis revealed that CCNG1 is regulated by Mir181a and MEG3, which are well-established GC biomarkers [35]. Notably, the expression of MEG3 is decreased in GC patients, and it can up-regulate BCL2 by competitively binding to the Mir181a family, thereby inhibiting the onset of GC [36,37]. Additionally, it has been reported that high levels of HMGA2 are significantly correlated with lymphatic vessel invasion, perineural invasion, and TNM stage [38]. In another study, Dai et al. demonstrated that elevated levels of SNHG14, confirmed by sequencing and qRT-PCR, enhance GC proliferation, invasion, and migration, as demonstrated in vitro and in animal models [39]. Lastly, resistance to anthracycline chemotherapy drugs can be overcome by reactivating the epigenetically silenced CITED2 gene, thus providing a new strategy for GC treatment to enhance chemotherapy sensitivity and drug reactivity [40].
SRF, CRKL, CYP1B1 and CDH2 were identified as new potential prognostic biomarkers for GC. Firstly, SRF, a downstream target of the MAPK/ERK signaling pathway, promotes cell proliferation and the development of GC metastasis [41]. Additionally, SRF fosters the proliferation and invasion of GC cells by suppressing the expression of HOTAIR [29]. Secondly, CRKL, a substrate of BCR-ABL tyrosine kinase, is involved in the transformation process of BCR-ABL into fibroblasts [42]. Mir335 targets CRKL, thereby inhibiting the migration, invasion, and proliferation of tumor cells, arresting the cell cycle at the G0/G1 phase, and promoting apoptosis in GC cells [43]. Thirdly, CYP1B1, a member of the cytochrome P450 supergene family, plays a role in the regulation of several crucial transcription factors through the oxidation and metabolism of various carcinogenic precursors and anticancer drugs [26]. Finally, MFGE8 induces the expression of SNHG14, which in turn promotes the cellular epithelial–mesenchymal transition by stabilizing CDH2 [39].
Notably, FOXC1 and LINC00324 could serve as both prognostic and diagnostic biomarkers. Jiang’s research has shown that increased FOXC1 expression in GC patients is associated with a poor prognosis. At the molecular level, FOXC1 promotes the nuclear translocation of unphosphorylated catenin, which then upregulates c-MYC expression, thereby driving GC cell proliferation [44]. Additionally, Zou discovered that the expression level of LINC00324 is significantly higher in GC tissues than in corresponding normal tissues. The over-expression of LINC00324 correlates with an advanced TNM stage, larger tumor size, lymph node metastasis, and a poor prognosis [45].
It is important to recognize that our study does have certain limitations. Firstly, the integration of multiple RNA molecules and clinical information introduces complexities that may affect the performance of our model. Moreover, the discrepancies between whole transcriptomics data and cancer parameters present challenges in sourcing external test datasets to validate our model, thereby constraining its generalizability.
5. Conclusions
In conclusion, the GCBRGCN provides a novel and interpretable method for predicting GC biomarkers by integrating whole transcriptomics data and clinical information with ceRNA networks. Our study identified three unreported potential novel GC biomarkers: CCNG1, CYP1B1, and CITED2. Moreover, FOXC1 and LINC00324 were characterized as biomarkers that were significant in both prognosis and diagnosis. This innovative approach is expected to enhance diagnostic and prognostic capabilities in GC and offers a new paradigm for biomarker discovery in other cancers.
Author Contributions
Conceptualization and data curation: P.Z. and C.Z.; methodology, software and validation: P.Z., Y.L. and C.Z.; formal analysis: P.Z. and Y.L.; writing—original draft preparation, P.Z., Y.L. and C.Z.; writing—review and editing: C.Z. and K.H.; project administration, K.H.; funding acquisition, C.Z. and K.H. All authors have read and agreed to the published version of the manuscript.
Funding
This research was funded by National Engineering Laboratory for Industrial Big-data Application Technology.
Institutional Review Board Statement
Not applicable.
Informed Consent Statement
Not applicable.
Data Availability Statement
The original data and code presented in this study are openly available in https://github.com/PengZhi1906/GCBRGCN, accessed on 1 January 2020.
Acknowledgments
We would like to thank the Talent Project of the Chinese PLA General Hospital.
Conflicts of Interest
The authors declare no conflicts of interest.
Abbreviations
The following abbreviations are used in this manuscript:
| GC | Gastric cancer |
| RNA | Ribonucleic acid |
| ceRNA | Rompeting endogenous RNA |
| RGCN | Relational graph convolutional network |
| GCBRGCN | GC biomarker RGCN |
| AUC | Area under the curve |
| PPI | Protein–protein interaction |
| lncRNA | Long non-coding RNA |
| miRNA | MicroRNA |
| mRNA | Messenger RNA |
| SVM | Support vector machine |
| GNNs | Graph neural networks |
| logFC | Log-fold change |
| CGC | Cancer Gene Census |
| TCGA | The Cancer Genome Atlas |
| OStime | Overall survival time |
| T | Tumor classification |
| N | Lymph node involvement |
| M | Metastasis |
| GNN | Graph convolutional network |
| HAN | Heterogeneous graph attention network |
| KNN | K-nearest neighbor |
| RF | Random forest |
| XGBoost | eXtreme Gradient Boosting |
| ACC | Accuracy |
| ROC | Receiver operating characteristic |
| TPR | True-positive rate |
| FPR | False-positive rate |
| TP | True Positive |
| FP | False Positive |
| TN | True Negative |
| FN | False Negative |
| KEGG | Kyoto Encyclopedia of Genes and Genomes |
| GO | Gene Ontology |
| BP | Biological process |
| CC | Cellular component |
| MF | Molecular function |
| FDR | False discovery rate |
Appendix A
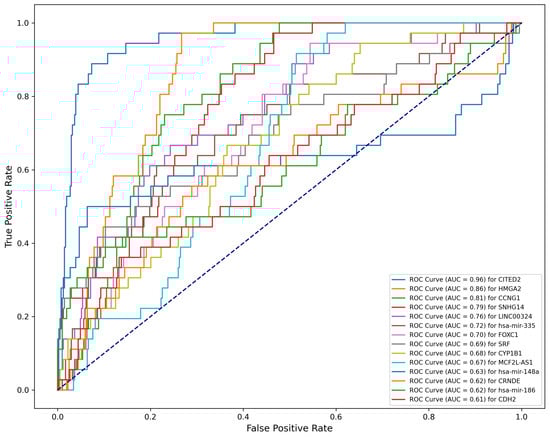
Figure A1.
Performance of new predictive diagnosis biomarkers (.
Table A1.
Dropout in hyperparameter.
Table A1.
Dropout in hyperparameter.
| Dropout | Accuracy | Precision | Recall | F1-Score | AUC |
|---|---|---|---|---|---|
| 0 | 0.7838 | 0.7402 | 0.9344 | 0.8261 | 0.8169 |
| 0.2 | 0.7838 | 0.7402 | 0.9344 | 0.8261 | 0.8169 |
| 0.4 | 0.7838 | 0.7402 | 0.9344 | 0.8261 | 0.8169 |
| 0.6 | 0.7928 | 0.7500 | 0.9344 | 0.8321 | 0.8172 |
| 0.8 | 0.7928 | 0.7500 | 0.9344 | 0.8321 | 0.8172 |
Table A2.
Self-loop in hyperparameter.
Table A2.
Self-loop in hyperparameter.
| Self-Loop | Accuracy | Precision | Recall | F1-Score | AUC |
|---|---|---|---|---|---|
| TRUE | 0.7928 | 0.7500 | 0.9344 | 0.8321 | 0.8172 |
| FALSE | 0.7838 | 0.7403 | 0.9344 | 0.8261 | 0.8169 |
Table A3.
Learning rate in hyperparameter.
Table A3.
Learning rate in hyperparameter.
| Learning Rate | Accuracy | Precision | Recall | F1-Score | AUC |
|---|---|---|---|---|---|
| 0.1 | 0.7928 | 0.7568 | 0.9180 | 0.8296 | 0.8182 |
| 0.01 | 0.7928 | 0.7500 | 0.9344 | 0.8321 | 0.8172 |
| 0.001 | 0.6757 | 0.6316 | 0.9836 | 0.7692 | 0.8166 |
| 0.0001 | 0.5495 | 0.5495 | 1.0000 | 0.7093 | 0.3251 |
| 0.00001 | 0.5495 | 0.5495 | 1.0000 | 0.7093 | 0.3251 |
Table A4.
Five-fold cross-validation result of GCBRGCN.
Table A4.
Five-fold cross-validation result of GCBRGCN.
| Fold | Accuracy | Precision | Recall | F1-Score | AUC |
|---|---|---|---|---|---|
| Fold 1 | 0.8182 | 0.5833 | 0.6364 | 0.6087 | 0.7532 |
| Fold 2 | 0.7778 | 0.7755 | 1.0000 | 0.8736 | 0.5217 |
| Fold 3 | 0.7980 | 0.7419 | 0.9200 | 0.8214 | 0.7967 |
| Fold 4 | 0.5612 | 0.3273 | 0.7500 | 0.4557 | 0.6250 |
| Fold 5 | 0.5714 | 0.4324 | 1.0000 | 0.6038 | 0.6818 |
Table A5.
Five-fold cross-validation result of HAN.
Table A5.
Five-fold cross-validation result of HAN.
| Fold | Accuracy | Precision | Recall | F1-Score | AUC |
|---|---|---|---|---|---|
| Fold 1 | 0.3535 | 0.25 | 0.9545 | 0.3962 | 0.5924 |
| Fold 2 | 0.7778 | 0.7755 | 1 | 0.8736 | 0.5375 |
| Fold 3 | 0.6768 | 0.6154 | 0.96 | 0.75 | 0.7714 |
| Fold 4 | 0.4592 | 0.3067 | 0.9583 | 0.4646 | 0.761 |
| Fold 5 | 0.5306 | 0.4103 | 1 | 0.5818 | 0.7282 |
Table A6.
Five-fold cross-validation result of GCN.
Table A6.
Five-fold cross-validation result of GCN.
| Fold | Accuracy | Precision | Recall | F1-Score | AUC |
|---|---|---|---|---|---|
| Fold 1 | 0.6465 | 0.2593 | 0.3182 | 0.2857 | 0.6057 |
| Fold 2 | 0.7677 | 0.7789 | 0.9737 | 0.8655 | 0.6773 |
| Fold 3 | 0.5253 | 0.5155 | 1.0000 | 0.6803 | 0.6592 |
| Fold 4 | 0.2449 | 0.2449 | 1.0000 | 0.3934 | 0.6118 |
| Fold 5 | 0.3469 | 0.3333 | 1.0000 | 0.5000 | 0.5959 |
Table A7.
Five-fold cross-validation result of GAT.
Table A7.
Five-fold cross-validation result of GAT.
| Fold | Accuracy | Precision | Recall | F1-Score | AUC |
|---|---|---|---|---|---|
| Fold 1 | 0.737374 | 0.333333 | 0.181818 | 0.235294 | 0.64876 |
| Fold 2 | 0.787879 | 0.808989 | 0.947368 | 0.872727 | 0.629291 |
| Fold 3 | 0.606061 | 0.563218 | 0.98 | 0.715328 | 0.665714 |
| Fold 4 | 0.418367 | 0.291139 | 0.958333 | 0.446602 | 0.70045 |
| Fold 5 | 0.367347 | 0.336957 | 0.96875 | 0.5 | 0.617424 |
Table A8.
Five-fold cross-validation result of KNN.
Table A8.
Five-fold cross-validation result of KNN.
| Fold | Accuracy | Precision | Recall | F1-Score | AUC |
|---|---|---|---|---|---|
| Fold 1 | 0.5593 | 0.5200 | 0.4815 | 0.5000 | 0.6053 |
| Fold 2 | 0.5763 | 0.5385 | 0.5185 | 0.5283 | 0.6007 |
| Fold 3 | 0.5424 | 0.5000 | 0.5556 | 0.5263 | 0.6319 |
| Fold 4 | 0.5593 | 0.5185 | 0.5185 | 0.5185 | 0.6238 |
| Fold 5 | 0.5517 | 0.5000 | 0.4231 | 0.4583 | 0.5877 |
Table A9.
Five-fold cross-validation result of random forest.
Table A9.
Five-fold cross-validation result of random forest.
| Fold | Accuracy | Precision | Recall | F1-Score | AUC |
|---|---|---|---|---|---|
| Fold 1 | 0.6271 | 0.5926 | 0.5926 | 0.5926 | 0.6250 |
| Fold 2 | 0.6102 | 0.6111 | 0.4074 | 0.4889 | 0.6753 |
| Fold 3 | 0.6102 | 0.6000 | 0.4444 | 0.5106 | 0.6470 |
| Fold 4 | 0.5593 | 0.5556 | 0.1852 | 0.2778 | 0.5972 |
| Fold 5 | 0.6034 | 0.5714 | 0.4615 | 0.5106 | 0.5397 |
Table A10.
Five-fold cross-validation result of XGBoost.
Table A10.
Five-fold cross-validation result of XGBoost.
| Fold | Accuracy | Precision | Recall | F1-Score | AUC |
|---|---|---|---|---|---|
| Fold 1 | 0.5932 | 0.5517 | 0.5926 | 0.5714 | 0.6175 |
| Fold 2 | 0.6441 | 0.6364 | 0.5185 | 0.5714 | 0.6377 |
| Fold 3 | 0.5932 | 0.5652 | 0.4815 | 0.5200 | 0.5914 |
| Fold 4 | 0.5593 | 0.5217 | 0.4444 | 0.4800 | 0.6053 |
| Fold 5 | 0.5345 | 0.4800 | 0.4615 | 0.4706 | 0.5337 |
References
- Smyth, E.C.; Nilsson, M.; Grabsch, H.I.; van Grieken, N.C.; Lordick, F. Gastric cancer. Lancet 2020, 396, 635–648. [Google Scholar] [CrossRef] [PubMed]
- So, J.B.Y.; Kapoor, R.; Zhu, F.; Koh, C.; Zhou, L.; Zou, R.; Tang, Y.C.; Goo, P.C.; Rha, S.Y.; Chung, H.C.; et al. Development and validation of a serum microRNA biomarker panel for detecting gastric cancer in a high-risk population. Gut 2021, 70, 829–837. [Google Scholar] [CrossRef]
- Röcken, C. Predictive biomarkers in gastric cancer. J. Cancer Res. Clin. Oncol. 2023, 149, 467–481. [Google Scholar] [CrossRef] [PubMed]
- Yang, J.; Wei, H.; Liu, M.; Huang, T.; Fang, X.; Ren, X.; Yuan, H.; Zheng, Y.; Wang, Y.; Zhou, Y. Prognostic biomarker HAMP and associates with immune infiltration in gastric cancer. Int. Immunopharmacol. 2022, 108, 108839. [Google Scholar] [CrossRef]
- Skrede, O.J.; De Raedt, S.; Kleppe, A.; Hveem, T.S.; Liestøl, K.; Maddison, J.; Askautrud, H.A.; Pradhan, M.; Nesheim, J.A.; Albregtsen, F.; et al. Deep learning for prediction of colorectal cancer outcome: A discovery and validation study. Lancet 2020, 395, 350–360. [Google Scholar] [CrossRef] [PubMed]
- Morselli Gysi, D.; Barabási, A.L. Noncoding RNAs improve the predictive power of network medicine. Proc. Natl. Acad. Sci. USA 2023, 120, e2301342120. [Google Scholar] [CrossRef] [PubMed]
- Wu, M.; Lu, L.; Dai, T.; Li, A.; Yu, Y.; Li, Y.; Xu, Z.; Chen, Y. Construction of a lncRNA-mediated ceRNA network and a genomic-clinicopathologic nomogram to predict survival for breast cancer patients. Cancer Biomarkers 2023, 36, 83–96. [Google Scholar] [CrossRef]
- Qi, X.; Lin, Y.; Chen, J.; Shen, B. Decoding competing endogenous RNA networks for cancer biomarker discovery. Briefings Bioinform. 2020, 21, 441–457. [Google Scholar] [CrossRef]
- Prelaj, A.; Miskovic, V.; Zanitti, M.; Trovo, F.; Genova, C.; Viscardi, G.; Rebuzzi, S.; Mazzeo, L.; Provenzano, L.; Kosta, S.; et al. Artificial intelligence for predictive biomarker discovery in immuno-oncology: A systematic review. Ann. Oncol. 2023. [Google Scholar] [CrossRef]
- Hu, D.; Dong, Z.; Liang, K.; Yu, H.; Wang, S.; Liu, X. High-order Topology for Deep Single-cell Multi-view Fuzzy Clustering. IEEE Trans. Fuzzy Syst. 2024. [Google Scholar] [CrossRef]
- Liu, Y.; Tu, W.; Zhou, S.; Liu, X.; Song, L.; Yang, X.; Zhu, E. Deep Graph Clustering via Dual Correlation Reduction. In Proceedings of the AAAI Conference on Artificial Intelligence, Online, 22 February–1 March 2022; Volume 36, pp. 7603–7611. [Google Scholar]
- Schulte-Sasse, R.; Budach, S.; Hnisz, D.; Marsico, A. Integration of multiomics data with graph convolutional networks to identify new cancer genes and their associated molecular mechanisms. Nat. Mach. Intell. 2021, 3, 513–526. [Google Scholar] [CrossRef]
- Wang, T.; Shao, W.; Huang, Z.; Tang, H.; Zhang, J.; Ding, Z.; Huang, K. MOGONET integrates multi-omics data using graph convolutional networks allowing patient classification and biomarker identification. Nat. Commun. 2021, 12, 3445. [Google Scholar] [CrossRef] [PubMed]
- Gao, M.; Liu, S.; Qi, Y.; Guo, X.; Shang, X. GAE-LGA: Integration of multi-omics data with graph autoencoders to identify lncRNA–PCG associations. Briefings Bioinform. 2022, 23, bbac452. [Google Scholar] [CrossRef]
- Peng, W.; Wu, R.; Dai, W.; Yu, N. Identifying cancer driver genes based on multi-view heterogeneous graph convolutional network and self-attention mechanism. BMC Bioinform. 2023, 24, 16. [Google Scholar] [CrossRef] [PubMed]
- Wang, P.; Guo, Q.; Qi, Y.; Hao, Y.; Gao, Y.; Zhi, H.; Zhang, Y.; Sun, Y.; Zhang, Y.; Xin, M.; et al. LncACTdb 3.0: An updated database of experimentally supported ceRNA interactions and personalized networks contributing to precision medicine. Nucleic Acids Res. 2022, 50, D183–D189. [Google Scholar] [CrossRef] [PubMed]
- Tate, J.G.; Bamford, S.; Jubb, H.C.; Sondka, Z.; Beare, D.M.; Bindal, N.; Boutselakis, H.; Cole, C.G.; Creatore, C.; Dawson, E.; et al. COSMIC: The catalogue of somatic mutations in cancer. Nucleic Acids Res. 2019, 47, D941–D947. [Google Scholar] [CrossRef]
- Zuo, Z.; Hu, H.; Xu, Q.; Luo, X.; Peng, D.; Zhu, K.; Zhao, Q.; Xie, Y.; Ren, J. BBCancer: An expression atlas of blood-based biomarkers in the early diagnosis of cancers. Nucleic Acids Res. 2020, 48, D789–D796. [Google Scholar] [CrossRef]
- Martínez-Jiménez, F.; Muiños, F.; Sentís, I.; Deu-Pons, J.; Reyes-Salazar, I.; Arnedo-Pac, C.; Mularoni, L.; Pich, O.; Bonet, J.; Kranas, H.; et al. A compendium of mutational cancer driver genes. Nat. Rev. Cancer 2020, 20, 555–572. [Google Scholar] [CrossRef]
- Bao, Z.; Yang, Z.; Huang, Z.; Zhou, Y.; Cui, Q.; Dong, D. LncRNADisease 2.0: An updated database of long non-coding RNA-associated diseases. Nucleic Acids Res. 2019, 47, D1034–D1037. [Google Scholar] [CrossRef]
- Safran, M.; Rosen, N.; Twik, M.; BarShir, R.; Stein, T.I.; Dahary, D.; Fishilevich, S.; Lancet, D. The genecards suite. In Practical Guide to Life Science Databases; Springer: Singapore, 2021; pp. 27–56. [Google Scholar]
- Wang, X.; Ji, H.; Shi, C.; Wang, B.; Ye, Y.; Cui, P.; Yu, P.S. Heterogeneous graph attention network. In Proceedings of the World Wide Web Conference, San Francisco, CA, USA, 13–17 May 2019; pp. 2022–2032. [Google Scholar]
- Gori, M.; Monfardini, G.; Scarselli, F. A new model for learning in graph domains. In Proceedings of the 2005 IEEE International Joint Conference on Neural Networks, Montreal, QC, Canada, 31 July–4 August 2005; IEEE: Piscataway, NJ, USA, 2005; Volume 2, pp. 729–734. [Google Scholar]
- Wang, H.; Wang, Z.; Chen, J.; Liu, W. Graph attention network model with defined applicability domains for screening PBT chemicals. Environ. Sci. Technol. 2022, 56, 6774–6785. [Google Scholar] [CrossRef]
- Fan, S.; Ren, Y.; Zhang, W.; Zhang, H.; Wang, C. Long non-coding maternally expressed gene 3 regulates cigarette smoke extract-induced apoptosis, inflammation and cytotoxicity by sponging miR-181a-2-3p in 16HBE cells. Oncol. Lett. 2021, 21, 45. [Google Scholar] [CrossRef] [PubMed]
- Cheng, H.; Sharen, G.; Wang, Z.; Zhou, J. LncRNA UCA1 enhances cisplatin resistance by regulating CYP1B1-mediated apoptosis via miR-513a-3p in human gastric cancer. Cancer Manag. Res. 2021, 13, 367–377. [Google Scholar] [CrossRef] [PubMed]
- Wang, Y.; Cao, B.; Zhao, R.; Li, H.; Wei, B.; Dai, G. Knockdown of circBFAR inhibits proliferation and glycolysis in gastric cancer by sponging miR-513a-3p/hexokinase 2 axis. Biochem. Biophys. Res. Commun. 2021, 560, 80–86. [Google Scholar] [CrossRef]
- Yang, Z.; Shi, X.; Li, C.; Wang, X.; Hou, K.; Li, Z.; Zhang, X.; Fan, Y.; Qu, X.; Che, X.; et al. Long non-coding RNA UCA1 upregulation promotes the migration of hypoxia-resistant gastric cancer cells through the miR-7-5p/EGFR axis. Exp. Cell Res. 2018, 368, 194–201. [Google Scholar] [CrossRef] [PubMed]
- Wu, X.; Zhou, J.; Wu, Z.; Chen, C.; Liu, J.; Wu, G.; Zhai, J.; Liu, F.; Li, G. miR-101-3p suppresses HOX transcript antisense RNA (HOTAIR)-induced proliferation and invasion through directly targeting SRF in gastric carcinoma cells. Oncol. Res. 2017, 25, 1383. [Google Scholar] [CrossRef]
- Yan, K.; Tian, J.; Shi, W.; Xia, H.; Zhu, Y. LncRNA SNHG6 is Associated with Poor Prognosis of Gastric Cancer and Promotes Cell Proliferation and EMT through Epigenetically Silencing p27 and Sponging miR-101-3p. Cell. Physiol. Biochem. 2017, 42, 999–1012. [Google Scholar] [CrossRef]
- Sandoval-Bórquez, A.; Polakovicova, I.; Carrasco-Véliz, N.; Lobos-González, L.; Riquelme, I.; Carrasco-Avino, G.; Bizama, C.; Norero, E.; Owen, G.I.; Roa, J.C.; et al. MicroRNA-335-5p is a potential suppressor of metastasis and invasion in gastric cancer. Clin. Epigenetics 2017, 9, 1–16. [Google Scholar] [CrossRef]
- Zare, A.; Ahadi, A.; Larki, P.; Omrani, M.D.; Zali, M.R.; Alamdari, N.M.; Ghaedi, H. The clinical significance of miR-335, miR-124, miR-218 and miR-484 downregulation in gastric cancer. Mol. Biol. Rep. 2018, 45, 1587–1595. [Google Scholar] [CrossRef]
- Xu, Y.; Zhang, Q.; Miao, C.; Dongol, S.; Li, Y.; Jin, C.; Dong, R.; Li, Y.; Yang, X.; Kong, B. CCNG1 (Cyclin G1) regulation by mutant-P53 via induction of Notch3 expression promotes high-grade serous ovarian cancer (HGSOC) tumorigenesis and progression. Cancer Med. 2019, 8, 351–362. [Google Scholar] [CrossRef]
- Han, H.; Zhang, Z.; Yang, X.; Yang, W.; Xue, C.; Cao, X. miR-23b suppresses lung carcinoma cell proliferation through CCNG1 Corrigendum in/10.3892/ol. 2018.9790. Oncol. Lett. 2018, 16, 4317–4324. [Google Scholar]
- Hu, X.; Lou, T.; Yuan, C.; Wang, Y.; Tu, X.; Wang, Y.; Zhang, T. Effects of lncRNA ANRIL-knockdown on the proliferation, apoptosis and cell cycle of gastric cancer cells. Oncol. Lett. 2021, 22, 621. [Google Scholar] [CrossRef]
- Chen, G.; Shen, Z.L.; Wang, L.; Lv, C.Y.; Huang, X.E.; Zhou, R.P. Hsa-miR-181a-5p expression and effects on cell proliferation in gastric cancer. Asian Pac. J. Cancer Prev. 2013, 14, 3871–3875. [Google Scholar] [CrossRef] [PubMed]
- Peng, W.; Si, S.; Zhang, Q.; Li, C.; Zhao, F.; Wang, F.; Yu, J.; Ma, R. Long non-coding RNA MEG3 functions as a competing endogenous RNA to regulate gastric cancer progression. J. Exp. Clin. Cancer Res. 2015, 34, 79. [Google Scholar] [CrossRef]
- Jun, K.H.; Jung, J.H.; Choi, H.J.; Shin, E.Y.; Chin, H.M. HMGA1/HMGA2 protein expression and prognostic implications in gastric cancer. Int. J. Surg. 2015, 24, 39–44. [Google Scholar] [CrossRef]
- Dai, Z.T.; Wu, Y.L.; Xu, T.; Li, X.R.; Ji, T. The role of lncRNA SNHG14 in gastric cancer: Enhancing tumor cell proliferation and migration, and mechanisms of CDH2 expression. Cell Cycle 2024, 1–16. [Google Scholar]
- Regel, I.; Merkl, L.; Friedrich, T.; Burgermeister, E.; Zimmermann, W.; Einwächter, H.; Herrmann, K.; Langer, R.; Röcken, C.; Hofheinz, R.; et al. Pan-histone deacetylase inhibitor panobinostat sensitizes gastric cancer cells to anthracyclines via induction of CITED2. Gastroenterology 2012, 143, 99–109. [Google Scholar] [CrossRef] [PubMed]
- Zhao, L.; Sun, X.; Chen, L.; Feng, X.; Yang, X.; Zou, P.; Wang, X.; Zhang, R. Hepatitis C Virus Core Protein Promotes the Metastasis of Human Hepatocytes by Activating the MAPK/ERK/PEA3-SRF/c-Fos/MMPs Axis. Arch. Med. Res. 2022, 53, 469–482. [Google Scholar] [CrossRef] [PubMed]
- Xie, P.; Yu, M.; Zhang, B.; Yu, Q.; Zhao, Y.; Wu, M.; Jin, L.; Yan, J.; Zhou, B.; Liu, S.; et al. CRKL dictates anti-PD-1 resistance by mediating tumor-associated neutrophil infiltration in hepatocellular carcinoma. J. Hepatol. 2024, 81, 93–107. [Google Scholar] [CrossRef]
- Zhang, J.K.; Li, Y.S.; Zhang, C.D.; Dai, D.Q. Up-regulation of CRKL by microRNA-335 methylation is associated with poor prognosis in gastric cancer. Cancer Cell Int. 2017, 17, 28. [Google Scholar] [CrossRef]
- Jiang, J.; Li, J.; Yao, W.; Wang, W.; Shi, B.; Yuan, F.; Dong, J.; Zhang, H. FOXC1 negatively regulates DKK1 expression to promote gastric cancer cell proliferation through activation of Wnt signaling pathway. Front. Cell Dev. Biol. 2021, 9, 662624. [Google Scholar] [CrossRef]
- Zou, Z.; Ma, T.; He, X.; Zhou, J.; Ma, H.; Xie, M.; Liu, Y.; Lu, D.; Di, S.; Zhang, Z. Long intergenic non-coding RNA 00324 promotes gastric cancer cell proliferation via binding with HuR and stabilizing FAM83B expression. Cell Death Dis. 2018, 9, 717. [Google Scholar] [CrossRef]
Disclaimer/Publisher’s Note: The statements, opinions and data contained in all publications are solely those of the individual author(s) and contributor(s) and not of MDPI and/or the editor(s). MDPI and/or the editor(s) disclaim responsibility for any injury to people or property resulting from any ideas, methods, instructions or products referred to in the content. |
© 2025 by the authors. Licensee MDPI, Basel, Switzerland. This article is an open access article distributed under the terms and conditions of the Creative Commons Attribution (CC BY) license (https://creativecommons.org/licenses/by/4.0/).