

A Mathematical Exploration of the Effects of Ischemia-Reperfusion Injury After a Myocardial Infarction

 , ,
, ,  ,
,  and
and 
Abstract
1. Introduction
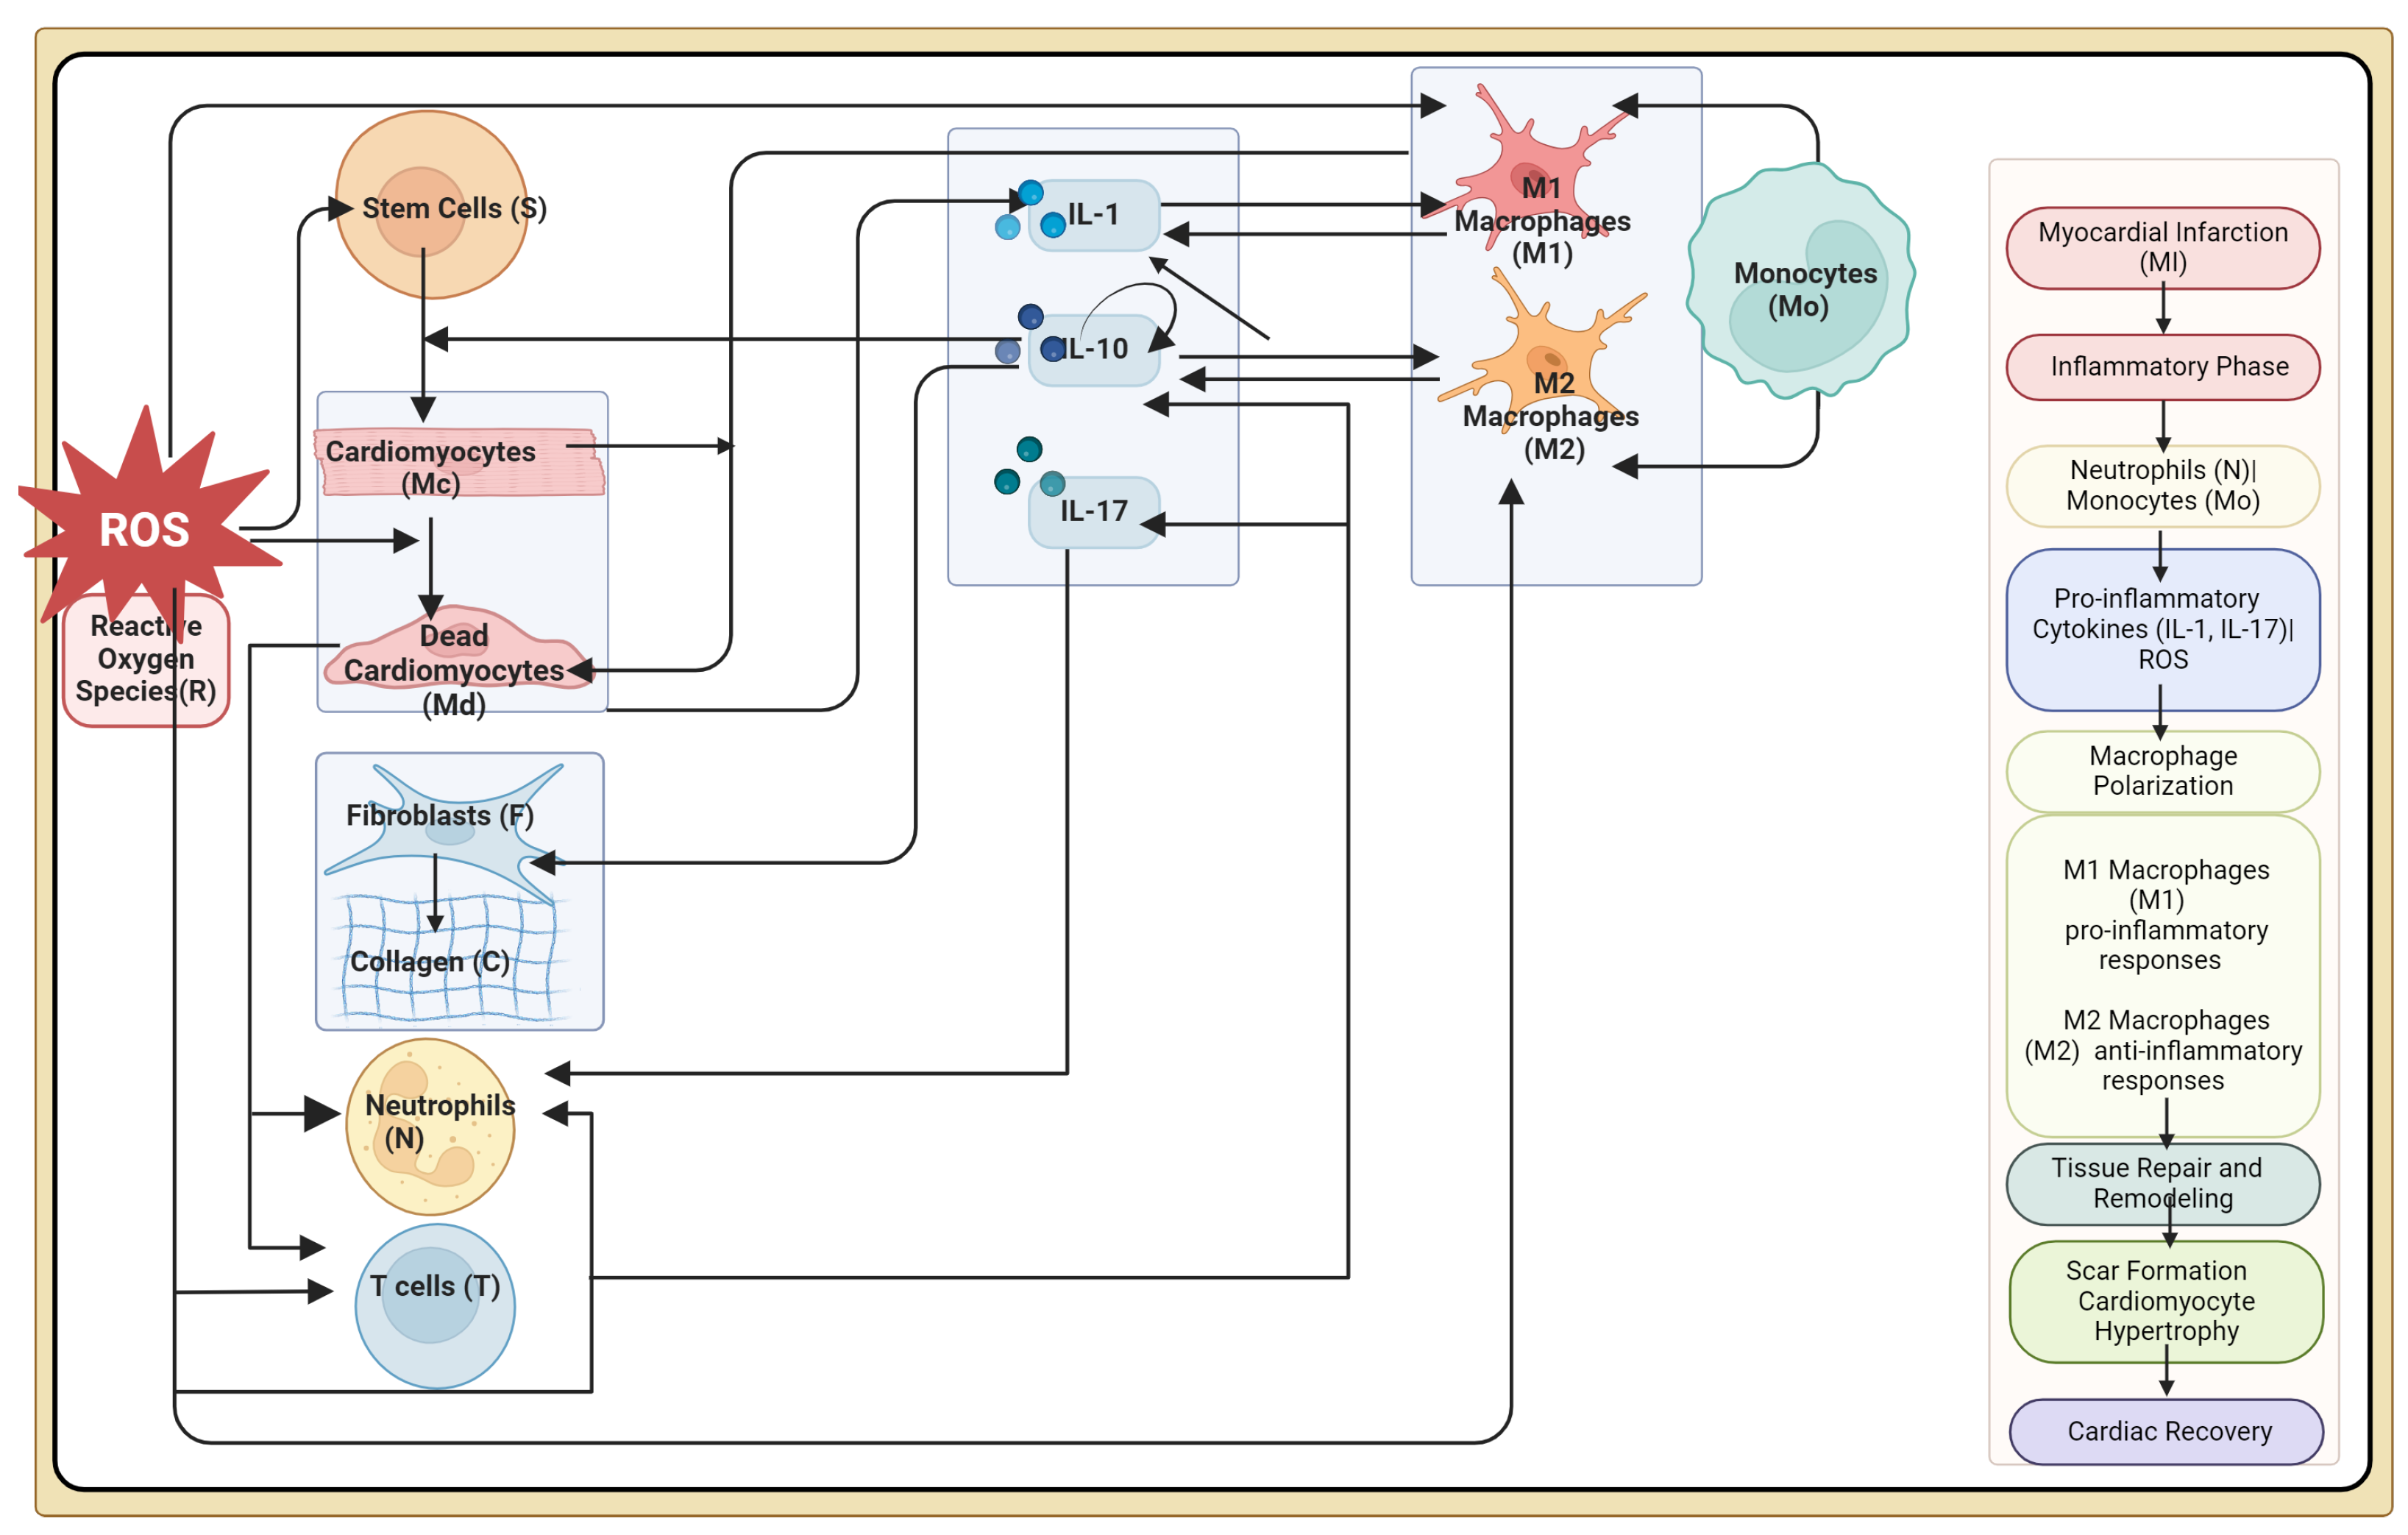
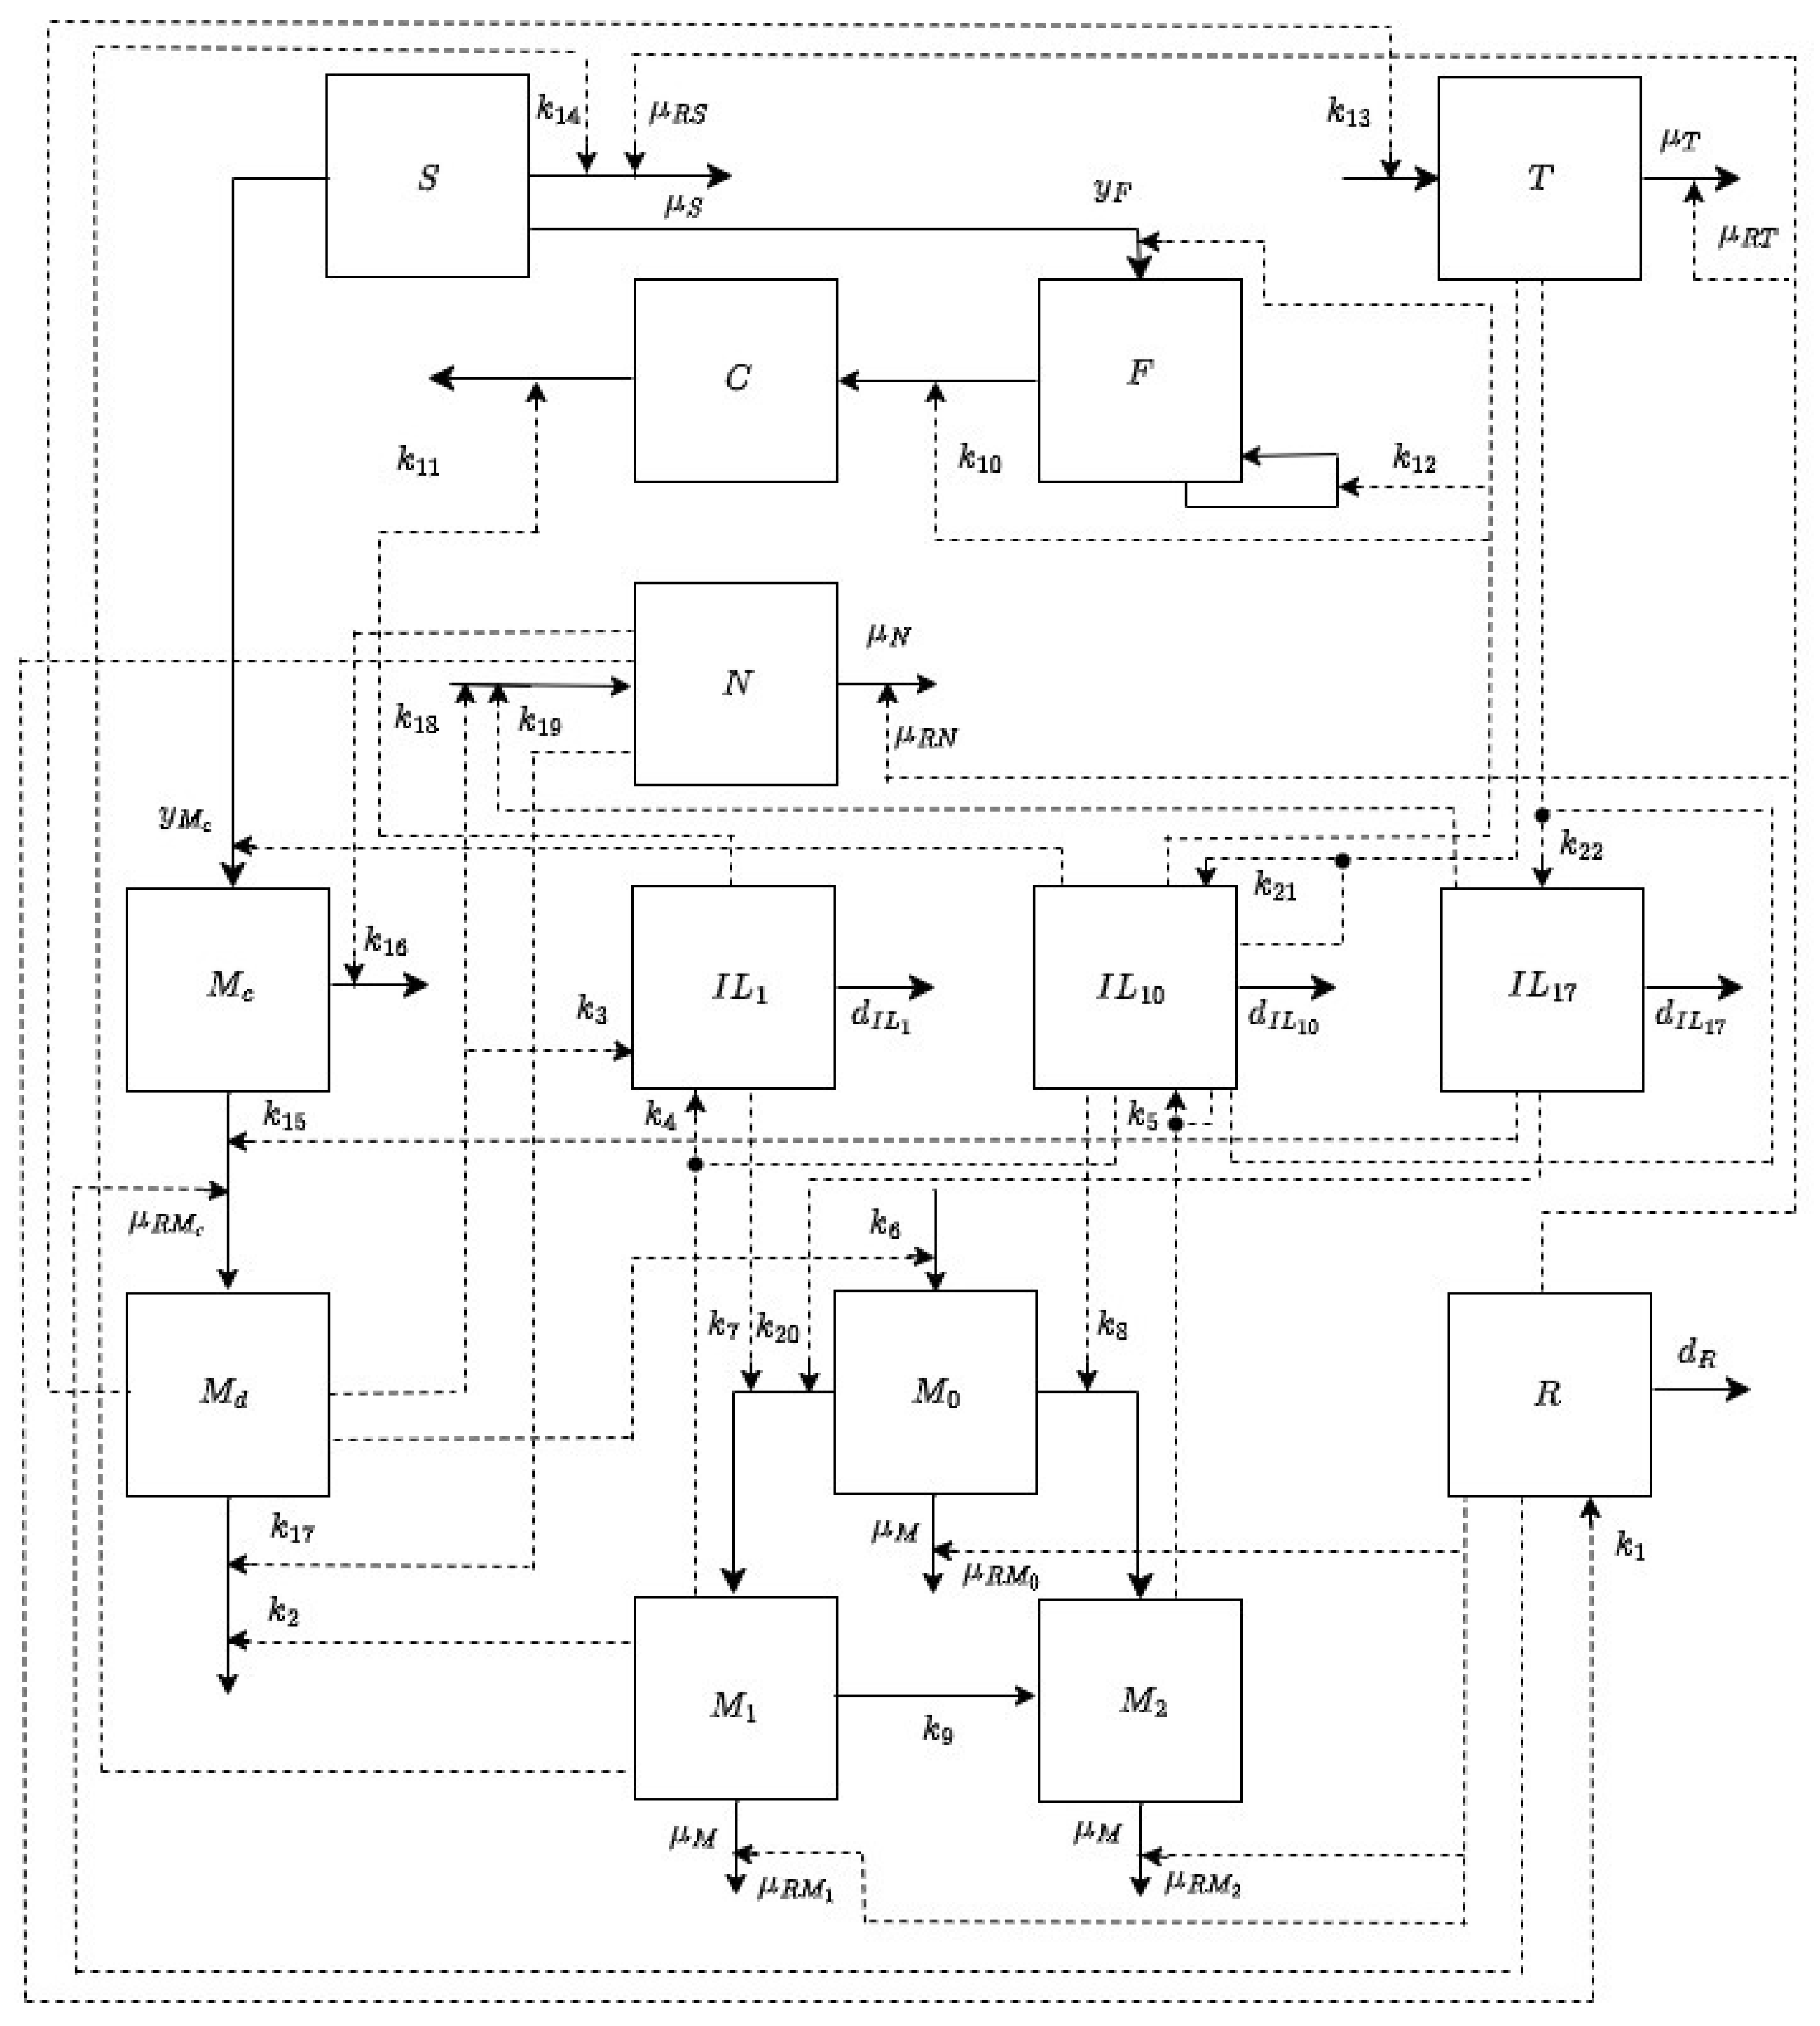
2. Materials and Methods
2.1. Modeling Assumptions
2.2. Model Formulation
3. Analysis and Results
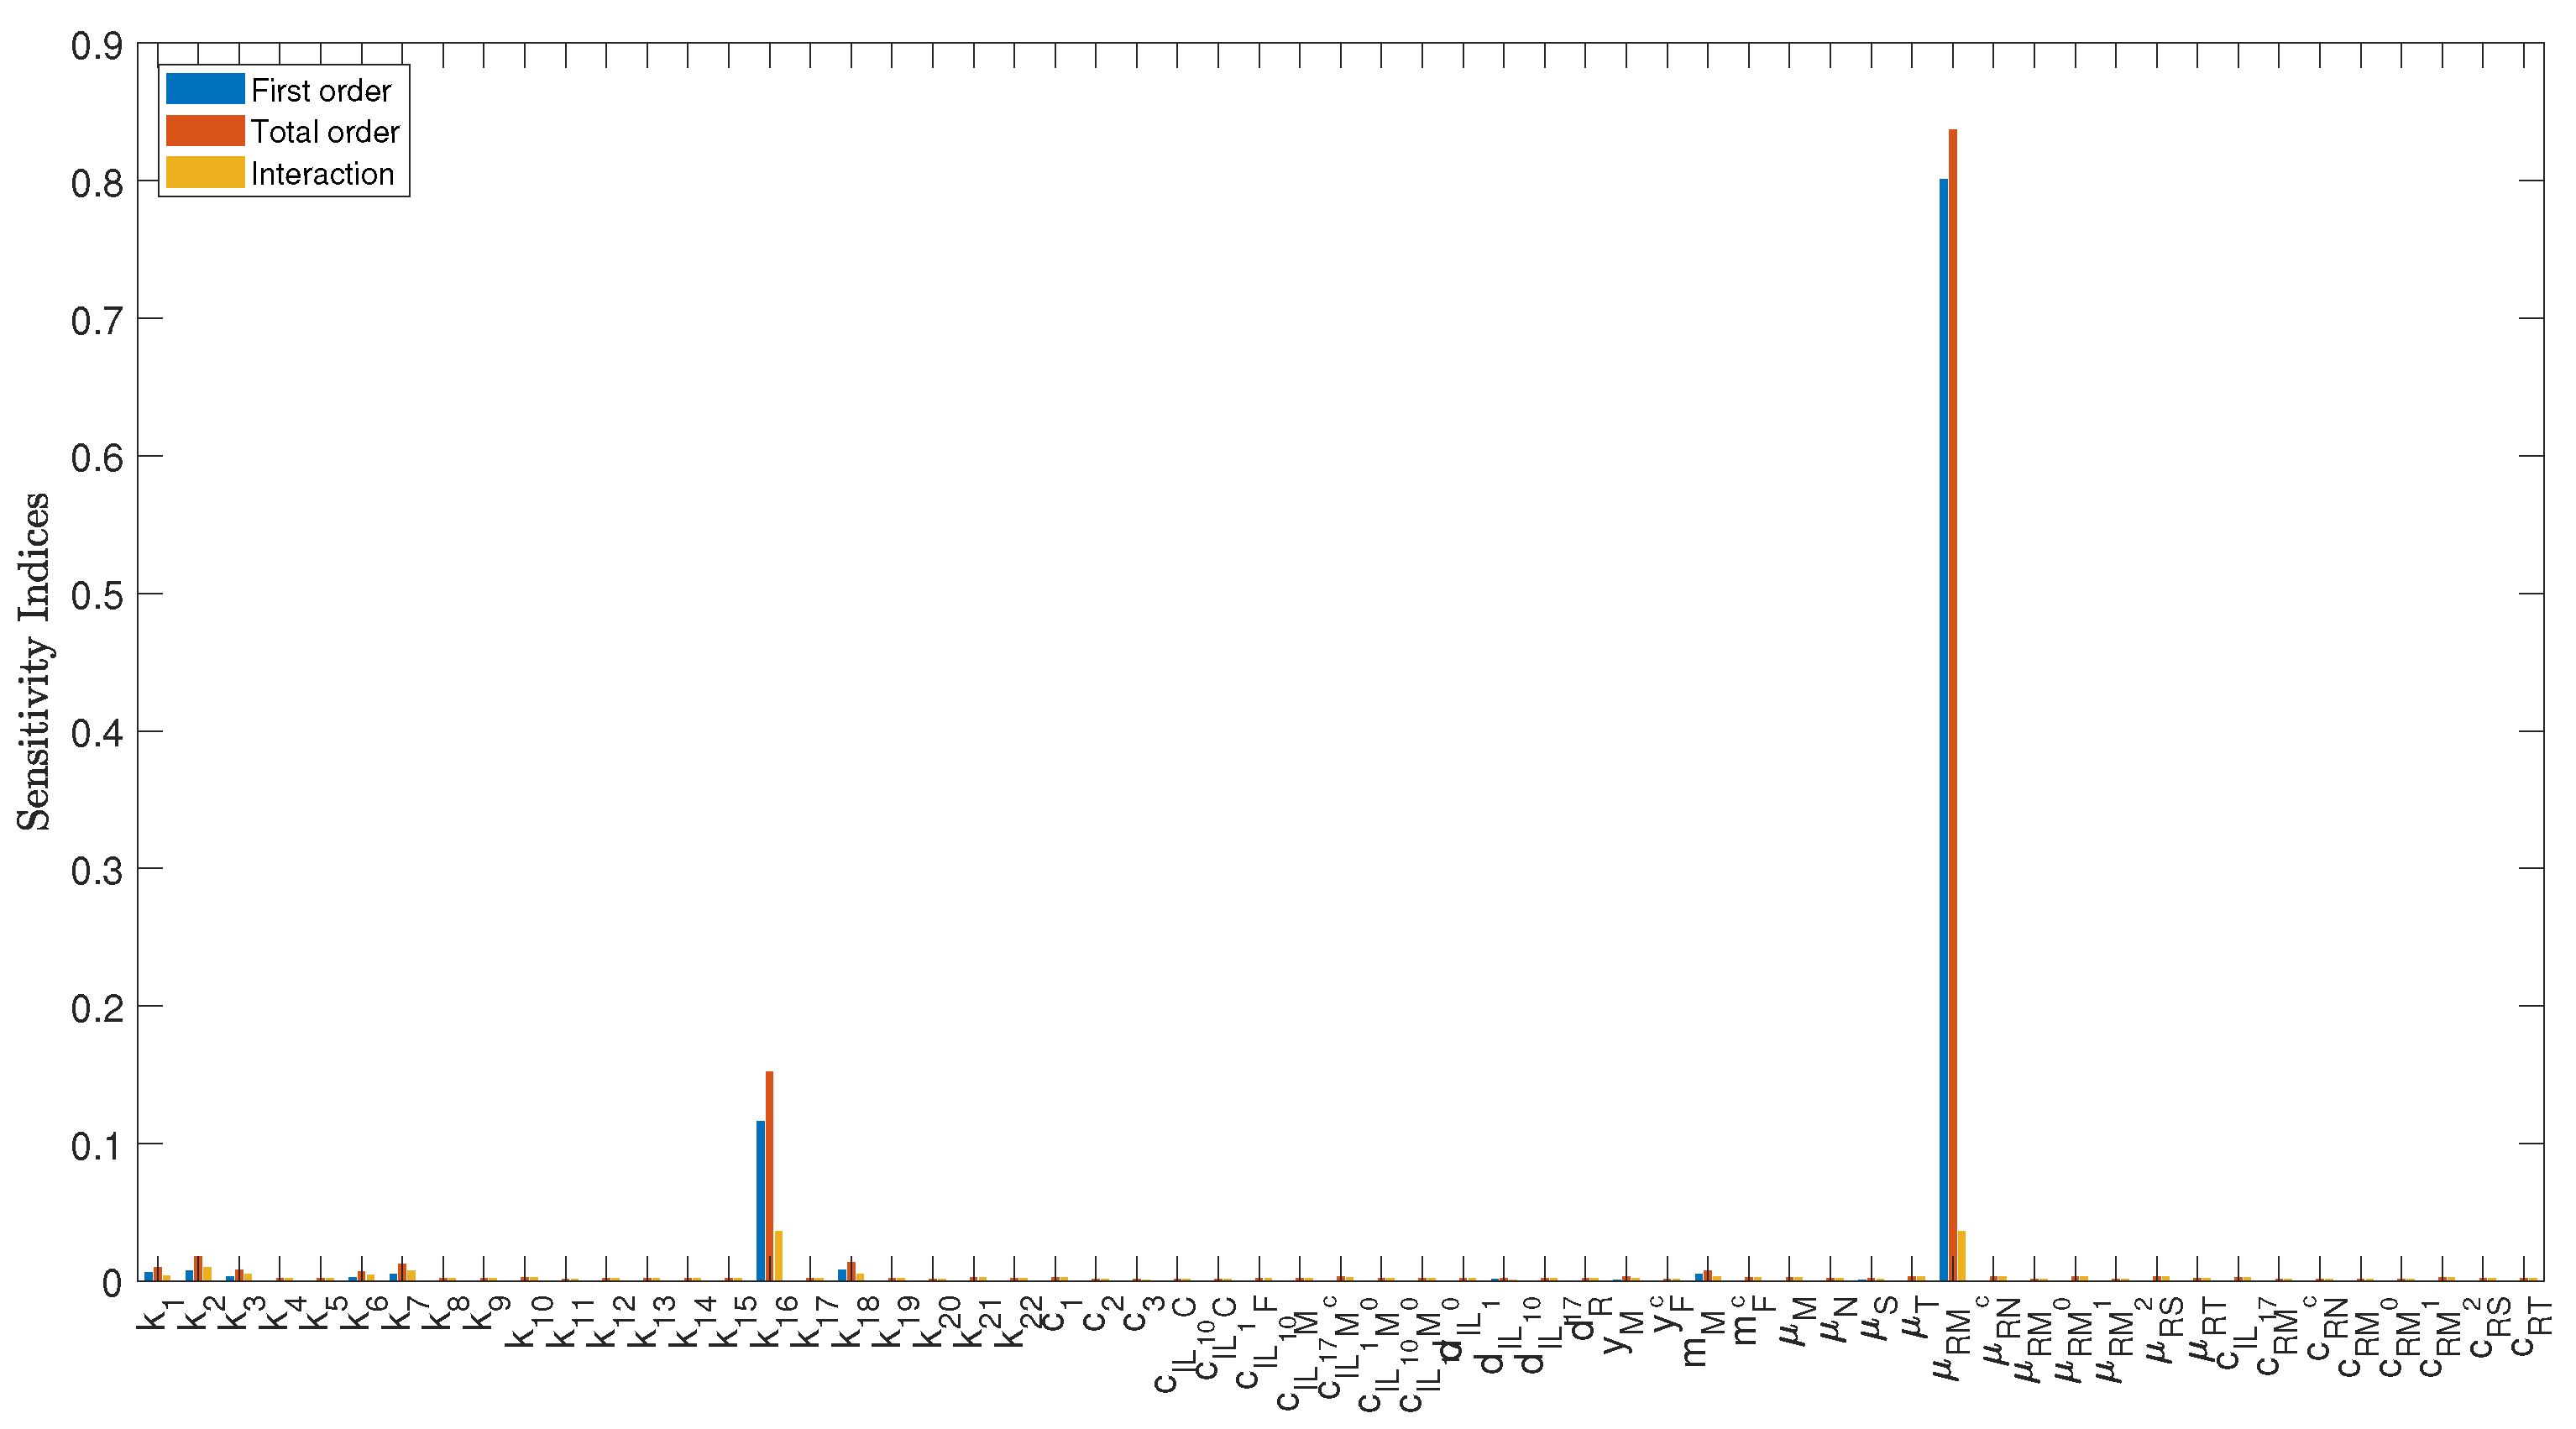
3.1. Sensitivity Analysis
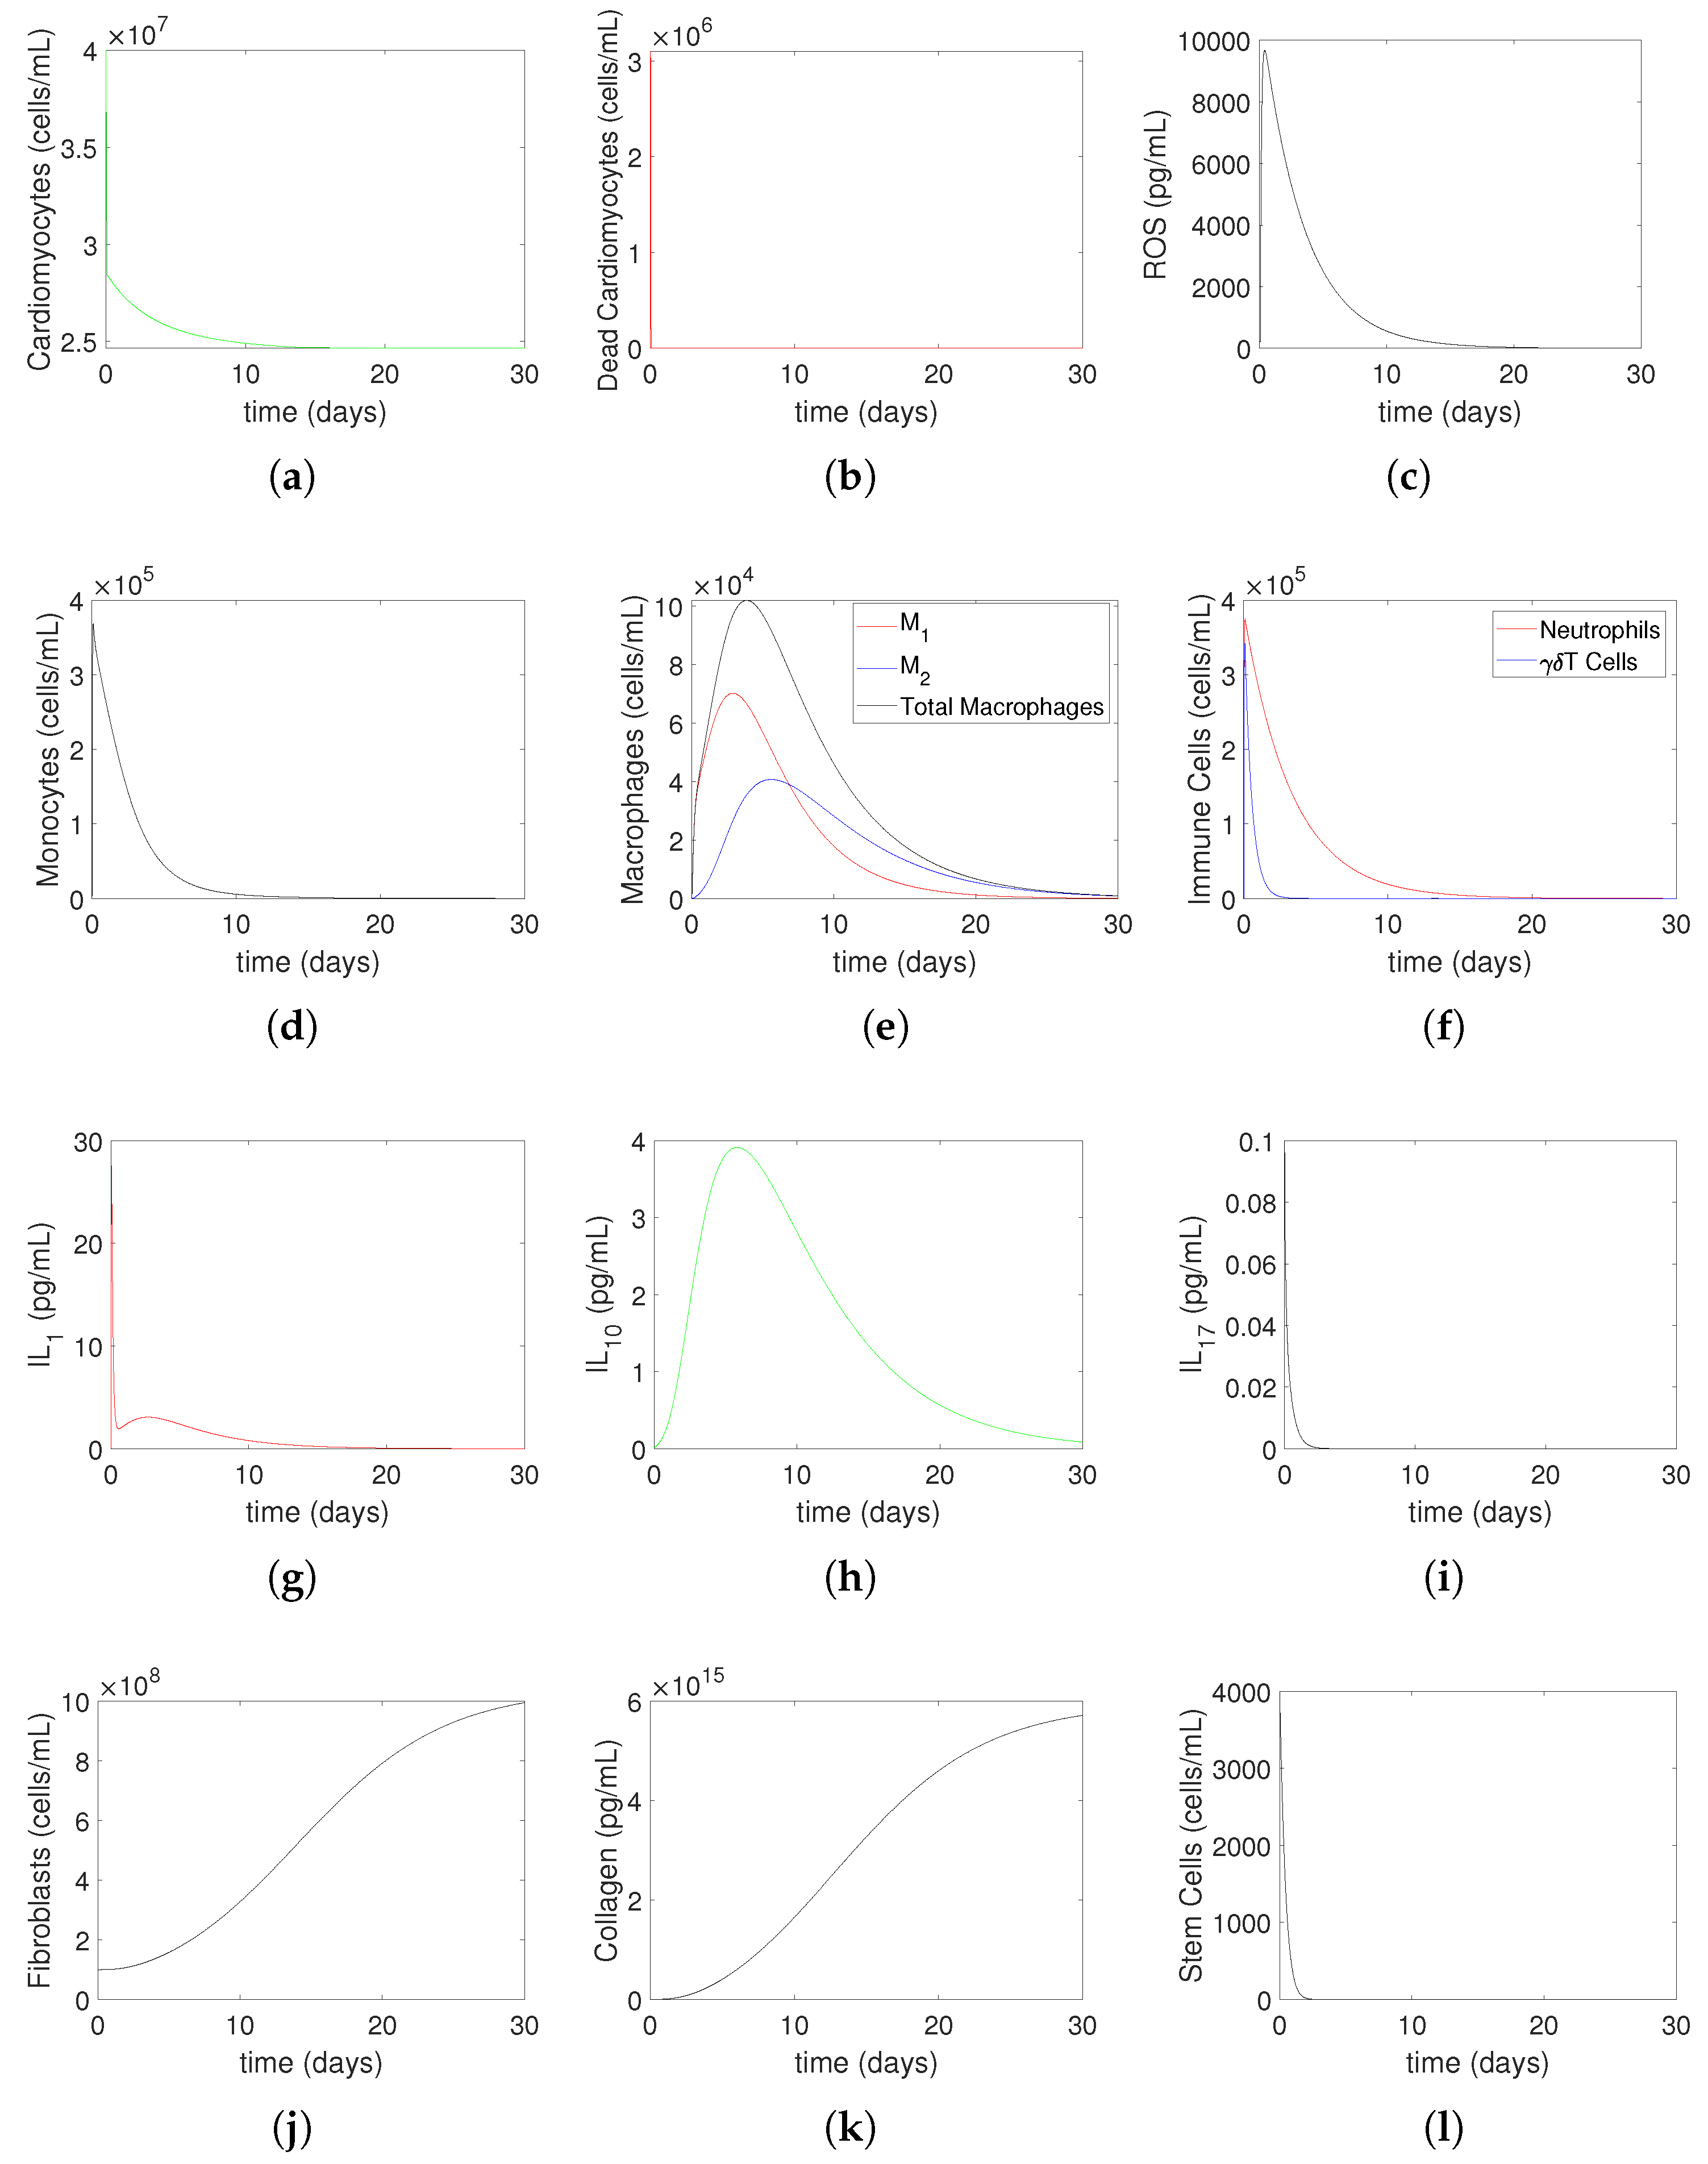
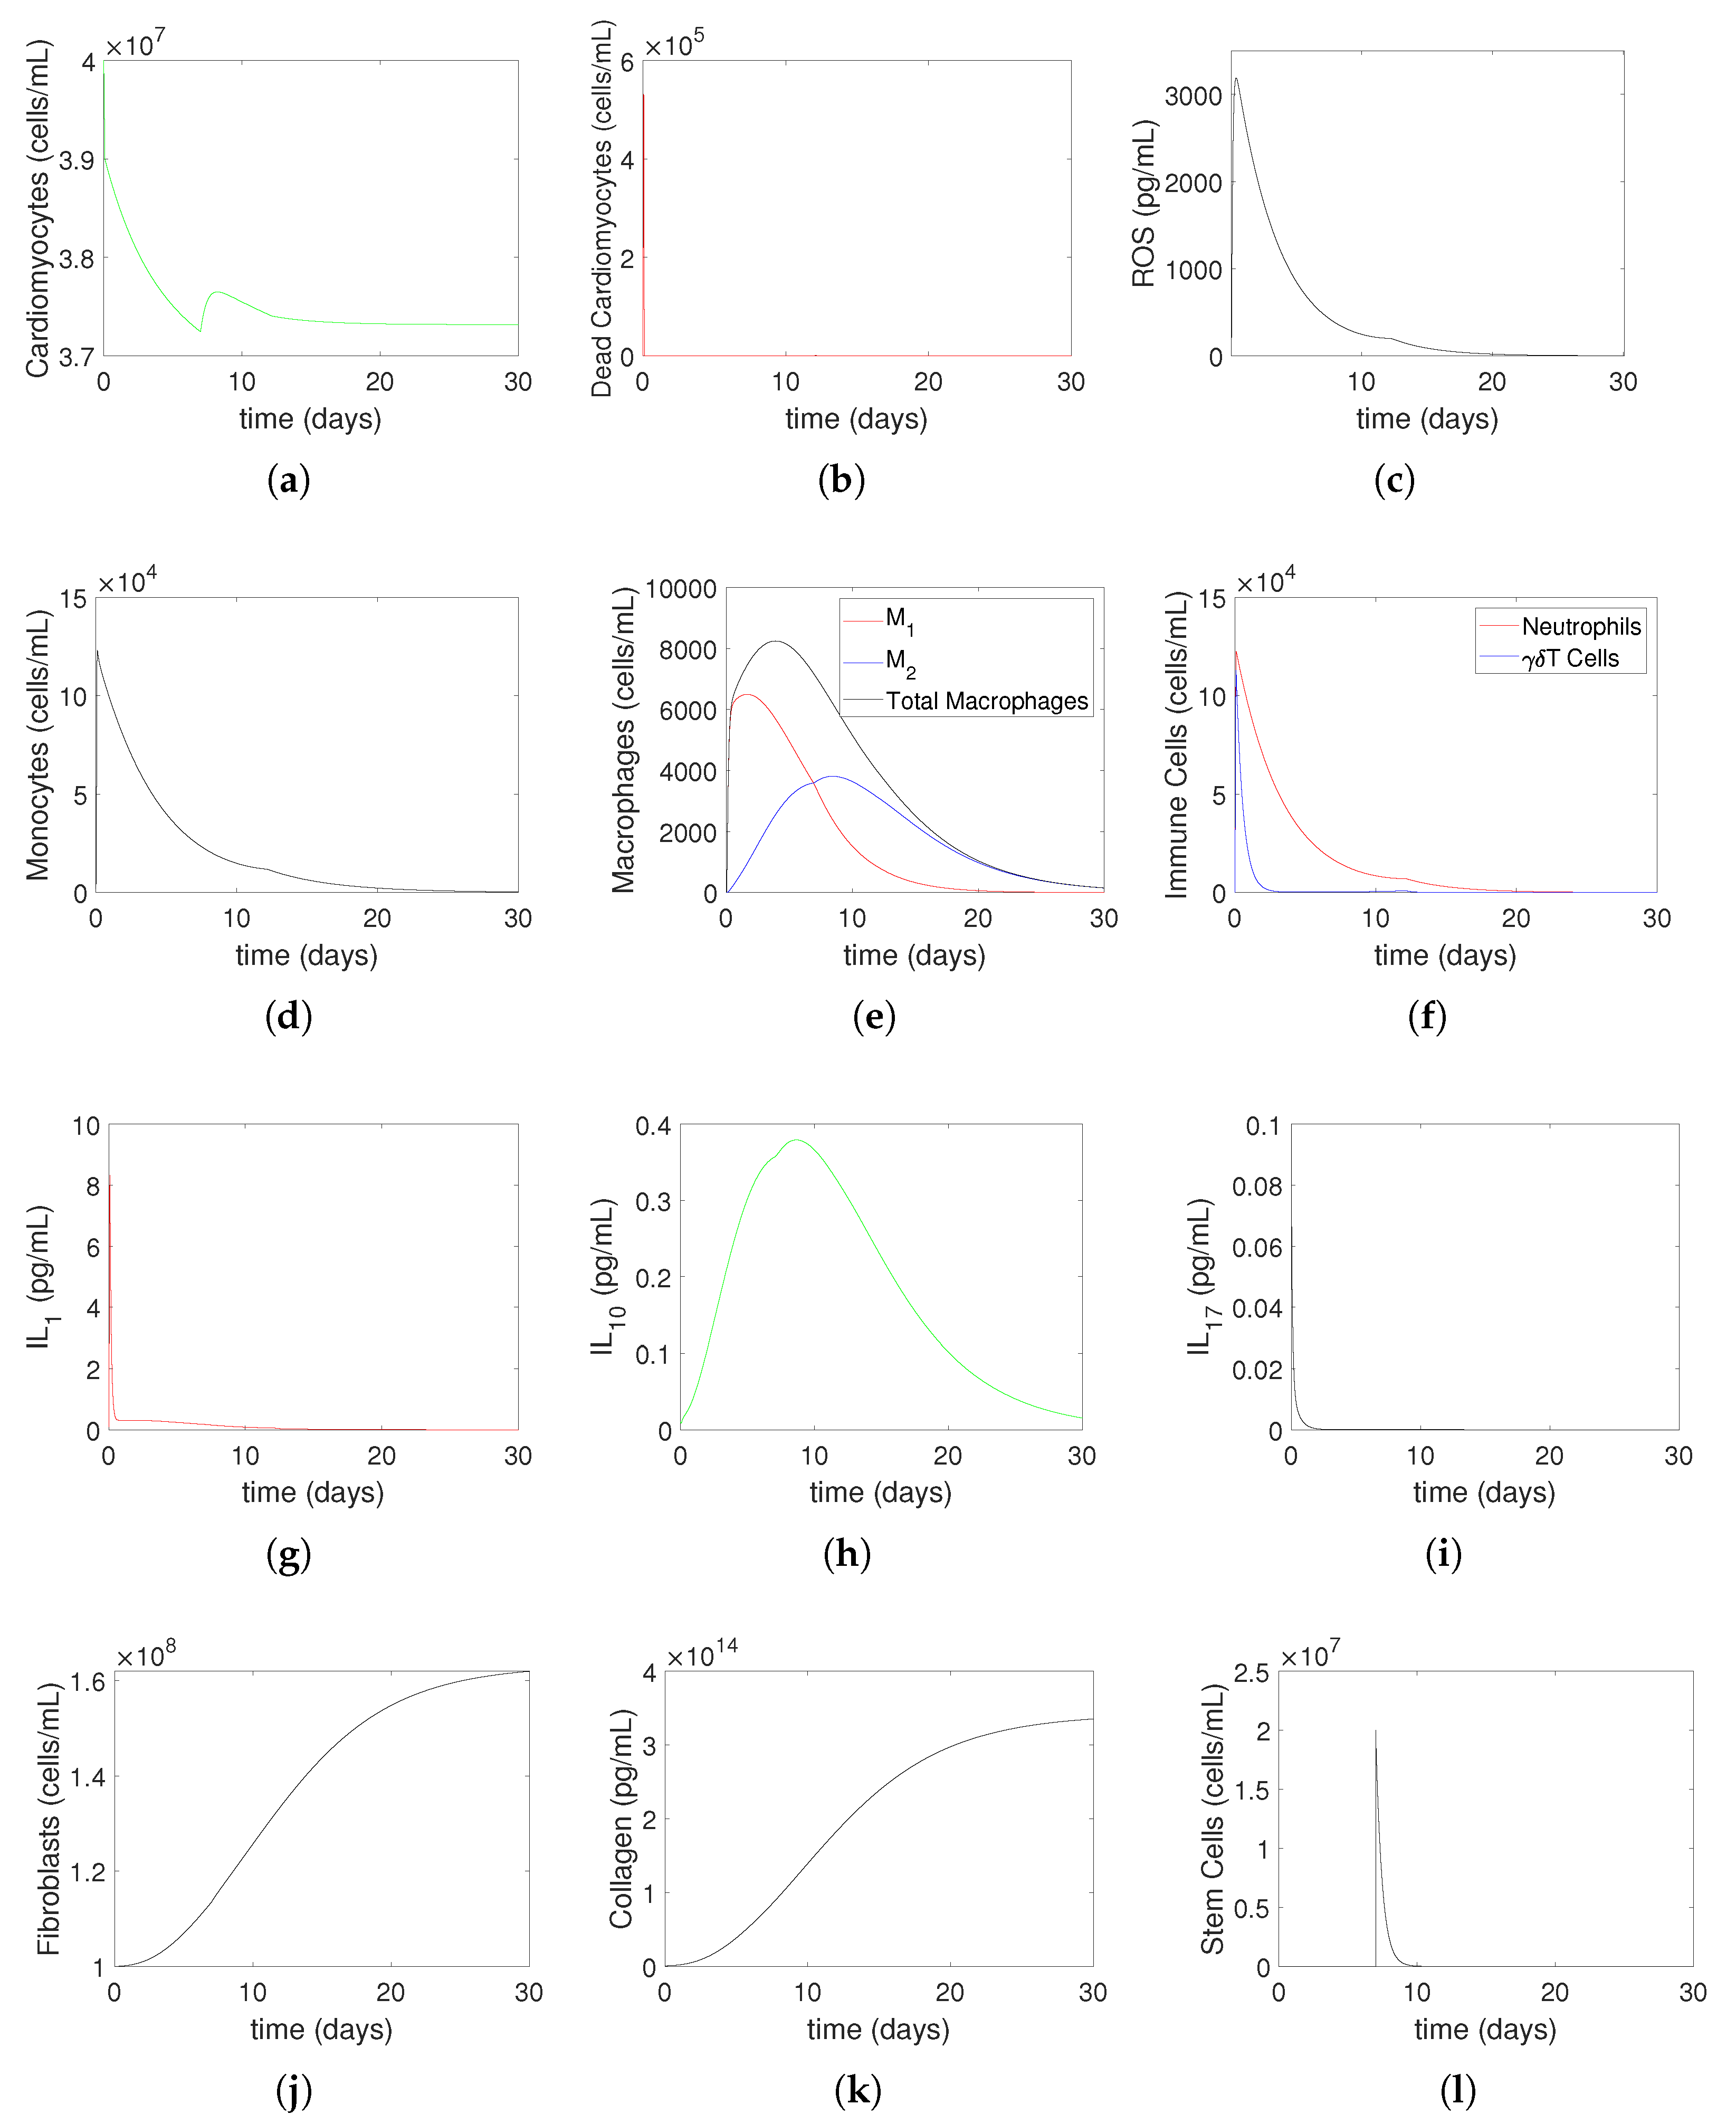
3.2. Numerical Simulations
4. Discussion
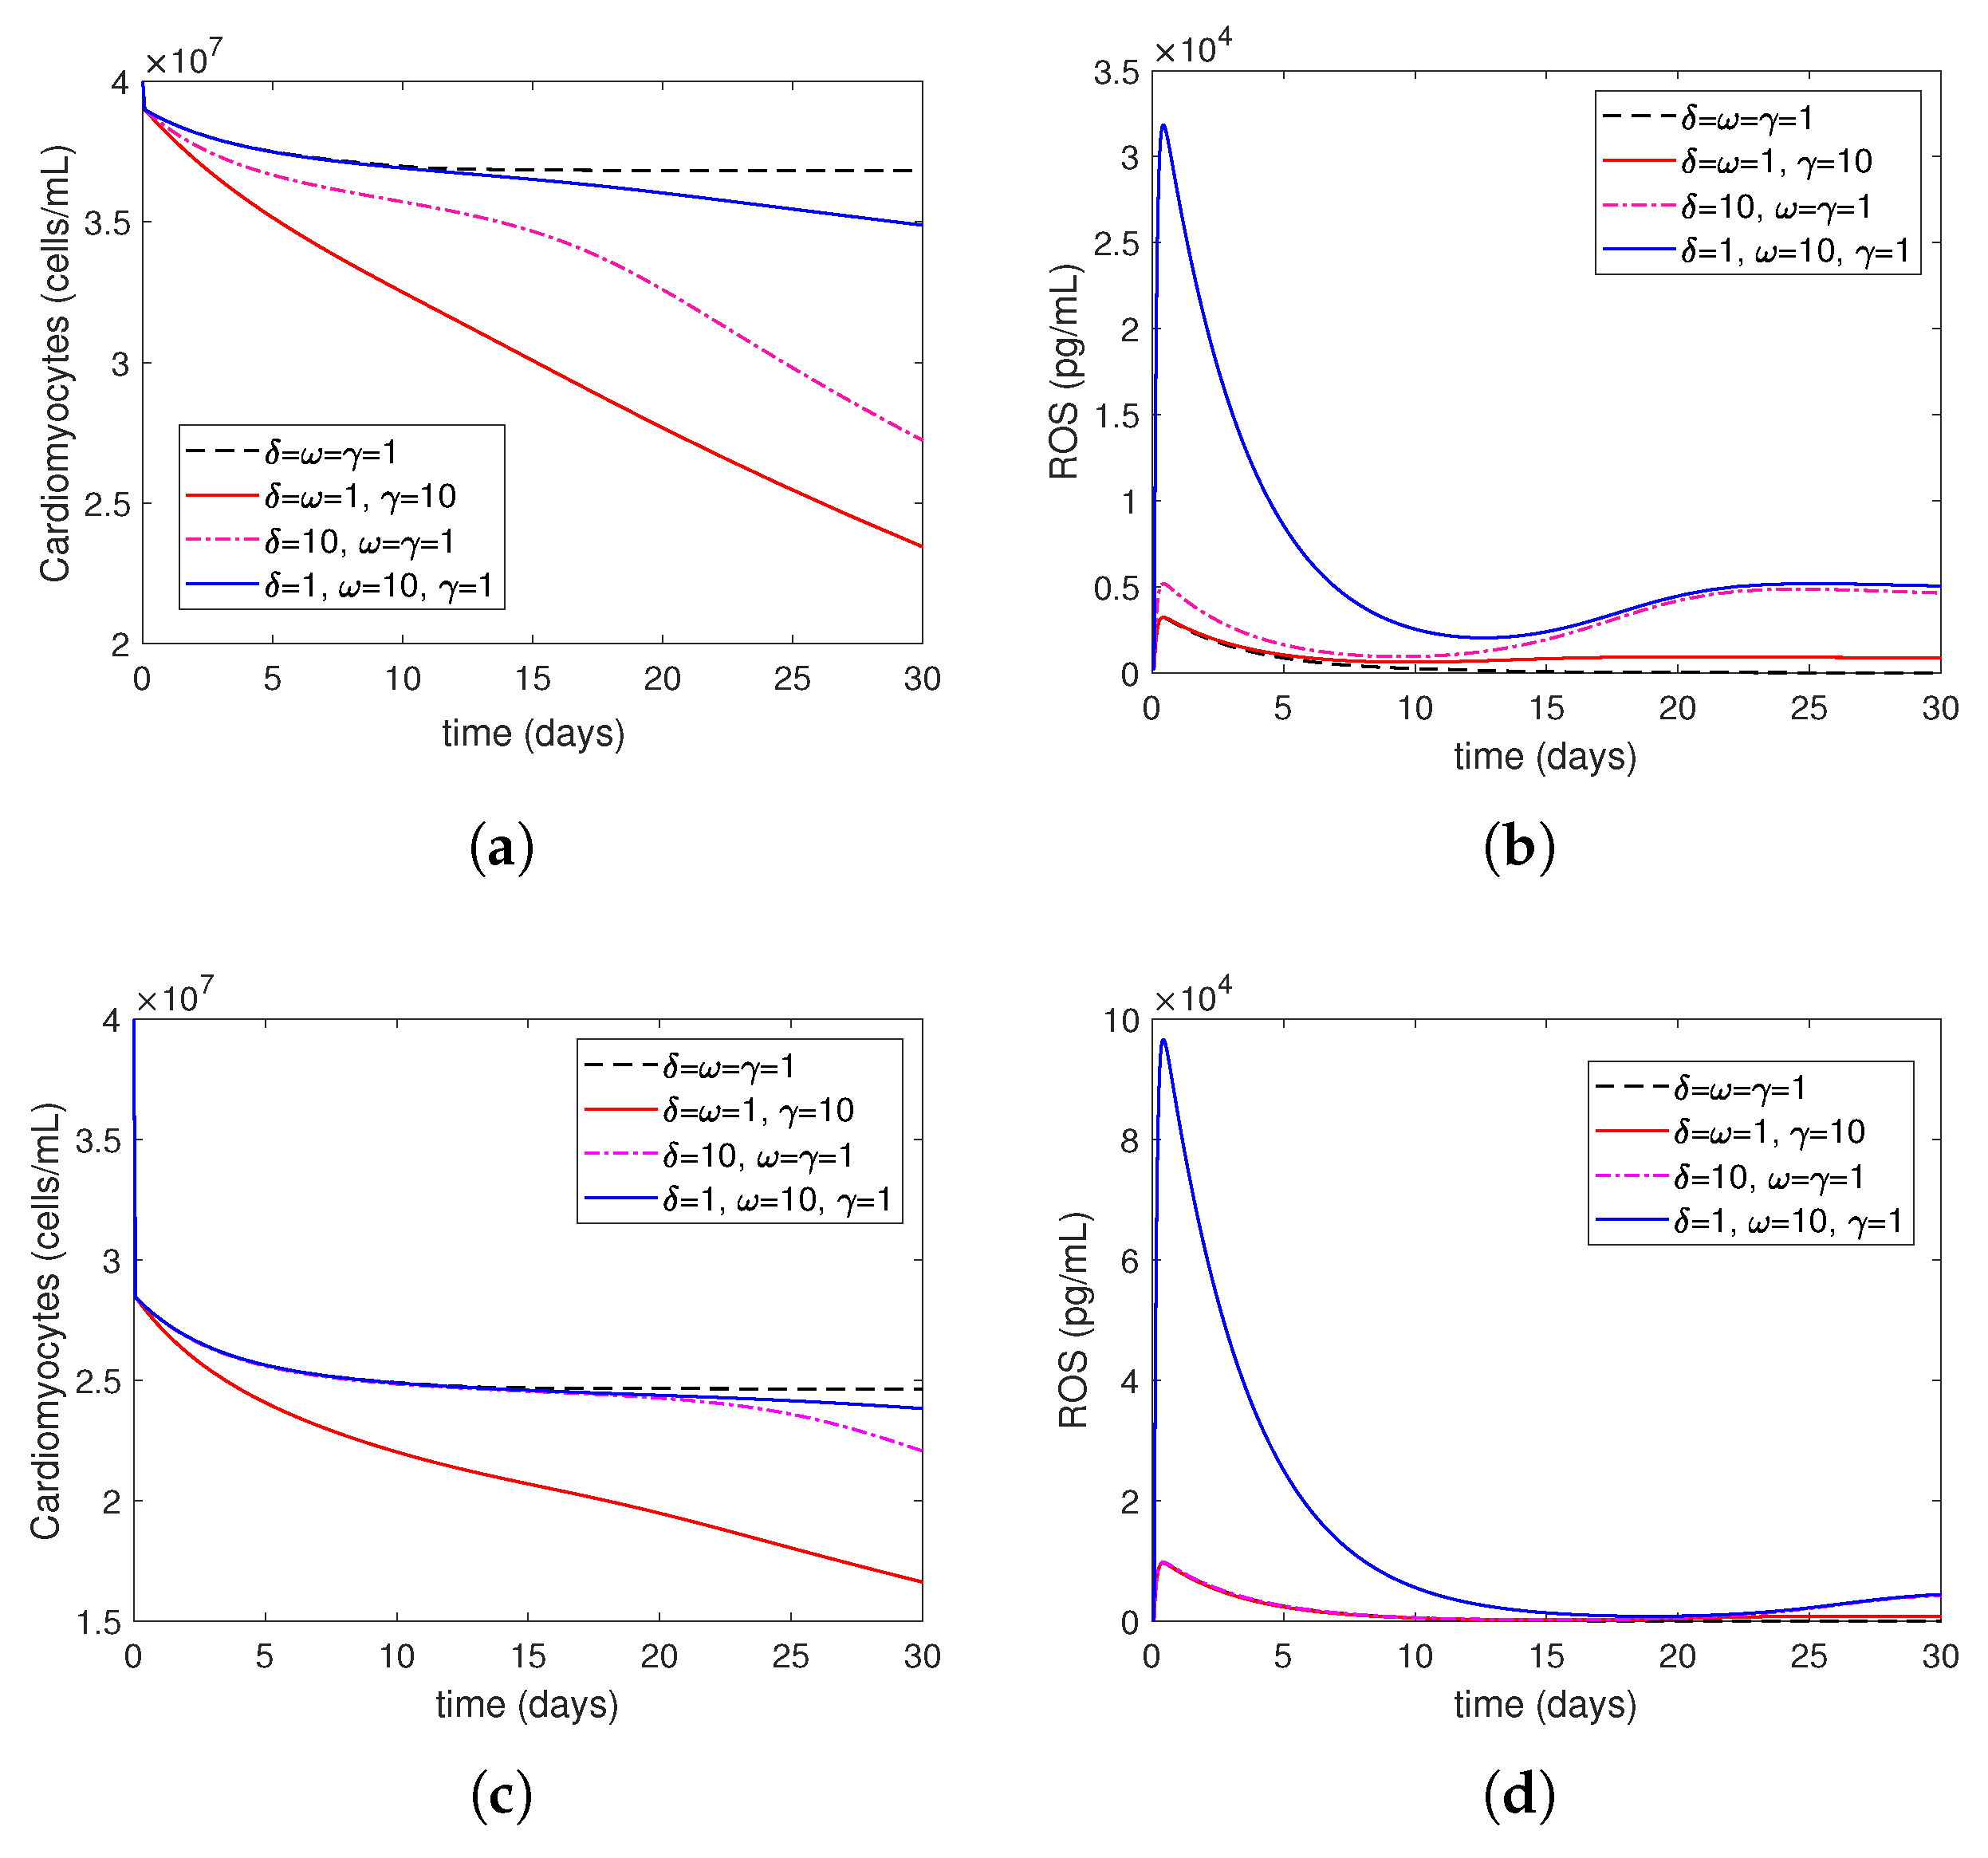
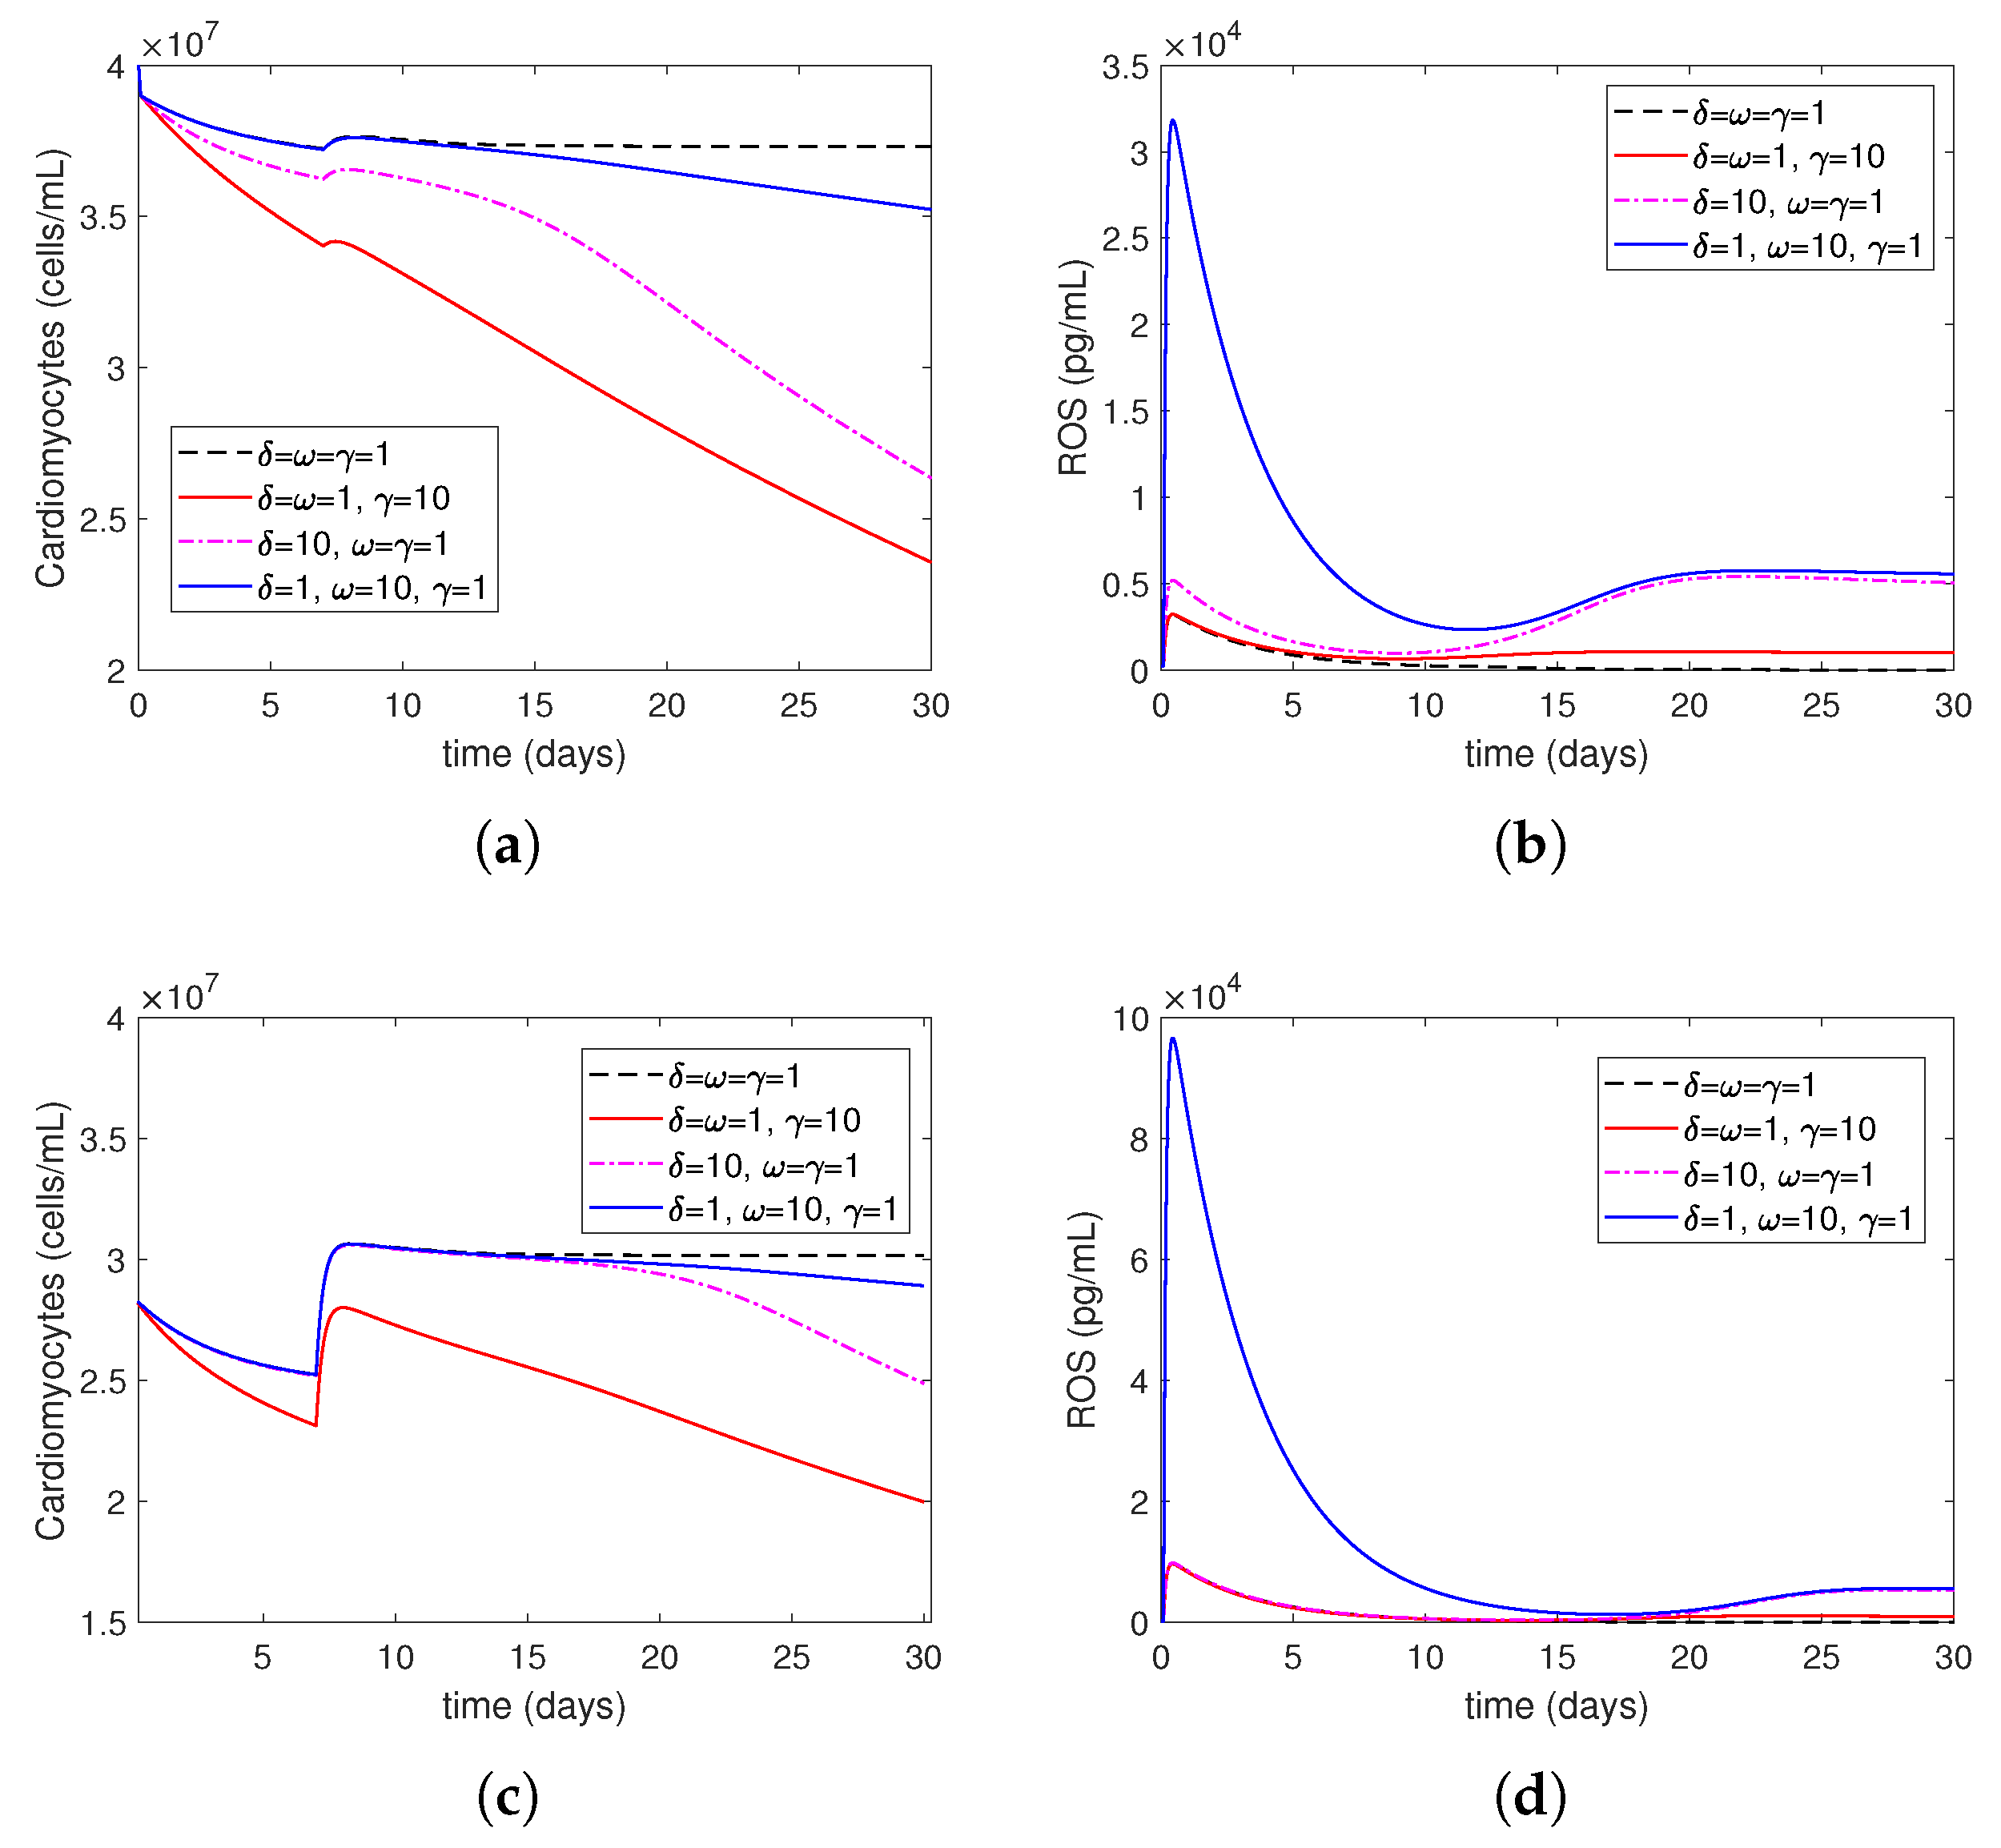
- Increasing represents the surge in the level of oxygen restoration, which leads to worsened tissue damage due to elevated ROS levels. As explained by in Equation (27) in this article, ROS production by neutrophils increases due to an increase in circulating oxygen levels during treatment (i.e., above the minimum required level). This is consistent with reports in the scientific literature that an increased production of reactive oxygen species (ROSs) is one of the mechanisms responsible for mediating IR injury during reperfusion [2].
- Increasing represents increased ROS damage in response to heightened patient risk factors. Following Model (14)–(27), the parameter quantifies the influence of risk factors (such as smoking, drinking, stress, and bad food) on the levels of cellular ROS damage. According to the scientific literature, smoking, abdominal obesity, and hypertension are the primary variables that cause most cases of myocardial infarctions [37]. Another study that investigated mortality in the reperfusion era of acute myocardial infarction found that age had the greatest impact, and other significant factors, although less influential, included previous myocardial infarction, height, duration of treatment, diabetes, weight, smoking status, and stress [38].
- Increasing represents the higher level of neutrophil recruitment due to differences in the immune system. A higher value results in an overactive immune response, which consequently enhances neutrophil infiltration and tissue damage. This is shown in Equation (19), which considers variations in the extent of neutrophil recruitment to the location of myocardial infarction (MI) damage caused by an excessively active or insufficiently active immune system (as seen in persons with autoimmune disorders or receiving cancer therapy). The observed alterations in neutrophil levels correspond to the findings reported in the current literature. Neutrophils are recognized as one of the initial cells to arrive at infection locations [17,39]. When activated, these neutrophils secrete elastase and matrix metalloproteinases (MMPs), which help attract inflammatory cells to injured tissue and assist in removing dead cardiomyocytes. Simultaneously, deceased heart muscle cells stimulate the activation of cells and the secretion of cytokines such –10 and –17 [11,40]. Specifically, –17A enhances the invasion of neutrophils and causes the death of cardiomyocytes during ischemia/reperfusion damage [41,42]. During the process of migration and phagocytosis, neutrophils produce reactive oxygen species (ROSs), which can worsen tissue damage and inflammation [43].
5. Conclusions
Author Contributions
Funding
Institutional Review Board Statement
Informed Consent Statement
Data Availability Statement
Conflicts of Interest
References
- Brown, J.C.; Gerhardt, T.E.; Kwon, E. Risk Factors for Coronary Artery Disease; StatPearls: Treasure Island, FL, USA, 2020. [Google Scholar]
- Cadenas, S. ROS and redox signaling in myocardial ischemia-reperfusion injury and cardioprotection. Free Radic. Biol. Med. 2018, 117, 76–89. [Google Scholar] [CrossRef] [PubMed]
- Byrne, R.A.; Rossello, X.; Coughlan, J.; Barbato, E.; Berry, C.; Chieffo, A.; Claeys, M.J.; Dan, G.A.; Dweck, M.R.; Galbraith, M.; et al. 2023 ESC guidelines for the management of acute coronary syndromes: Developed by the task force on the management of acute coronary syndromes of the European Society of Cardiology (ESC). Eur. Heart J. Acute Cardiovasc. Care 2024, 13, 55–161. [Google Scholar] [CrossRef] [PubMed]
- Burdick, J.A.; Vunjak-Novakovic, G. Engineered microenvironments for controlled stem cell differentiation. Tissue Eng. Part A 2009, 15, 205–219. [Google Scholar] [CrossRef]
- Li, J.; Hu, S.; Zhu, D.; Huang, K.; Mei, X.; López de Juan Abad, B.; Cheng, K. All roads lead to Rome (the heart): Cell retention and outcomes from various delivery routes of cell therapy products to the heart. J. Am. Heart Assoc. 2021, 10, e020402. [Google Scholar] [CrossRef] [PubMed]
- Jin, Y.F.; Han, H.C.; Berger, J.; Dai, Q.; Lindsey, M.L. Combining experimental and mathematical modeling to reveal mechanisms of macrophage-dependent left ventricular remodeling. BMC Syst. Biol. 2011, 5, 60. [Google Scholar] [CrossRef]
- Wang, Y.; Yang, T.; Ma, Y.; Halade, G.V.; Zhang, J.; Lindsey, M.L.; Jin, Y.F. Mathematical modeling and stability analysis of macrophage activation in left ventricular remodeling post-myocardial infarction. BMC Genom. 2012, 13, S21. [Google Scholar] [CrossRef]
- Voropaeva, O.; Tsgoev, C.A. A numerical model of inflammation dynamics in the core of myocardial infarction. J. Appl. Ind. Math. 2019, 13, 372–383. [Google Scholar] [CrossRef]
- Lafci Büyükkahraman, M.; Sabine, G.K.; Kojouharov, H.V.; Chen-Charpentier, B.M.; McMahan, S.R.; Liao, J. Using models to advance medicine: Mathematical modeling of post-myocardial infarction left ventricular remodeling. Comput. Methods Biomech. Biomed. Eng. 2022, 25, 298–307. [Google Scholar] [CrossRef]
- Büyükkahraman, M.L.; Chen-Charpentier, B.M.; Liao, J.; Kojouharov, H.V. Mathematical modeling of stem cell therapy for left ventricular remodeling after myocardial infarction. J. Mech. Med. Biol. 2023, 23, 2340015. [Google Scholar] [CrossRef]
- Luo, W.; Bian, X.; Liu, X.; Zhang, W.; Xie, Q.; Feng, L. A new method for the treatment of myocardial ischemia-reperfusion injury based on γδT cell-mediated immune response. Front. Cardiovasc. Med. 2023, 10, 1219316. [Google Scholar] [CrossRef] [PubMed]
- Sun, C.K. Editorial: [Application of stem cells in the treatment of myocardial infarction]. Front. Cardiovasc. Med. 2023, 10, 1333732. [Google Scholar] [CrossRef]
- Chen-Charpentier, B.; Kojouharov, H. Mathematical Modeling of Myocardial Infarction. Model. Eng. Hum. Behav. 2019, 46, 46–50. [Google Scholar]
- Chalise, U.; Becirovic-Agic, M.; Lindsey, M.L. The cardiac wound healing response to myocardial infarction. WIREs Mech. Dis. 2023, 15, e1584. [Google Scholar] [CrossRef] [PubMed]
- Lambert, J.M.; Lopez, E.F.; Lindsey, M.L. Macrophage roles following myocardial infarction. Int. J. Cardiol. 2008, 130, 147–158. [Google Scholar] [CrossRef] [PubMed]
- Davis, B.H.; Morimoto, Y.; Sample, C.; Olbrich, K.; Leddy, H.A.; Guilak, F.; Taylor, D.A. Effects of myocardial infarction on the distribution and transport of nutrients and oxygen in porcine myocardium. J. Biomech. Eng. 2012, 134, 101005. [Google Scholar] [CrossRef] [PubMed]
- Jin, Y.; Lindsey, M.L. Multi-scale modeling and analysis of left ventricular remodeling post myocardial infarction: Integration of experimental and computational approaches. In Application of Machine Learning; InTech: London, UK, 2010; pp. 267–280. [Google Scholar]
- Talman, V.; Ruskoaho, H. Cardiac fibrosis in myocardial infarction—From repair and remodeling to regeneration. Cell Tissue Res. 2016, 365, 563–581. [Google Scholar] [CrossRef] [PubMed]
- Cleutjens, J.P.M.; Blankesteijn, W.M.; Daemen, M.J.A.P.; Smits, J.F.M. The infarcted myocardium: Simply dead tissue, or a lively target for therapeutic interventions. Cardiovasc. Res. 1999, 44, 232–241. [Google Scholar] [CrossRef]
- Frangogiannis, N.G. Interleukin-1 in cardiac injury, repair, and remodeling: Pathophysiologic and translational concepts. Discoveries 2015, 3, e41. [Google Scholar] [CrossRef]
- Nahrendorf, M.; Swirski, F.K.; Aikawa, E.; Stangenberg, L.; Wurdinger, T.; Figueiredo, J.L.; Libby, P.; Weissleder, R.; Pittet, M.J. The healing myocardium sequentially mobilizes two monocyte subsets with divergent and complementary functions. J. Exp. Med. 2007, 204, 3037–3047. [Google Scholar] [CrossRef]
- Yang, F.; Liu, Y.H.; Yang, X.P.; Xu, J.; Kapke, A.; Carretero, O.A. Myocardial infarction and cardiac remodelling in mice. Exp. Physiol. 2002, 87, 547–555. [Google Scholar] [CrossRef]
- Camelliti, P.; Borg, T.K.; Kohl, P. Structural and functional characterisation of cardiac fibroblasts. Cardiovasc. Res. 2005, 65, 40–51. [Google Scholar] [CrossRef]
- Steinfeld, J.I.; Francisco, J.S.; Hase, W.L. Chemical Kinetics and Dynamics; Prentice Hall: Upper Saddle River, NJ, USA, 1999. [Google Scholar]
- Goldbeter, A. Biochemical oscillations and cellular rhythms. In Biochemical Oscillations and Cellular Rhythms; Cambridge University Press: Cambridge, UK, 1997. [Google Scholar]
- Edelstein-Keshet, L. Mathematical Models in Biology; SIAM: Philadelphia, PA, USA, 2005. [Google Scholar]
- Sumner, T.; Shephard, E.; Bogle, I. A methodology for global-sensitivity analysis of time-dependent outputs in systems biology modelling. J. R. Soc. Interface 2012, 9, 2156–2166. [Google Scholar] [CrossRef] [PubMed]
- Marino, S.; Hogue, I.B.; Ray, C.J.; Kirschner, D.E. A methodology for performing global uncertainty and sensitivity analysis in systems biology. J. Theor. Biol. 2008, 254, 178–196. [Google Scholar] [CrossRef]
- Wang, Y.; Jin, Y.; Ma, Y.; Halade, G.V.; Linsey, M.L. Mathematical modeling of macrophage activation in left ventricular remodeling post-myocardial infarction. In Proceedings of the 2011 IEEE International Workshop on Genomic Signal Processing and Statistics (GENSIPS), San Antonio, TX, USA, 4–6 December 2011; IEEE: Piscataway, NJ, USA, 2011; pp. 202–205. [Google Scholar]
- Dunster, J.L.; Byrne, H.M.; King, J.R. The resolution of inflammation: A mathematical model of neutrophil and macrophage interactions. Bull. Math. Biol. 2014, 76, 1953–1980. [Google Scholar] [CrossRef]
- Olivetti, G.; Cigola, E.; Maestri, R.; Corradi, D.; Lagrasta, C.; Gambert, S.R.; Anversa, P. Aging, cardiac hypertrophy and ischemic cardiomyopathy do not affect the proportion of mononucleated and multinucleated myocytes in the human heart. J. Mol. Cell. Cardiol. 1996, 28, 1463–1477. [Google Scholar] [CrossRef] [PubMed]
- Huang, P.; Wang, L.; Li, Q.; Xu, J.; Xu, J.; Xiong, Y.; Chen, G.; Qian, H.; Jin, C.; Yu, Y.; et al. Combinatorial treatment of acute myocardial infarction using stem cells and their derived exosomes resulted in improved heart performance. Stem Cell Res. Ther. 2019, 10, 300. [Google Scholar] [CrossRef]
- Laflamme, M.A.; Murry, C.E. Heart regeneration. Nature 2011, 473, 326. [Google Scholar] [CrossRef]
- Deten, A.; Volz, H.C.; Briest, W.; Zimmer, H.G. Cardiac cytokine expression is upregulated in the acute phase after myocardial infarction. Experimental studies in rats. Cardiovasc. Res. 2002, 55, 329–340. [Google Scholar] [CrossRef] [PubMed]
- Jiang, C.Y.; Gui, C.; He, A.N.; Hu, X.Y.; Chen, J.; Jiang, Y.; Wang, J.A. Optimal time for mesenchymal stem cell transplantation in rats with myocardial infarction. J. Zhejiang Univ. Sci. B 2008, 9, 630–637. [Google Scholar] [CrossRef] [PubMed]
- Jakubczyk, K.; Dec, K.; Kałduńska, J.; Kawczuga, D.; Kochman, J.; Janda, K. Reactive oxygen species-sources, functions, oxidative damage. Pol. Merkur. Lek. Organ Pol. Tow. Lek. 2020, 48, 124–127. [Google Scholar]
- Ojha, N.; Dhamoon, A.S.; Chapagain, R. Myocardial Infarction (Nursing); StatPearls: Treasure Island, FL, USA, 2021. [Google Scholar]
- Lee, K.L.; Woodlief, L.H.; Topol, E.J.; Weaver, W.D.; Betriu, A.; Col, J.; Simoons, M.; Aylward, P.; Van de Werf, F.; Califf, R.M. Predictors of 30-day mortality in the era of reperfusion for acute myocardial infarction: Results from an international trial of 41,021 patients. Circulation 1995, 91, 1659–1668. [Google Scholar] [CrossRef]
- Ma, Y. Role of neutrophils in cardiac injury and repair following myocardial infarction. Cells 2021, 10, 1676. [Google Scholar] [CrossRef] [PubMed]
- Hofmann, U.; Frantz, S. Role of T-cells in myocardial infarction. Eur. Heart J. 2016, 37, 873–879. [Google Scholar] [CrossRef] [PubMed]
- Huang, J.; Zhang, W.; Zhang, C.l.; Wang, L. Interleukin-17 aggravates right ventricular remodeling via activating STAT3 under both normoxia and hypoxia. BMC Cardiovasc. Disord. 2021, 21, 249. [Google Scholar] [CrossRef] [PubMed]
- Liao, Y.H.; Xia, N.; Zhou, S.F.; Tang, T.T.; Yan, X.X.; Lv, B.J.; Nie, S.F.; Wang, J.; Iwakura, Y.; Xiao, H.; et al. Interleukin-17A contributes to myocardial ischemia/reperfusion injury by regulating cardiomyocyte apoptosis and neutrophil infiltration. J. Am. Coll. Cardiol. 2012, 59, 420–429. [Google Scholar] [CrossRef]
- Saparov, A.; Ogay, V.; Nurgozhin, T.; Chen, W.C.; Mansurov, N.; Issabekova, A.; Zhakupova, J. Role of the immune system in cardiac tissue damage and repair following myocardial infarction. Inflamm. Res. 2017, 66, 739–751. [Google Scholar] [CrossRef]
- Canton, L.; Suma, N.; Amicone, S.; Impellizzeri, A.; Bodega, F.; Marinelli, V.; Ciarlantini, M.; Casuso, M.; Bavuso, L.; Belà, R.; et al. Clinical impact of multimodality assessment of myocardial viability. Echocardiography 2024, 41, e15854. [Google Scholar] [CrossRef] [PubMed]


| Parameter | Description | Range | Value | Units | Ref |
|---|---|---|---|---|---|
| Production rate of ROSs | pg/cells/day | ES * | |||
| Rate at which are engulfed by | mL/cells/day | [10] | |||
| Secretion rate of by | pg/cells/day | [10] | |||
| Secretion rate of by | pg/cells/day | [7] | |||
| Secretion rate of by | pg/cells/day | [7] | |||
| Recruitment rate of based on | 4 | 1/day | [10] | ||
| activation rate for | 1/day | [10] | |||
| activation rate for | 1/day | [7] | |||
| Activation rate of to | 1/day | [7] | |||
| Production rate of C by F | pg/cells/day | [6] | |||
| Degradation rate of C by | 1/day | [6] | |||
| Fibroblast growth rate | 1/day | [6] | |||
| Recruitment rate of T based on | 4 | 1/day | ES * | ||
| Apoptotic rate of S due to | mL/cells/day | [10] | |||
| Destruction rate of by | 1/day | ES * | |||
| Destruction rate of by N | mL/cells/day | ES * | |||
| Rate at which are engulfed by N | mL/cells/day | ES * | |||
| Recruitment rate of N based on | 4 | 1/day | ES * | ||
| Recruitment rate of N based on | 1 | cells/mL/day | ES * | ||
| Activation rate of to activate | 1/day | ES * | |||
| Secretion rate of by | pg/cells/day | ES * | |||
| Secretion rate of by | pg/cells/day | ES * | |||
| Effectiveness of inhibition on | 25 | pg/mL | [7] | ||
| Effectiveness of inhibition on | 100 | pg/mL | [7] | ||
| Effectiveness of inhibition on | 100 | pg/mL | ES * | ||
| Effectiveness of inhibition on F | 5 | pg/mL | [10] | ||
| Effectiveness of promotion on C | 10 | pg/mL | [10] | ||
| Effectiveness of promotion on F | pg/mL | [10] | |||
| Effectiveness of promotion on | 10 | pg/mL | ES * | ||
| Effectiveness of promotion on | 10 | pg/mL | [7] | ||
| Effectiveness of promotion on | 5 | pg/mL | [7] | ||
| Effectiveness of promotion on | 10 | pg/mL | ES* | ||
| Decay rate of | 1/day | [7] | |||
| Decay rate of | 5 | 1/day | [29] | ||
| Decay rate of | 1/day | ES * | |||
| Decay rate of R | 1/day | ES * | |||
| Differentiation rate of S to | 1/day | [10] | |||
| Differentiation rate of S to F | 1/day | [10] | |||
| Effectiveness of promotion on | 5 | pg/mL | [10] | ||
| Effectiveness of promotion on F | 5 | pg/mL | [10] | ||
| Death rate of | − | 1/day | [10] | ||
| , and emigration rates | 1/day | [7] | |||
| Rate of neutrophil apoptosis | 1/day | [30] | |||
| Washout rate of S | 2 | 1/day | [10] | ||
| Death rate of | 2 | 1/day | ES * | ||
| ROS destruction rate of X, where | 1/day | ES * | |||
| Half-saturation constant | 100 | pg/mL | ES * | ||
| Half-saturation constant of X, where | 100 | pg/mL | ES * | ||
Disclaimer/Publisher’s Note: The statements, opinions and data contained in all publications are solely those of the individual author(s) and contributor(s) and not of MDPI and/or the editor(s). MDPI and/or the editor(s) disclaim responsibility for any injury to people or property resulting from any ideas, methods, instructions or products referred to in the content. |
© 2025 by the authors. Licensee MDPI, Basel, Switzerland. This article is an open access article distributed under the terms and conditions of the Creative Commons Attribution (CC BY) license (https://creativecommons.org/licenses/by/4.0/).
Share and Cite
Lafci Büyükkahraman, M.; Chen, H.; Chen-Charpentier, B.M.; Liao, J.; Kojouharov, H.V. A Mathematical Exploration of the Effects of Ischemia-Reperfusion Injury After a Myocardial Infarction. Bioengineering 2025, 12, 177. https://doi.org/10.3390/bioengineering12020177
Lafci Büyükkahraman M, Chen H, Chen-Charpentier BM, Liao J, Kojouharov HV. A Mathematical Exploration of the Effects of Ischemia-Reperfusion Injury After a Myocardial Infarction. Bioengineering. 2025; 12(2):177. https://doi.org/10.3390/bioengineering12020177
Chicago/Turabian StyleLafci Büyükkahraman, Mehtap, Houjia Chen, Benito M. Chen-Charpentier, Jun Liao, and Hristo V. Kojouharov. 2025. "A Mathematical Exploration of the Effects of Ischemia-Reperfusion Injury After a Myocardial Infarction" Bioengineering 12, no. 2: 177. https://doi.org/10.3390/bioengineering12020177
APA StyleLafci Büyükkahraman, M., Chen, H., Chen-Charpentier, B. M., Liao, J., & Kojouharov, H. V. (2025). A Mathematical Exploration of the Effects of Ischemia-Reperfusion Injury After a Myocardial Infarction. Bioengineering, 12(2), 177. https://doi.org/10.3390/bioengineering12020177