
The Effect of Patient-Related Factors on the Primary Fixation of PEEK and Titanium Tibial Components: A Population-Based FE Study

 , ,
, , 
Abstract
1. Introduction
2. Materials and Methods
2.1. CT Database
2.2. Workflow FE Model
2.2.1. Segmentation
2.2.2. Orientation of the Tibia and Implant Alignment
2.2.3. Bone Cuts
2.2.4. Volume Meshing
2.2.5. Bone Material Properties Assignment
2.2.6. Boundary Conditions, Loads, and Contact Interactions
2.3. Outcome Measures
2.4. Statistics
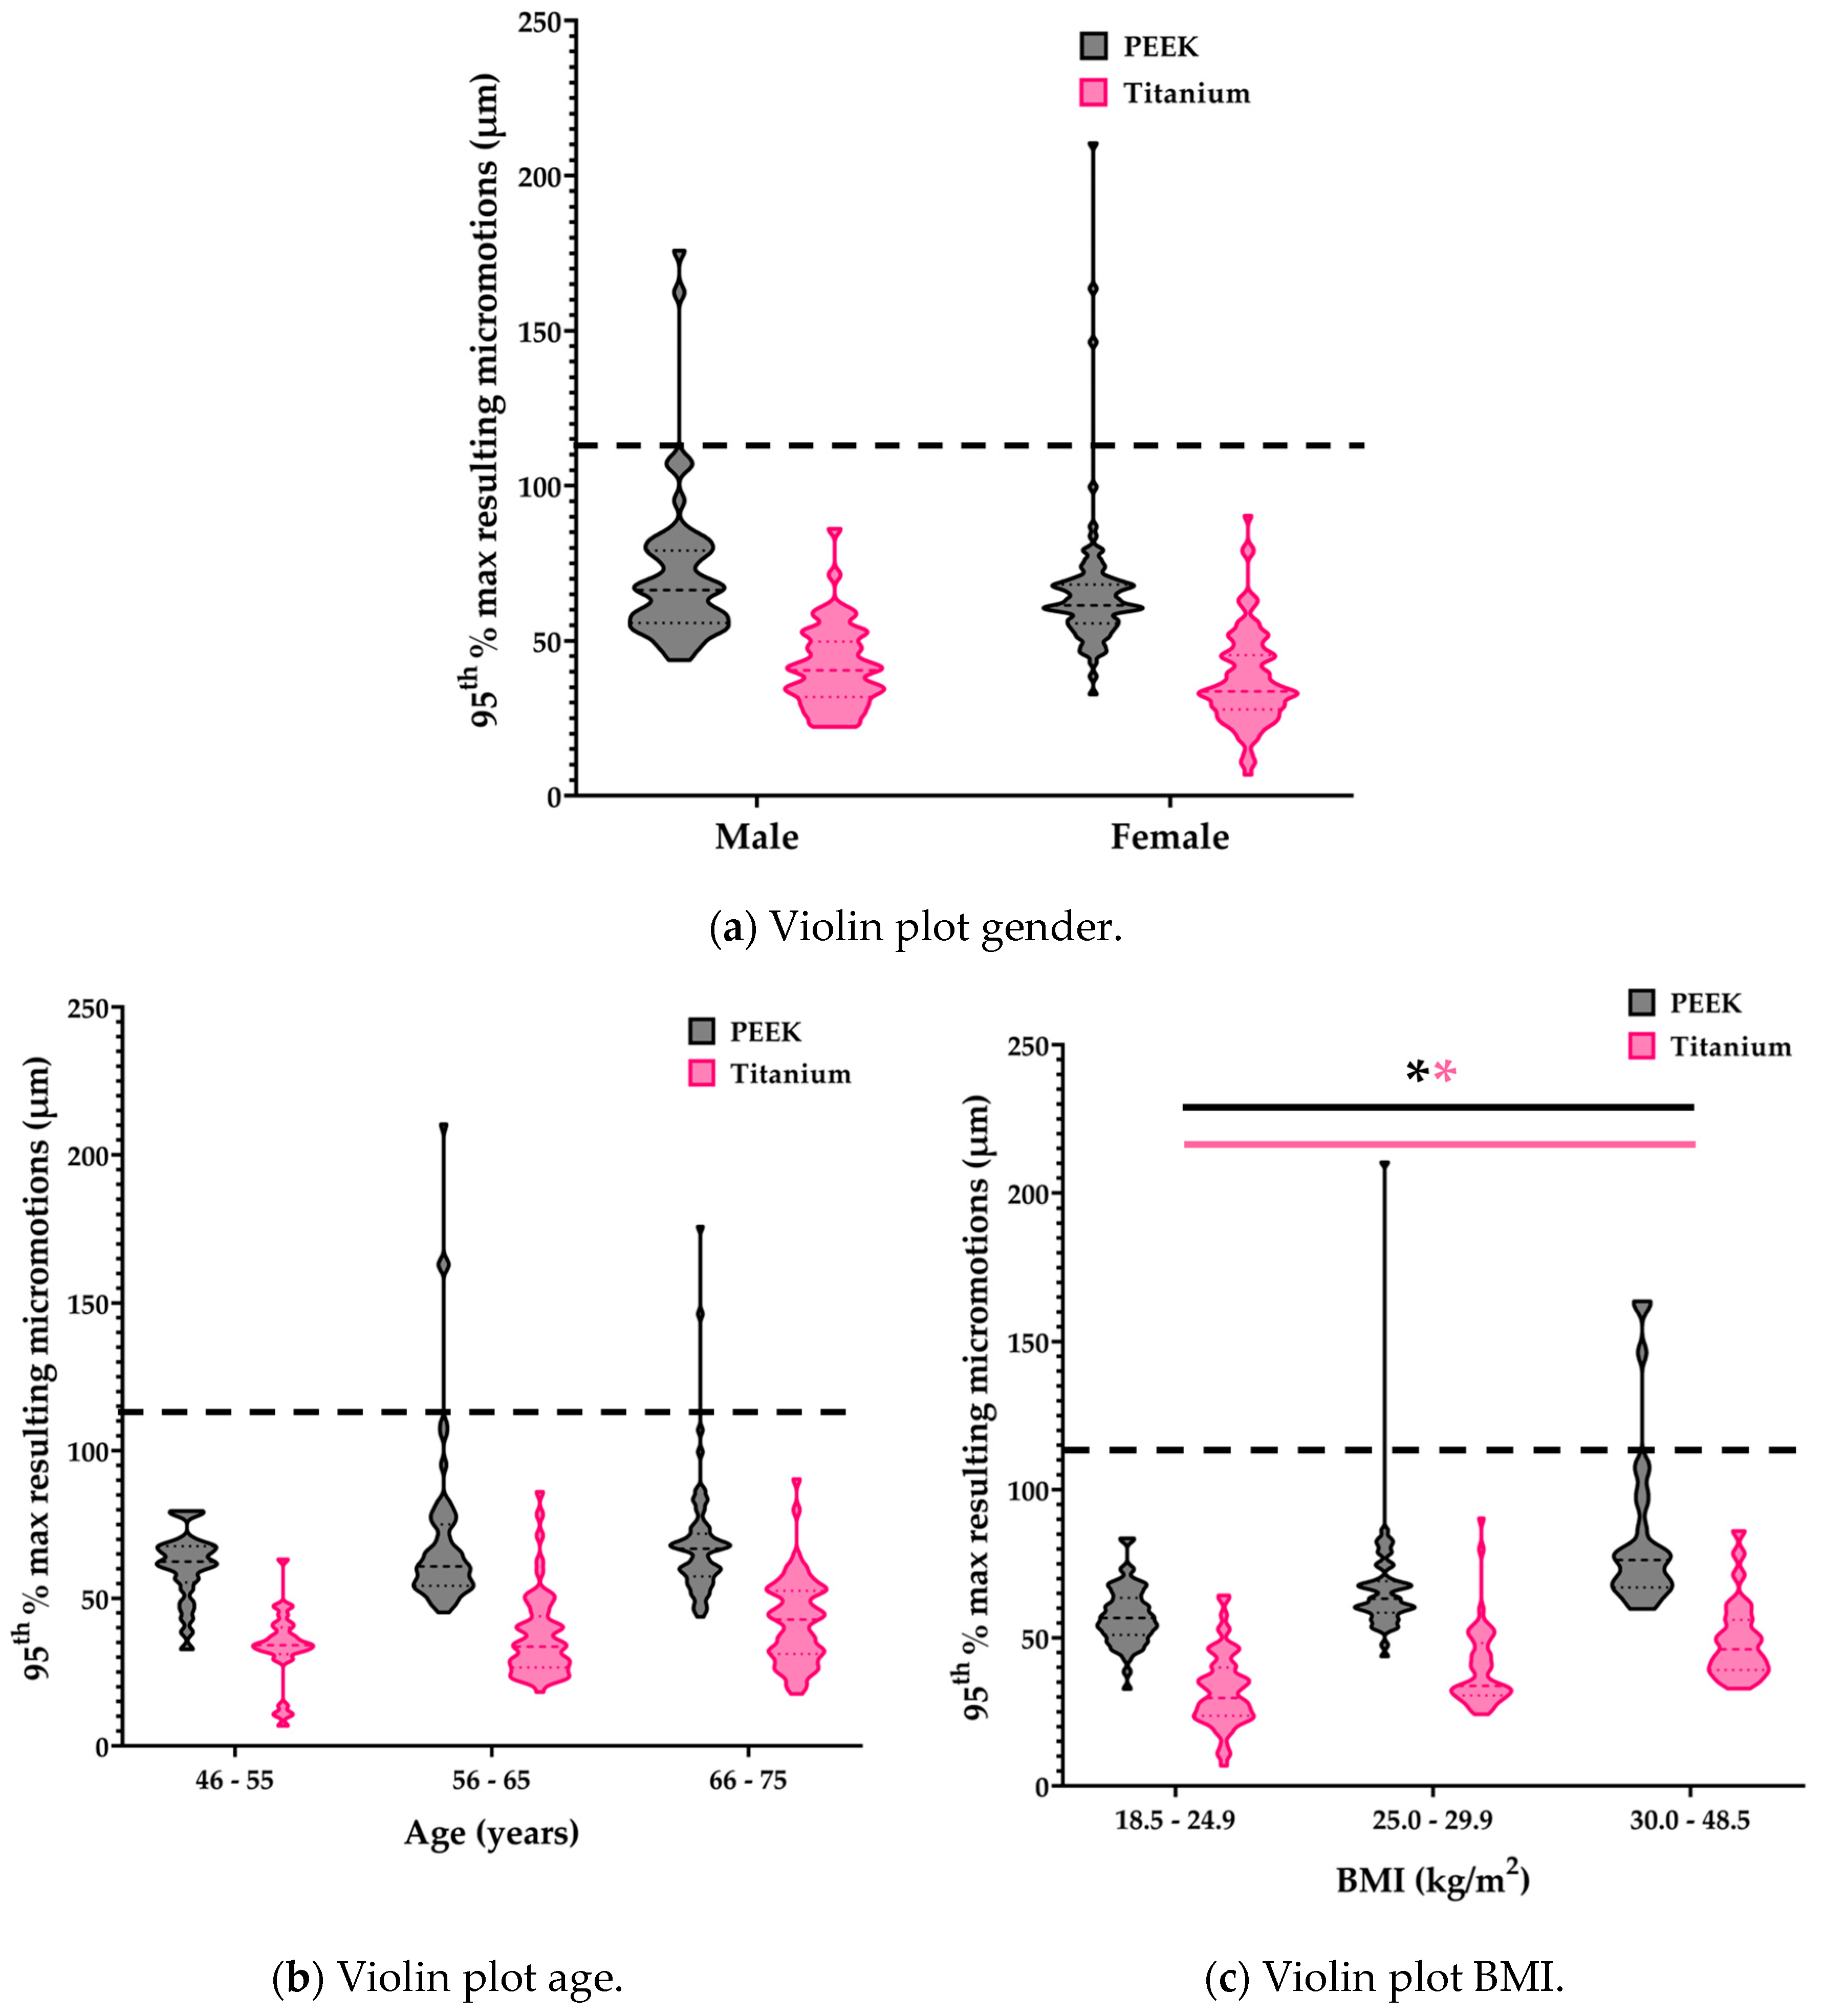
3. Results
4. Discussion
5. Conclusions
Author Contributions
Funding
Institutional Review Board Statement
Informed Consent Statement
Data Availability Statement
Acknowledgments
Conflicts of Interest
References
- Innocenti, M.; Vieri, B.; Melani, T.; Paoli, T. Metal hypersensitivity after knee arthroplasty: Fact or fiction? Acta Biomed. 2017, 88, 78–83. [Google Scholar] [CrossRef]
- Nishio, F.; Morita, K.; Doi, K.; Kato, M.; Abekura, H.; Yamaoka, H.; Kakimoto, N.; Tsuga, K. Radiopaque properties of polyetheretherketone crown at laboratory study. J. Oral Biosci. 2023, 65, 253–258. [Google Scholar] [CrossRef]
- De Ruiter, L.; Janssen, D.; Briscoe, A.; Verdonschot, N. A preclinical numerical assessment of a polyetheretherketone femoral component in total knee arthroplasty during gait. J. Exp. Orthop. 2017, 4, 3. [Google Scholar] [CrossRef]
- Rankin, K.E.; Dickinson, A.S.; Briscoe, A.; Browne, M. Does a PEEK Femoral TKA Implant Preserve Intact Femoral Surface Strains Compared With CoCr? A Preliminary Laboratory Study. Clin. Orthop. Relat. Res. 2016, 474, 2405–2413. [Google Scholar] [CrossRef]
- Hofmann, A.A.; Bloebaum, R.D.; Bachus, K.N. Progression of human bone ingrowth into porous-coated implants. Rate of bone ingrowth in humans. Acta Orthop. Scand. 1997, 68, 161–166. [Google Scholar] [CrossRef] [PubMed]
- Kohli, N.; Stoddart, J.C.; van Arkel, R.J. The limit of tolerable micromotion for implant osseointegration: A systematic review. Sci. Rep. 2021, 11, 10797. [Google Scholar] [CrossRef] [PubMed]
- Post, C.E.; Bitter, T.; Briscoe, A.; Verdonschot, N.; Janssen, D. The sensitivity of the micromotions of a cementless PEEK tibial component to the interface characteristics. SSRN 2023. [Google Scholar] [CrossRef]
- Başdelioğlu, K. Effects of body mass index on outcomes of total knee arthroplasty. Eur. J. Orthop. Surg. Traumatol. 2020, 31, 595–600. [Google Scholar] [CrossRef] [PubMed]
- Wan, Q.; Zhang, A.; Liu, Y.; Chen, H.; Zhang, J.; Xue, H.; Han, Q.; Wang, J. The influence of body weight index on initial stability of uncemented femoral knee protheses: A finite element study. Heliyon 2023, 9, e13819. [Google Scholar] [CrossRef] [PubMed]
- Daniilidis, K.; Yao, D.; Gosheger, G.; Berssen, C.; Budny, T.; Dieckmann, R.; Holl, S. Does BMI influence clinical outcomes after total knee arthroplasty? Technol. Health Care 2016, 24, 367–375. [Google Scholar] [CrossRef]
- Sendak, M.P.; Gao, M.; Brajer, N.; Balu, S. Presenting machine learning model information to clinical end users with model facts labels. NPJ Digit. Med. 2020, 3, 41. [Google Scholar] [CrossRef]
- Miranda, D.L.; Rainbow, M.J.; Leventhal, E.L.; Crisco, J.J.; Fleming, B.C. Automatic determination of anatomical coordinate systems for three-dimensional bone models of the isolated human knee. J. Biomech. 2010, 43, 1623–1626. [Google Scholar] [CrossRef]
- Berahmani, S.; Janssen, D.; Wolfson, D.; de Waal Malefijt, M.; Fitzpatrick, C.K.; Rullkoetter, P.J.; Verdonschot, N. FE analysis of the effects of simplifications in experimental testing on micromotions of uncemented femoral knee implants. J. Orthop. Res. 2016, 34, 812–819. [Google Scholar] [CrossRef]
- Eggermont, F.; Verdonschot, N.; van der Linden, Y.; Tanck, E. Calibration with or without phantom for fracture risk prediction in cancer patients with femoral bone metastases using CT-based finite element models. PLoS ONE 2019, 14, e0220564. [Google Scholar] [CrossRef]
- Keyak, J.H.; Falkinstein, Y. Comparison of in situ and in vitro CT scan-based finite element model predictions of proximal femoral fracture load. Med. Eng. Phys. 2003, 25, 781–787. [Google Scholar] [CrossRef] [PubMed]
- Keyak, J.H.; Kaneko, T.S.; Tehranzadeh, J.; Skinner, H.B. Predicting proximal femoral strength using structural engineering models. Clin. Orthop. Relat. Res. 2005, 437, 219–228. [Google Scholar] [CrossRef] [PubMed]
- Post, C.E.; Bitter, T.; Briscoe, A.; Verdonschot, N.; Janssen, D. A FE study on the effect of interference fit and coefficient of friction on the micromotions and interface gaps of a cementless PEEK femoral component. J. Biomech. 2022, 137, 111057. [Google Scholar] [CrossRef] [PubMed]
- Marra, M.A.; Andersen, M.S.; Damsgaard, M.; Koopman, B.F.J.M.; Janssen, D.; Verdonschot, N. Evaluation of a Surrogate Contact Model in Force-Dependent Kinematic Simulations of Total Knee Replacement. J. Biomech. Eng. 2017, 139, 081001. [Google Scholar] [CrossRef]
- Van der Ploeg, B.; Tarala, M.; Homminga, J.; Janssen, D.; Buma, P.; Verdonschot, N. Toward a more realistic prediction of peri-prosthetic micromotions. J. Orthop. Res. 2012, 30, 1147–1154. [Google Scholar] [CrossRef]
- Quevedo Gonzalez, F.J.; Lipman, J.D.; Lo, D.; De Martino, I.; Sculco, P.K.; Sculco, T.P.; Catani, F.; Wright, T.M. Mechanical performance of cementless total knee replacements: It is not all about the maximum loads. J. Orthop. Res. 2019, 37, 350–357. [Google Scholar] [CrossRef]
- Engh, C.A.; O’Connor, D.; Jasty, M.; McGovern, T.F.; Bobyn, D.; Harris, W.H. Quantification of Implant Micromotion, Strain Shielding, and Bone Resorption With Porous-Coated Anatomic Medullary Locking Femoral Prostheses. Clin. Orthop. Relat. Res. 1992, 285, 13–29. [Google Scholar] [CrossRef]
- Gibbons, J.P.; Cassidy, R.S.; Bryce, L.; Napier, R.J.; Bloch, B.V.; Beverland, D.E. Is Cementless Total Knee Arthroplasty Safe in Women Over 75 Y of Age? J. Arthroplast. 2023, 38, 691–699. [Google Scholar] [CrossRef] [PubMed]

| Gender, n (%) | |
|---|---|
| M | 15 (37%) |
| F | 26 (63%) |
| Age in years, mean (range) | 63 (46–75) |
| Height in m, mean (range) | 1.71 (1.55–1.99) |
| Weight in kg, mean (range) | 79 (52–170) |
| BMI in kg/m2, mean (range) | 26 (18–49) |
| Component | Material | Stiffness (GPa) |
|---|---|---|
| Tibia | Bone | 5.0–20.5 |
| Tibial tray | PEEK | 3.7 |
| Titanium | 109 | |
| Tibial insert | Ultra-high molecular weight polyethylene | 0.974 |
Disclaimer/Publisher’s Note: The statements, opinions and data contained in all publications are solely those of the individual author(s) and contributor(s) and not of MDPI and/or the editor(s). MDPI and/or the editor(s) disclaim responsibility for any injury to people or property resulting from any ideas, methods, instructions or products referred to in the content. |
© 2024 by the authors. Licensee MDPI, Basel, Switzerland. This article is an open access article distributed under the terms and conditions of the Creative Commons Attribution (CC BY) license (https://creativecommons.org/licenses/by/4.0/).
Share and Cite
Post, C.E.; Bitter, T.; Briscoe, A.; van Langen, I.; Fluit, R.; Verdonschot, N.; Janssen, D. The Effect of Patient-Related Factors on the Primary Fixation of PEEK and Titanium Tibial Components: A Population-Based FE Study. Bioengineering 2024, 11, 116. https://doi.org/10.3390/bioengineering11020116
Post CE, Bitter T, Briscoe A, van Langen I, Fluit R, Verdonschot N, Janssen D. The Effect of Patient-Related Factors on the Primary Fixation of PEEK and Titanium Tibial Components: A Population-Based FE Study. Bioengineering. 2024; 11(2):116. https://doi.org/10.3390/bioengineering11020116
Chicago/Turabian StylePost, Corine E., Thom Bitter, Adam Briscoe, Inger van Langen, René Fluit, Nico Verdonschot, and Dennis Janssen. 2024. "The Effect of Patient-Related Factors on the Primary Fixation of PEEK and Titanium Tibial Components: A Population-Based FE Study" Bioengineering 11, no. 2: 116. https://doi.org/10.3390/bioengineering11020116
APA StylePost, C. E., Bitter, T., Briscoe, A., van Langen, I., Fluit, R., Verdonschot, N., & Janssen, D. (2024). The Effect of Patient-Related Factors on the Primary Fixation of PEEK and Titanium Tibial Components: A Population-Based FE Study. Bioengineering, 11(2), 116. https://doi.org/10.3390/bioengineering11020116