1. Introduction
Current guidelines for aerosol-transmitted diseases, such as COVID-19, typically recommend placing the patient in an airborne infection isolation room (AIIR) and ensuring that healthcare workers (HCWs) wear personal protective equipment (PPE) such as an N95 Respirator, a gown, gloves, an eye shield to minimize the spread of infection [
1]. While placing patients in an AIIR can prevent cross-contamination to other patients, it does not fully protect HCWs who remain within the AIIR. Despite the use of PPE, approximately 5–10% of HCWs who treated COVID-19 patients reported being infected with the virus [
2]. Additionally, the extended use of PPE during long shifts can result in significant physical and mental fatigue [
2,
3].
Saito et al. reported that aerosol-generating procedures (AGPs), including intubation and cardiopulmonary resuscitation (CPR), elevate the risk of respiratory infectious diseases such as COVID-19 [
4]. To reduce this risk, healthcare workers have been compelled to develop alternative methods of protection. Shield boxes, also known as aerosol boxes, respiratory barrier enclosures, or intubation boxes, have been developed to contain droplets generated during AGPs [
5,
6,
7]. However, research on these newly developed respiratory barriers has yielded mixed outcomes; while they may reduce droplet spread, their design limitations can hinder procedural efficiency and potentially increase the risk of contamination during procedures [
7,
8,
9].
In particular, several recent studies have investigated the effectiveness of barrier enclosures using both experimental setups and CFD models. For example, Perella et al. used CFD to simulate aerosol and droplet spread during aerosol-generating procedures and found that using a protective shield prevented the escape of up to 100% of particles under optimal conditions. However, incomplete sealing or insufficient suction led to particle escape in worst-case scenarios [
10]. The other example, a study comparing acrylic boxes and plastic sheets during extubation procedures, reported that acrylic boxes were more effective in reducing droplet contamination, but practical issues such as cleaning and design inconsistencies were highlighted as potential challenges [
11]. While these studies demonstrate the potential of barrier devices in minimizing environmental contamination, they also underscore the need for further optimization and standardized testing methods to ensure their efficacy across various clinical scenarios.
Since 2020, our research team, which includes board-certified emergency physicians and mechanical engineers, has been developing a novel respiratory barrier enclosure with a negative pressure generator that includes a pressure differential detector. The purpose of this device is to isolate the patient’s respiratory area during medical procedures. A key feature of this novel enclosure is a double-layered membrane system that seals the patient’s chest area and can easily be converted into a system-wide isolator, resembling a negative pressure isolation chamber. The intubation hood, which covers the patient’s head and neck, has four access orifices for healthcare workers [
12,
13].
Our team has reported the efficacy of this newly developed respiratory barrier enclosure in containing droplets during procedures such as intubation and CPR. We also assessed the efficiency of procedures like endotracheal intubation through simulation studies. Although procedural times showed no statistically significant difference after 10 min of adequate practice, participants reported discomfort during intubation due to the endotracheal tube frequently touching the ceiling of the hood [
13]. While enlarging the hood size could alleviate this discomfort, our team restricted the size of the intubation hood to ensure it remains useful for imaging procedures, including CT scans and coronary angiography. Based on these findings, we concluded that further work is needed to improve both efficacy and efficiency. Additionally, our preliminary studies indicated a lack of established standard methods for accurately testing the barrier effectiveness of such chambers.
Furthermore, our preliminary studies [
12,
13] identified the absence of an established standard method to accurately test the barrier effectiveness of enclosures like ours. In response, this study uses computational fluid dynamics (CFD) to simulate droplet behavior and predict potential external leaks. Following design modifications aimed at improving user comfort and reducing droplet leakage, we constructed a new hood and performed real-time droplet leakage tests using the PAO particle leakage method under various conditions. Our results suggest that even a shorter hood designed for comfort can significantly enhance the protective effect of the enclosure, and the absence of a double-layered membrane did not result in substantial droplet leakage, even under rigorous conditions.
2. Materials and Methods
2.1. Design of Intubation Hood
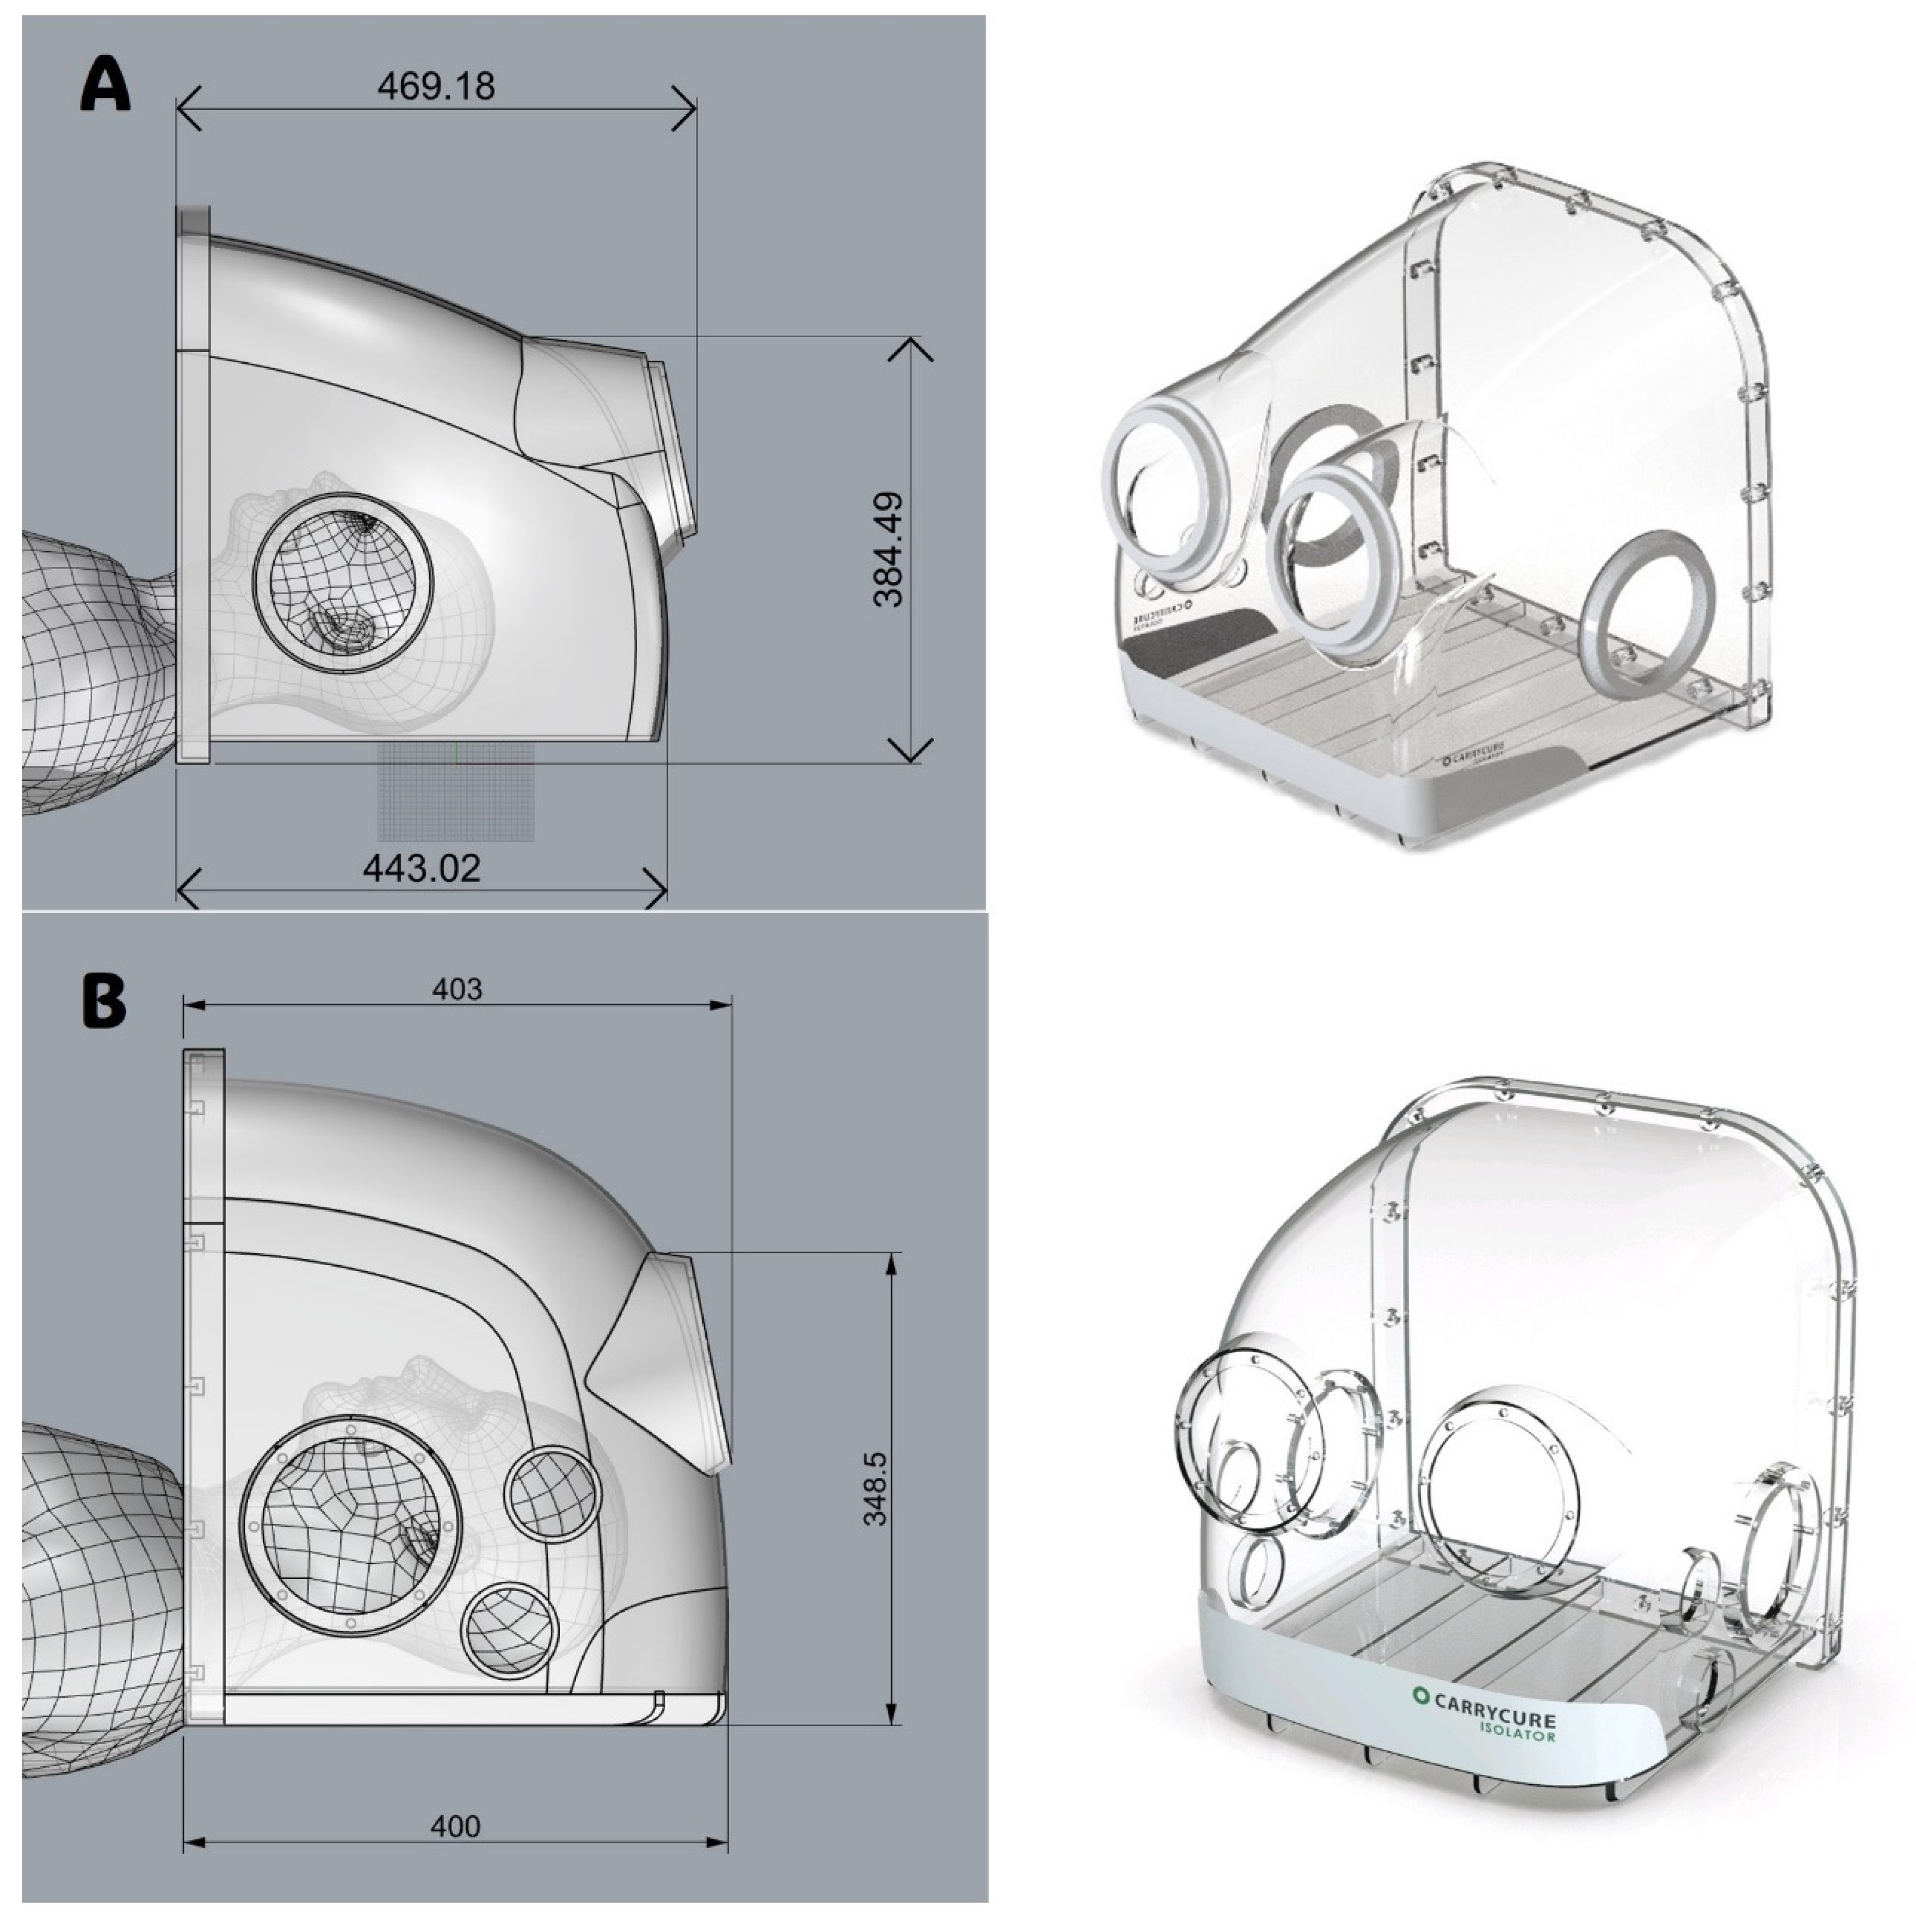
The intubation hood was designed with dimensions constrained about 500 mm in width, length, and height, each with four patient access orifices. The intubation hood is intended to cover the patient’s head and neck area, shielding it from the surrounding environment. The design and layout of the isolation hood were developed using Autodesk AutoCAD LT 2020 (Autodesk, Inc., San Francisco, CA, USA). The placement of the patient access orifices was determined by assessing the optimal elbow height for healthcare workers during procedures such as intubation or bag-valve-mask ventilation.
The model used in the previous study [
12] (
Figure 1A) revealed that the tip of the intubation tube frequently touched the hood’s ceiling, impeding the procedure [
13]. To address this issue and enhance usability for HCWs, the overall length of the hood was reduced. Concurrently, the height of the central portion of the hood was increased by modifying the ceiling curvature (
Figure 1B). These adjustments were guided and validated through CFD simulations to ensure that the alterations did not compromise the hood’s barrier performance.
2.2. Computational Fluid Dynamic Analysis
The system of equations was solved using ANSYS CFX, Release 2023 R1, commercial flow simulation software. The turbulence model used a shear stress transport model based on the Reynolds-averaged Navier–Stokes equation
, which is excellent for predicting the adverse pressure gradient. The model solves a total of four transport equations: a continuous equation, a momentum transport equation based on the Reynolds-averaged equations, and two for the turbulent kinetic energy, k, and the turbulent frequency, ω. The stress tensor is calculated from the vorticity–viscosity concept.
In addition to the independent variables, the density, ρ, and the velocity vector, U, are treated as known quantities from the Navier–Stokes method. P
k is the production rate of turbulence, which is calculated as in the k-ε model, τ is the molecular stress tensor, and S
P is the source term of momentum by particle. The model constants are given by:
,
,
,
,
.
is the turbulent eddy viscosity which is calculated by:
Again, F2 is a blending function which restricts the limiter to the wall boundary layer, as the underlying assumptions are not correct for free shear flows. S is an invariant measure of the strain rate.
The unknown Reynolds stress tensor,
, is calculated from:
Just as the fluid influences the behavior of the particles through forces such as convective heat transfer, there is an opposing effect of the particles on the fluid, which is known as coupling. In this study, we simulate two-way coupling, which is the case where the particles also influence the fluid behavior. To use two-way coupling, the fluid momentum equation must include a particle source term. The momentum source is due to the drag, and the particle source term is generated for each particle as the flow is tracked. The particle source is applied to the control volume where the particles are located during the timestep. The particle source for the fluid momentum equation is obtained by solving the transport equation for the source. A typical equation for a particle source is:
where C
Sϕ
P is the contribution of the particle that is linear in the solution variables and R
S includes all other contributions, including the mass transfer term
where appropriate. This equation has the same form as general particle transport and can be solved in the same way as described above. The source to be added to the continuum is then multiplied by the particle flow rate, which is the mass flow rate of that particle divided by the mass of the particle. In CFX, the particle source term is recalculated each time a particle is injected. The source term is then kept in memory so that it can be applied each time a fluid coefficient is calculated. This allows the particle source to be applied even if no particles are injected in the current flow calculation.
Consider a discrete particle traveling in a continuous fluid medium. The forces acting on the particle that affect the particle acceleration are due to the difference in velocity between the particle and the fluid, as well as to the displacement of the fluid by the particle. The equation of motion for such a particle was derived by Basset, Boussinesq and Oseen for a rotating reference frame, where
is the particle mass and
is the particle velocity:
which has the following forces on the right-hand side:
: drag force acting on the particle
: buoyancy force due to gravity
: forces due to domain rotation (centripetal and Coriolis forces)
: virtual (or added) mass force. This is the force to accelerate the virtual mass of the fluid in the volume occupied by the particle. This term is important when the displaced fluid mass exceeds the particle mass, such as in the motion of bubbles.
: pressure gradient force. This is the force applied on the particle due to the pressure gradient in the fluid surrounding the particle caused by fluid acceleration. It is only significant when the fluid density is comparable to or greater than the particle density.
The aerodynamic drag force on a particle is proportional to the slip velocity,
, between the particle and the fluid velocity:
where
is the drag coefficient and
is the particle diameter; where
is the drag coefficient and
is the particle diameter. The drag coefficient,
, is introduced to account for experimental results on the viscous drag of a solid sphere and a value of 0.44 was used in this study.
The buoyancy force is the force on a particle immersed in a fluid. The buoyancy force is equal to the weight of the displaced fluid and is given by
where
is the gravity vector,
is the particle density, and
is the fluid density.
In a rotating frame of reference, the rotation term is an intrinsic part of the acceleration and is the sum of Coriolis and centripetal forces:
This force is caused by the fact that the particle has to accelerate some of the surrounding fluid, leading to an additional drag of the following form:
If the virtual mass force is included, the coefficient is normally set to 1.
The pressure gradient force results from the local fluid pressure gradient around the particle and is defined as:
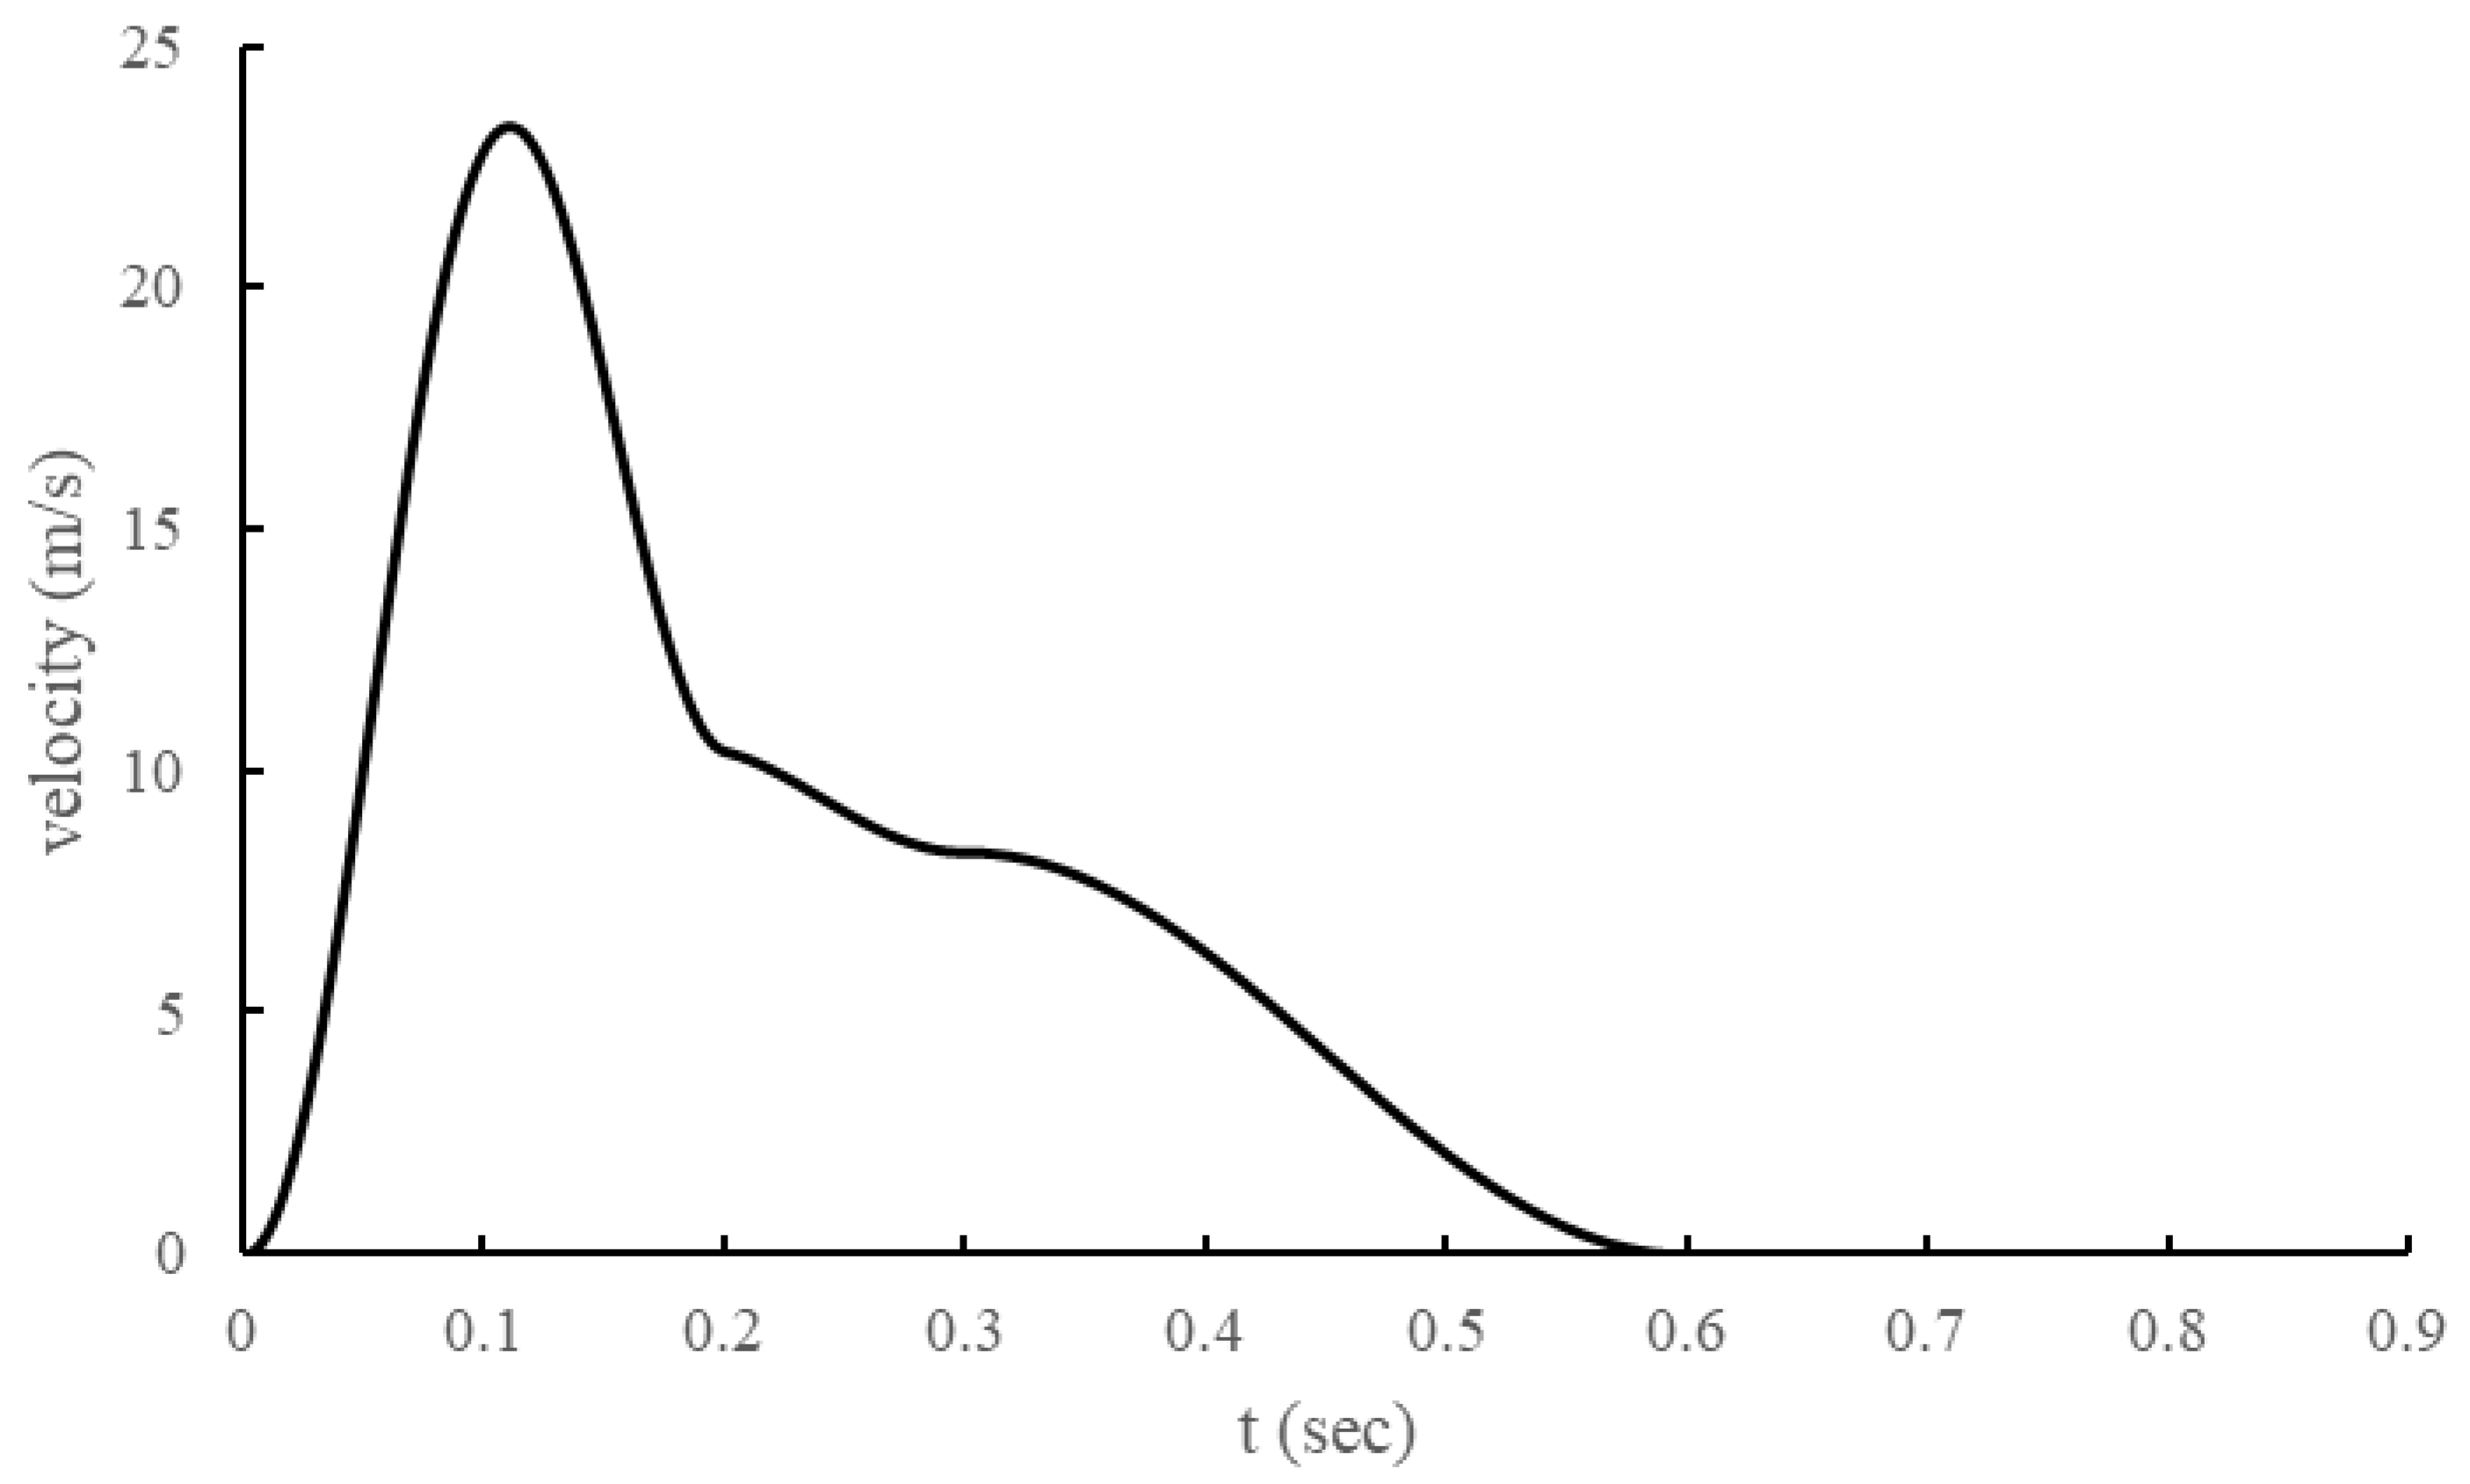
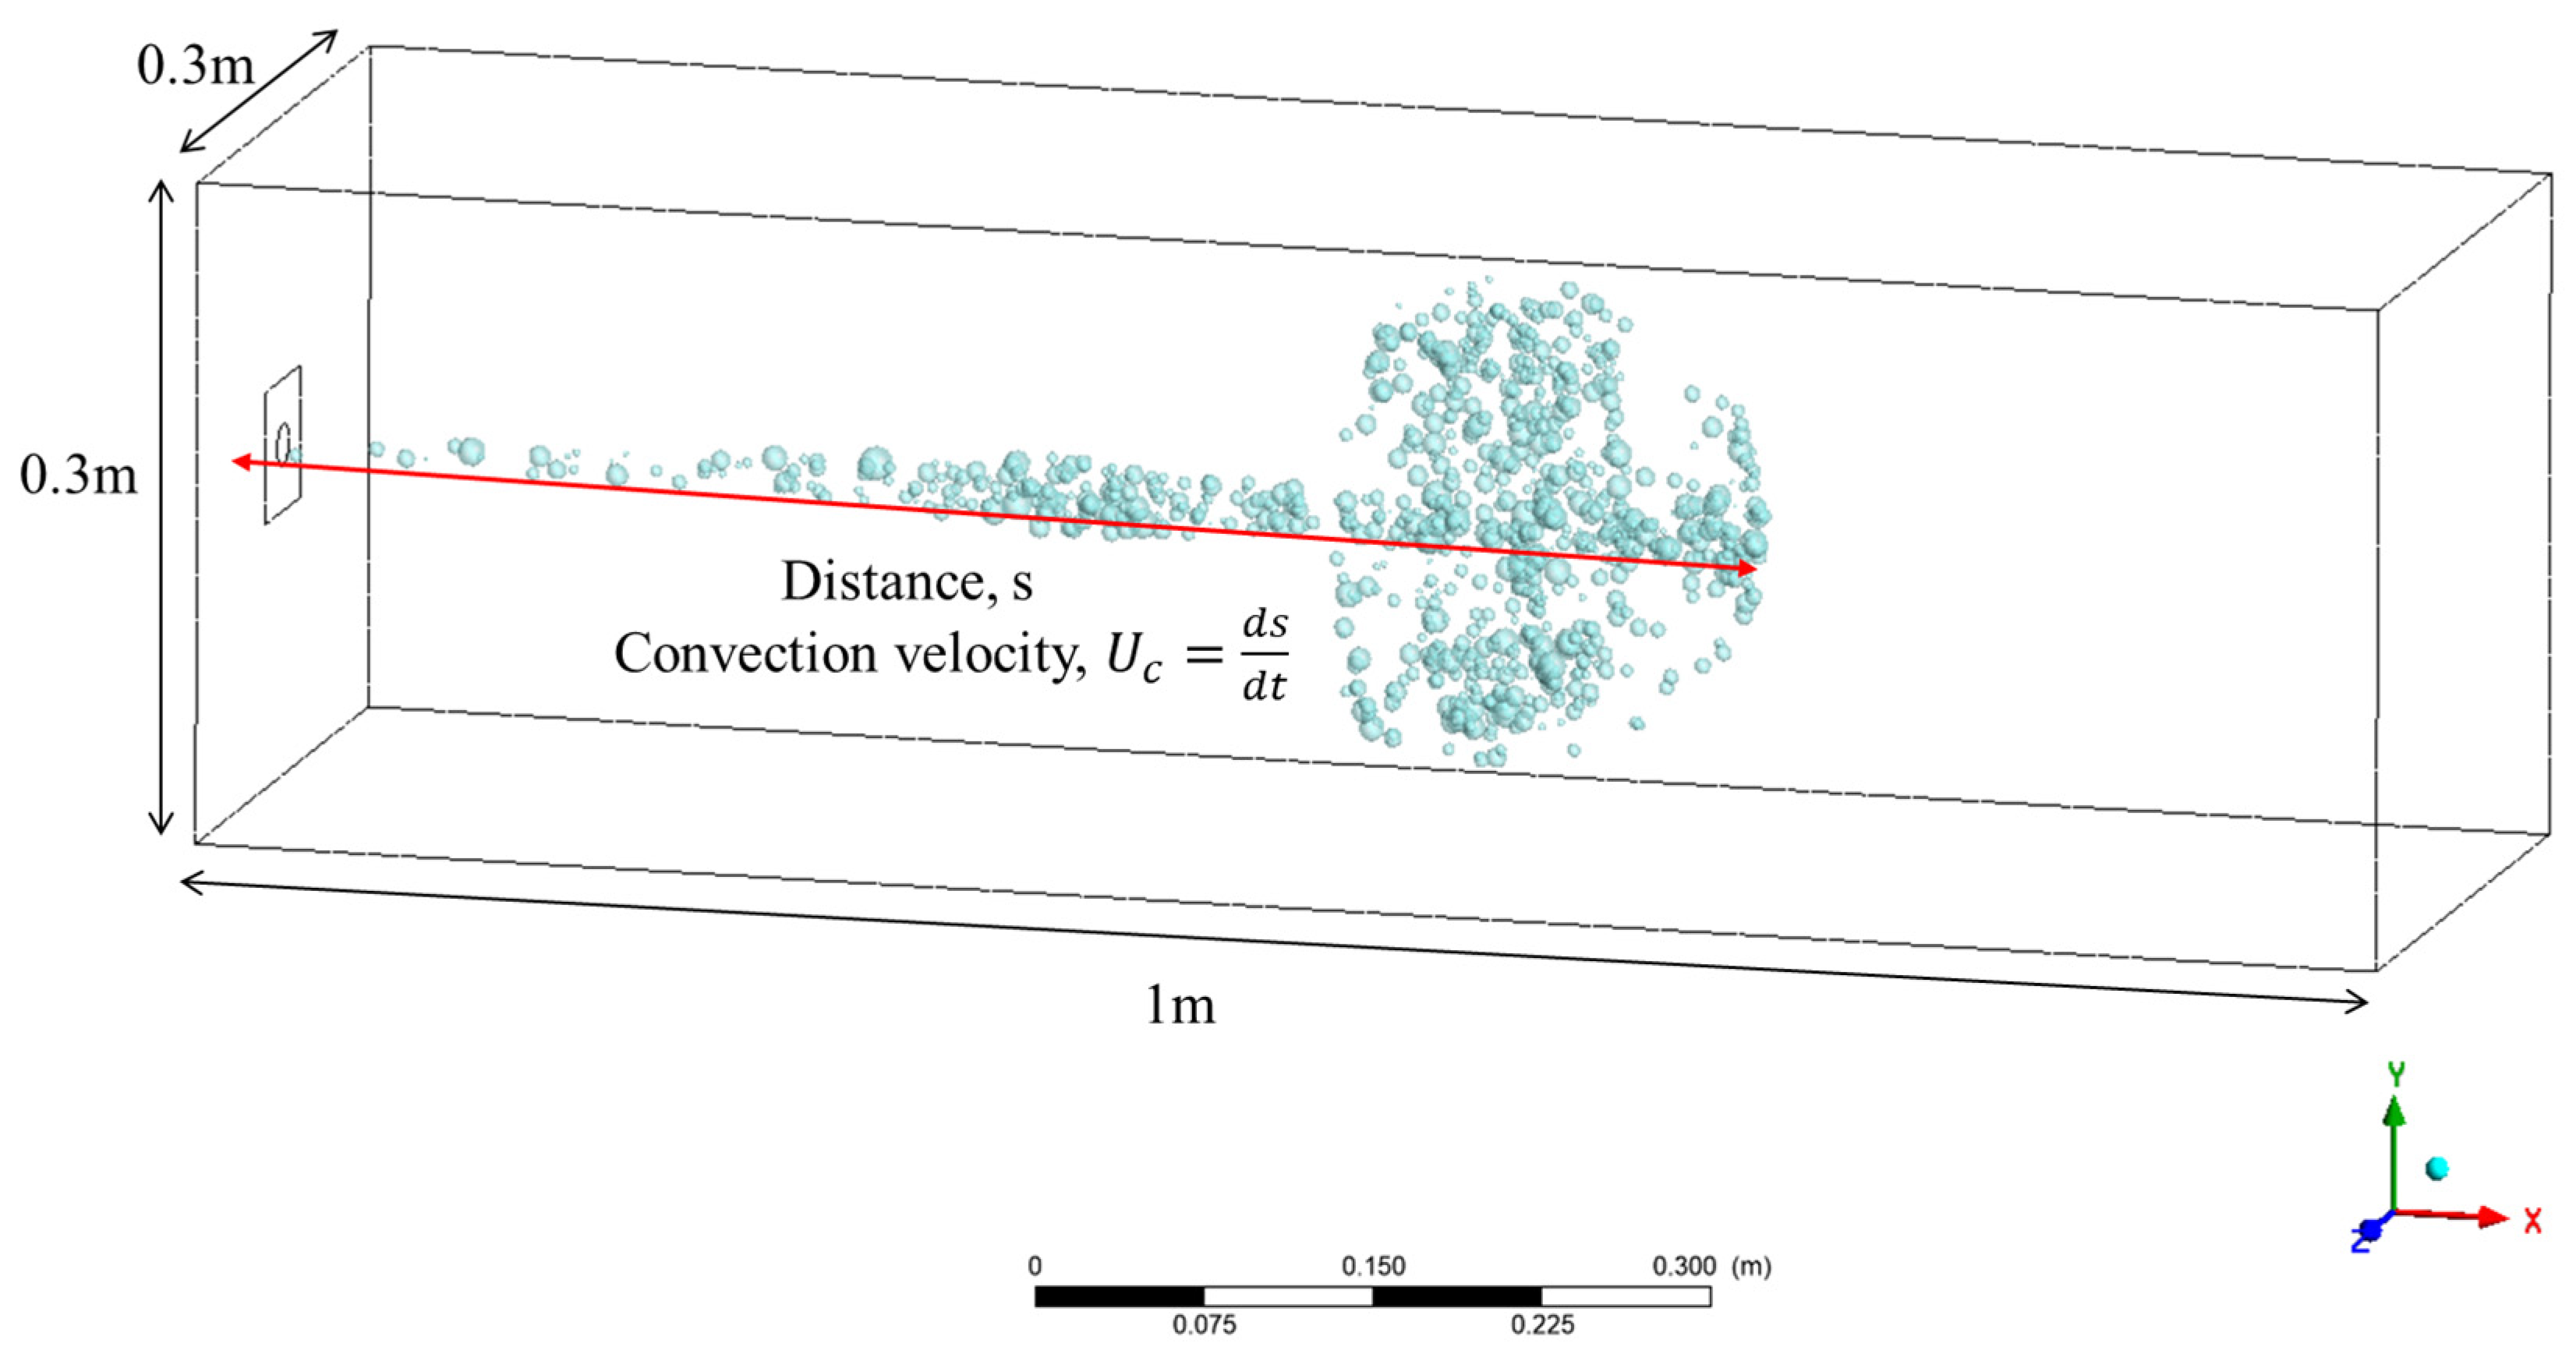
The inlet condition, cough, was modeled as shown in
Figure 2 by adapting the model of J. K. Gupta et al. [
14]. In addition, the cough droplet size distribution was modeled using the Rosin–Rammler model based on the measurement results of Yang, Shinhao, et al. [
15].
Each droplet was subjected to a particle break model, where the model used was the Taylor Analogy Breakup (TAB) model. The time-dependent particle distortion equation according to the TAB model is as follows:
Here, we used 0.5 for the critical amplitude coefficient, , 5.0 for the damping coefficient, , 1/3 for the external force coefficient, , 8.0 for the restoring force coefficient, , 1.0 for the new droplet velocity factor, and , 10/3 for the energy ratio factor, .
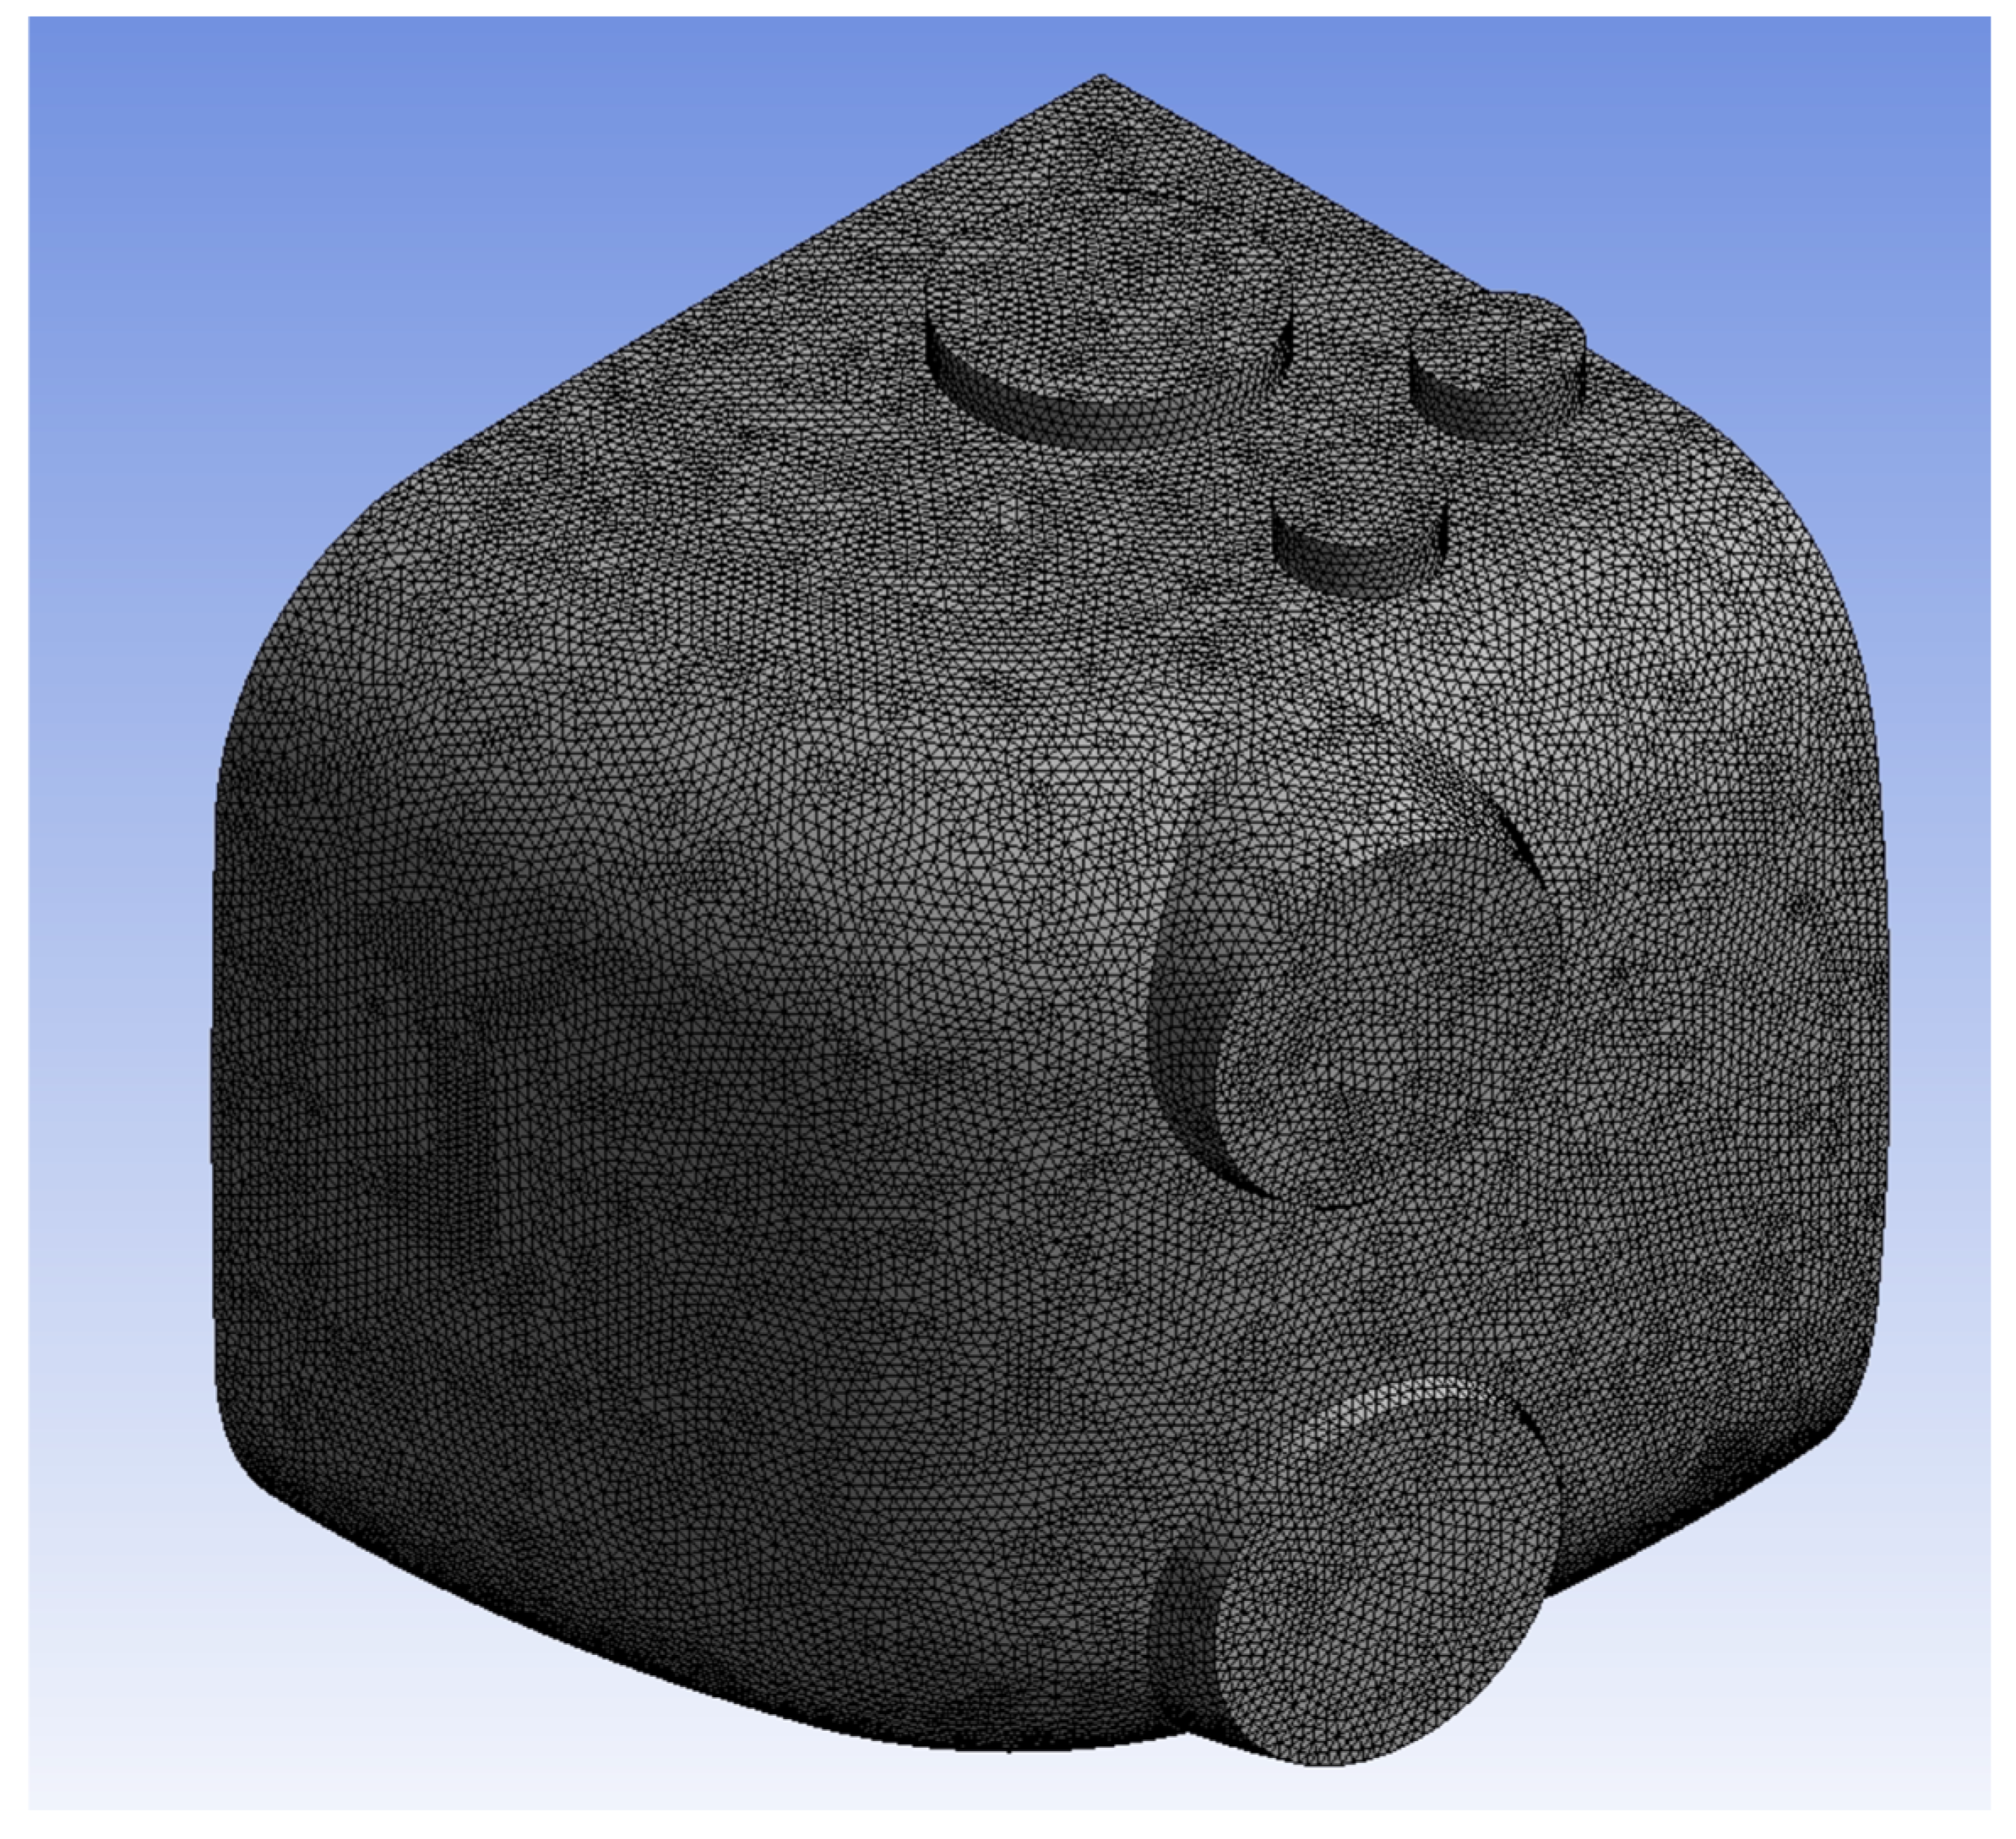
For the meshes, we set the element size to 5 mm for a total mesh count of 3,780,013, which can be seen in
Figure 3. A grid independence test was conducted to determine the sensitivity of the solution to the mesh element size, as in
Figure 3. The test results, as depicted in the graph (
Figure 4), show the average total pressure variation at different mesh element sizes. As the mesh size decreases from 12.5 mm to 5 mm, the total pressure becomes more stable. Specifically, reducing the mesh size from 12.5 mm to 10 mm results in a 26.11% change in the average total pressure. A further reduction from 10 mm to 7.5 mm yields a 12.13% variation, and finally, decreasing the size from 7.5 mm to 5 mm leads to only a 1.26% change. This indicates that beyond the mesh size of 7.5 mm, the solution becomes nearly independent of the mesh resolution, confirming that the mesh size of 5 mm is sufficient for an accurate solution with minimal computational cost.
2.3. Negative Pressure Generator (NPG)
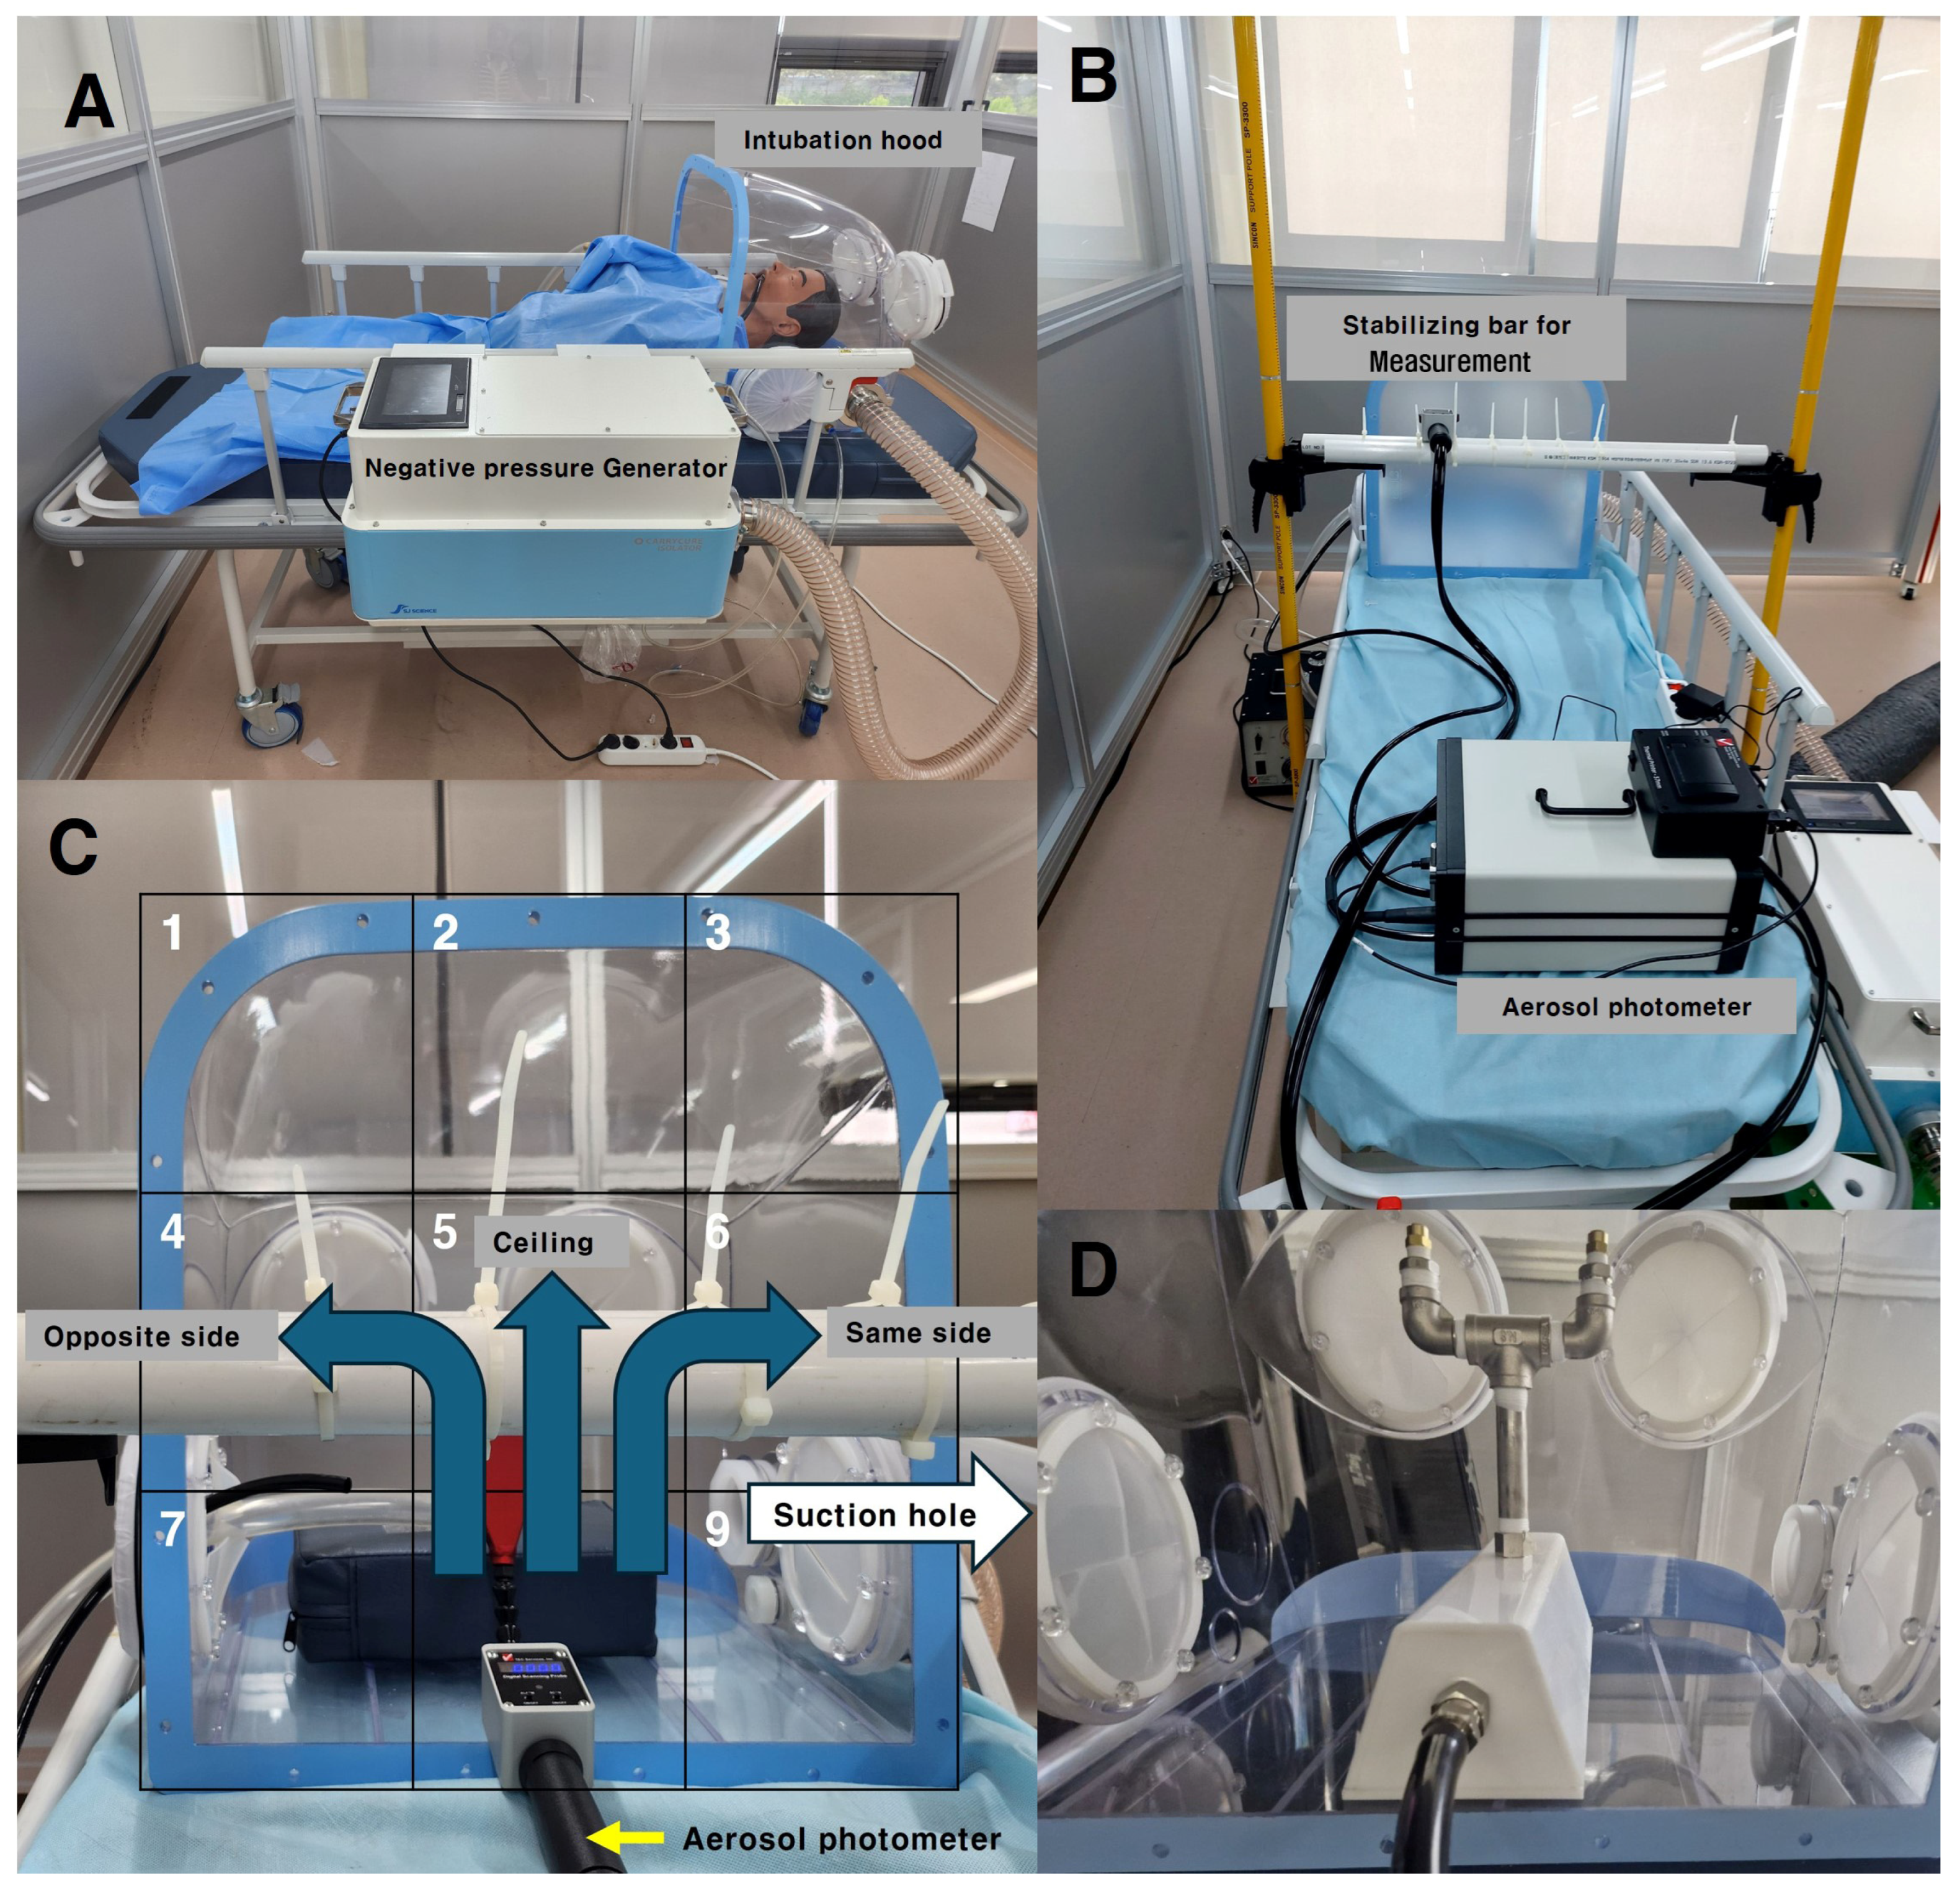
A negative pressure generator was designed to continuously suction air inside the hood through an 80 mm diameter duct, allowing it to pass through a HEPA filter with 99.7% efficiency. Ventilation fans were installed inside the negative pressure generator, designed to operate up to four levels of boosters depending on the negative pressure differential inside and outside of the intubation hood. The system was programmed to activate an additional booster if the pressure differential dropped below −10 Pa, and to deactivate the booster if the pressure differential exceeded −20 Pa. The pressure differential was continuously monitored using a sensor (differential pressure transmitter ©Beck 93 Sensortechnik GmbH, Steinenbronn, Germany) during suction (
Figure 5A).
Without the double-layered membrane, the pressure differential between the inside and outside was maintained below −10 Pa, ensuring that all four boosters remained active. When the hood was completely closed, the pressure differential exceeded −80 Pa with all four boosters running. In this study, the hood was kept in an open state, and its barrier efficiency was assessed under conditions with all four boosters running automatically.
2.4. PAO Particle Leakage Testing
In this study, we adapted the PAO particle method, commonly used for HEPA filter integrity testing, to assess particle leakage from the inside of a hood to the outside. This method refers to standards such as ISO 14644-3 [
16], which ensure precise detection of leaks. PAO particles were generated inside the hood using an aerosol generator, and concentrations were maintained between 100 and 120 µg/L, in contrast to the ISO standard, which recommends concentrations of 20–30 µg/L, to ensure more robust testing conditions.
An aerosol photometer (Model PH-5, Tec Services, Inc., Atlanta, GA, USA) was used to detect leakage, with significant leakage defined as exceeding 0.3% of the particles generated inside the hood, while any leakage above 0.1% was also recorded (
Figure 5B).
To identify areas with the highest leakage, the open area of the hood—the patient’s chest side—was divided into nine sections. Measurements were taken nine times at 10 s intervals over 90 s, at a distance of 15 cm from the hood’s open side. Aerosolized PAO particles were dispersed in three different ways: opposite to the suction hole, directly to the middle top of the ceiling, and toward the suction hole. This entire process was repeated five times. These results were then compared CFD analysis to further evaluate the leakage patterns (
Figure 5C).
2.5. Coughing and Breathing Condition
The PAO particle injection method was adjusted to simulate both coughing and regular breathing by the patient inside the hood. For the coughing scenario, the concentration of PAO particles within the central area of the hood was increased to reach 100–120 µg/L over 90 s. This amount was then released in six bursts, simulating a coughing model. Additionally, a valve (
Figure 5D) was used to control the release of the same amount of aerosol, allowing it to disperse slowly over 90 s to simulate particle emission during normal breathing.
Considering the total number of droplets a patient typically exhales—about 7200 particles per liter with a tidal volume of 450 mL per breath at a rate of 15 breaths per minute—the droplets dispersed in the chamber would reach approximately 780 particles/L over 90 s [
16]. This corresponds to a PAO particle concentration of less than 0.0001 µg/L, indicating that the simulated particle concentration used in the study was significantly higher than what is typically generated by a person. This ensured a more rigorous test of the system’s performance.
4. Discussion
Since the onset of the COVID-19 pandemic in 2020, our research team has been developing an intubation hood. Initially, we prioritized the containment efficacy of the intubation hood as the most critical factor, but we encountered challenges in finding an appropriate method to confirm its protective effect [
12,
13]. Another significant challenge was that increasing the hood’s protective effect by enhancing the fan’s suction power could potentially create more airflow inside the hood, leading to patient discomfort or interfering with their respiration. After much deliberation, our team decided to utilize computational fluid dynamics (CFD) analysis [
14,
17].
The air inside a small space, such as an intubation hood, exhibits turbulent characteristics due to low viscosity and the perturbations caused by repeated cycles of exhalation and inhalation. Turbulence, in this context, refers to a flow that includes random and chaotic vortices, making an explicit solution impossible, thus necessitating the use of CFD analysis [
18,
19].
During our preliminary study, CFD analysis indicated that the chamber’s protective effect could be sufficient even without the double-layered membrane of the previously tested novel intubation hood [
12,
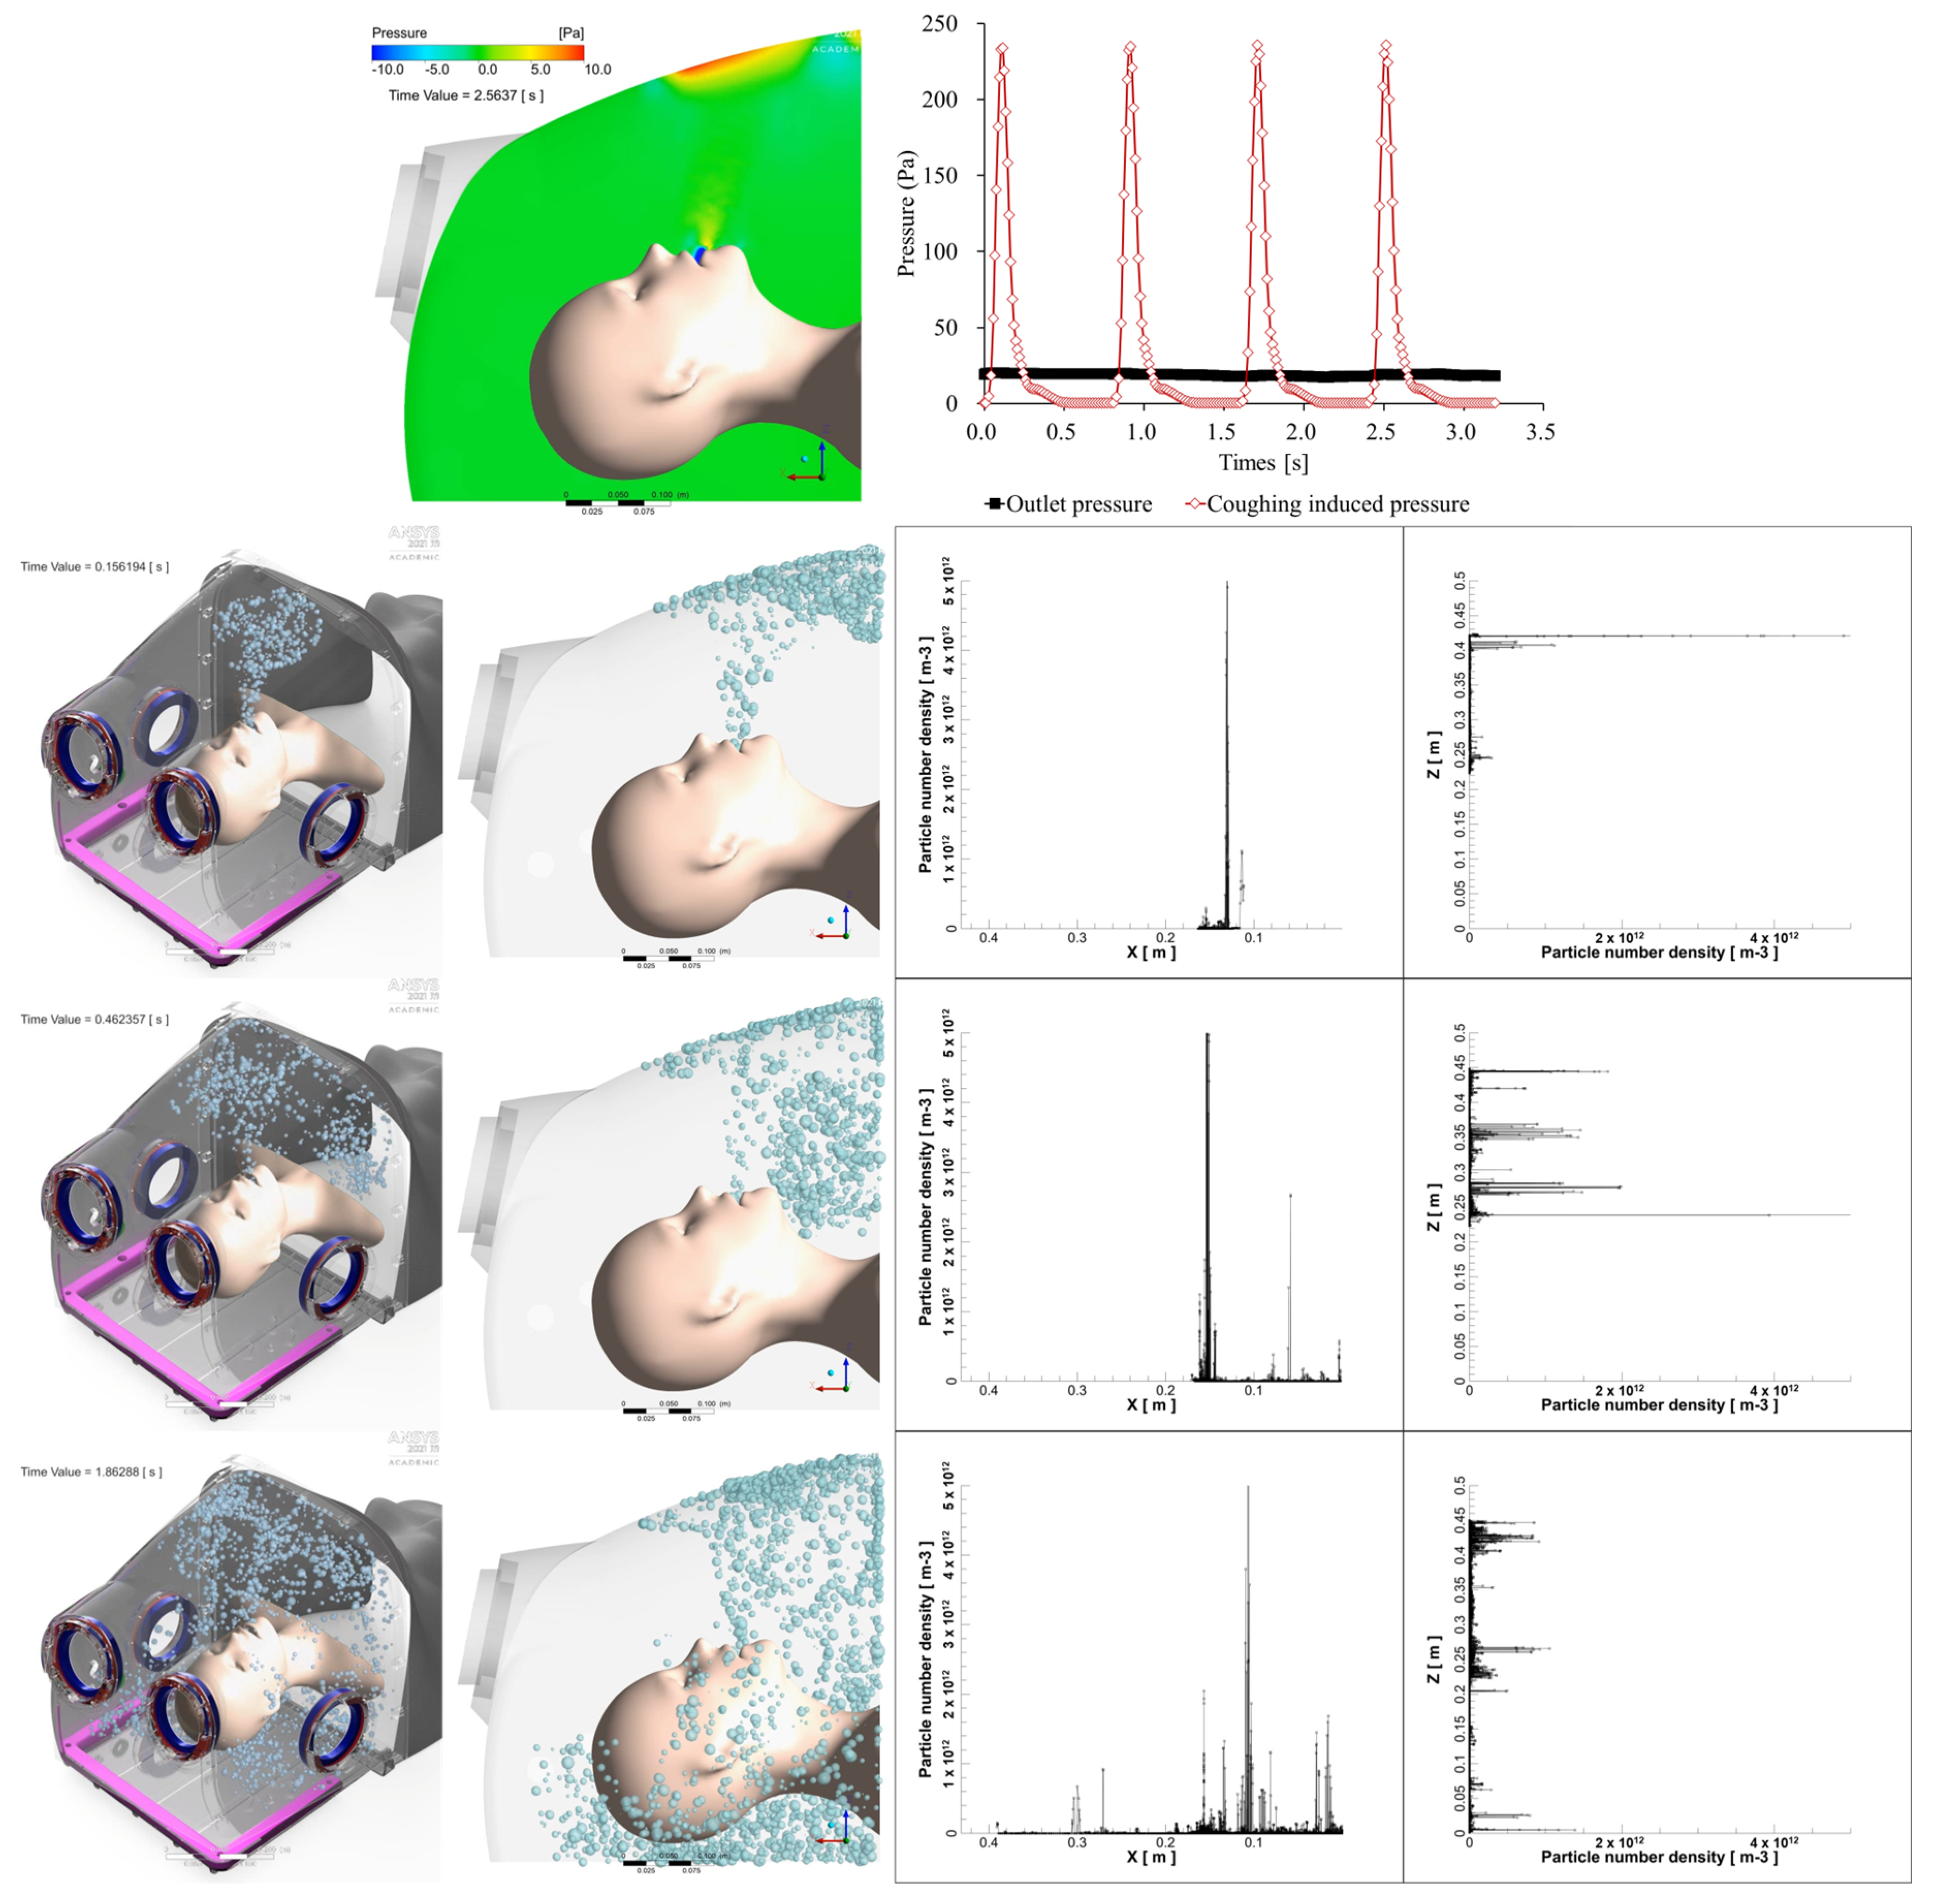
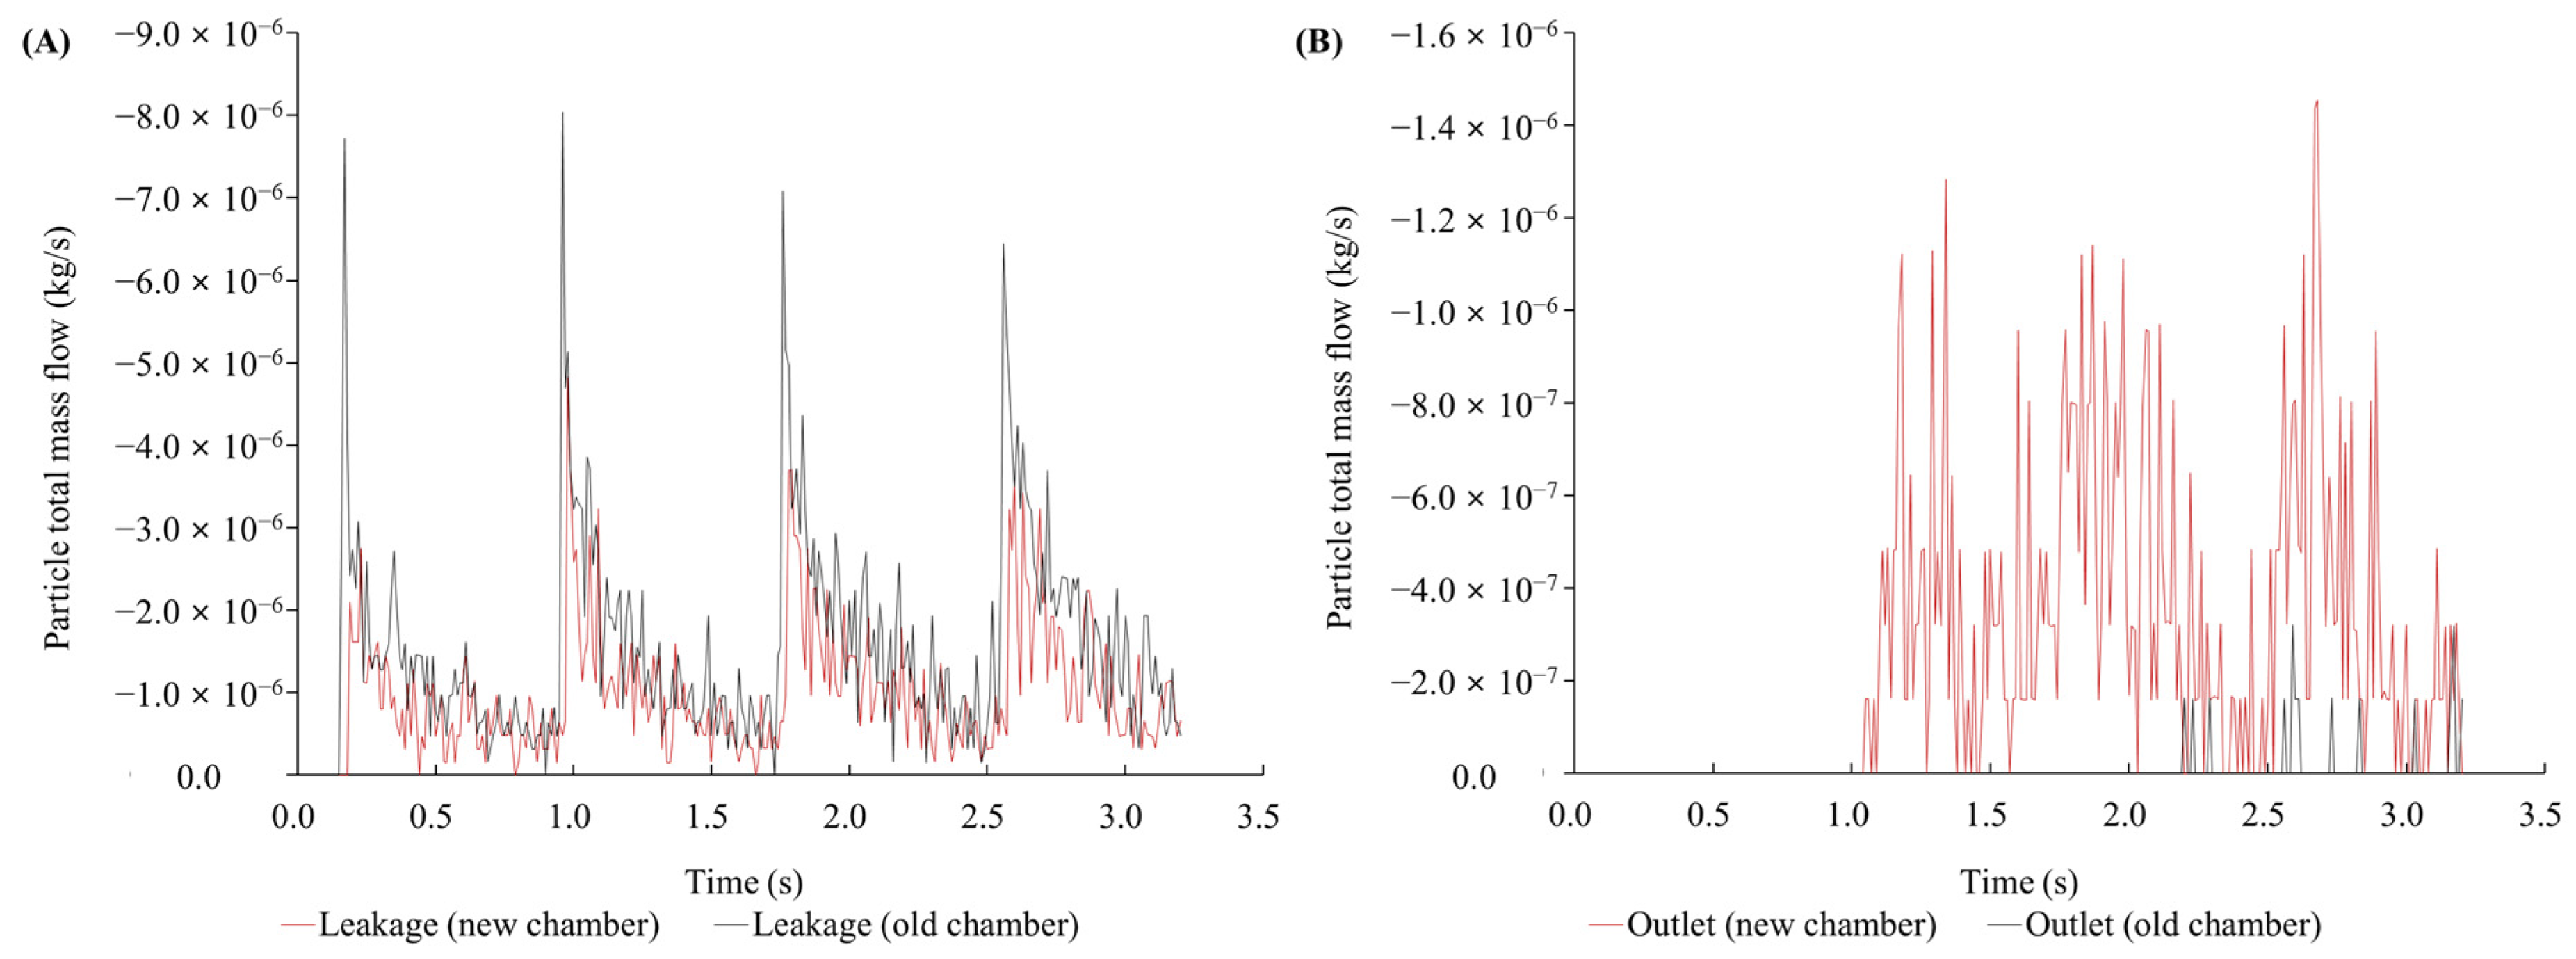
13]. Consequently, in this study, we analyzed the protective effect under open conditions (without the double-layered membrane). We discovered that even if the suction power is sufficiently strong, the airflow inside the hood remains minimal. Our study found that the original intubation hood’s sloped ceiling caused high-pressure areas during coughing, leading to increased droplet leakage. Modifying the hood with a curved design reduced total leakage by 36.2% and improved droplet drainage by 3204.68%. Real-time measurements confirmed that maximum leakage was 0.0536% during breathing and 0.3067% during coughing, with total leakage under 0.3%. The modified hood effectively reduces droplet leakage, enhancing both safety and procedural efficiency.
Perella et al. used CFD to analyze droplet leakage from a hood design that is most similar to our novel hood and predicted that with a suction rate above 160 L/min, leakage would be reduced to almost 0%, even in an open system [
10]. In contrast, we conducted our analysis using a lower pressure of 10 Pa, and through design modifications, predicted an improvement in removal efficiency and a reduction in leakage. We also conducted real-time droplet measurements and compared these results with the CFD analysis.
Turer et al. measured leakage using PAO particles and demonstrated that a closed system with an HEPA filter and vacuum machine leaked less than 0.01% of droplets. However, when applied to an open system or with lower suction power, their study reported leakage exceeding 11% [
20]. Compared to closed systems, which generate stronger and more concentrated airflow that may have a greater impact on the patient, open systems allow for a larger volume of air to enter but at a lower airflow velocity. This reduced intensity of airflow likely results in less impact on the patient. Additionally, it is more convenient for healthcare workers (HCWs) to perform procedures such as intubation, cardiopulmonary resuscitation, and patient monitoring using an open-type intubation hood, as opposed to a closed-type system.
Simpson et al. found that using aerosol boxes without suction increased particle exposure, particularly during coughing, with larger particles (1.0, 2.5, and 5.0 microns) spreading significantly at 300 s. Similarly, our study observed substantial leakage during the early phase of coughing, but the leakage in our study diminished more rapidly [
8]. In this study, without the use of a double-layered membrane, droplet leakage remained below 1% under both coughing and breathing conditions. For comparison, the N95 mask, which is recommended to protect HCWs from respiratory infections during patient treatment, provides a protective efficiency of 95% [
1]. Therefore, the protective effect of our novel intubation hood surpasses that of the recommended PPE. If HCWs use this novel intubation hood in conjunction with PPE during aerosol-generating procedures, the overall protective effect would be significantly enhanced.
Developing novel devices like an intubation hood is time-consuming and costly. Modifying the design, size, or conditions, such as suction power or the position of the suction hole, can be expensive and take a long time. This is a significant hurdle in developing such devices. However, using CFD during design and condition changes can be beneficial, as it allows us to find the optimal conditions before physical prototyping. Therefore, we believe that applying CFD in the development and application of such protective equipment will be very helpful, especially since it is already used to assess infection transmission probabilities in indoor environments [
16].
We also anticipate that in new pandemic situations involving respiratory infectious diseases like COVID-19, this device could be a solution for overcoming the shortage of negative pressure isolation rooms or facilities, especially during emergency procedures on patients with uncertain infection status, such as angiography, emergency deliveries, emergency endoscopy, or CPR. Indeed, during the COVID-19 pandemic, many emergency procedures were delayed due to uncertainty over the patient’s infection status [
21,
22,
23].
Although droplet leakage varied under coughing conditions and exceeded 0.3%, which is the efficiency threshold for the HEPA filter, our testing conditions were much more rigorous, using particle concentrations 105 times higher than in actual coughing scenarios. Additionally, the density of PAO (0.82–0.86 g/cm3) is lower than that of droplets generated during coughing, which are primarily composed of water (1 g/cm3). Therefore, we hypothesize that in real scenarios, the actual amount of leakage would be lower than what was observed under our experimental conditions.
The limitations of our study are as follows:
First, the CFD results and real-time measurements do not match exactly. There are differences, particularly in the lower area of the hood, where real-time measurements showed similar leakage to the upper side, whereas the CFD simulation indicated leakage primarily in the upper sections. This discrepancy may be due to the differing characteristics of the droplets in each setup. Further studies using real droplets, similar to those produced by human breathing or coughing, are needed. We are also considering using particle image velocimetry (PIV) to observe the actual movement of droplets and compare these results with the CFD analysis. But replicating real-world coughing conditions remains a challenge. It is difficult to detect evaporative fluids that do not exist under normal air conditions, and ensuring ideal sealing and isolation efficacy is complex. Additionally, using PAO oil in simulations does not perfectly mirror the behavior of real droplets. While we optimized the simulation to closely mimic human coughing, we conducted real-world tests under more extreme conditions with higher aerosol volumes to assess the hood’s performance under stringent circumstances.
Second, the protective effect of the novel intubation hood has not been fully validated under all conditions. Although minimal but significant leaks were observed, our testing conditions were much more rigorous, using particle concentrations 105 times higher than those seen in typical coughing scenarios. Additionally, the density of PAO (0.82–0.86 g/cm3) is lower than that of droplets generated during coughing, which are primarily composed of water (1 g/cm3). We hypothesize that in real scenarios, the actual leakage would be lower than that observed in our experimental conditions.
Lastly, to implement this intubation hood in clinical practice, further studies are required to prove its protective effect using real microorganisms. Additionally, feedback from HCWs and patients will be necessary to assess its practical applicability. These limitations highlight the importance of CFD optimization before real-world testing to ensure the system performs effectively under stringent conditions.


 ,
, 


