1. Introduction
The global prevalence of diabetes mellitus (DM) continues to rise, with projections estimating over 783 million cases by 2045, particularly in low- and middle-income countries [
1,
2]. Type 2 diabetes mellitus (T2DM) constitutes approximately 90% of all cases, while Type 1 diabetes mellitus (T1DM) and gestational diabetes mellitus (GDM) represent the remainder. These conditions are associated with severe complications such as nerve damage, cardiovascular issues, and an increased risk of premature death [
3,
4,
5].
DM arises from the body’s inability to produce or properly utilize insulin, leading to imbalances in BGL. Regular monitoring of BGL is crucial for managing symptoms and enhancing the quality of life [
6,
7]. However, traditional invasive methods, such as glucose meters, though accurate, are associated with pain, discomfort, and risks related to blood-borne pathogen transmission, including hepatitis and human immunodeficiency virus (HIV) [
8,
9,
10]. Although reliable, laboratory-based tests can be both costly and time-consuming [
11,
12].
Non-invasive methods for BGL prediction and DM detection, such as the analysis of tears, saliva, urine, and breath, have shown promise but face limitations in precision and sensitivity [
12,
13,
14]. Additionally, advanced techniques like radiofrequency-based methods and optical methods, such as photoplethysmography (PPG), are costly and dependent on direct sampling [
15].
Breath analysis, particularly with the integration of e-noses, has emerged as a highly promising approach. Exhaled breath contains VOCs, that serve as biomarkers, forming a unique ‘breathprint’. When these biomarkers interact with gas sensors in the e-nose, they convert chemical signals into electrical signals, reflecting the concentration of target gas molecules. Unlike advanced gas analysis techniques such as gas chromatography–mass spectrometry (GC/MS), selected ion flow tube mass spectrometry (SIFT-MS), and proton transfer reaction mass spectrometry (PTR-MS), which are more accurate but expensive and less portable, e-noses offer a cost-effective and portable alternative [
12,
13,
14,
16].
E-noses, enhanced with machine learning (ML) and deep learning (DL) models, have improved accuracy and speed in non-invasive diagnostics [
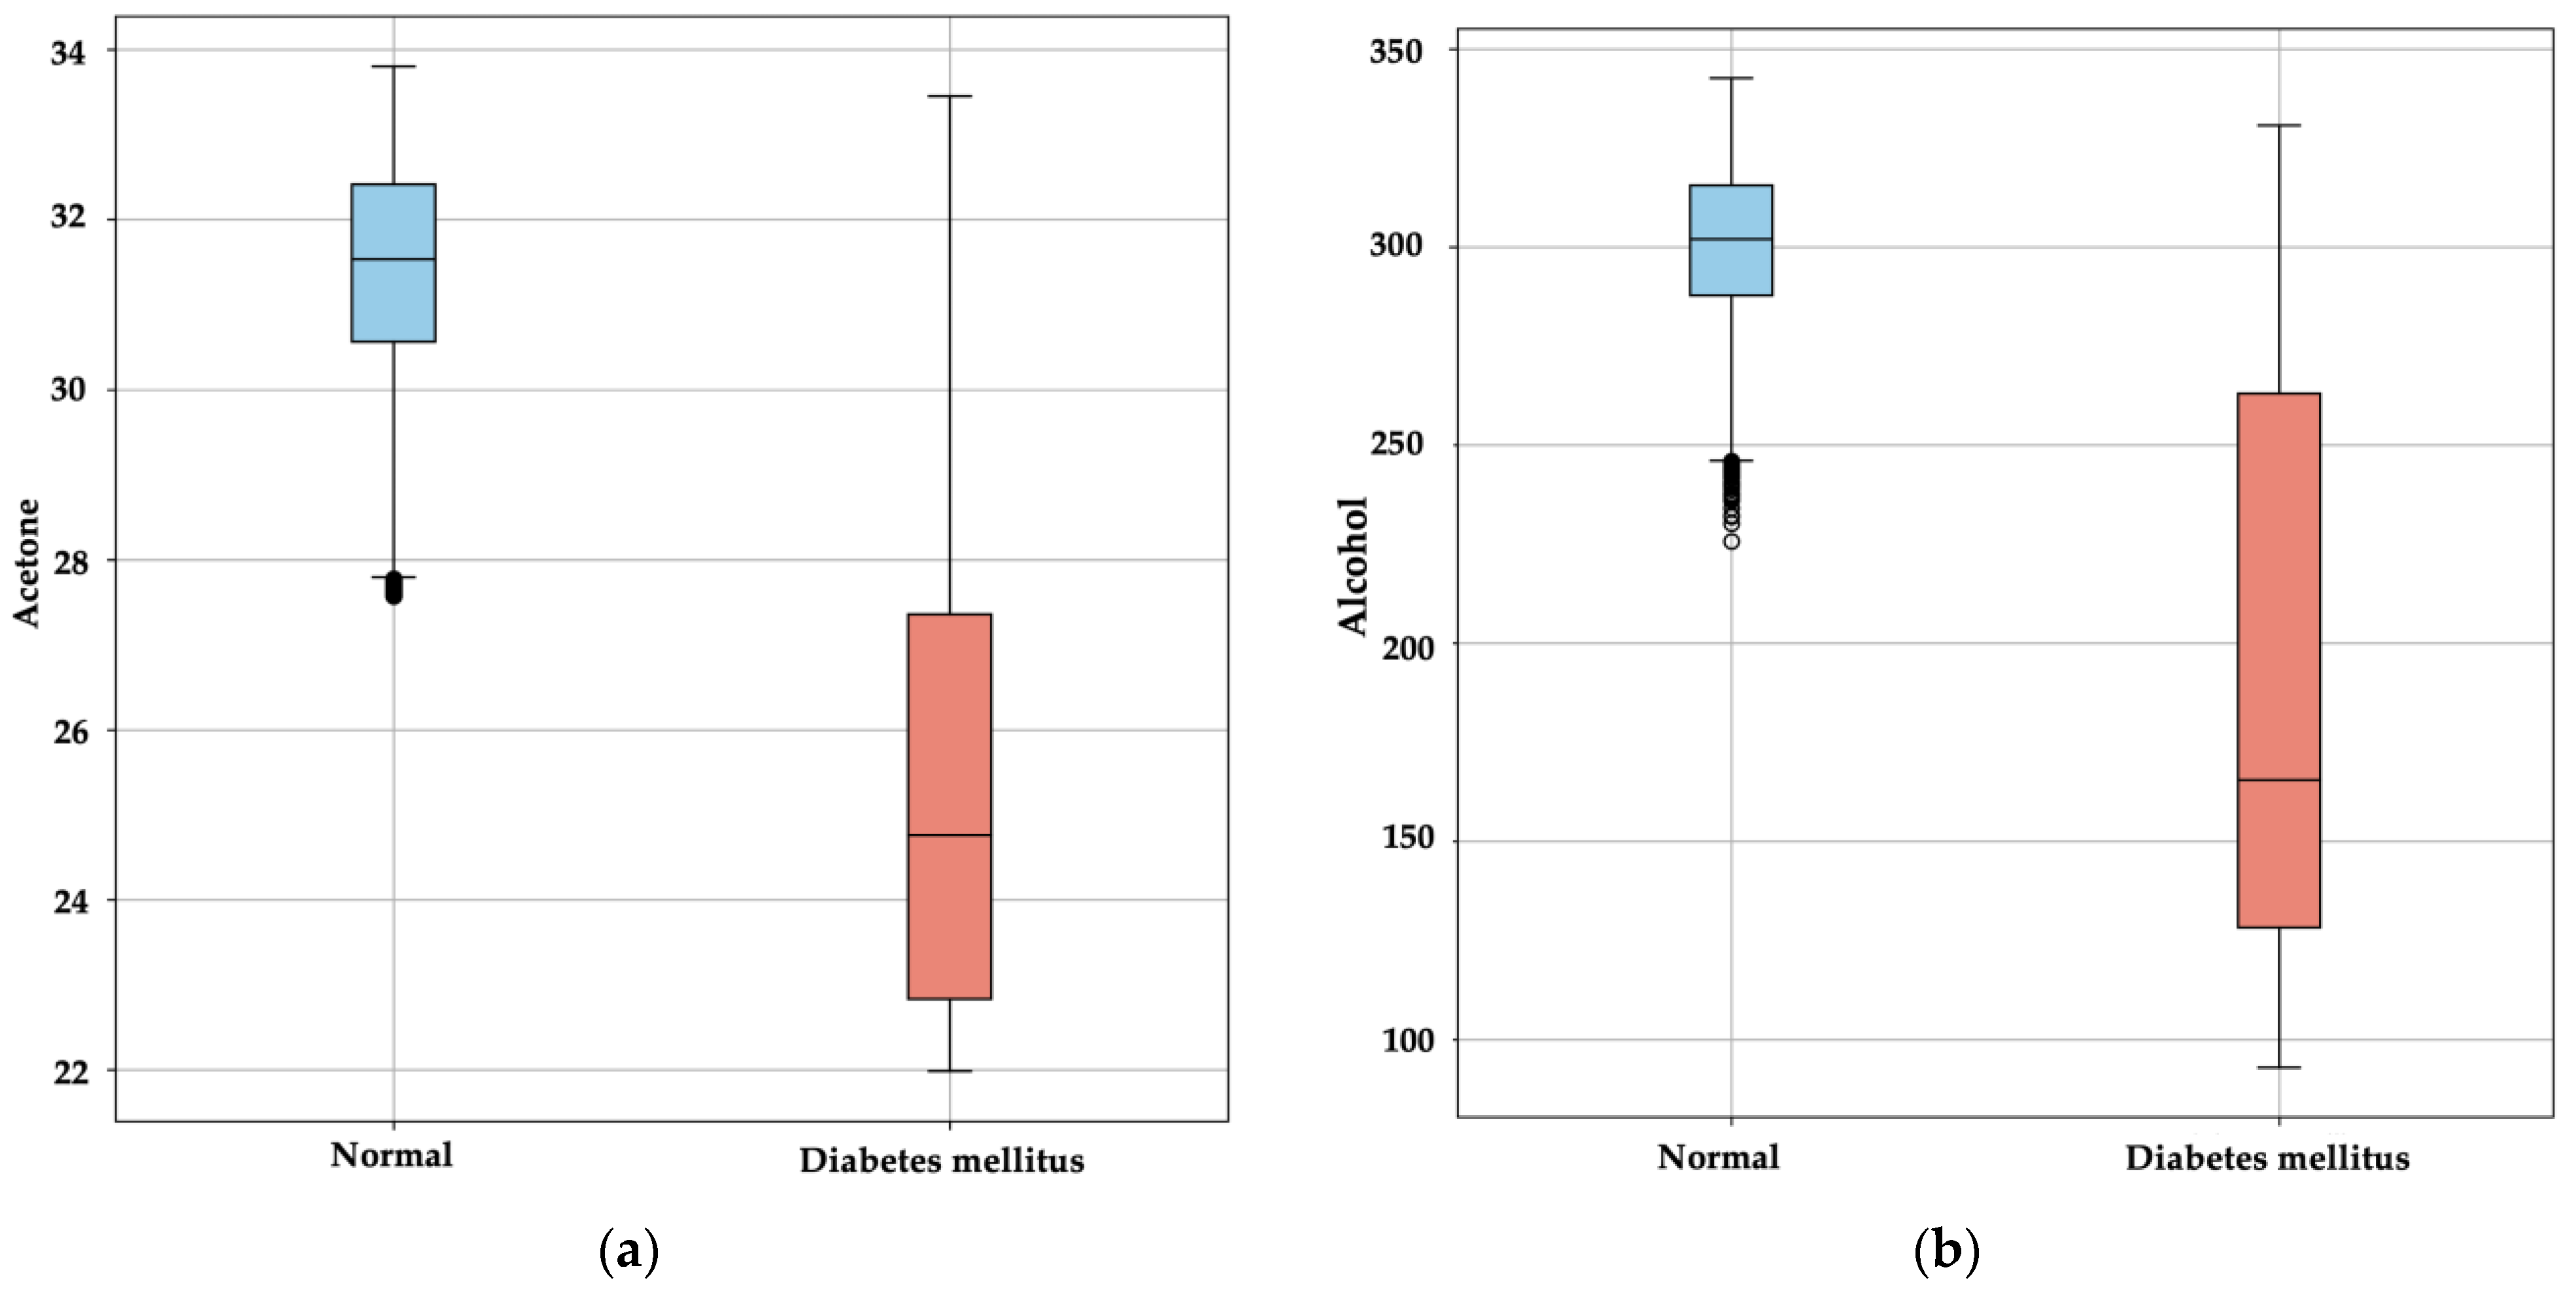
13]. Several studies have applied e-noses for detecting metabolic disorders, including DM, by analyzing elevated acetone levels in breath, a biomarker for high BGL; the inability of cells to absorb glucose leads to an abnormal increase in ketone bodies, including acetone, a volatile compound exhaled by the body [
13,
14,
17,
18,
19]. This approach offers a non-invasive, rapid diagnostic method for diabetes, showing significant promise for glucose monitoring and diabetes diagnosis.
Despite these advancements, many studies remain limited by small sample sizes and substantial variability among patients with T1DM, T2DM, and healthy controls. A larger, more diverse sample size would improve the robustness and accuracy of ML and DL models. Additionally, patient variability is significant, as pathological changes alter breath composition [
12,
13].
For example, Yan et al. achieved over 90% sensitivity and specificity for predicting BGL using sensor arrays, with a mean relative absolute error (MRAE) of 21.7% [
20]. Lekha and Suchetha employed a support vector machine (SVM) to classify acetone in breath samples, reaching accuracies of up to 98% [
21,
22].
Recent developments include DL models like convolutional neural networks (CNN), paired with SVM, achieving up to 98% accuracy in real-time classification [
23]. The combination of ML algorithms with dimensionality reduction techniques like singular value decomposition (SVD) and principal component analysis (PCA) has further improved the correlation of diabetes biomarkers [
24]. For instance, studies using a voltammetric electronic tongue (VE-tongue) with an e-nose achieved over 99% accuracy in distinguishing diabetic individuals from healthy individuals through PCA and discriminant function analysis (DFA) [
25].
Other frameworks have explored lightweight DL models. Zha et al. [
26] introduced LTNet, a neural network for classifying VOCs detected by e-noses, achieving 99.06% classification accuracy for lung cancer biomarkers using Gramian Angular Field (GAF) conversion of sensor data into images. Bhaskar et al. [
27] developed a hybrid deep neural network model (DNN) for automated T2DM detection, with their correlation neural network (CORNN) achieving 98.02% accuracy in acetone-based DM detection.
In another advancement, Sarno et al. [
28] introduced a DNN-based system that integrated e-nose technology for multi-level DM detection. This system utilized discrete wavelet transform (DWT) and PCA for signal preprocessing, achieving 96.29% classification accuracy. Their work demonstrated the superior accuracy of DNNs in classifying BGL levels and distinguishing between healthy, prediabetic, and diabetic individuals.
Ye et al. [
29] advanced the field with an e-nose system capable of precise detection and quantitative prediction of BGL through breath analysis. Employing metal oxide (MOX) sensors combined with ML models, particularly Gradient Boosting Tree (GBT), their system achieved 90.4% accuracy in BGL classification with a mean error of 0.69 mmol/L. This study emphasized the potential of e-nose systems as a non-invasive and cost-effective solution for continuous diabetes monitoring. Weng et al. [
30] presented a novel integration of e-nose technology within vehicles for real-time diabetes detection. Their system, equipped with 32 MOX sensors, optimized sensor selection using feature extraction and algorithms like Particle Swarm Optimization (PSO) and XGBoost, demonstrating similar effectiveness in BGL detection across populations with T1DM and T2DM.
Kapur et al. [
31,
32] made notable contributions to real-time diabetes detection through the development of IoT-based systems. Their DiabeticSense system, which employed a Gradient Boosting classification model with multiple sensors to analyze exhaled breath, achieved an accuracy of 86.6%, providing a low-cost, accessible solution for early diabetes detection in rural areas. Building on this, their subsequent innovation, GlucoBreath, further enhanced detection accuracy to 98.4% by leveraging a meta-model that combines Logistic Regression and AdaBoost, offering a portable and user-friendly solution for pre-diagnostic diabetes screening.
Furthermore, the integration of new breath samples into pre-trained algorithms without external computational resources and real-time predictions without cloud-based applications remains an underexplored area. To address the challenges of limited sample sizes and real-time data processing, Gudiño-Ochoa et al. developed a TinyML-powered e-nose system for non-invasive diabetes detection [
28]. Their study combines MOX sensors with ML and DL algorithms like XGBoost and DNN for VOC analysis in exhaled breath. This system processes data locally on microcontrollers, enabling real-time, on-device analysis without cloud-based applications [
33,
34,
35,
36].
Other studies have explored synthetic data generators for glucose detection [
37]. For example, Paleczek et al. validated ML algorithms for acetone detection using an artificial breath system [
16,
38]. Notably, ML models like XGBoost achieved a precision rate of 99%, while CatBoost produced an absolute error of 0.568 ppm in acetone estimation, underscoring the effectiveness of gradient boosting techniques in managing imbalanced datasets, a common challenge in medical diagnostics. Additionally, they explored the impact of high ethanol concentrations on e-nose response in diabetes detection, demonstrating the importance of considering ethanol levels in non-invasive glucose measurement devices [
38].
However, no study to date has reported the experimentation and validation of ML algorithms using synthetic samples generated from real breath tests on a diverse population, including healthy individuals and those with T1DM and T2DM. Moreover, few have addressed the integration of new breath samples into pre-trained algorithms without the need for external computing, utilizing an embedded system with microcontrollers capable of running DL models in real-time. This gap includes applications of e-nose systems for BGL prediction and classification of breath samples between healthy and diabetic individuals [
33].
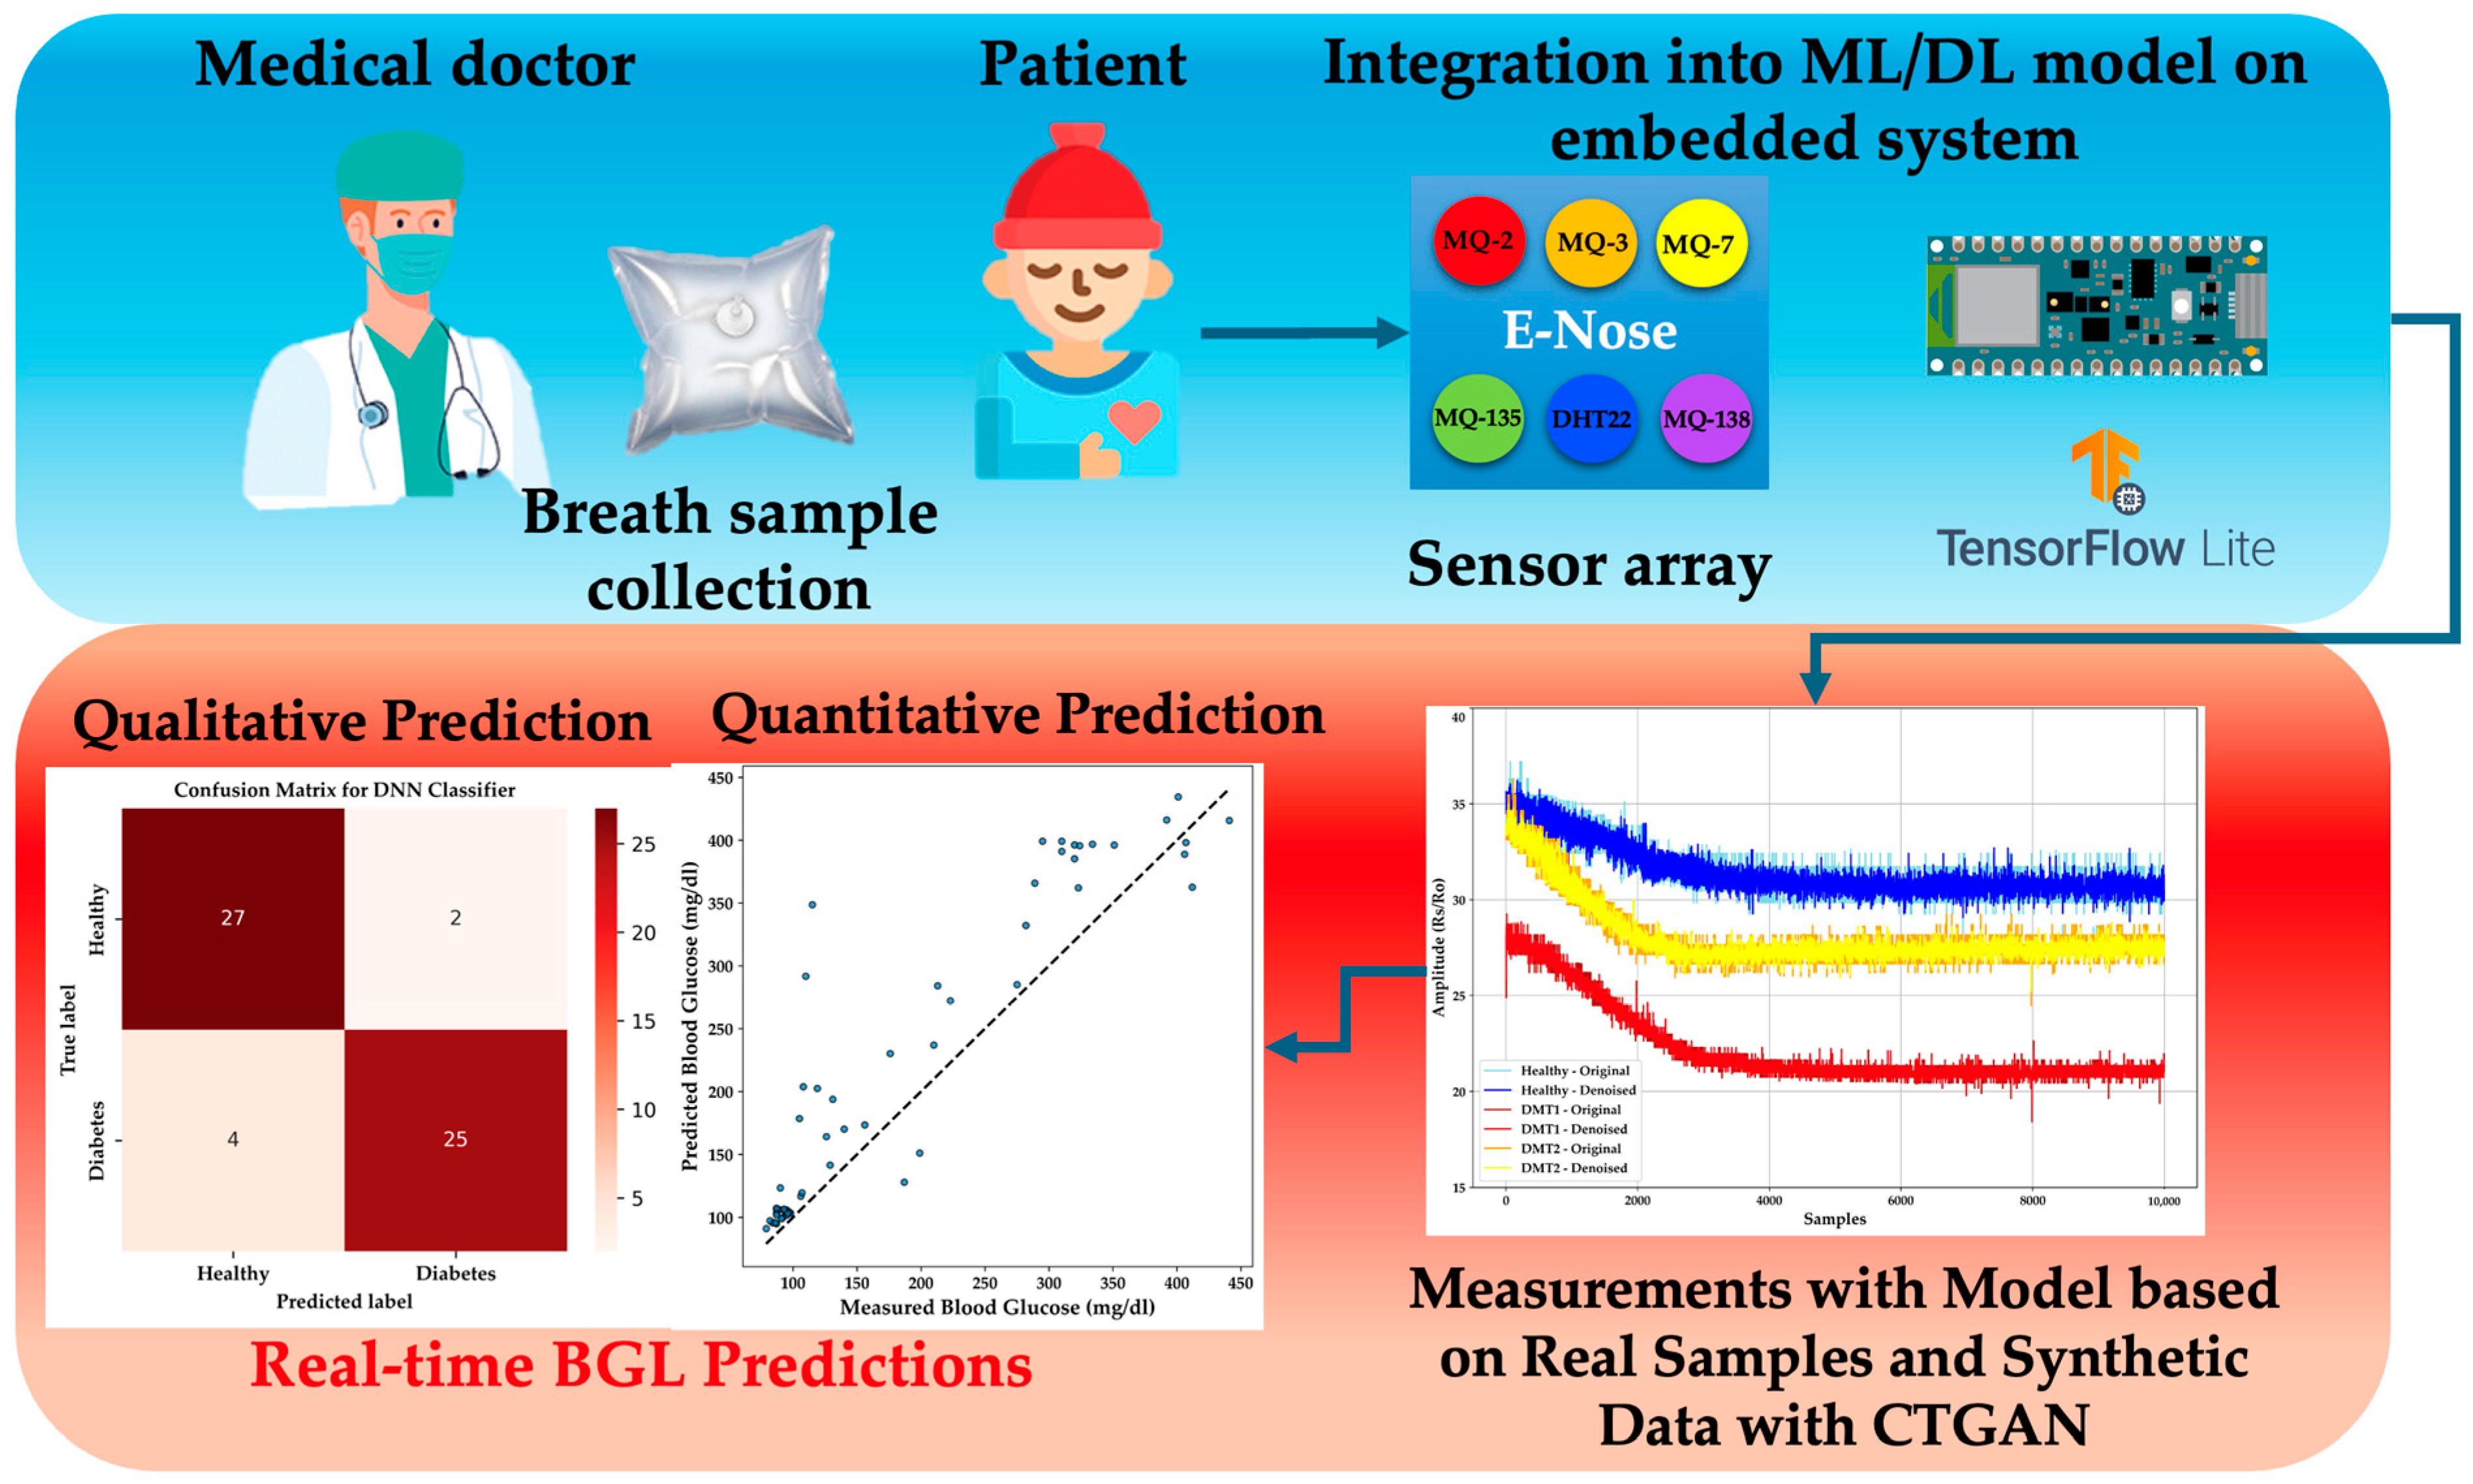
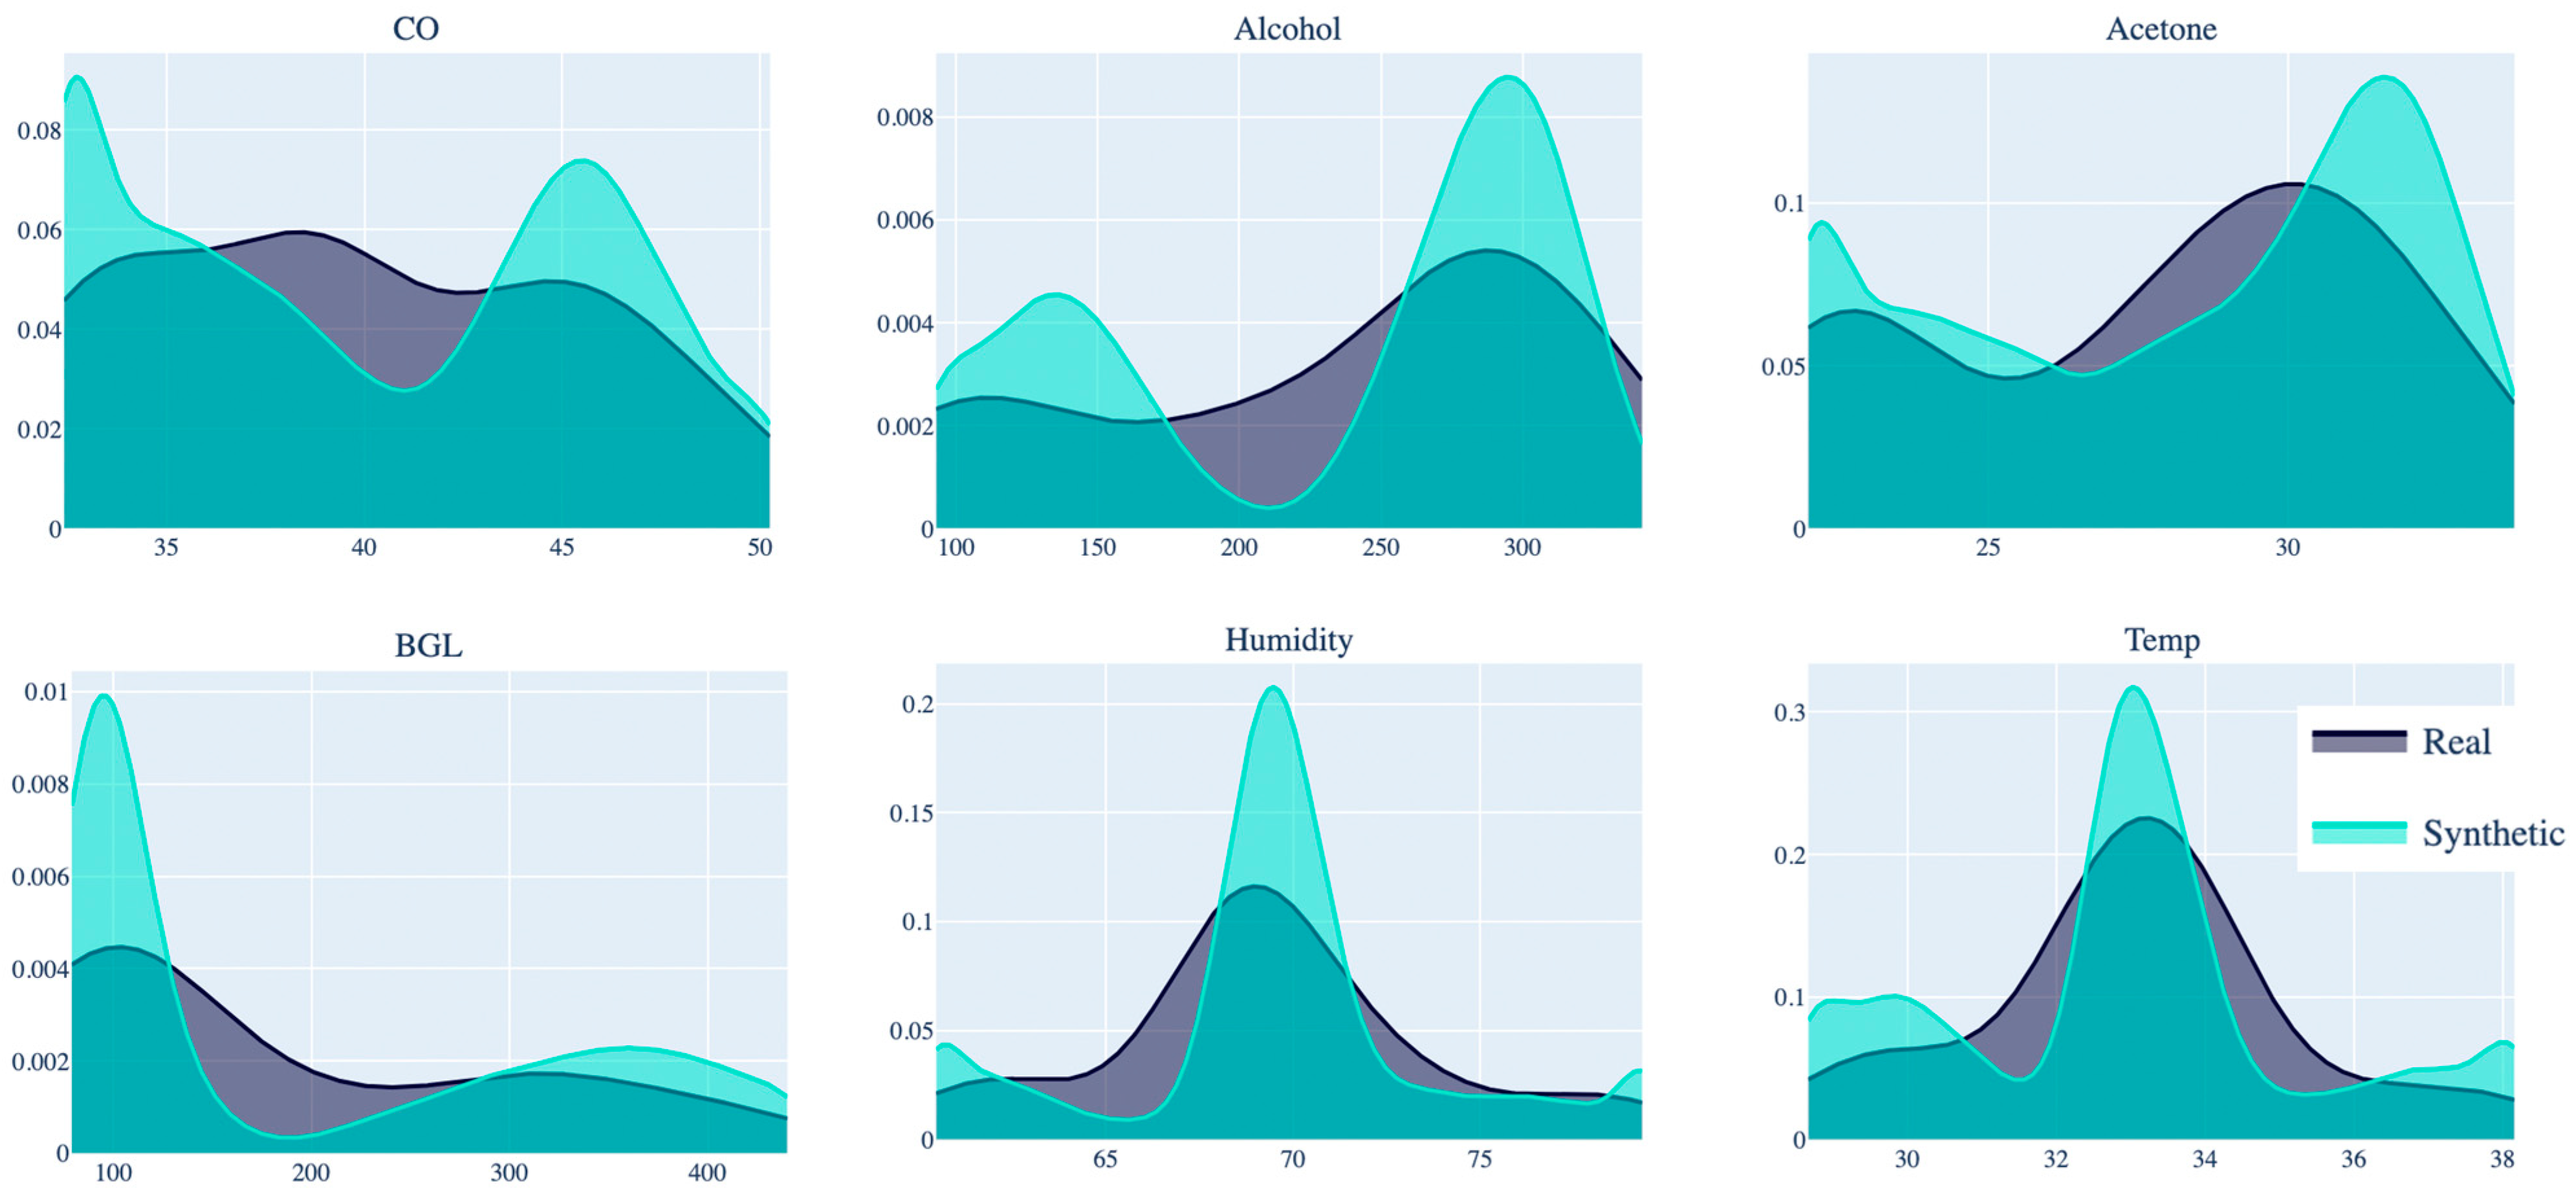
This study aims to generate synthetic data from real exhaled breath samples collected from 58 healthy and diabetic individuals. Using CTGAN, the dataset is expanded to over 14,000 samples, ensuring consistent data distribution [
39]. Several algorithms, including gradient boosting machines (XGBoost, LightGBM, and Random Forest), are evaluated for accurate detection without overfitting, based on acetone selectivity in breath samples. Finally, regression and classification methods are implemented in a portable e-nose system with TinyML technology, enabling quantitative and qualitative predictions in a new population using a DNN-compatible model.
This study paves the way for developing a portable e-nose with TinyML technology for real-time DM diagnosis through exhaled breath. By integrating synthetic and real-world data, this work offers a more comprehensive and practical solution for non-invasive diagnostics, advancing the field of diabetes monitoring and laying the groundwork for future innovations in healthcare technologies.
The key contributions of this work include the following:
Generation of new breath samples using CTGAN, ensuring that ML models are both accurate and generalizable.
Validation of ML algorithms for the classification of healthy and diabetic individuals and prediction of BGL using synthetic breath data.
Implementation of a DL model on an embedded TinyML-based e-nose system, enabling real-time, non-invasive diabetes diagnostics.
The paper is organized as follows:
Section 1 presents the introduction and literature review, outlining previous work on diabetes prediction using e-noses and exhaled breath analysis;
Section 2 describes the system, materials, and methods required for implementation, including details about breath samples collected;
Section 3 presents the results;
Section 4 discusses the limitations and challenges; and
Section 5 summarizes the findings and concludes the study.
3. Results
This section presents the outcomes of the study, focusing on the performance evaluation of various classification and regression models for predicting DM and BGL concentration, alongside their compatibility with TinyML for real-time implementation. The results include a comparative analysis of ML models such as XGBoost, Random Forest, LightGBM, and DNN, with a focus on their predictive accuracy, computational efficiency, and suitability for deployment in embedded systems. Additionally, the integration of the selected model into an Arduino Nano BLE Sense microcontroller is discussed, highlighting its application in non-invasive diabetes monitoring.
3.1. Classification Models for Qualitative Prediction of DM
The dataset was stratified into training and testing subsets, employing an 80–20 split to ensure that the models were evaluated on unseen data. A standard scaler was utilized to normalize the features, a crucial step for maintaining numerical stability and ensuring that all input features contributed equally to the model’s learning process. A comprehensive GridSearch was conducted to fine-tune the hyperparameters for each classification algorithm, optimizing for performance metrics such as accuracy, precision, recall, and F1-score [
16]. Each of these metrics provides a different perspective on how well the models are performing in distinguishing between HI and those with DM. Here are the equations for these metrics:
where
are True Positives (correctly predicted positives),
are True Negatives (correctly predicted negatives),
are False Positives (incorrectly predicted positives), and
are False Negatives (incorrectly predicted negatives). Recall, also known as sensitivity or true positive rate, measures the proportion of actual positives that are correctly identified by the model. The F1-Score is especially useful when there is an uneven class distribution, as it balances the need to avoid false positives and false negatives.
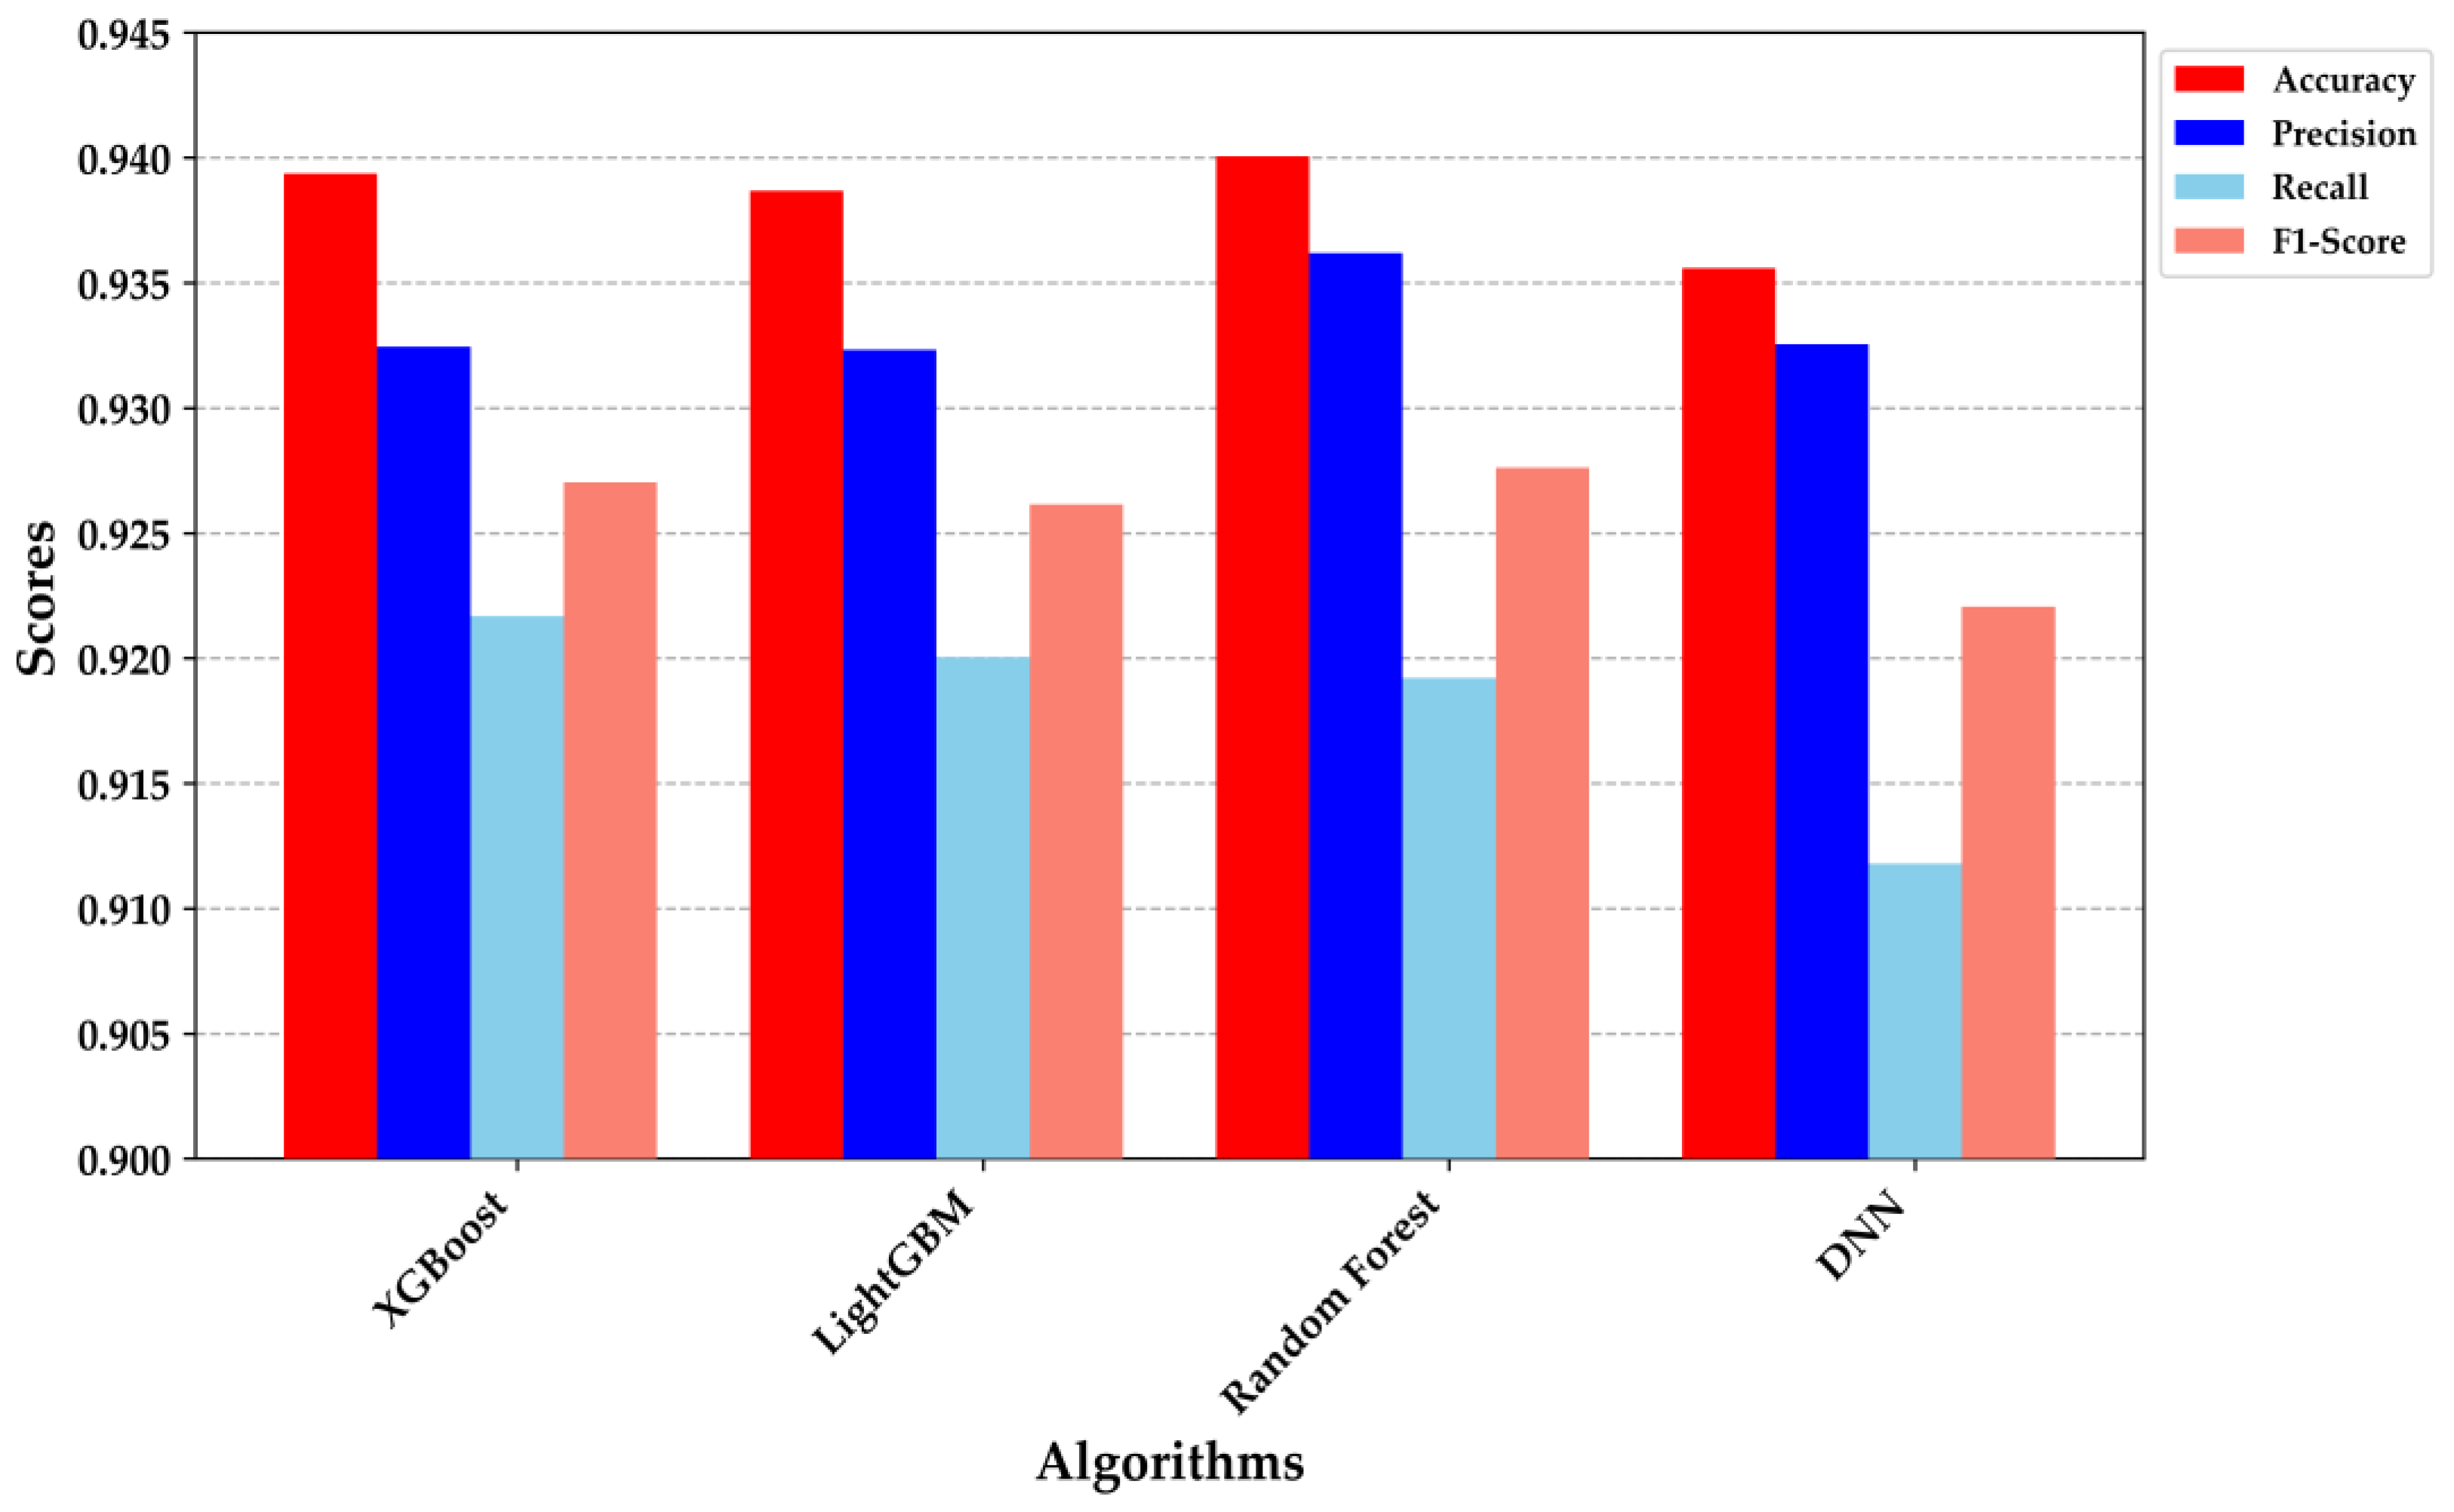
Figure 7 provides a detailed comparison of the performance metrics across the four classification models: XGBoost, LightGBM, Random Forest, and DNN. XGBoost and Random Forest demonstrated superior performance, each achieving an accuracy of approximately 0.94. The precision and recall metrics were particularly noteworthy; XGBoost exhibited a precision of 0.935 and a recall of 0.920, while Random Forest achieved a precision of 0.930 and a recall of 0.925. These results indicate that both models are highly effective at correctly identifying true positives while minimizing false negatives, making them robust for clinical decision-making scenarios.
The DNN model, despite having a slightly lower accuracy (0.930), demonstrated a well-balanced precision and recall, indicating its strong generalization capability and suitability for deployment in resource-constrained environments, such as embedded systems. The performance metrics underscore the trade-offs among different algorithms, with each excelling in specific areas. For example, while the DNN was marginally outperformed in overall accuracy, its balanced F1-score suggests it could be more reliable in situations where both false positives and false negatives are equally critical. These findings affirm the appropriateness of these models for non-invasive diabetes classification, with XGBoost and Random Forest standing out due to their superior precision and recall. The integration of such models into a TinyML framework holds promise for providing real-time, on-device decision support, thereby enhancing the scalability and accessibility of diabetes diagnostics.
The analysis of the receiver operating characteristic (ROC) and Precision–Recall curves in
Figure 8 provides valuable insights into the performance of the classification models. In
Figure 8a, the ROC curves for XGBoost, LightGBM, Random Forest, and DNN models are depicted. All models demonstrate a high area under the ROC curve (AUC), with values exceeding 0.97, indicating excellent discriminative ability in classifying between healthy individuals and those with DM. The XGBoost model exhibits the highest AUC (0.9829), closely followed by LightGBM (0.9825), Random Forest (0.9810), and DNN (0.9794). These results suggest that all models are highly effective, with XGBoost showing a slight edge in terms of overall classification performance.
Figure 8b presents the Precision–Recall curves, which are particularly informative in the context of imbalanced datasets where the proportion of positive (diabetic) cases is lower. The curves illustrate that all models maintain high precision across a wide range of recall values, reflecting their ability to minimize false positives while correctly identifying a significant portion of true positives. The DNN, despite slightly lower precision at high recall levels, shows robust performance comparable to the other models. The close overlap of the curves further emphasizes the comparable effectiveness of the models, though XGBoost and LightGBM slightly outperform in balancing precision and recall. Overall, these curves reinforce the suitability of these models for the qualitative prediction of DM, with XGBoost and LightGBM standing out as particularly reliable choices for classification tasks in this context [
16,
27,
29,
32,
33,
38].
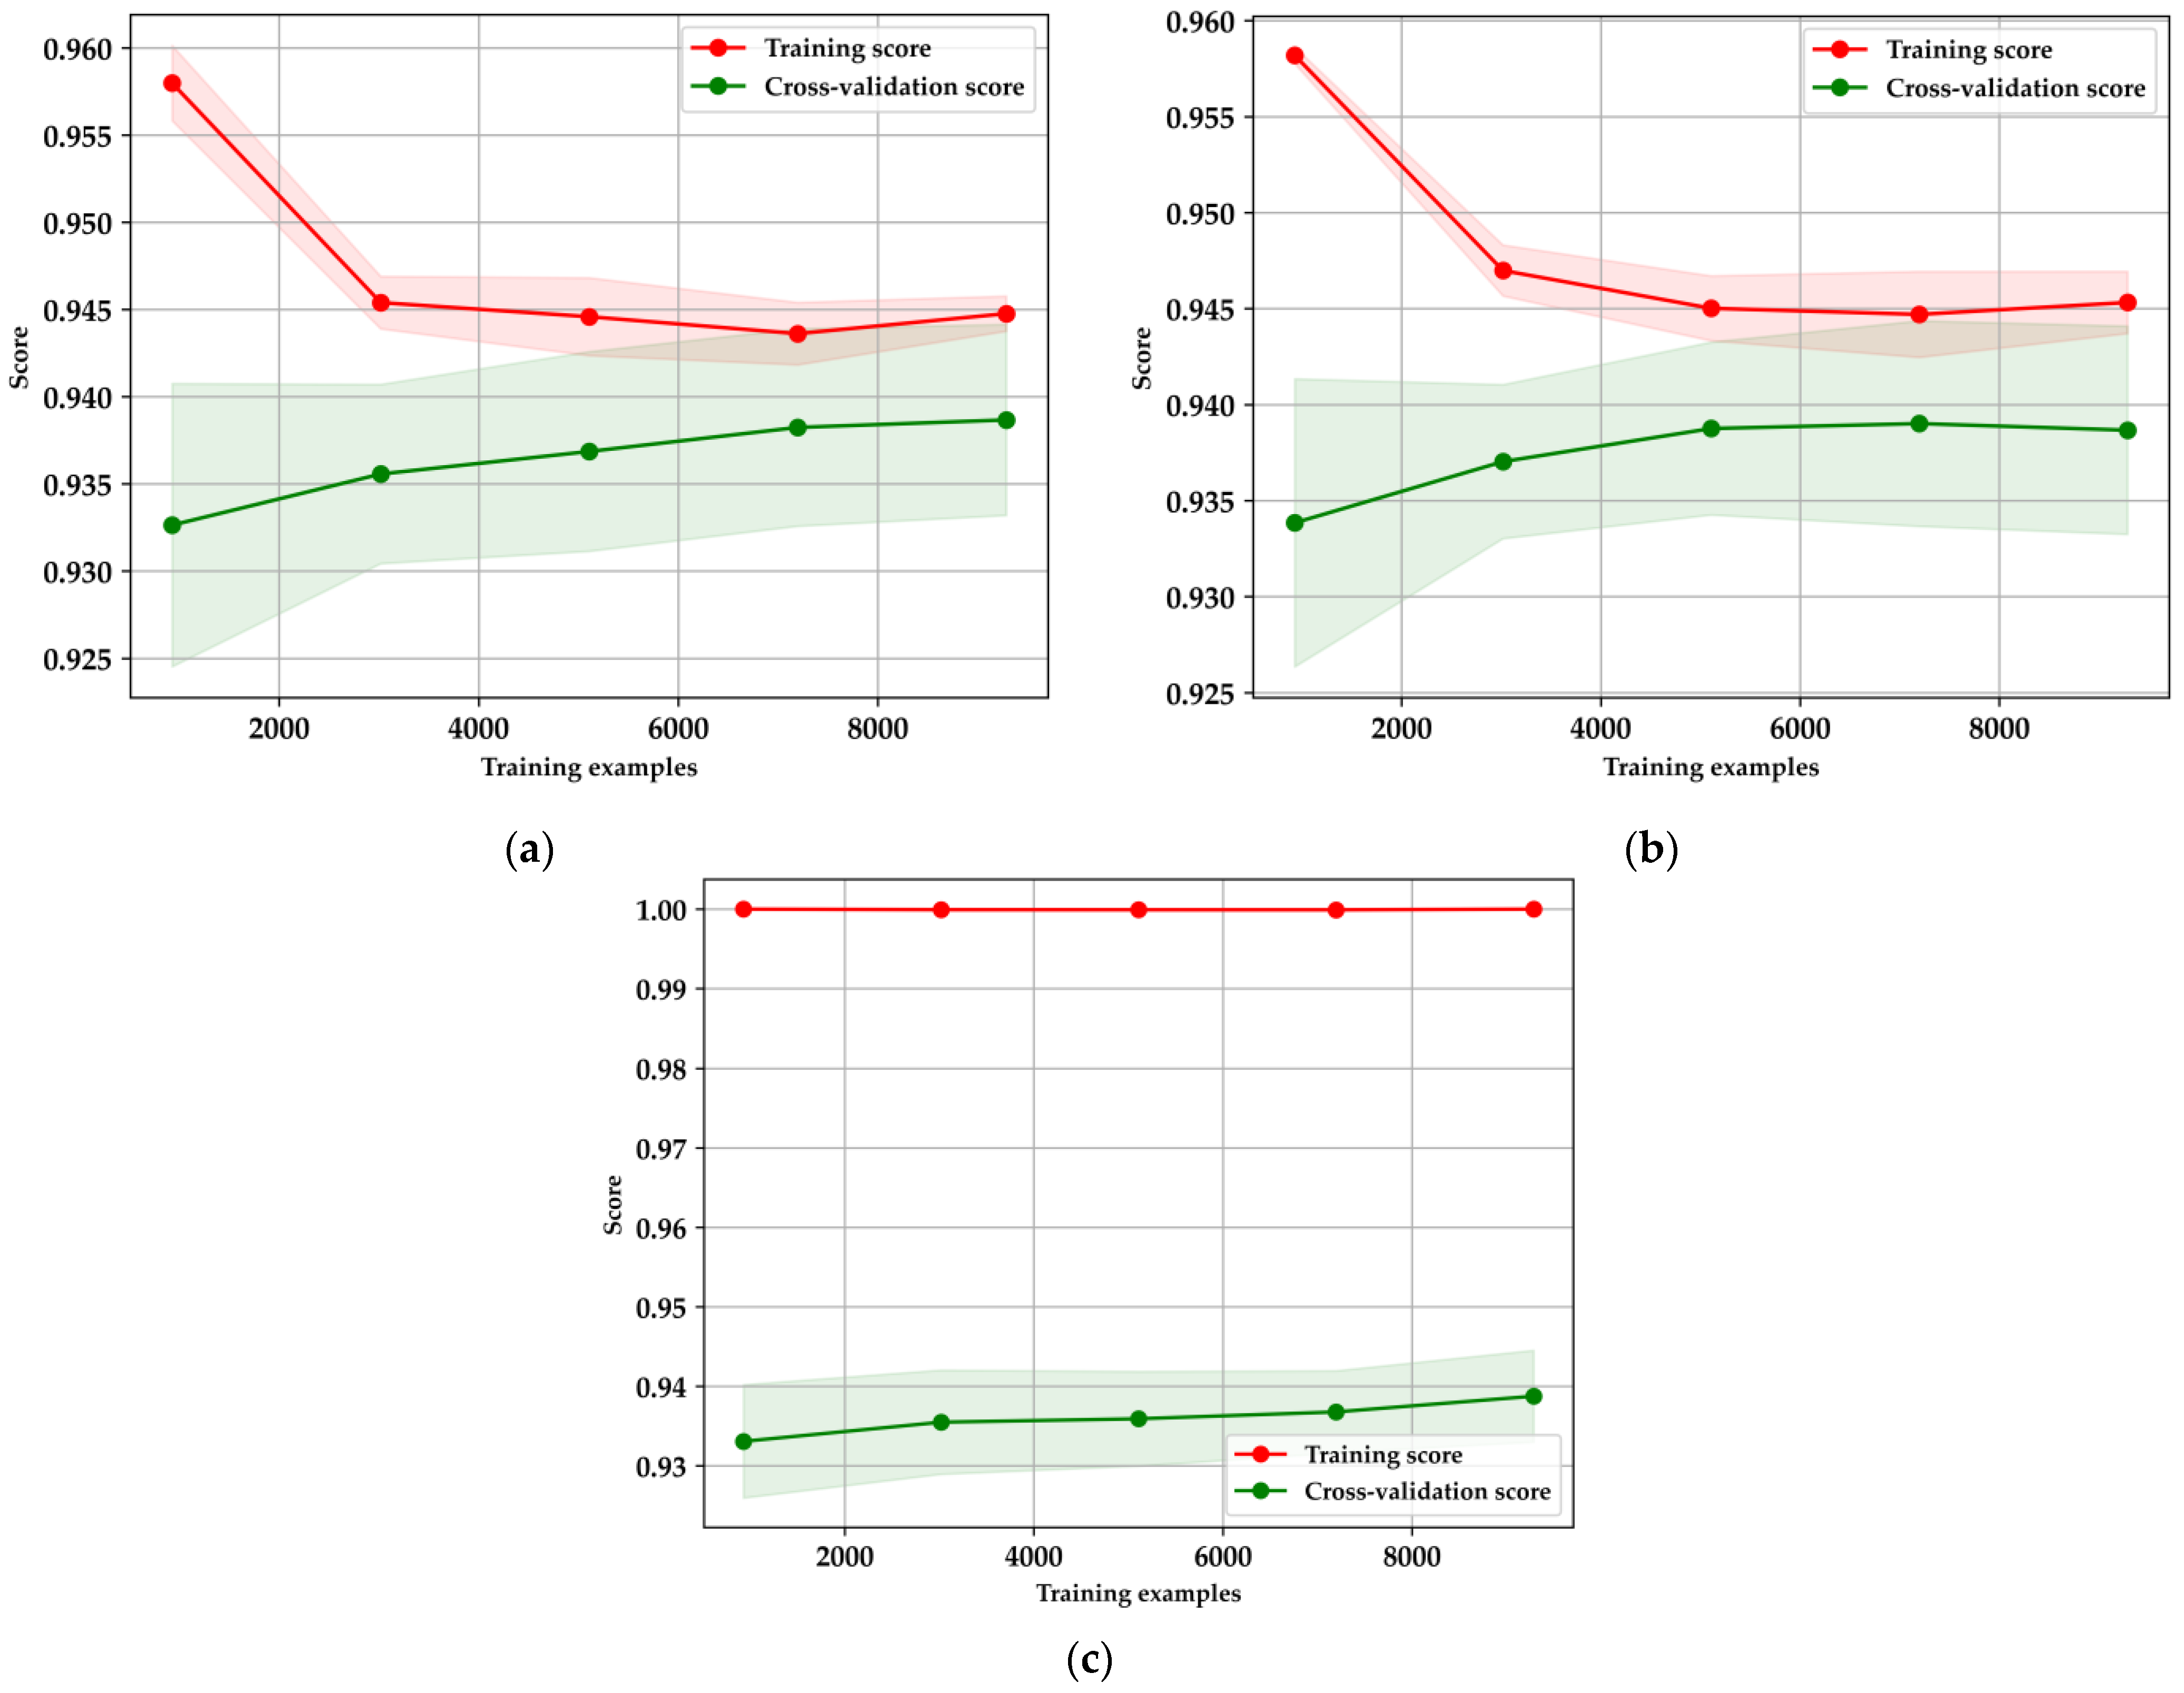
The learning curves in
Figure 9 illustrate the performance and generalization capabilities of the XGBoost, LightGBM, and Random Forest models, each evaluated using five-fold cross-validation. For XGBoost (
Figure 9a), there is a noticeable decline in the training score as the number of training examples increases, indicating reduced overfitting and a shift towards more generalized learning. Simultaneously, the cross-validation score gradually rises and stabilizes, suggesting that the model’s performance improves with more data, ultimately reaching a point of convergence. Similarly, LightGBM (
Figure 9b) follows this pattern, where the training score decreases as more data is introduced, reflecting a positive reduction in overfitting. The cross-validation score for LightGBM also shows improvement, albeit with some variance, before stabilizing, demonstrating its effectiveness in leveraging larger datasets [
16,
38,
40]. In contrast, the Random Forest model (
Figure 9c) maintains a consistently high training score, which may indicate overfitting, particularly with smaller datasets. Despite this, the cross-validation score gradually improves as more data is introduced, underscoring the model’s need for careful tuning and sufficient data to generalize effectively.
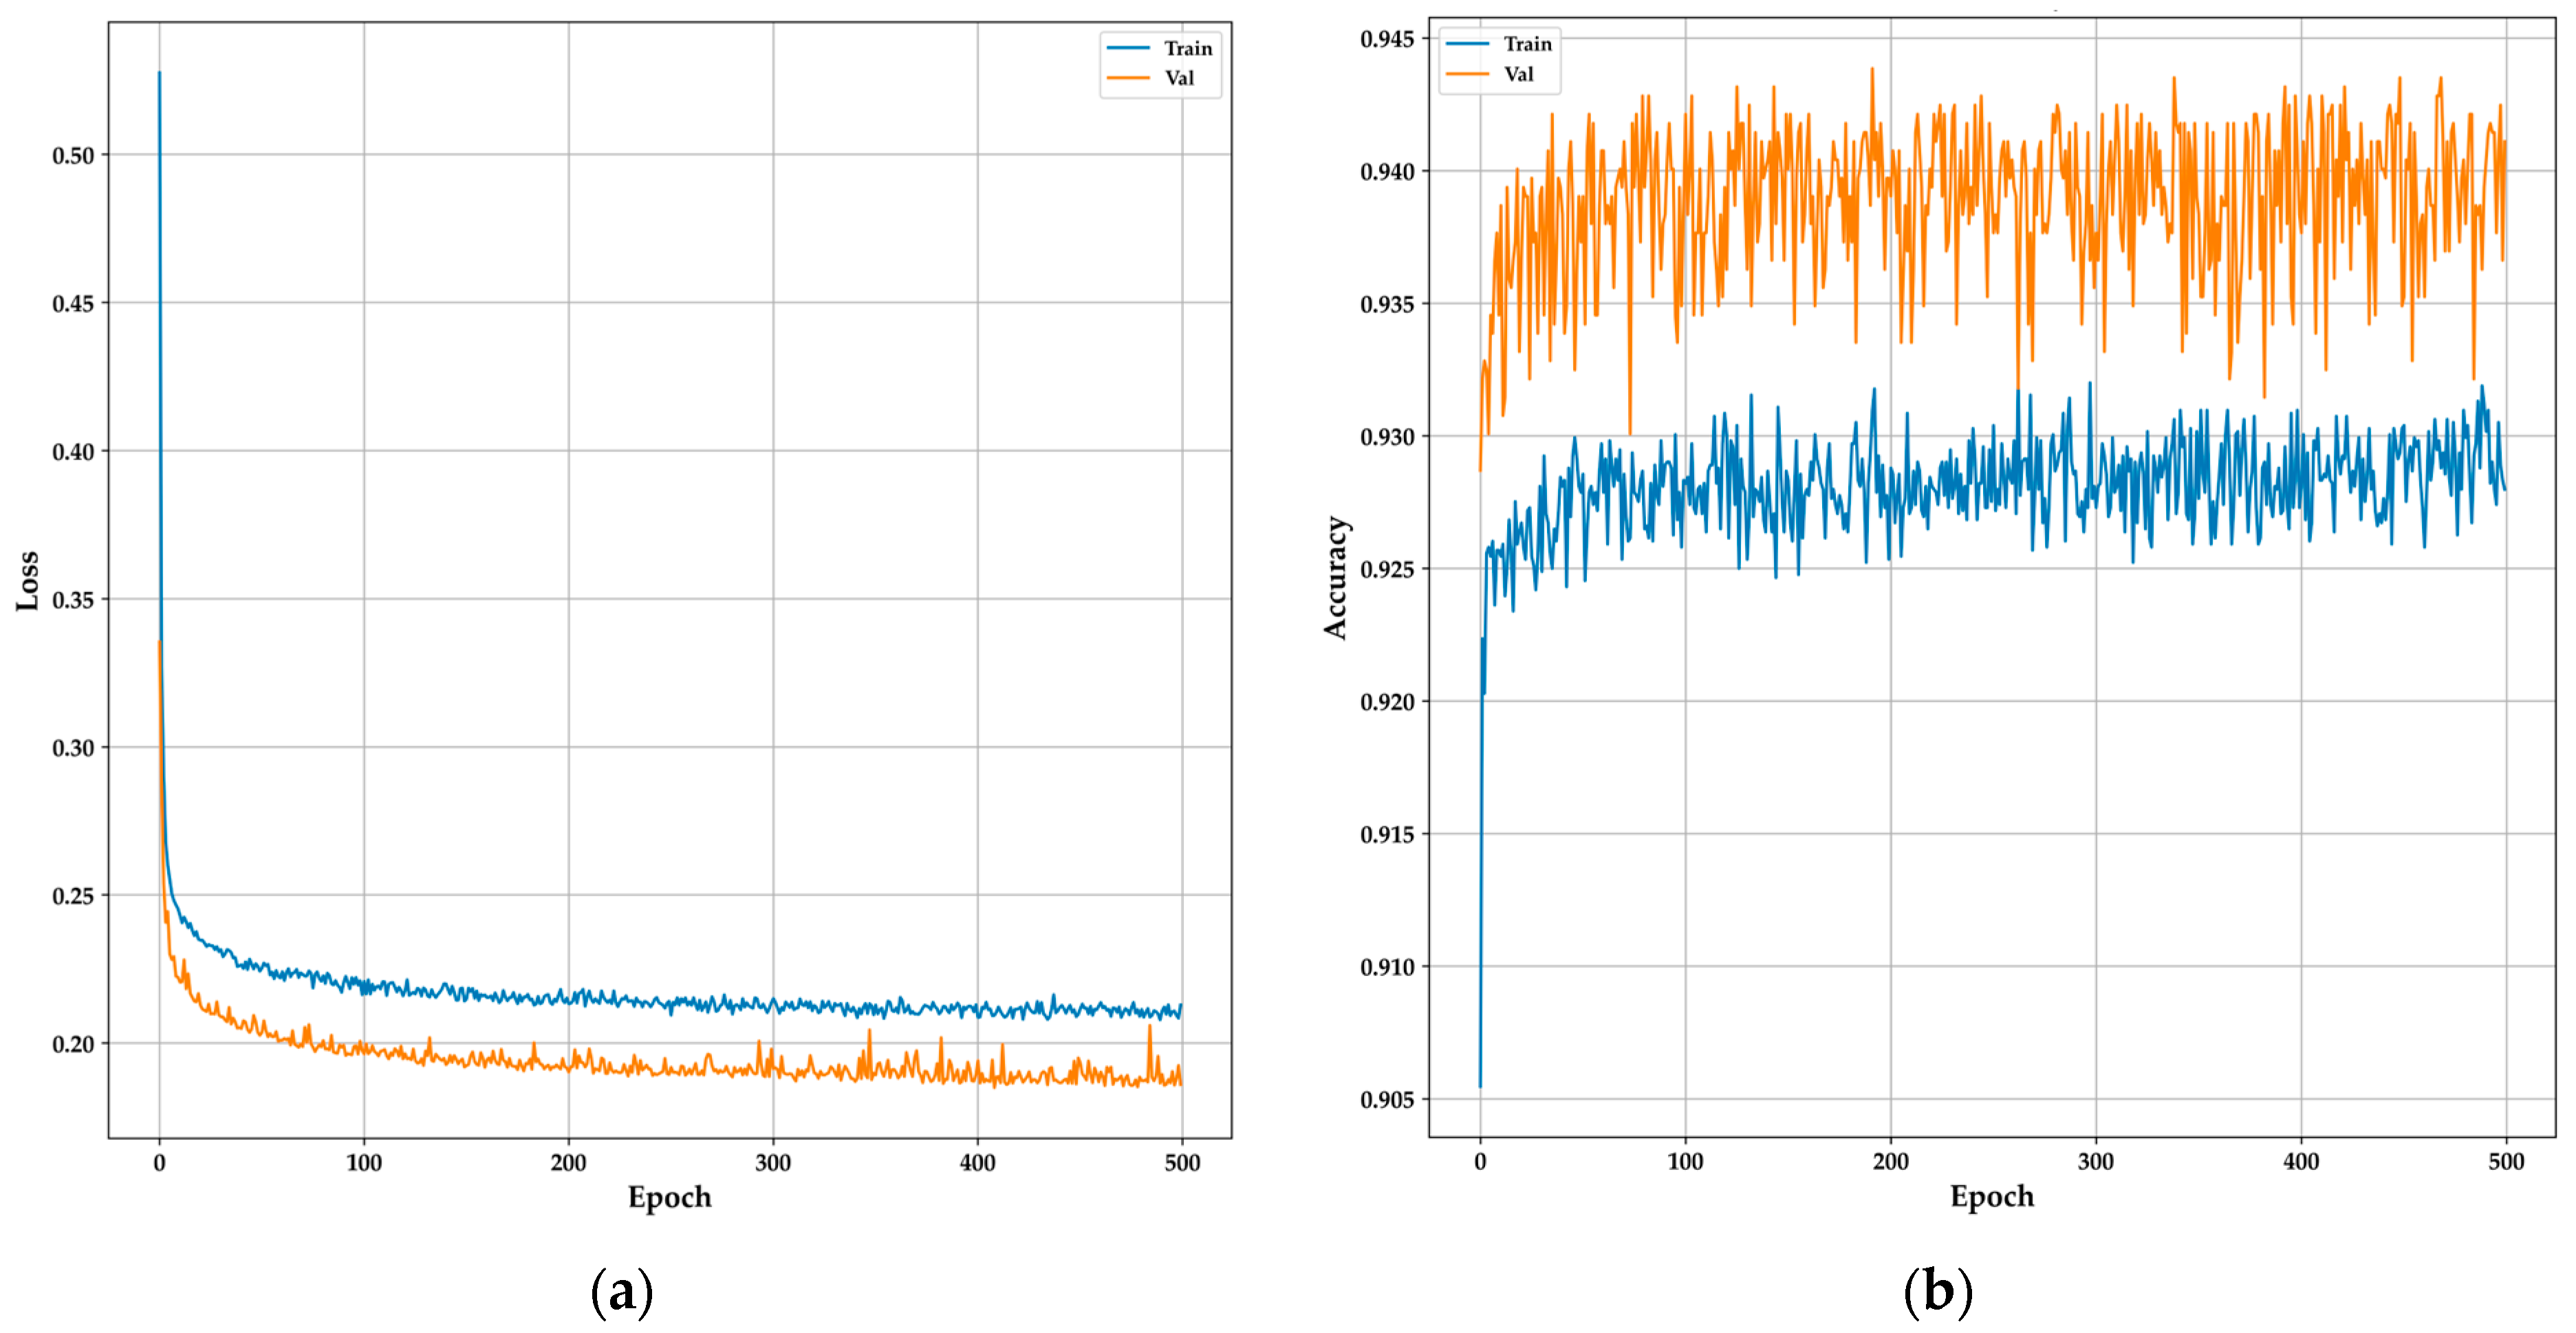
The training and validation curves for the DNN model provide a clear overview of its learning behavior and generalization capabilities over 500 epochs. The model architecture comprised an input layer with 20 units, followed by a hidden layer containing 1200 units, both employing ReLU activation functions and L1 regularization to mitigate overfitting. Additionally, the Adamax optimizer was utilized to enhance performance. Dropout layers with a 0.1 rate were added after each dense layer to further enhance generalization. The output layer consisted of a single unit with a sigmoid activation function for binary classification. In
Figure 10a, the loss curve shows a sharp initial decrease in both training and validation losses, indicating that the model is quickly learning from the data. As training progresses, the losses stabilize, with the validation loss consistently lower than the training loss, suggesting strong generalization without overfitting.
Figure 10b, depicting the accuracy curves, reveals that the training accuracy gradually improves, stabilizing around 93%, while the validation accuracy consistently remains higher, around 94%. This consistent performance across both curves indicates that the DNN model effectively captures the essential features for accurate classification, making it a reliable candidate for real-time, non-invasive diabetes monitoring in resource-constrained environments like TinyML-powered e-nose systems, as demonstrated in similar studies with DNN [
28,
33].
The confusion matrices in
Figure 11 illustrate the classification performance of four ML models—XGBoost, DNN, LightGBM, and Random Forest—used to distinguish between healthy individuals and those with DM. XGBoost (
Figure 11a) achieves strong accuracy with 1609 true positives and 1118 true negatives, but it shows 81 false positives and 95 false negatives, indicating room for improvement in minimizing false negatives. The DNN model (
Figure 11b) demonstrates a balanced classification with 1610 true positives and 1106 true negatives but has slightly more false negatives (107), which suggests it might struggle with borderline cases. LightGBM (
Figure 11c) performs similarly to XGBoost, with 1609 true positives and 1116 true negatives, along with 81 false positives and 97 false negatives, showing robustness in classification. Random Forest (
Figure 11d) exhibits the highest true positive rate with 1614 true positives and 1115 true negatives, and the lowest false positives (76), making it particularly effective in correctly identifying healthy individuals while maintaining a relatively low false negative rate. Overall, while all models demonstrate high accuracy, Random Forest and XGBoost slightly outperform the others in minimizing false negatives, which is critical in medical diagnostics where missed diagnoses can have serious implications.
3.2. Regression Models for Prediction of BGL Concentration
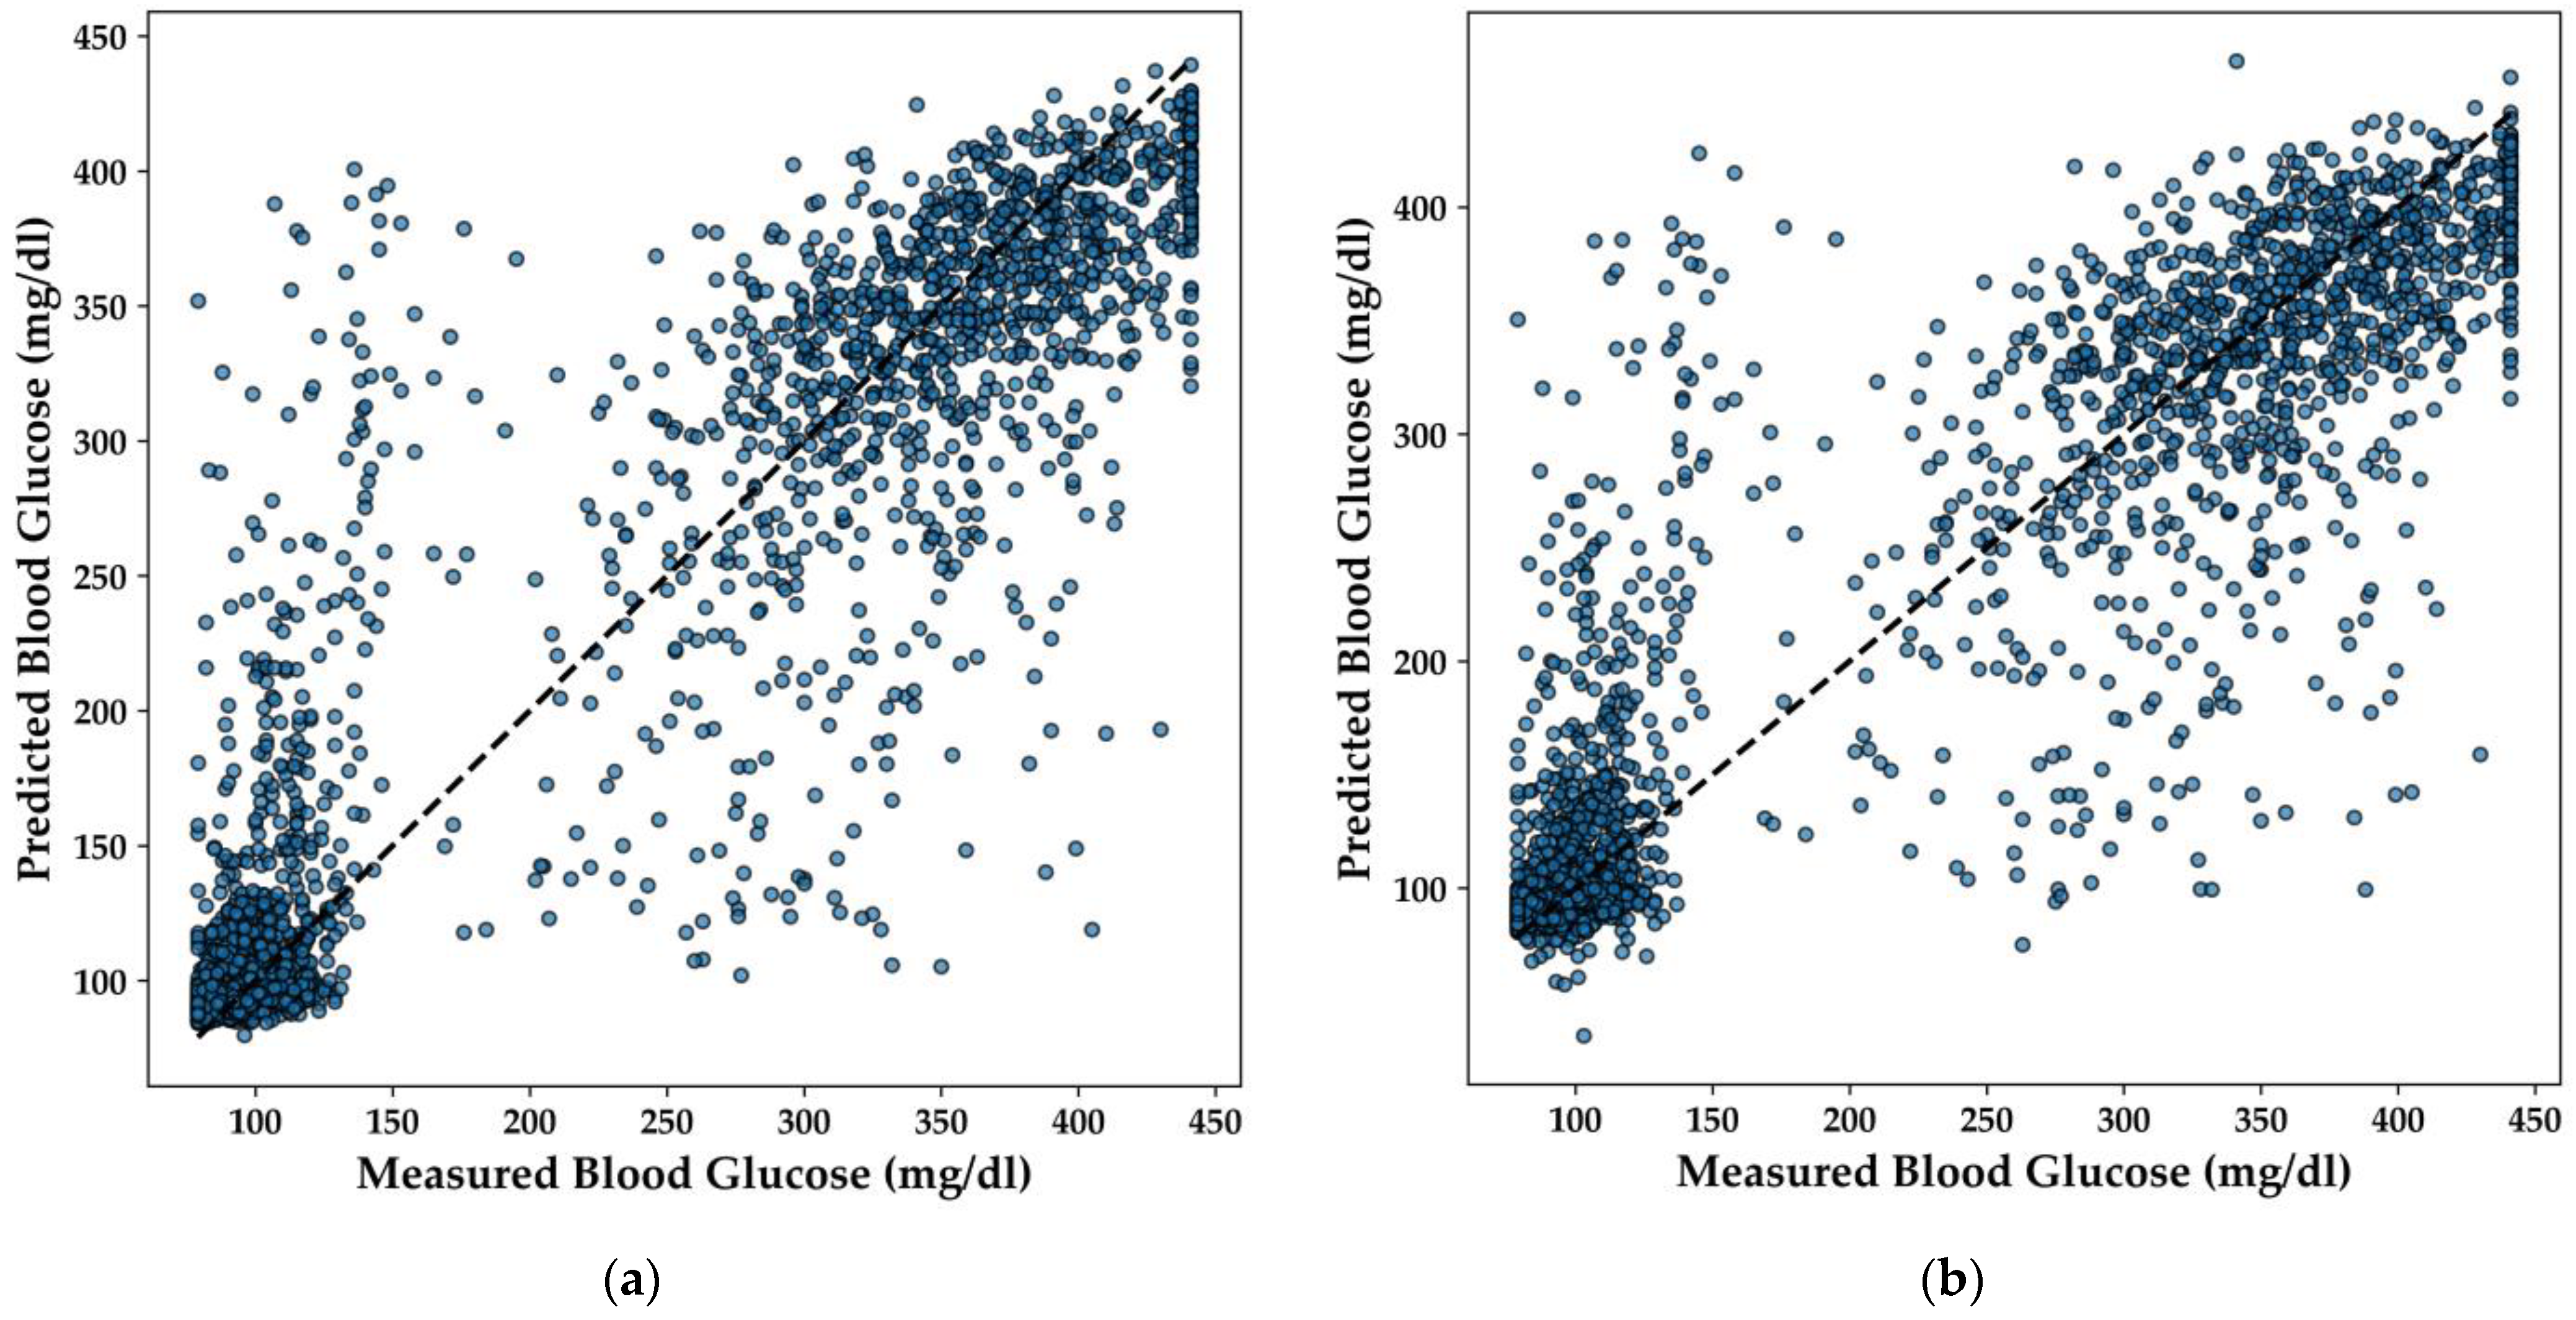
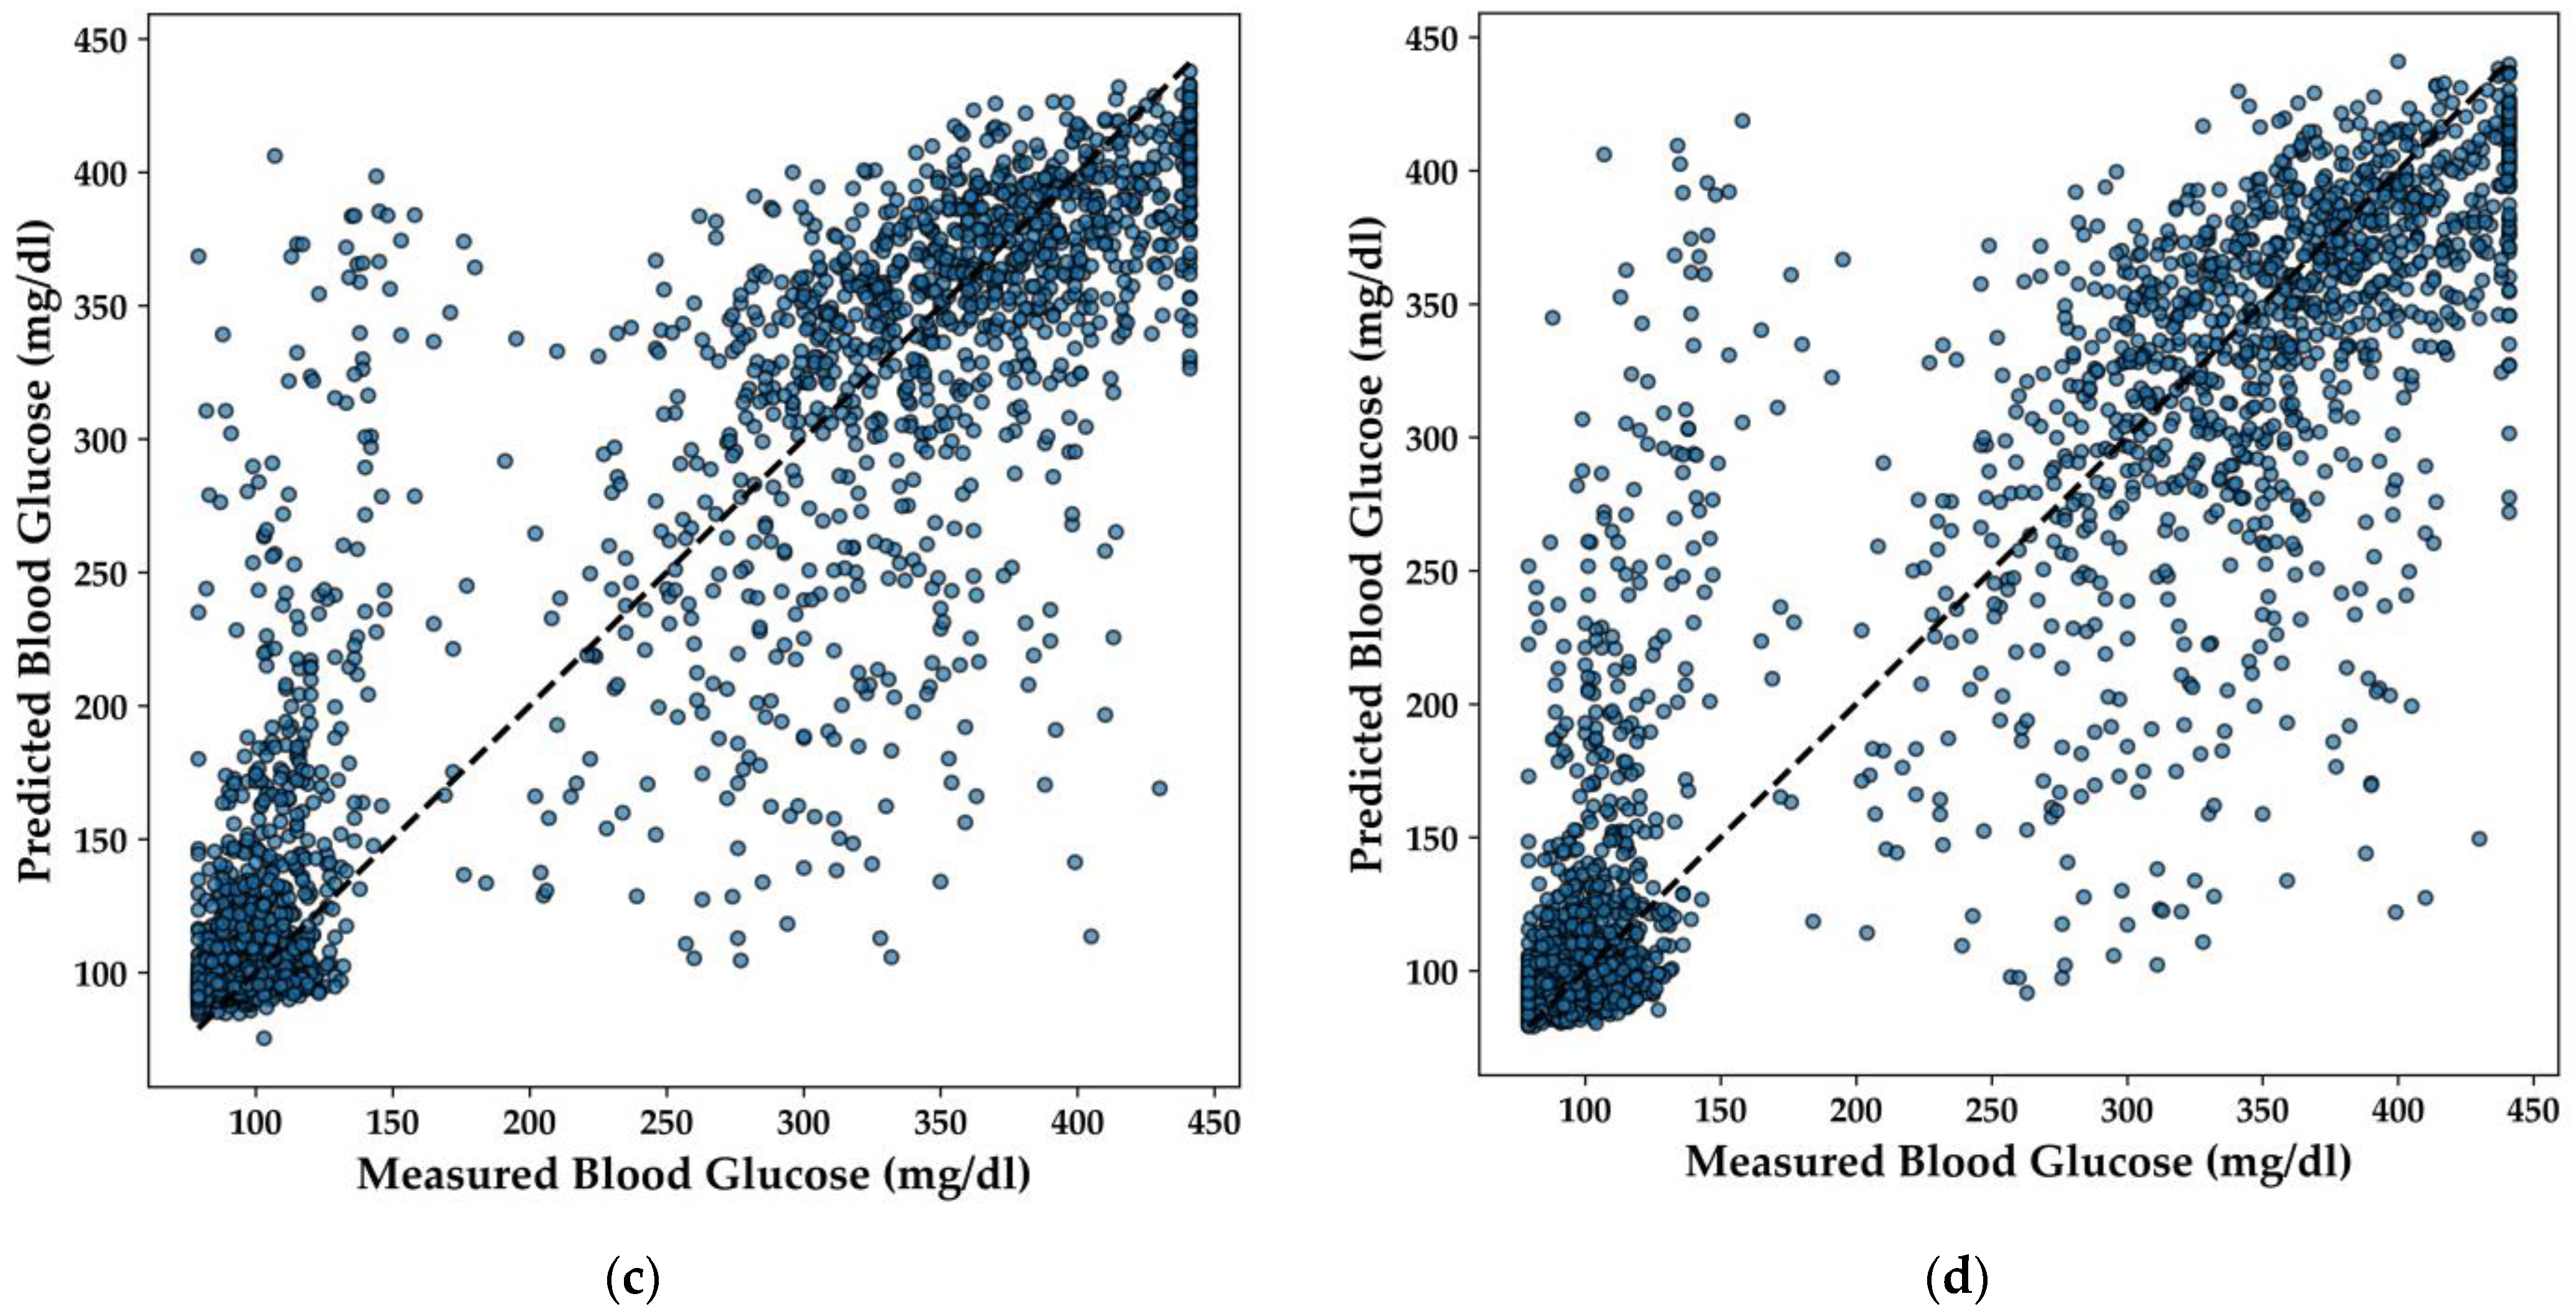
In this section, the performance of various regression models for predicting BGL is analyzed, with a particular focus on the LightGBM, Extra Trees, XGBoost, and DNN models. The scatter plots in
Figure 12 illustrate the correlation between the predicted and measured BGL concentrations for each model.
The LightGBM model (
Figure 12a) demonstrates a strong linear relationship between predicted and actual BGL values, with predictions closely clustering around the line of perfect agreement. This indicates that the model effectively captures the underlying patterns in the data, yielding accurate predictions across a range of BGL values.
Similarly, the Extra Trees model (
Figure 12b) shows a high degree of accuracy, with the majority of points aligning well with the diagonal line. The distribution of points suggests that the model handles both high and low BGL values effectively, offering balanced performance across the dataset. The XGBoost model (
Figure 12c) also exhibits a strong predictive capacity, with points tightly clustered around the line of perfect agreement. This model’s robustness is evident, as it maintains high accuracy even in areas where the data is more dispersed, ensuring reliable predictions for BGL concentrations.
Lastly, the DNN model (
Figure 12d) demonstrates consistent performance, with predicted values closely matching the actual measurements. The scatter plot indicates that the model effectively generalizes across different BGL levels, making it a suitable candidate for integration into real-time, non-invasive diabetes monitoring systems.
Overall, these regression models exhibit strong predictive performance, with each model offering distinct advantages that could be leveraged depending on the specific requirements of the application. The DNN model, in particular, stands out for its capacity to generalize across the data, a characteristic essential for deployment in resource-constrained environments like TinyML-powered e-nose systems.
To complement the analysis of the regression models for predicting BGL, a detailed comparison of the models in terms of their R
2 score, Mean Absolute Error (MAE), and training time is provided. As shown in
Table 3, the LightGBM model outperformed the others with an R
2 score of 0.86 and the lowest MAE of 28.35 mg/dL, while also having the fastest training time of only 0.12 s. In contrast, the DNN took significantly longer to train—623.41 s—while achieving an R
2 score of 0.84 and an MAE of 30.13 mg/dL. The Extra Trees and XGBoost models both performed similarly with R
2 scores of 0.84, but the Extra Trees model exhibited a slightly higher MAE of 30.23 mg/dL compared to XGBoost’s 29.82 mg/dL. This detailed comparison highlights the trade-offs between model accuracy, error, and computational efficiency, emphasizing the strengths of LightGBM in this application.
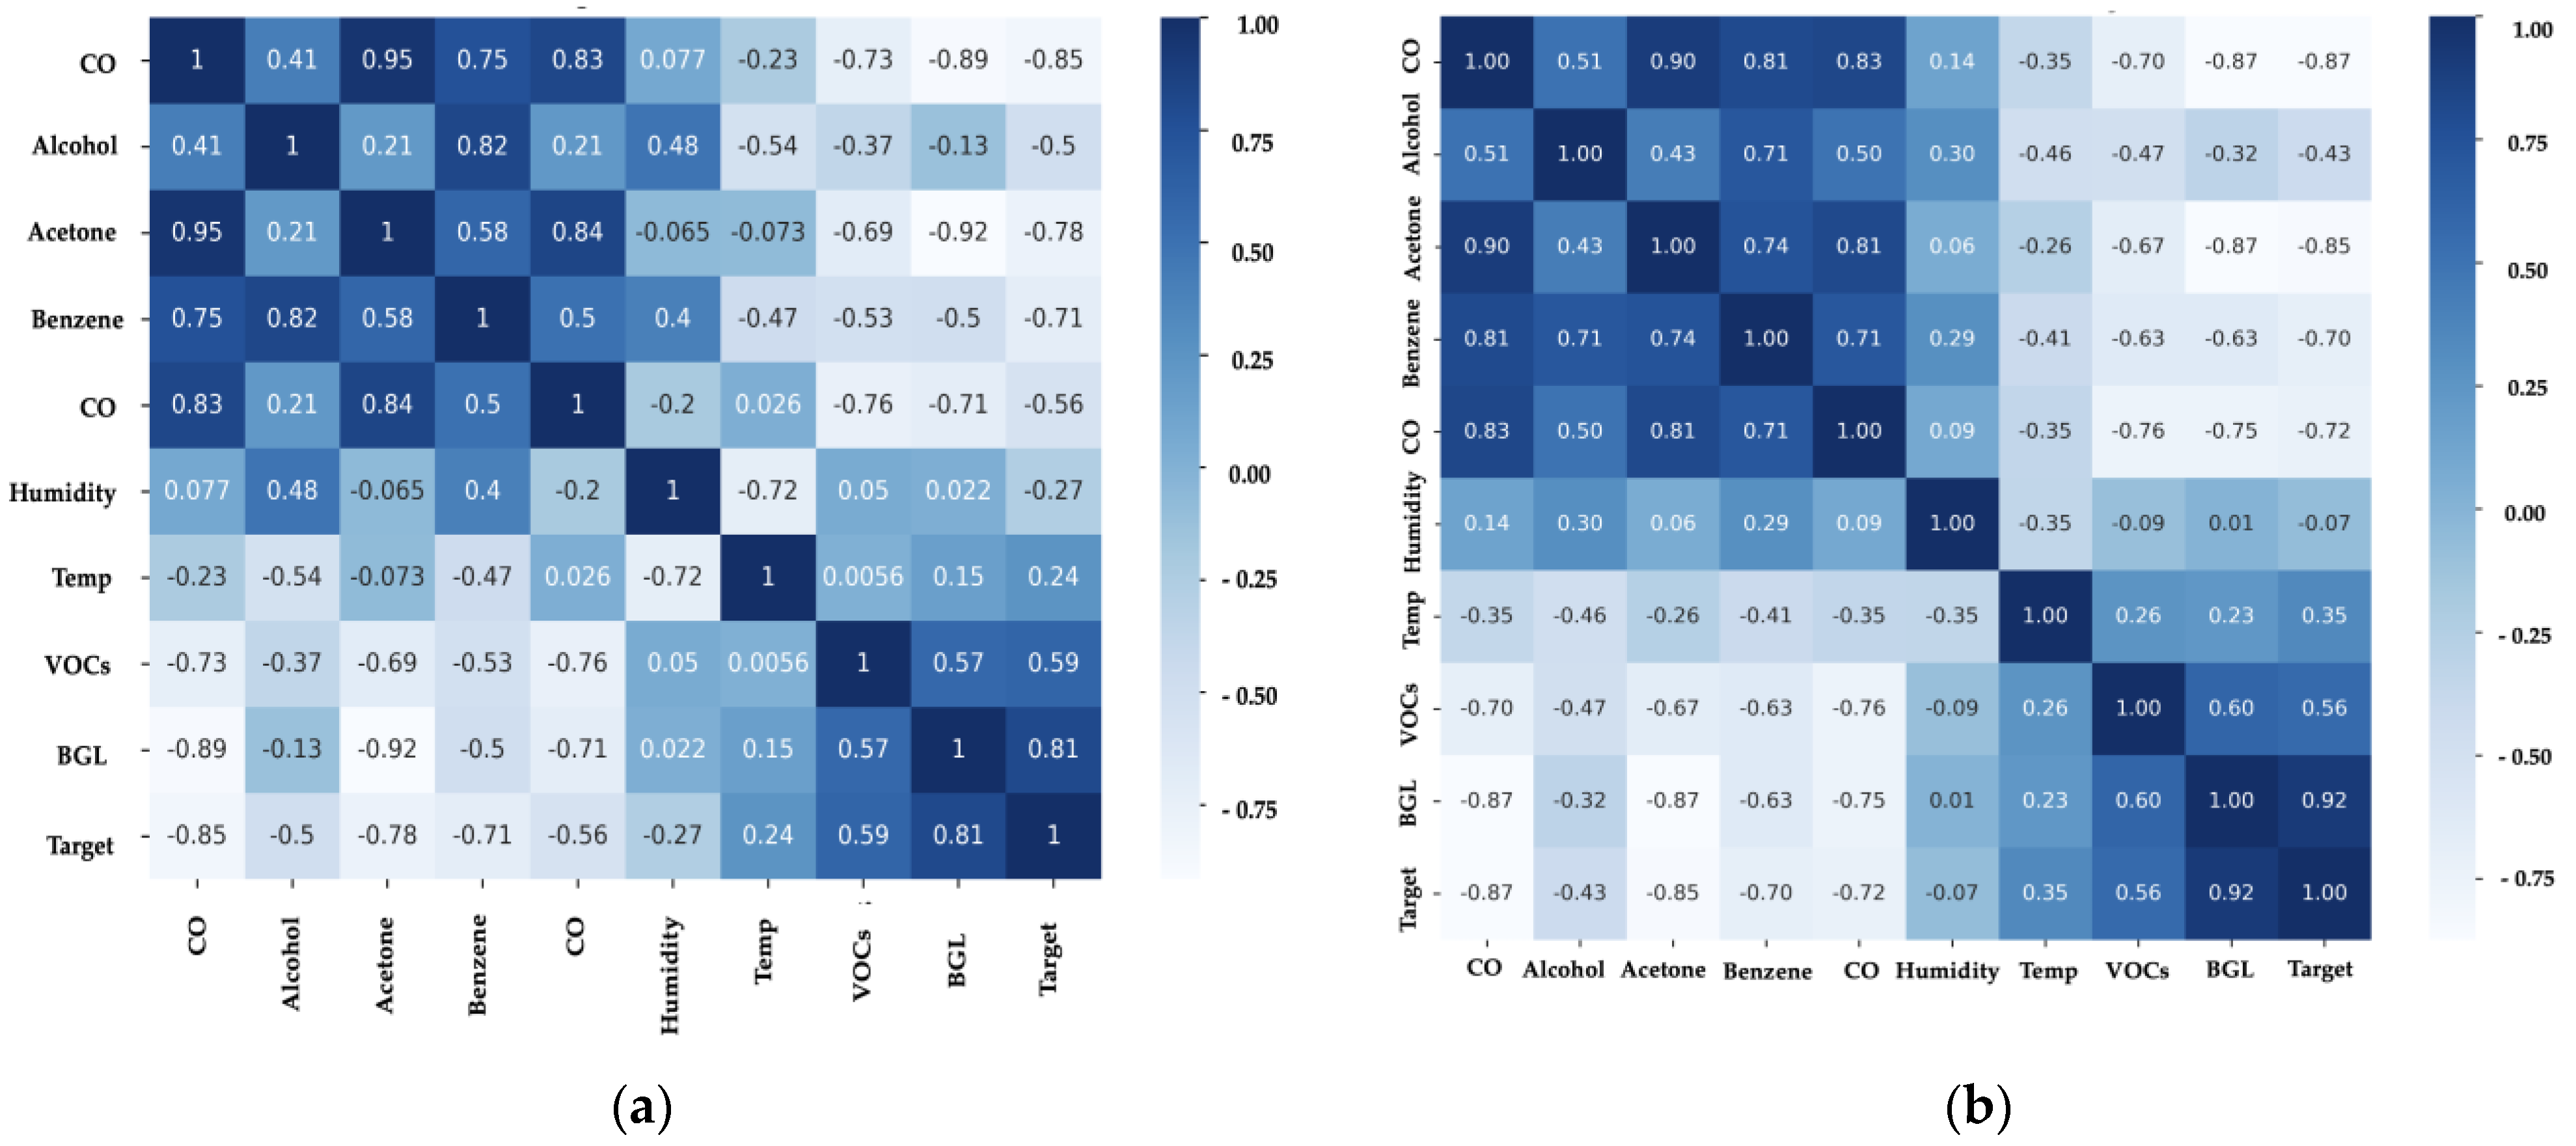
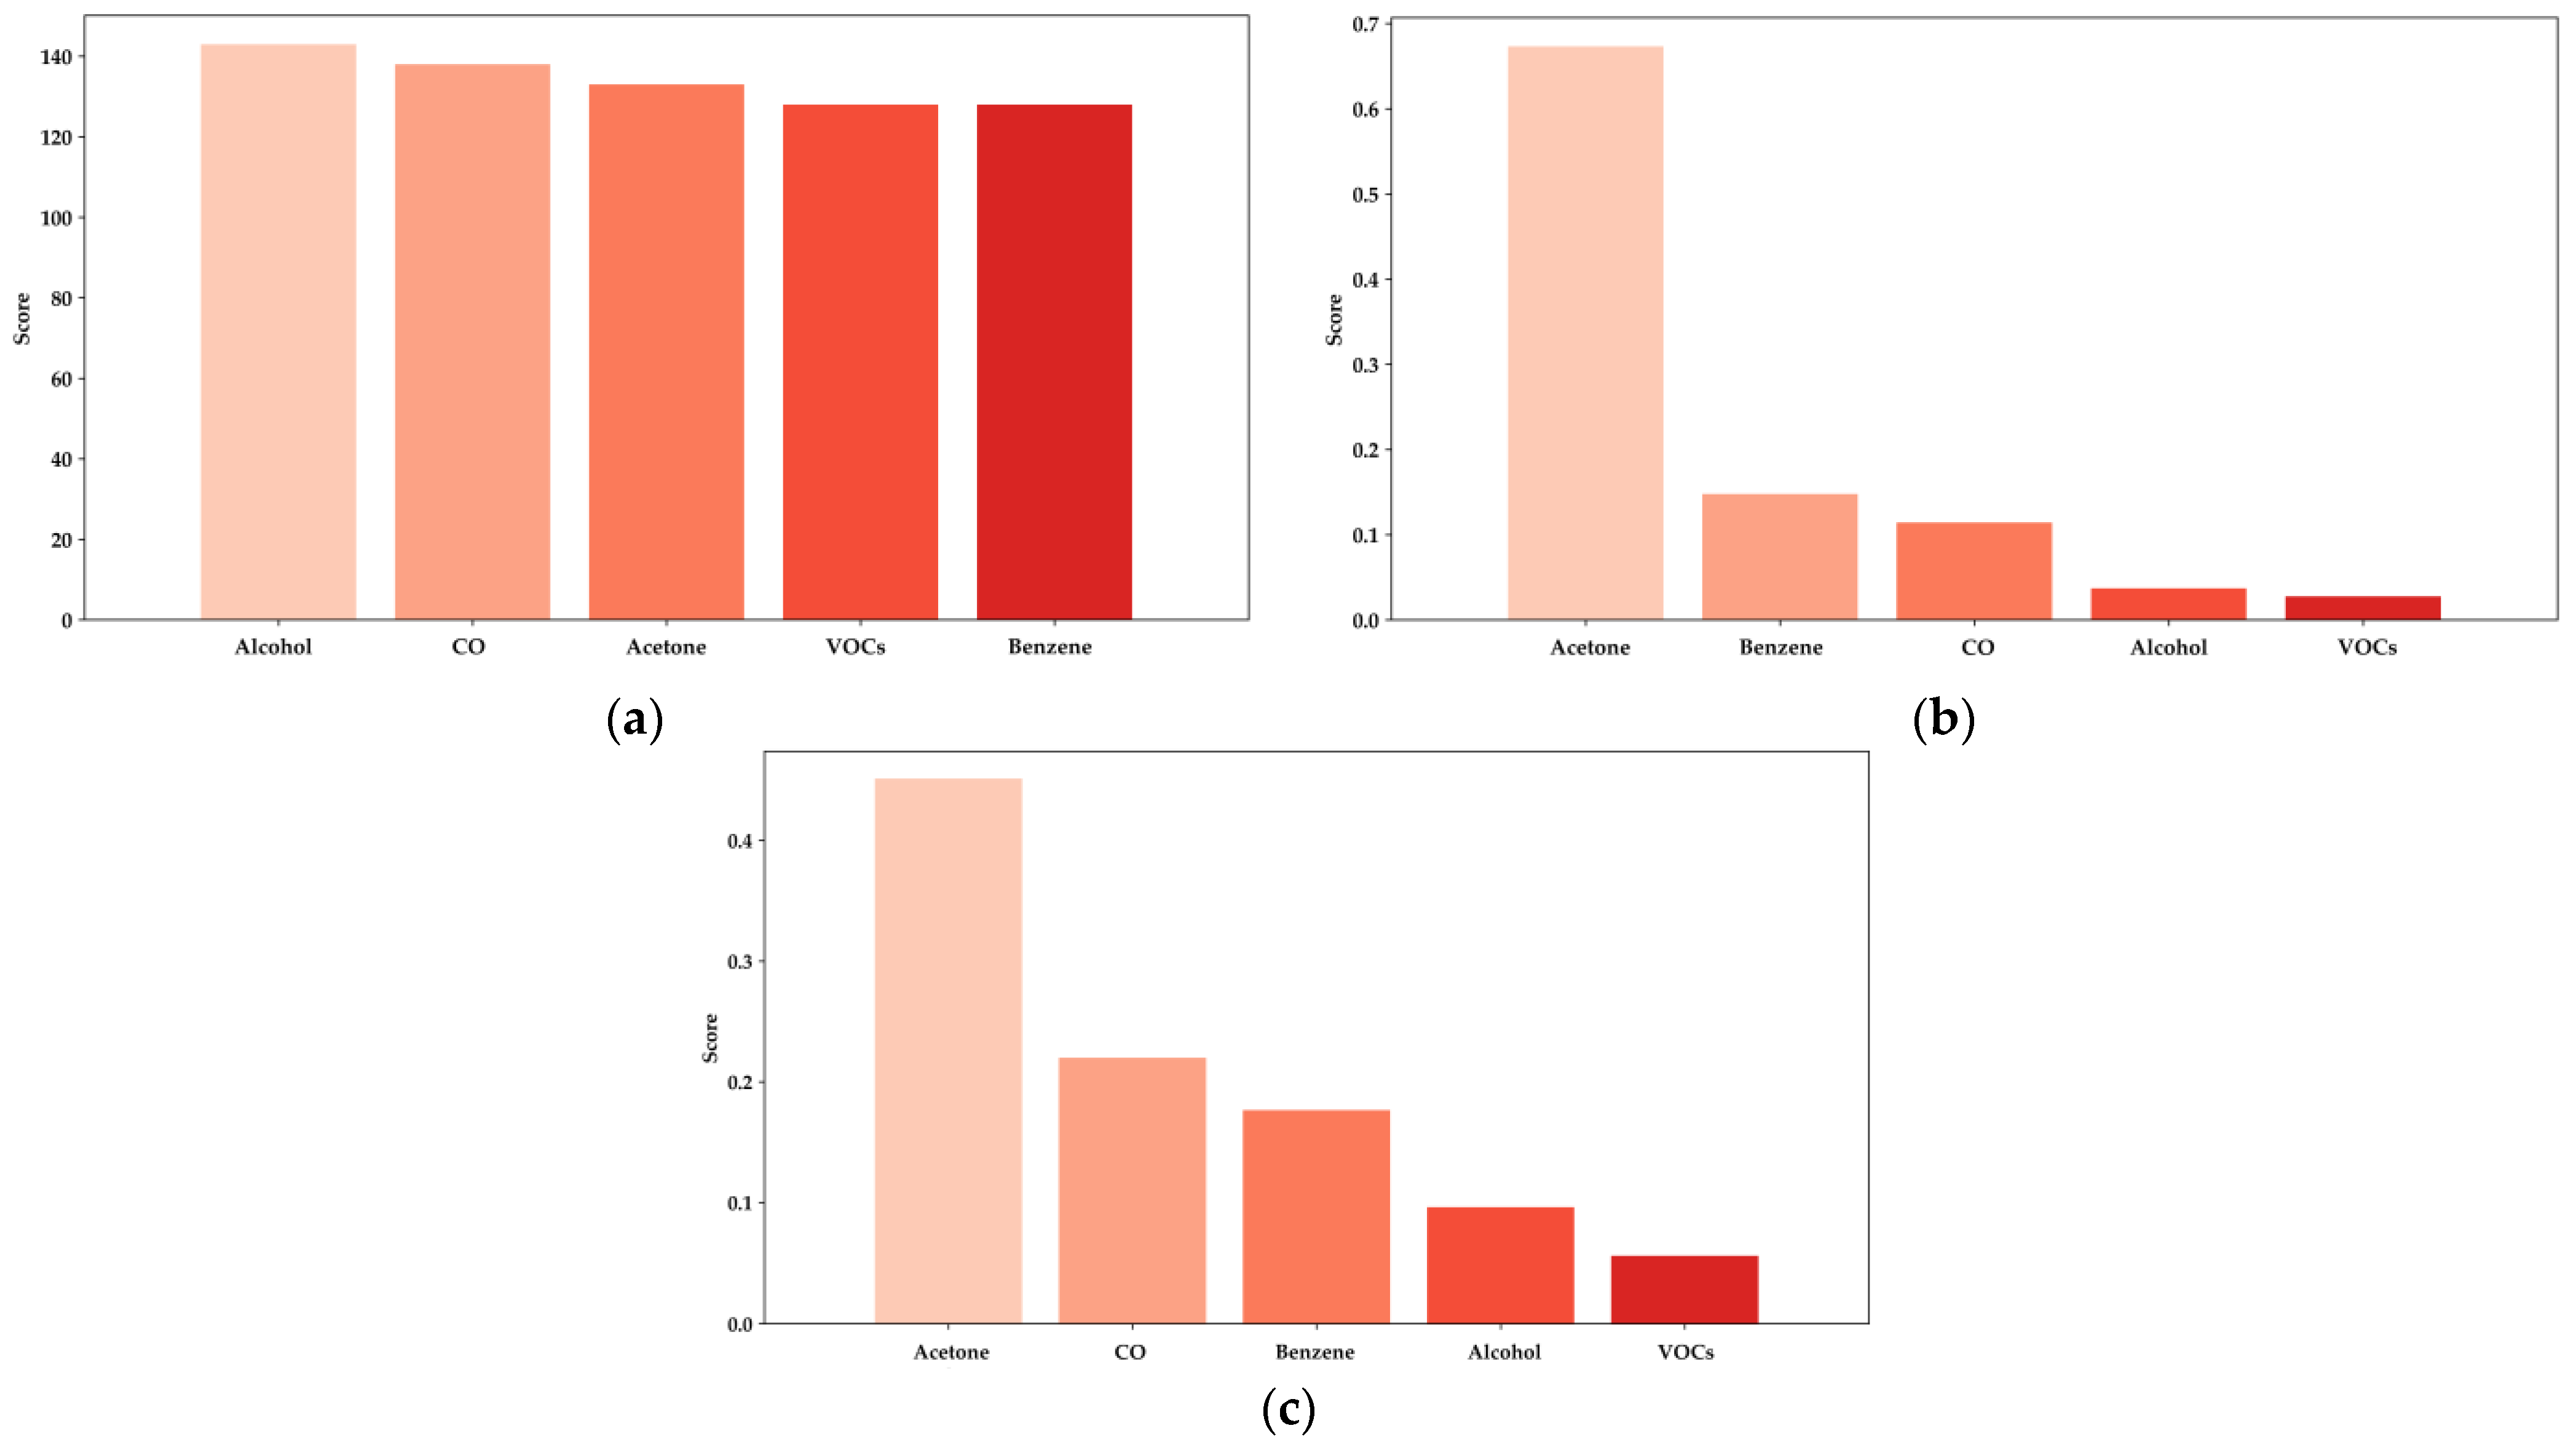
In all evaluated models, acetone consistently emerges as the most critical feature, with a significantly higher importance score than other biomarkers such as benzene, CO, alcohol, and various VOCs.
Figure 13a, representing the XGBoost model, highlights acetone’s dominant role in predicting BGL, contributing significantly more than other features [
14,
16,
38]. Similarly, in
Figure 13b, the LightGBM model reflects this pattern, where acetone’s contribution surpasses that of any other biomarker, particularly emphasizing its importance in non-invasive glucose monitoring. Notably, alcohol also shows considerable relevance in the LightGBM model, confirming its impact on predictions, as previously established in studies focused on the influence of ethanol concentration in breath analysis for DM detection. This further supports the necessity of incorporating alcohol measurements in e-nose systems to enhance the accuracy of BGL predictions and diabetes diagnostics [
38].
In the Random Forest model, shown in
Figure 13c, acetone remains the most influential feature, although other biomarkers like benzene and CO also show slightly increased importance compared to the XGBoost and LightGBM models. This variation suggests that while acetone is the primary biomarker, the contribution of additional features like alcohol and other VOCs can further enhance the predictive power of these models, especially in diverse and resource-constrained environments.
The analysis summarized in
Table 4 quantifies these importance scores, reinforcing the robust performance of the models in leveraging the most relevant biomarkers for accurate BGL prediction. The insights provided by this analysis are crucial for optimizing e-nose systems and refining the ML algorithms used in non-invasive diabetes detection, thereby enhancing their effectiveness and reliability in real-world healthcare applications.
3.3. TinyML with TensorFlow Lite Application with DM and HI Patients
In this section, the application of TinyML with TensorFlow Lite for the qualitative classification of DM and HI, as well as the regression of BGL, is discussed. The DNN model was selected for these tasks due to its compatibility with the TensorFlow ecosystem, which allows for seamless conversion to TensorFlow Lite and deployment on resource-constrained devices like microcontrollers [
33,
34,
35,
36].
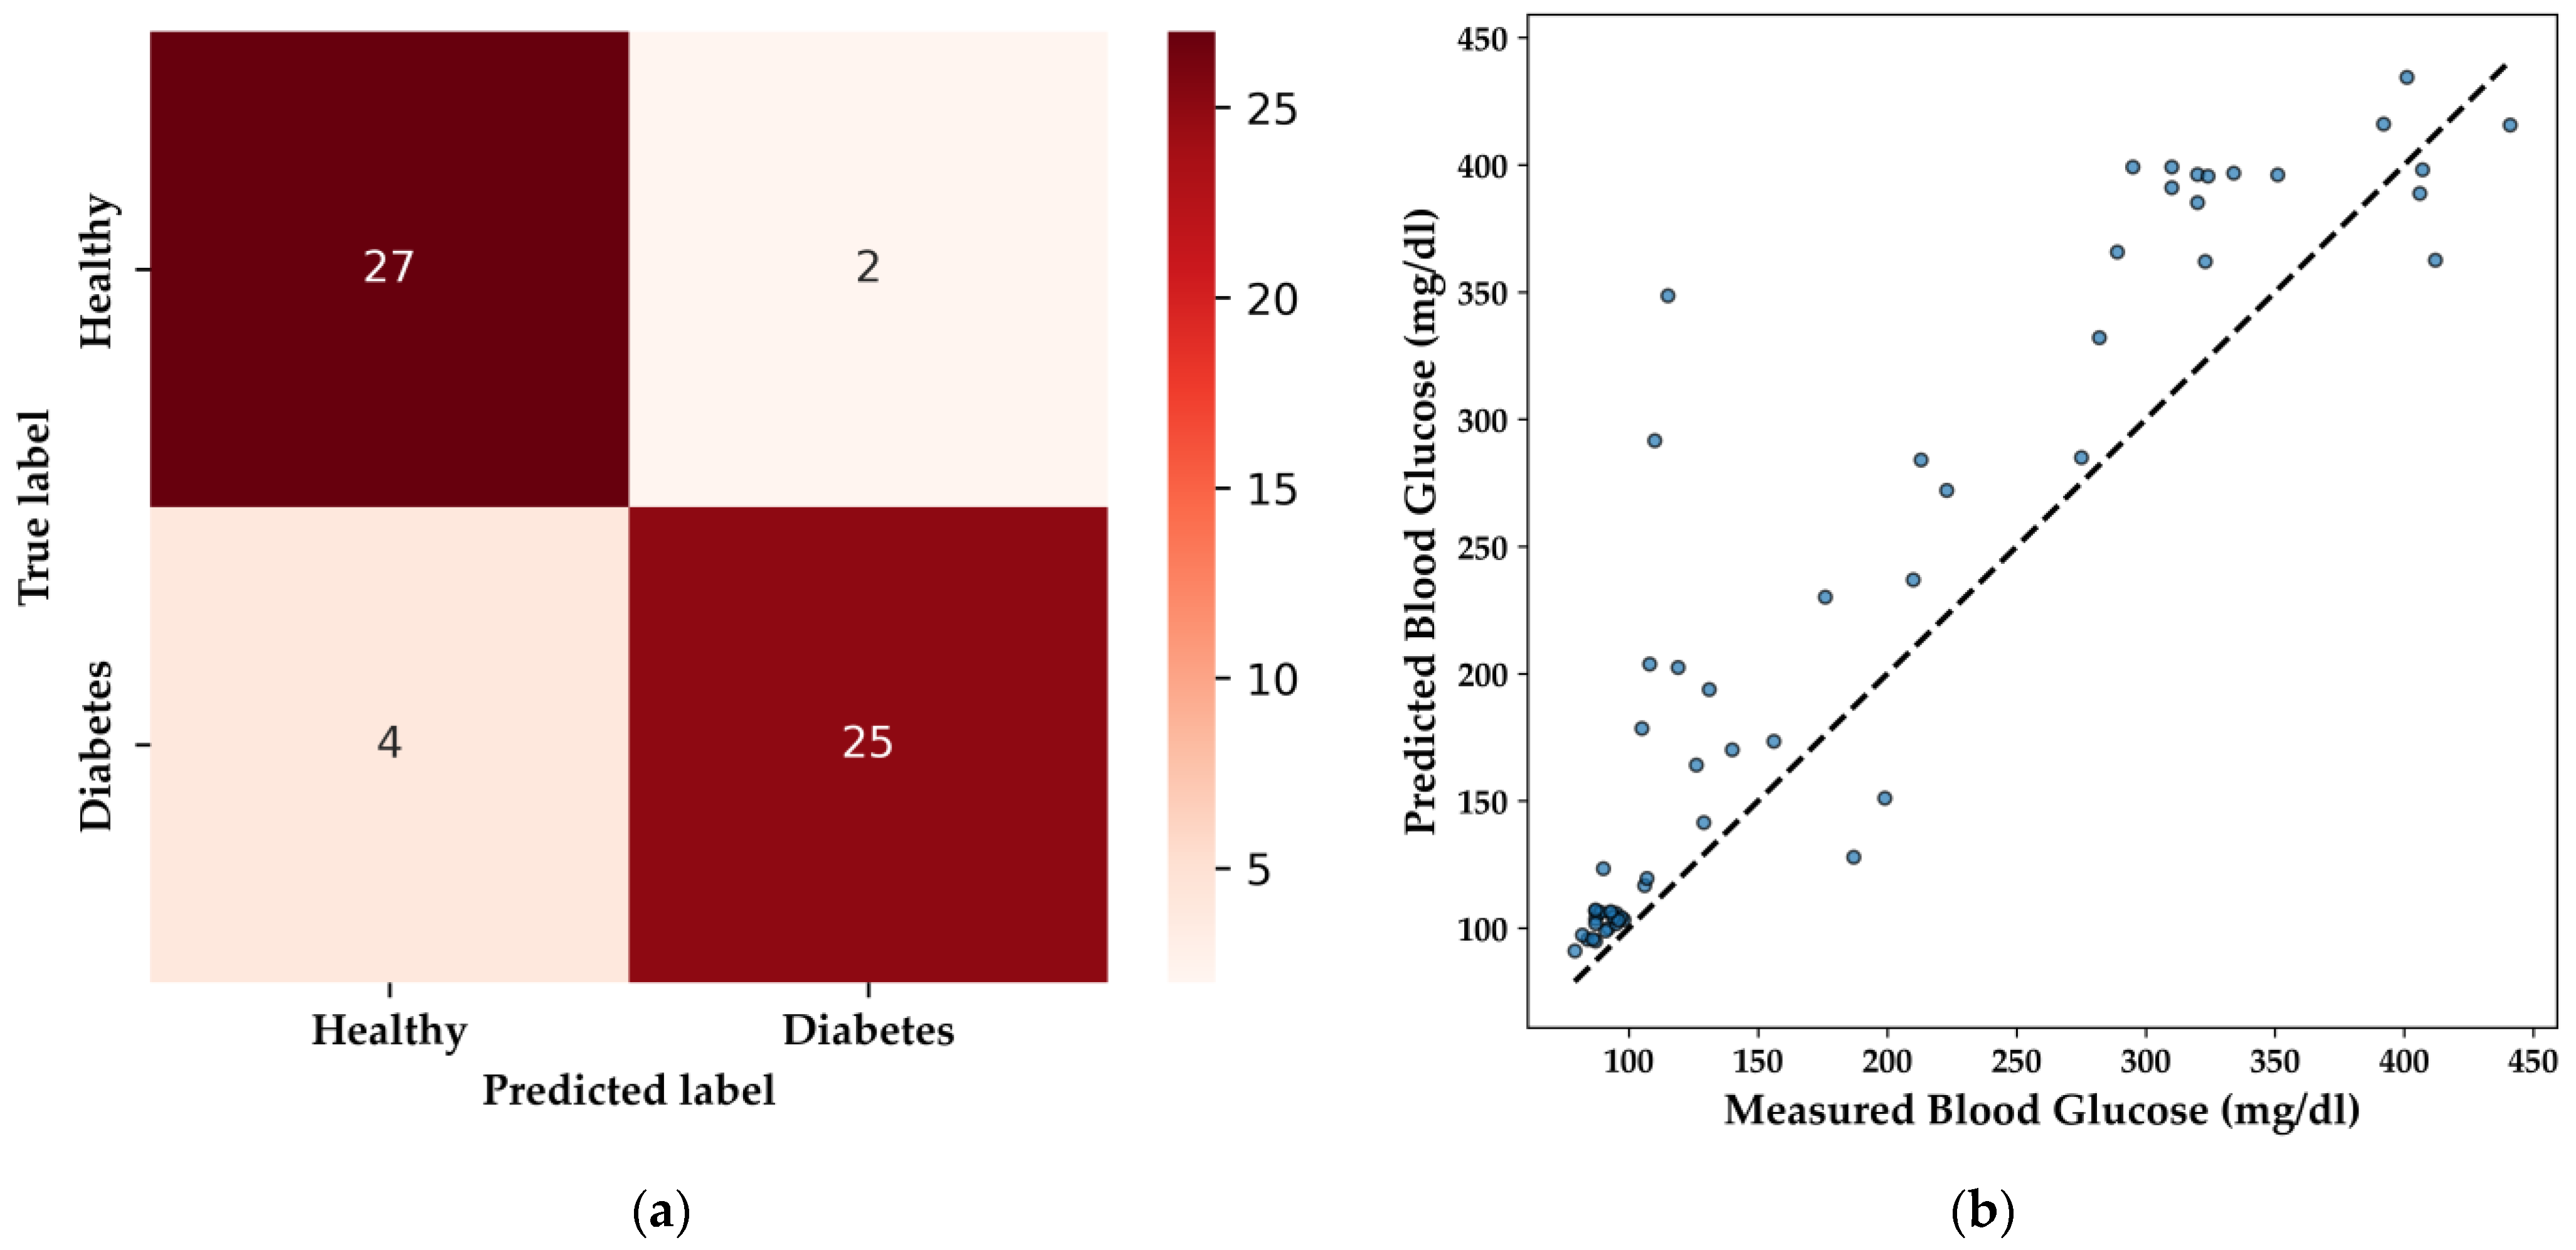
The DNN model’s performance in qualitative classification is illustrated by the confusion matrix (
Figure 14a). The model correctly identifies 27 healthy patients and 25 patients with diabetes, with minimal misclassifications, including two false positives and four false negatives. This level of performance is particularly important in medical applications, where the accurate identification of diabetic individuals is essential to avoid potential misdiagnosis, ensuring that patients receive the appropriate care.
For BGL regression, the DNN model’s predictive capability is demonstrated in the scatter plot (
Figure 14b), with an R
2 score of 0.736 and an MAE of 41.00 mg/dL. These metrics indicate a reasonably strong correlation between predicted and actual BGL values, making the model suitable for non-invasive glucose monitoring in embedded systems. Notably, the DNN model effectively predicted BGL levels within the normal range (85–100 mg/dL) for the HI group, and while predictions for elevated BGL levels (around 200 mg/dL) were accurate, there remains a need for a broader distribution of high BGL samples to further refine the model’s performance.
To enhance the interpretability of the classification and regression models, we applied SHAP values to explain the contributions of individual features to the predictions [
41]. The SHAP summary plots (
Figure 15a,b) illustrate the impact of various VOCs on the model’s predictions for both classification and regression tasks. In
Figure 15a, the SHAP summary plot for classification reveals that acetone is the most influential feature, with higher concentrations indicating a greater likelihood of DM. The distribution of SHAP values also highlights the impact of other VOCs, such as benzene and CO, which contribute to the model’s decision-making process.
Figure 15b presents the SHAP summary plot for regression, where acetone again emerges as the dominant feature influencing BGL predictions. The positive correlation shown in the plot suggests that increases in acetone levels correspond to higher predicted BGL values, affirming its role as a key biomarker for DM.
The decision to exclusively test the DNN model stems from the specific challenges associated with converting other ML models, such as XGBoost, LightGBM, and Random Forest, into formats compatible with TensorFlow Lite. These models, while powerful and effective in various predictive tasks, often require complex conversion processes [
33]. These processes can lead to variations in performance metrics due to differences in numerical precision and implementation between the original algorithms and TensorFlow. Additionally, the lack of direct support for these models in TensorFlow’s conversion tools posed significant barriers to their integration into a microcontroller-based system. Given these constraints, the DNN model was chosen for its ease of integration, maintaining robust performance and meeting the critical requirements for real-time diabetes monitoring in a resource-limited environment.
The DNN model was tested under various conditions, including fasting, postprandial (after the second meal of the day), and nighttime, across the same cohort of 58 patients. For each of these conditions, the e-nose system with the integrated DNN model was used separately, ensuring that the model’s performance could be reliably assessed in diverse real-life scenarios. Additionally, it is essential to consider the habits and variability among DM patients, as factors such as stress, anxiety, menstrual cycles for women, and physical exercise significantly influence daily glucose levels. These variables were considered during the testing phases to ensure that the DNN model could generalize well across different patient profiles and day-to-day conditions [
40].
The DNN model implemented within a TinyML framework using TensorFlow Lite demonstrates high effectiveness in the binary classification of DM and HI patients, as well as in the regression of BGL. The model’s robust performance, coupled with its seamless integration into resource-constrained environments, makes it an ideal candidate for non-invasive, real-time monitoring devices [
33,
34,
35,
36]. This study demonstrates that using CTGAN to validate and improve models with a diverse patient population and their exhaled breath analysis provides a solid foundation for future work aimed at enhancing the model’s accuracy and applicability in broader healthcare applications, while also addressing the challenges associated with deploying other ML models in similar environments.
4. Discussion
The integration of TinyML with e-nose technology for detecting DM through exhaled breath has demonstrated considerable potential, aligning with recent advances in non-invasive diagnostic techniques. This study aimed to enhance the effectiveness of ML models, particularly in resource-constrained environments, by utilizing synthetic data generated through CTGAN. The models validated in this research, including LightGBM and Random Forest, showed strong predictive capabilities for BGL and diabetes detection, with the inclusion of synthetic data significantly improving their robustness [
16,
30,
33,
38].
Despite these promising results, several limitations and challenges were identified. One primary concern is the sensitivity of the MOX sensors used in the e-nose to high RH levels [
13,
14,
27,
38]. These sensors require continuous validation and calibration to maintain accuracy, particularly given their susceptibility to environmental factors. The implementation of a dehumidifier in the e-nose setup, while effective, introduces additional complexity in sensor maintenance and operational logistics.
Additionally, while CTGAN proved effective in expanding the dataset to over 14,000 synthetic samples, it may introduce certain limitations, particularly regarding the diversity of real-world cases. The synthetic data generated may not fully capture the variability present in real breath samples, which could limit the generalizability of the model’s predictions. Specifically, in this study, BGL ranges predominantly fell between 80–120 mg/dL and above 180 mg/dL, with extreme cases reaching up to 400 mg/dL in individuals with poorly managed diabetes. However, broader testing across a more diverse range of BGL is necessary to improve model accuracy. Moreover, multiple factors can influence breath analysis for BGL prediction, namely, medical histories and lifestyles, including carbohydrate intake, physical activity, and insulin administration (particularly for T1DM), which are not easily captured in synthetic data [
41].
To improve model reliability and ensure more comprehensive generalization, future studies should include a broader and more diverse participant pool. Target groups should encompass a wide range of ages, ethnic backgrounds, and varying degrees of diabetes severity, including prediabetic individuals and those with comorbidities such as cardiovascular disease. Moreover, it would be beneficial to incorporate additional biomarkers beyond acetone and ethanol, such as ketones, lactate, and inflammatory markers, which can provide more nuanced insights into metabolic states and disease progression. Expanding the participant pool and incorporating a more diverse set of biomarkers will provide a more comprehensive representation of real-world variability, thereby enhancing the robustness and generalizability of the model [
13,
14,
38,
41].
Furthermore, the presence of ethanol in exhaled breath, as highlighted in [
38], can affect BGL predictions and model accuracy. Ethanol levels may vary significantly throughout the day depending on the individual’s diet or alcohol consumption, further complicating the analysis. The recognition of ethanol’s role underscores the need for careful consideration of multiple VOCs when developing non-invasive glucose monitoring systems. A standardized protocol for breath sample collection that accounts for these variations (e.g., fasting, postprandial, or post-exercise states) is essential to minimize variability and ensure accurate predictions. Establishing a rigorous breath sampling protocol across different patient groups (HI and DM) would greatly enhance the generalization and performance of the integrated e-nose system in real-time BGL predictions and classification tasks [
24,
28,
30].
The reliance on DL models, particularly DNN, for embedded system implementation presents both strengths and limitations. While the DNN model demonstrated robust performance in both qualitative classification and BGL prediction tasks, the conversion of other ML models like XGBoost, LightGBM, and Random Forest into formats compatible with TensorFlow Lite posed significant challenges. These models often require complex conversion processes, which can lead to variations in performance metrics due to differences in numerical precision and implementation between the original algorithms and TensorFlow. This limitation highlights the need for more compatible ML libraries and frameworks for TinyML integration [
33,
34,
35]. To contextualize the performance of the models used in this study,
Table 5 compares the best classifier models from recent studies on diabetes detection, while
Table 6 highlights the leading regressor models for BGL prediction.
To address the challenges associated with deploying models on TinyML frameworks, future research should explore lightweight DL models that do not compromise the efficiency of the device. This approach aims to balance the computational and memory constraints of microcontrollers while maintaining high performance in real-time diabetes monitoring applications. Exploring and developing such models could significantly enhance the applicability and scalability of TinyML-powered e-nose systems in broader healthcare contexts [
33].
Moreover, the study’s exclusive focus on breath analysis for diabetes detection, while innovative, should be expanded to include other diagnostic parameters, such as vital signs (blood pressure, heart rate, SpO
2). Integrating these additional features could enhance the interpretability and accuracy of the models, providing a more comprehensive diagnostic tool. Previous studies have demonstrated the benefits of combining breath analysis with other physiological data for more accurate diabetes detection and BGL prediction [
31,
32].
While this study has demonstrated the feasibility and effectiveness of using TinyML-powered e-nose systems for non-invasive diabetes monitoring, several challenges remain. Future research should focus on overcoming the limitations related to sensor sensitivity, environmental factors, and model compatibility with TinyML. Additionally, expanding the scope of diagnostic parameters and increasing the sample size will be crucial in refining these systems for broader healthcare applications. The integration of alcohol (ethanol) as a key feature in models like LightGBM, along with the continued exploration of synthetic data generation techniques, offers a solid foundation for enhancing the accuracy and applicability of these systems in real-world medical settings [
38].


 ,
, 


