

Development and Validation of a Novel In Vitro Joint Testing System for Reproduction of In Vivo Dynamic Muscle Force

 ,
, 
Abstract
1. Introduction
2. Materials and Methods
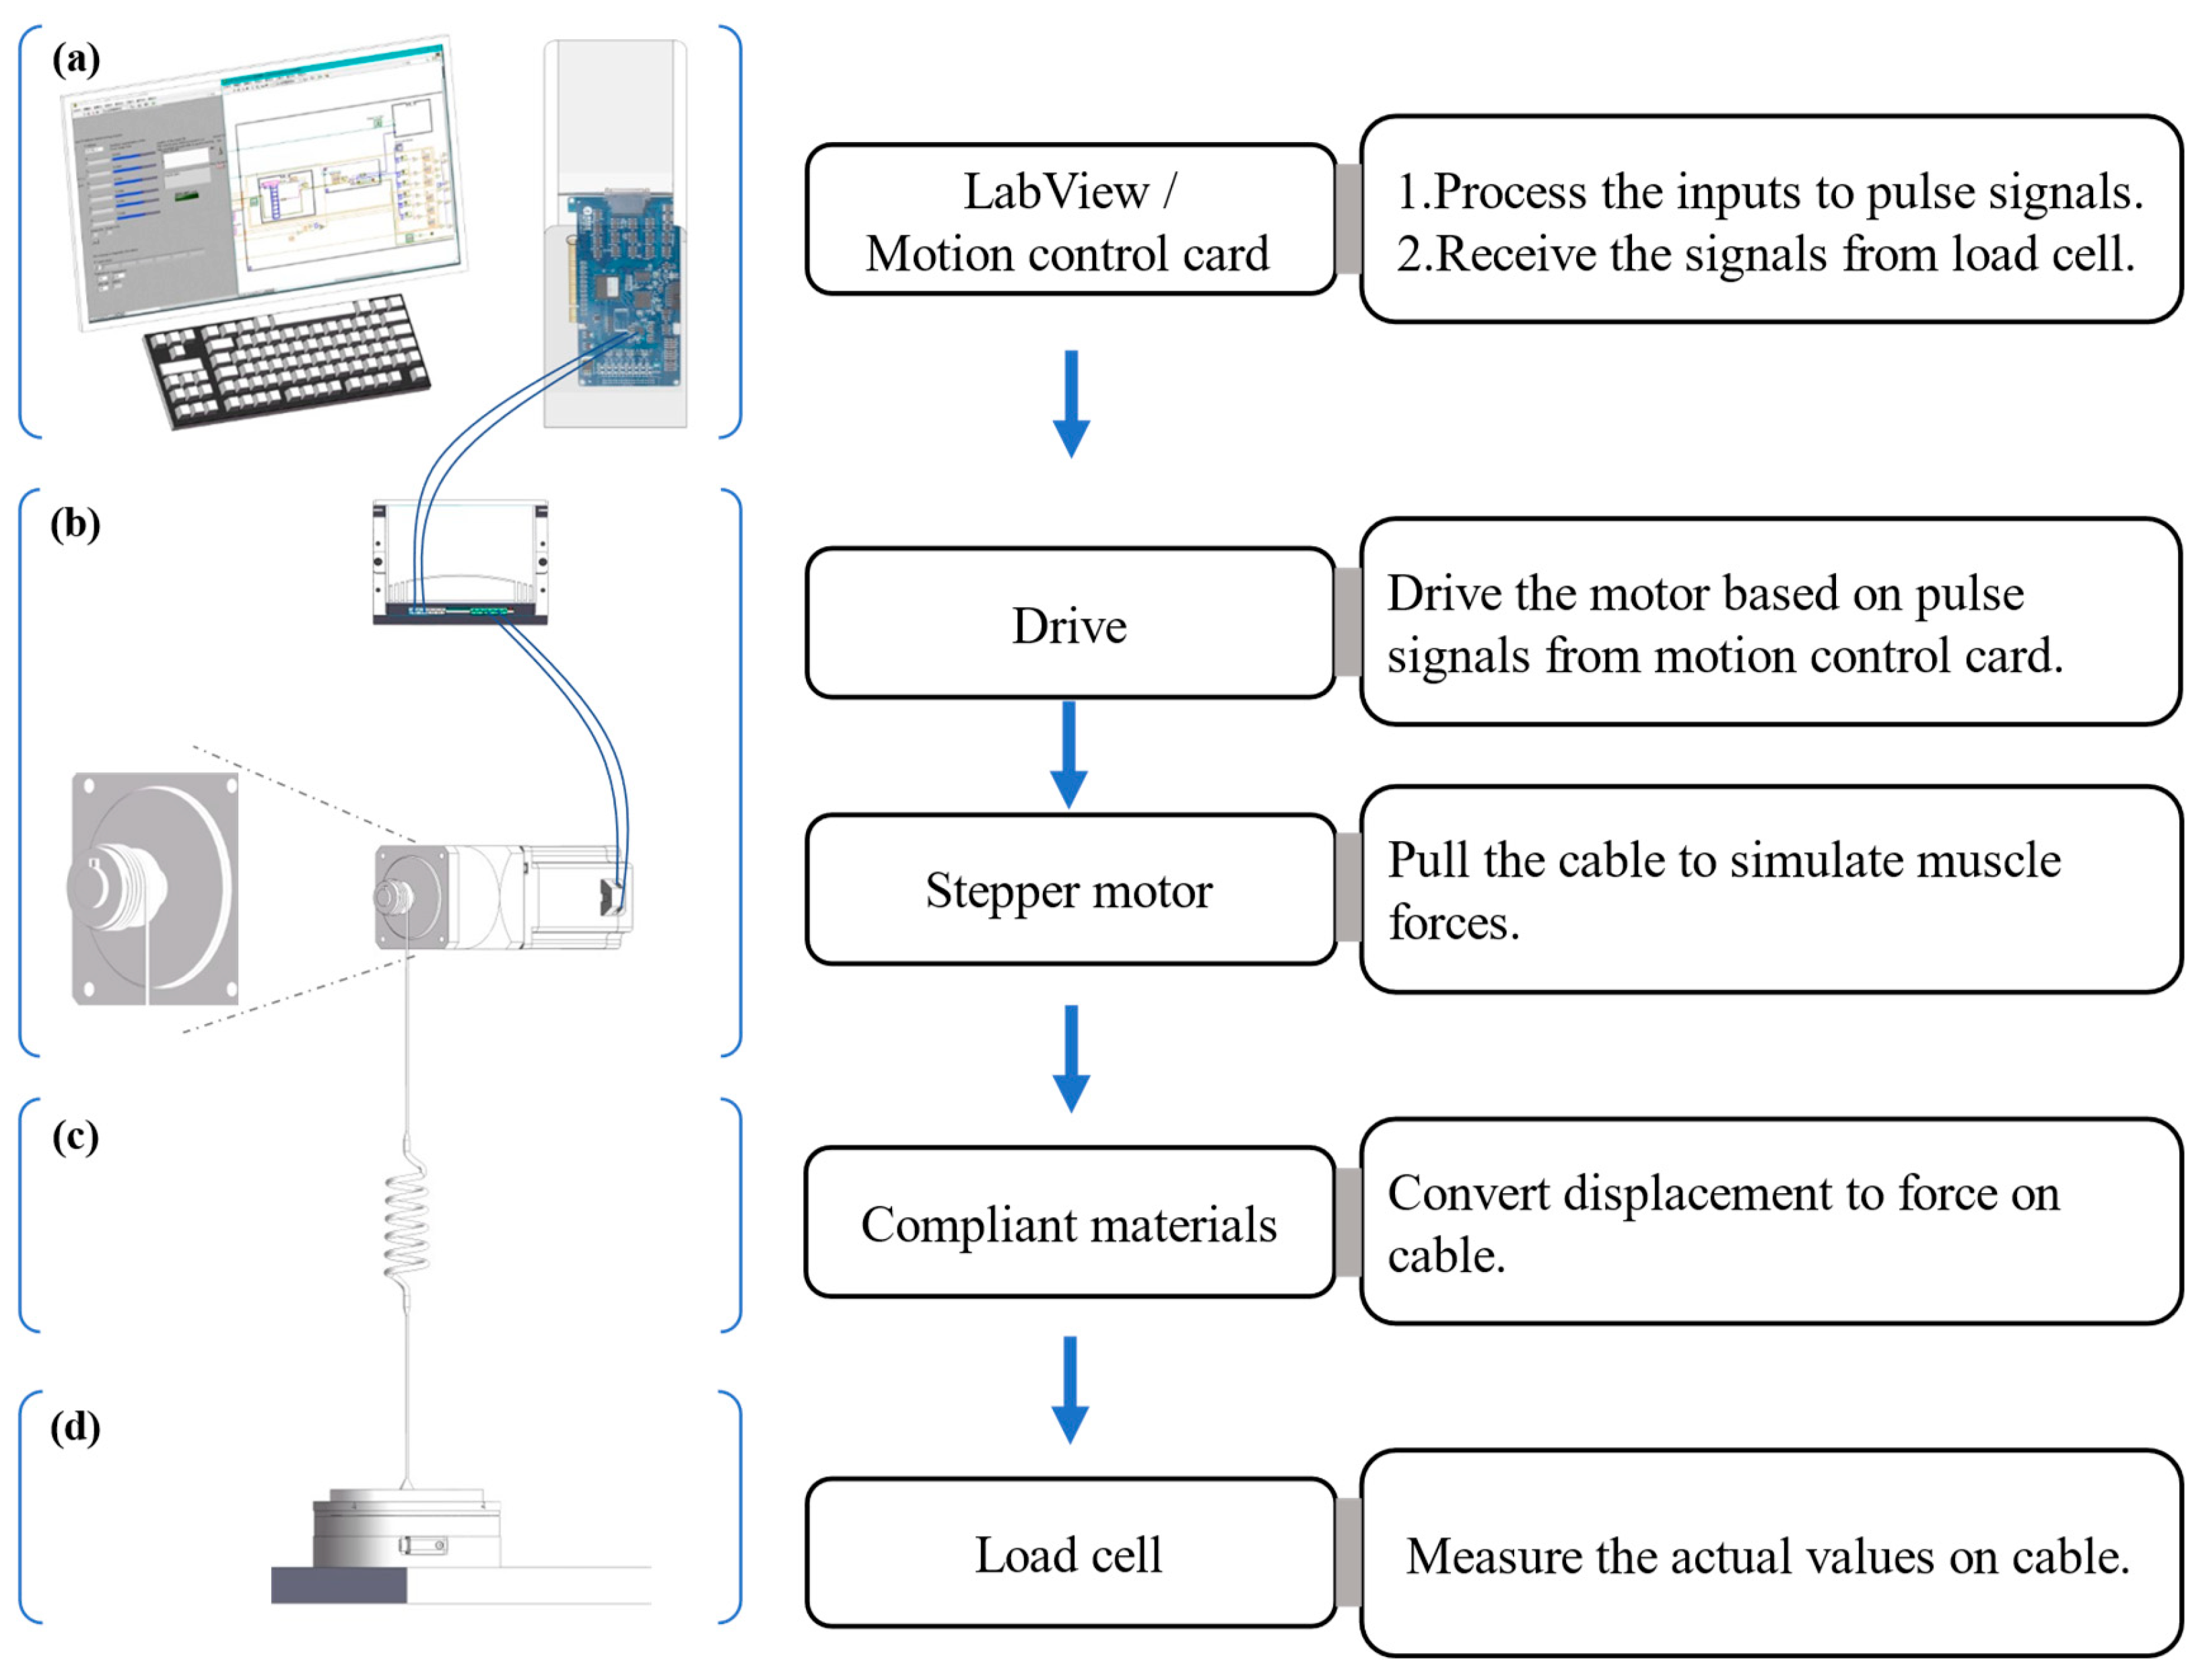
2.1. Development of the Muscle Loading Platform
- Control system. An industrial PC (ChengMing 3980, Dell Inc., Round Rock, TX, USA), into which a motion controller card (DMC3C00, Leadshine Co., Shenzhen, China) was inserted, was the main component of the control system. The PC was composed of an Intel Core i7-8700 CPU with 3.2 GHz~4.60 GHz, 8 Gb of RAM, and 512 Gb HDD. In addition, a connection board (ACC-XC00, Leadshine Co., China) bridged the PC and motor drive with dedicated cables.
- Executive device. A stepper motor (86CM120, Leadshine Co., China) was driven by a motor drive (DMA882S, Leadshine Co., China) which worked at 20~80 V and 2.7~8.2 A, the latter powered by an adjustable power supplier (TDGC3-5000VA, Zhengxi Electric Technology Co., Ltd., Wenzhou, China). The 86CM120 was a two-phase stepper motor that had a step angle of 1.80 degrees and could deliver a holding torque of 12 N.m on a phase current of 6 A.
- Compliant materials and connecting cables. Two groups of two kinds of industrial rubber bands (narrow band: 1.5 mm (thickness) × 20 mm (width) × 400 mm (1/2 length); wide band: 1.5 mm (thickness) × 30 mm (width) × 400 mm (1/2 length), Shands Inc., Shenzhen, China) played the compliant material role here. Each group contained six or eight rubber bands. A steel wire rope with a diameter of 1.5 mm connected the compliant material to the measuring equipment and the spool on the drive shaft of the stepper motor from the executive device (Figure 1).
- Measuring equipment. A six degrees of freedom (6 DOF) force–torque transducer, the Omega 190 (ATI Industrial Automation, Inc., Apex, NC, USA) powered by a DC power regulator (LRS-50-24, MEAN WELL Co., Ltd., Taipei, China), was used as the load transducer with the sampling frequency of 100 Hz to measure the force generated in the cable.
2.2. Numerical Computation Method to Reproduce Muscle Forces
2.2.1. Obtaining the Target Muscle Forces
2.2.2. Numerical Computation to Reproduce Muscle Forces
- : muscle force value at percentage e of the gait cycle;
- : the relationship between force and time. The function φ represents a graphical correspondence between gait percentage and force value here.
- : force on the material at the displacement of k;
- h: the relationship between force and displacement. The function h represents a tabular correspondence between displacement and force.
- : functional relationship of each segmental part of time t to displacement i;
- t: time point;
- a, b, c, d: unknown constants of a cubic function.
- v: cable speed at time t;
- a, b, c: unknown constants of the cubic function.
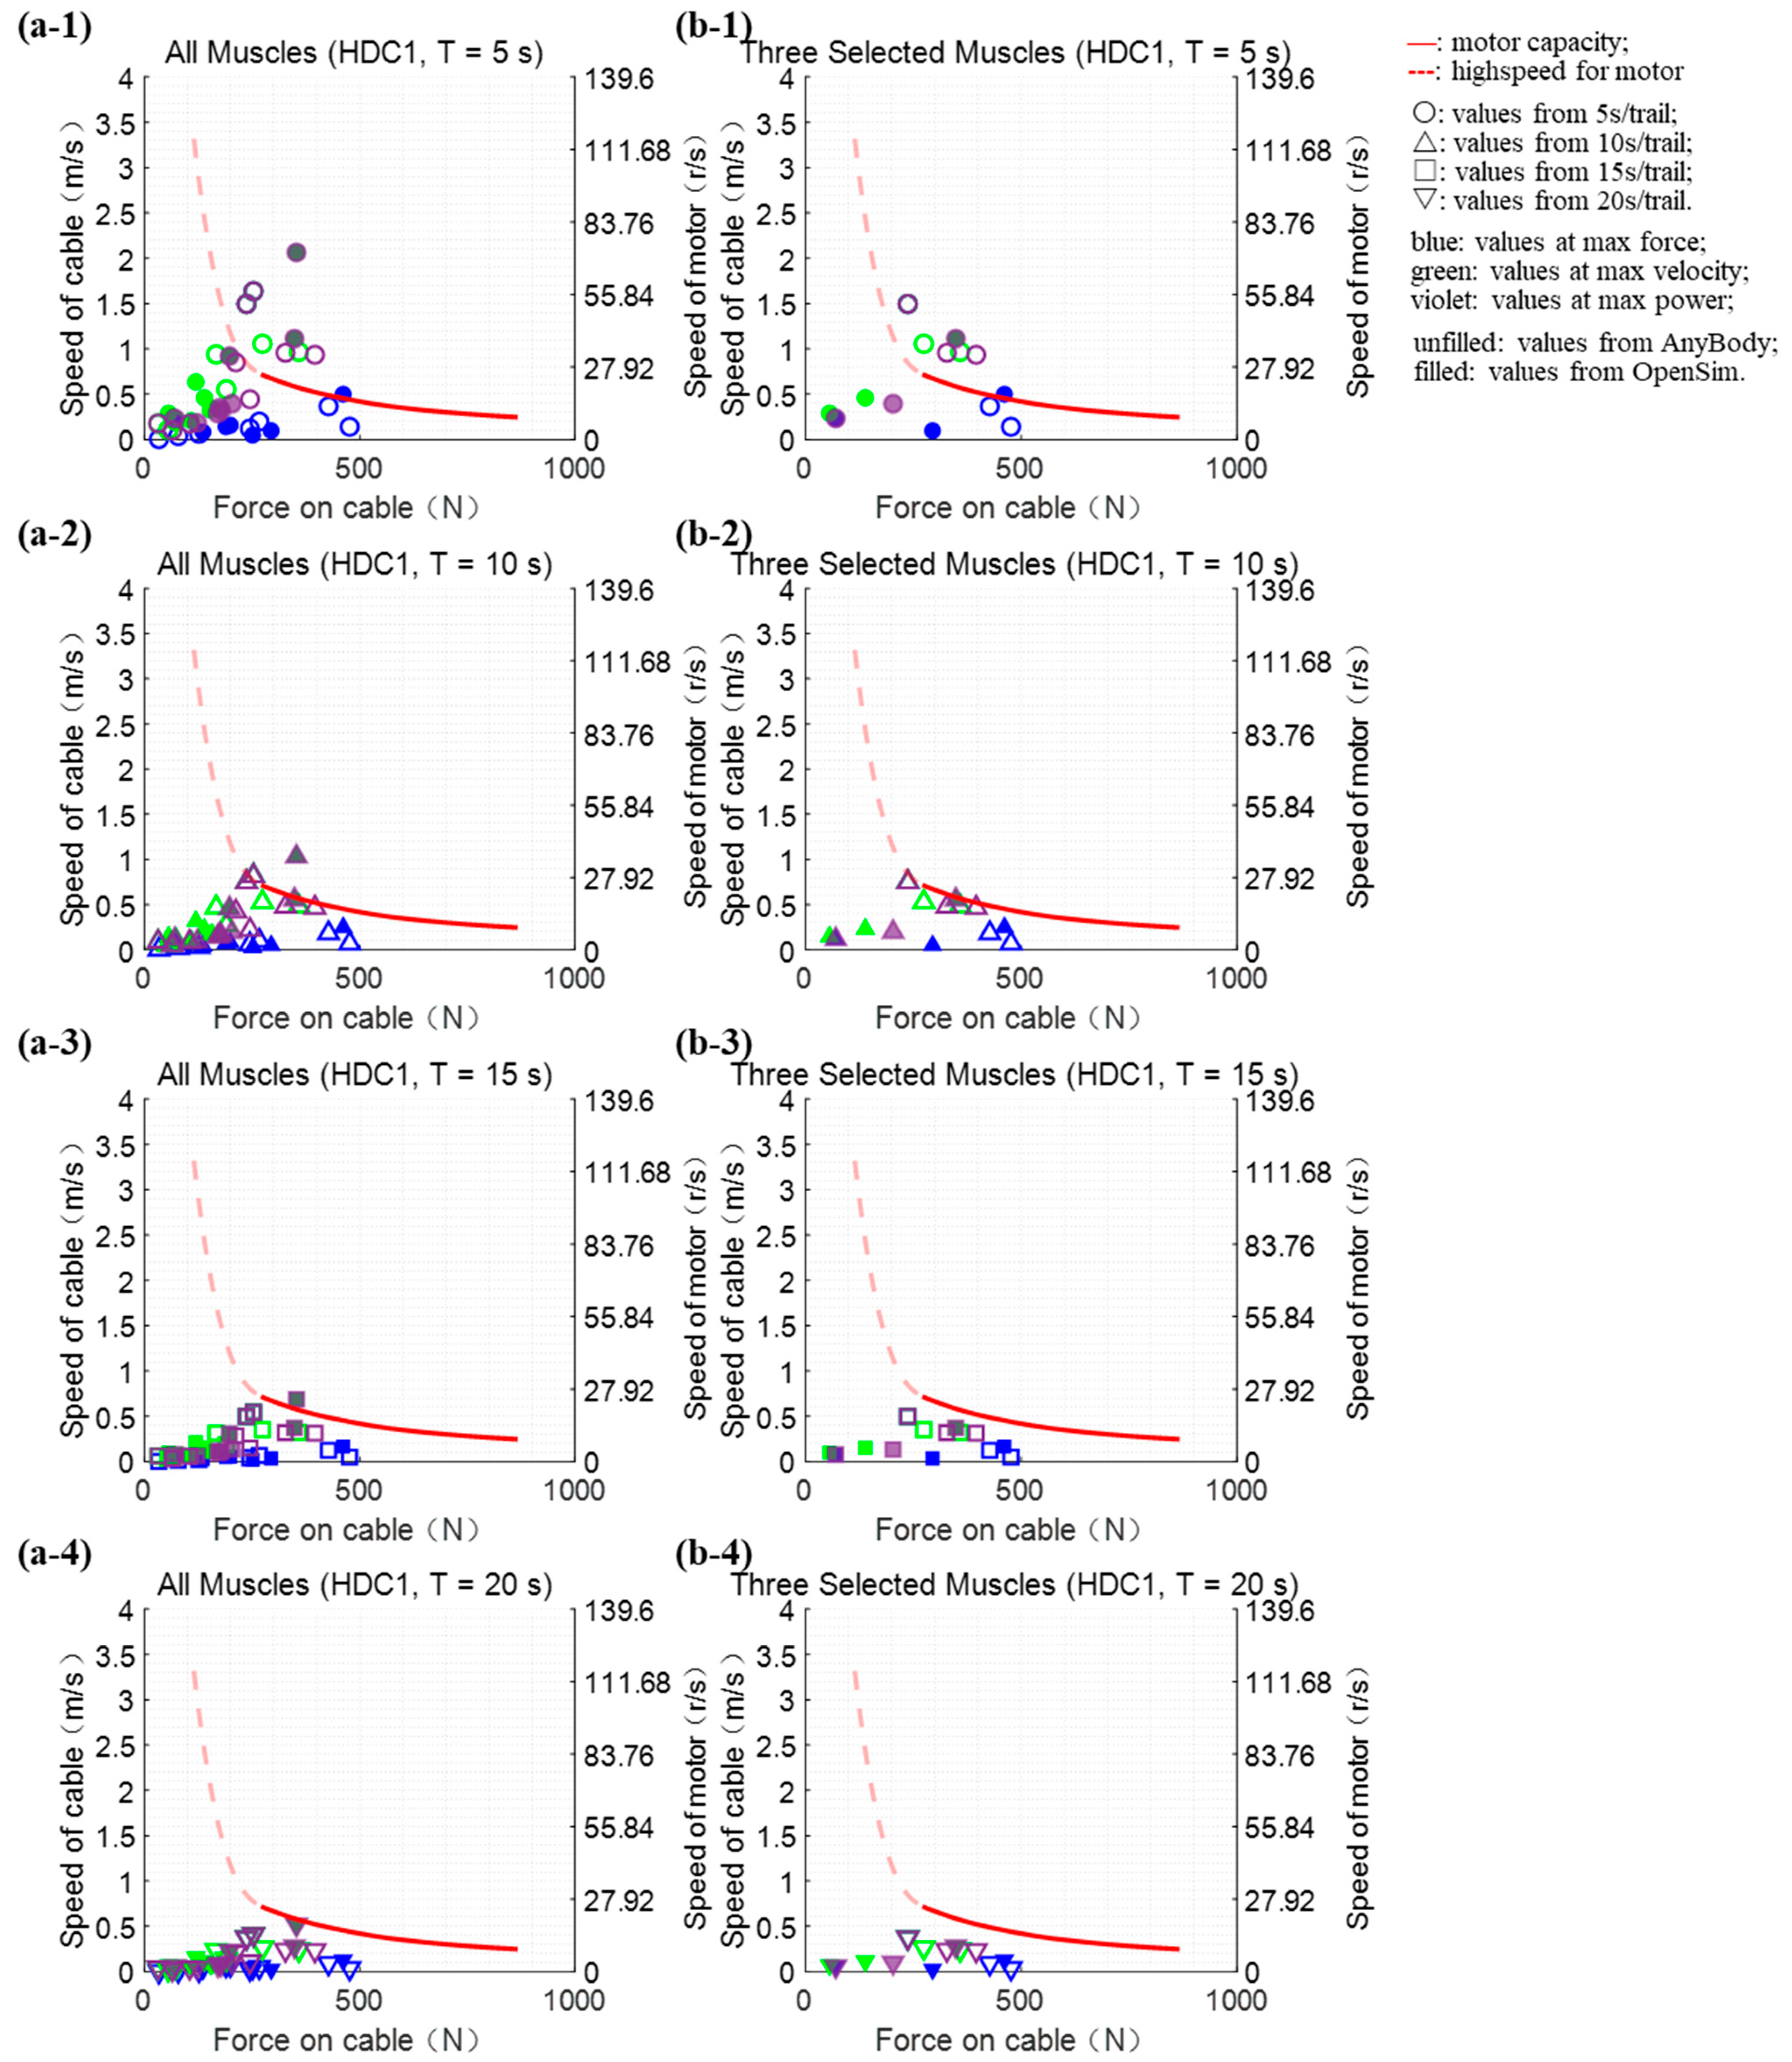
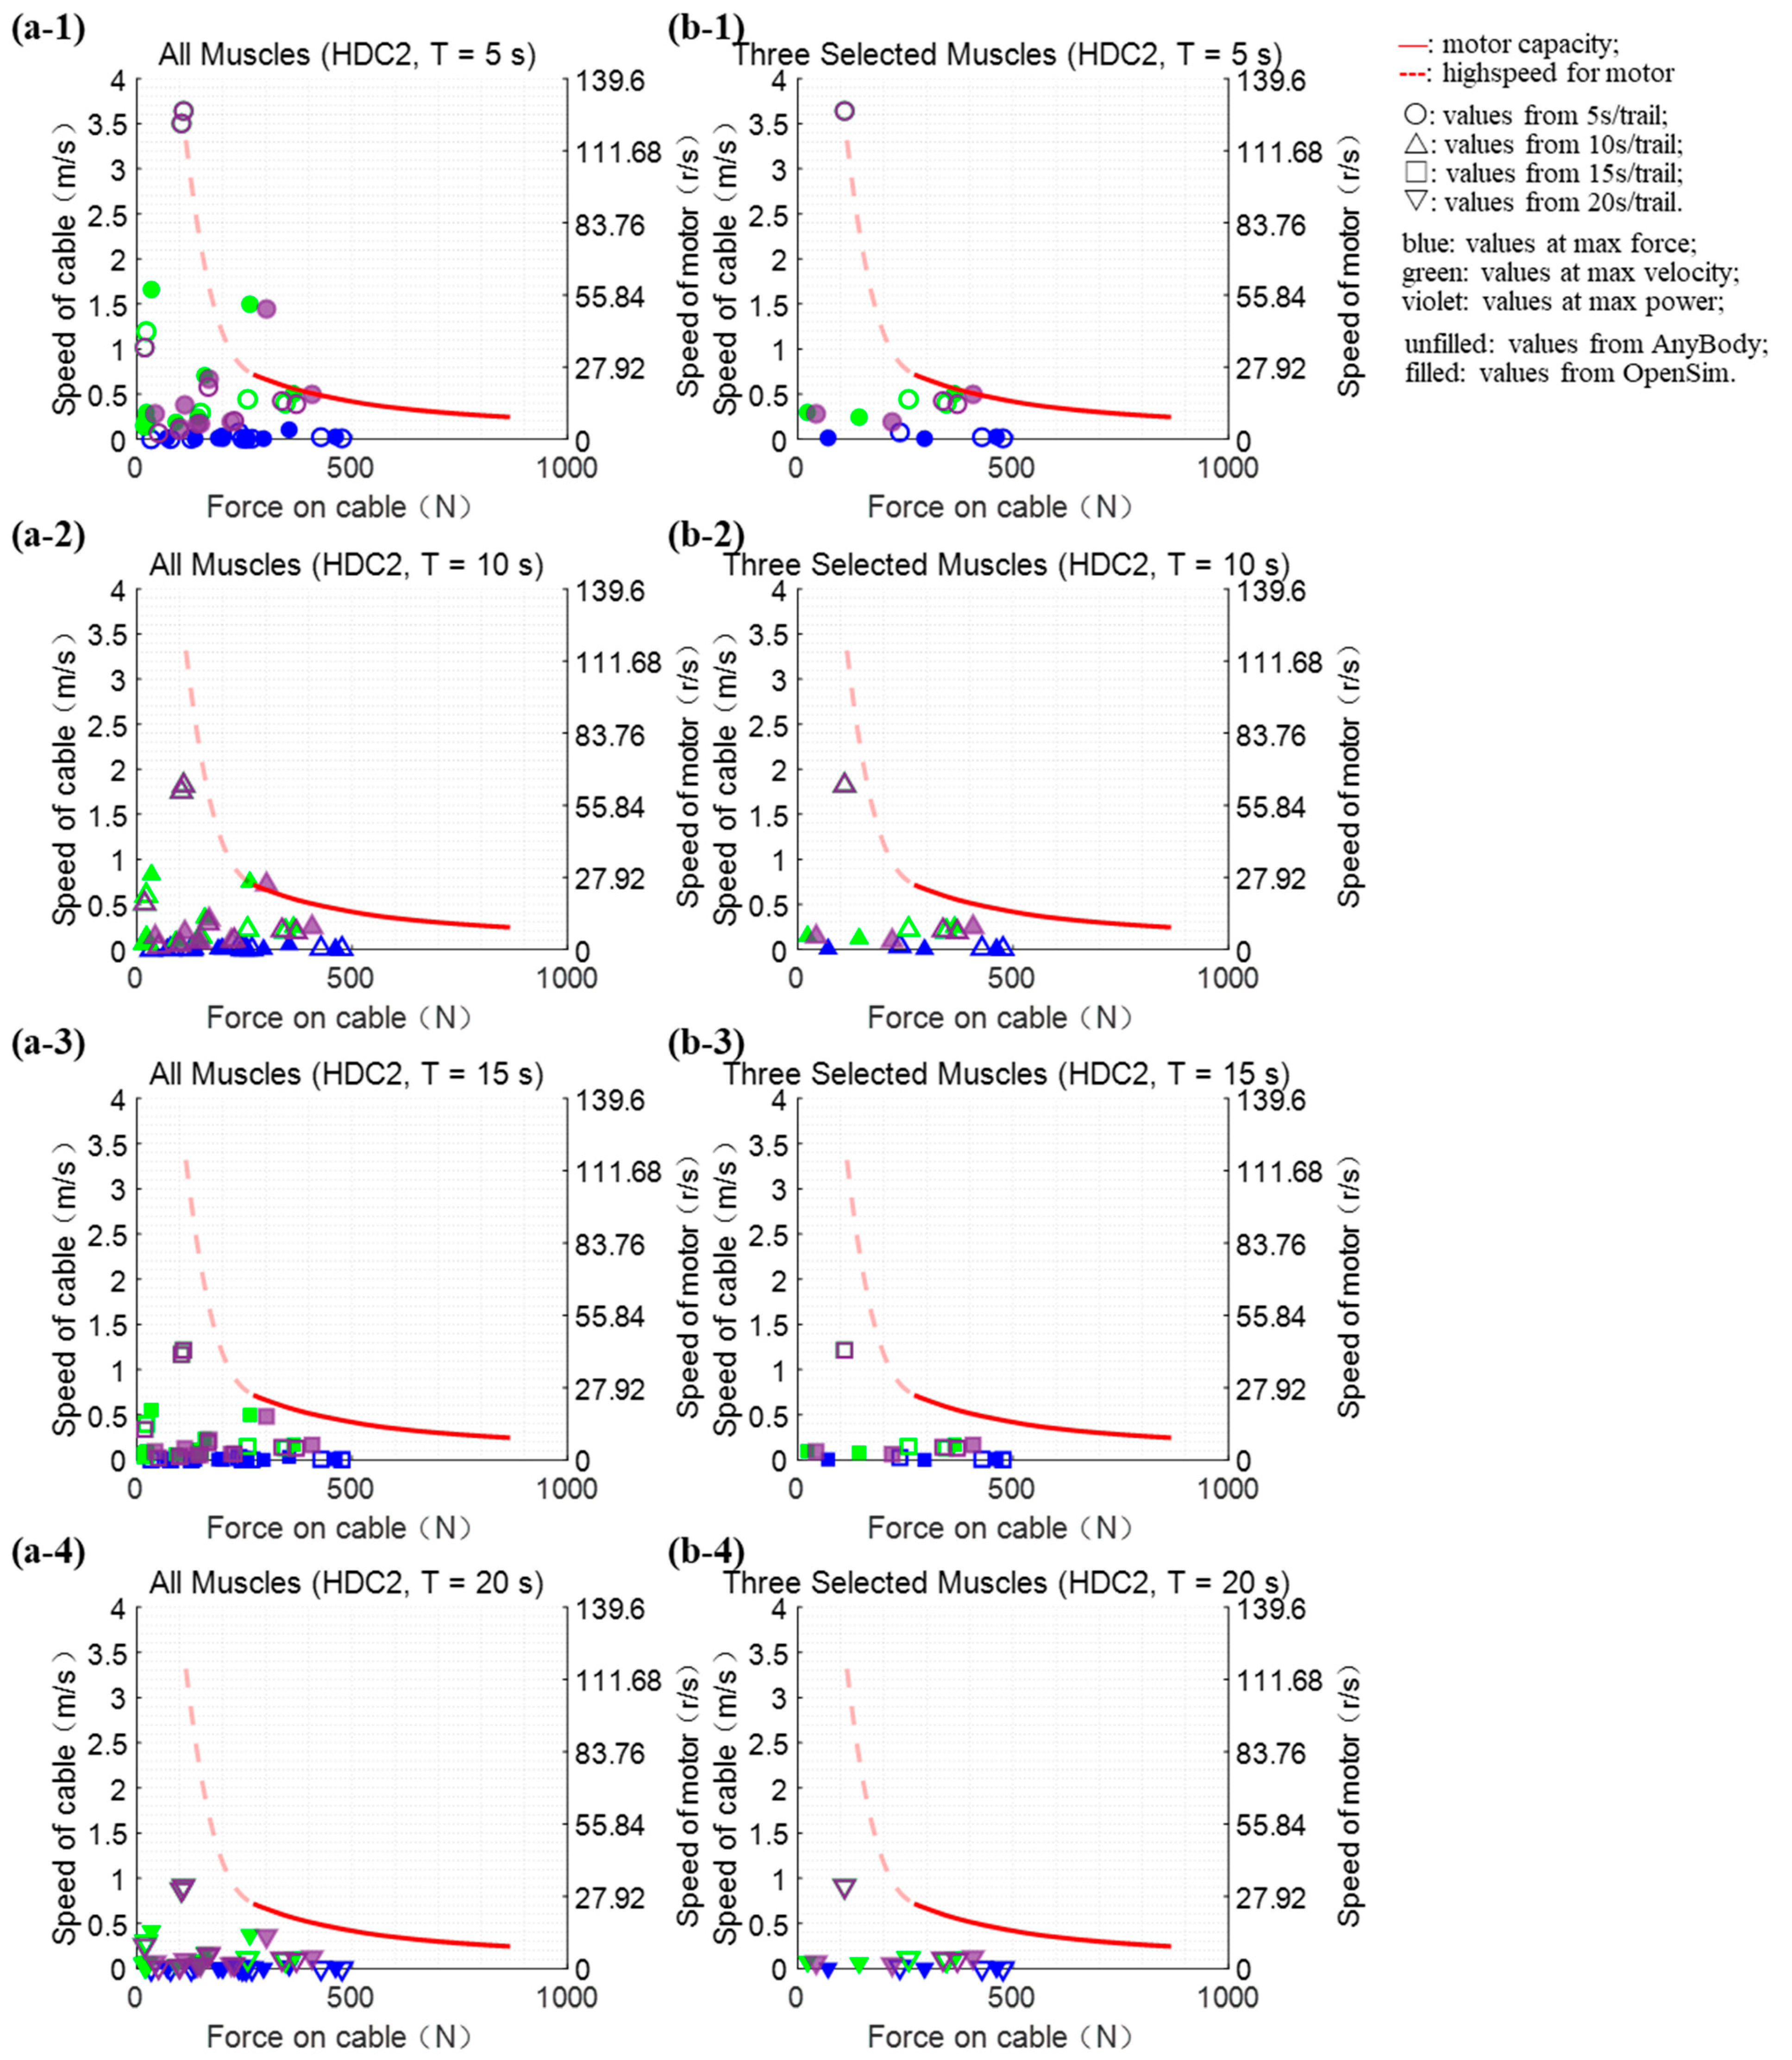
2.2.3. Verification of Platform Performance
- maximum torque on the motor shaft, N·m;
- : the motor moment of inertia, kg·m2;
- : motor angular acceleration, rad/s2;
- : the speed of the motor shaft, r/min;
- : the time required for the motor to accelerate, s.
- p: real-time power on cable.
2.3. Muscle Force Reproducing Tests
2.4. Statistical Analyses
3. Results
3.1. Verification of Platform Performance
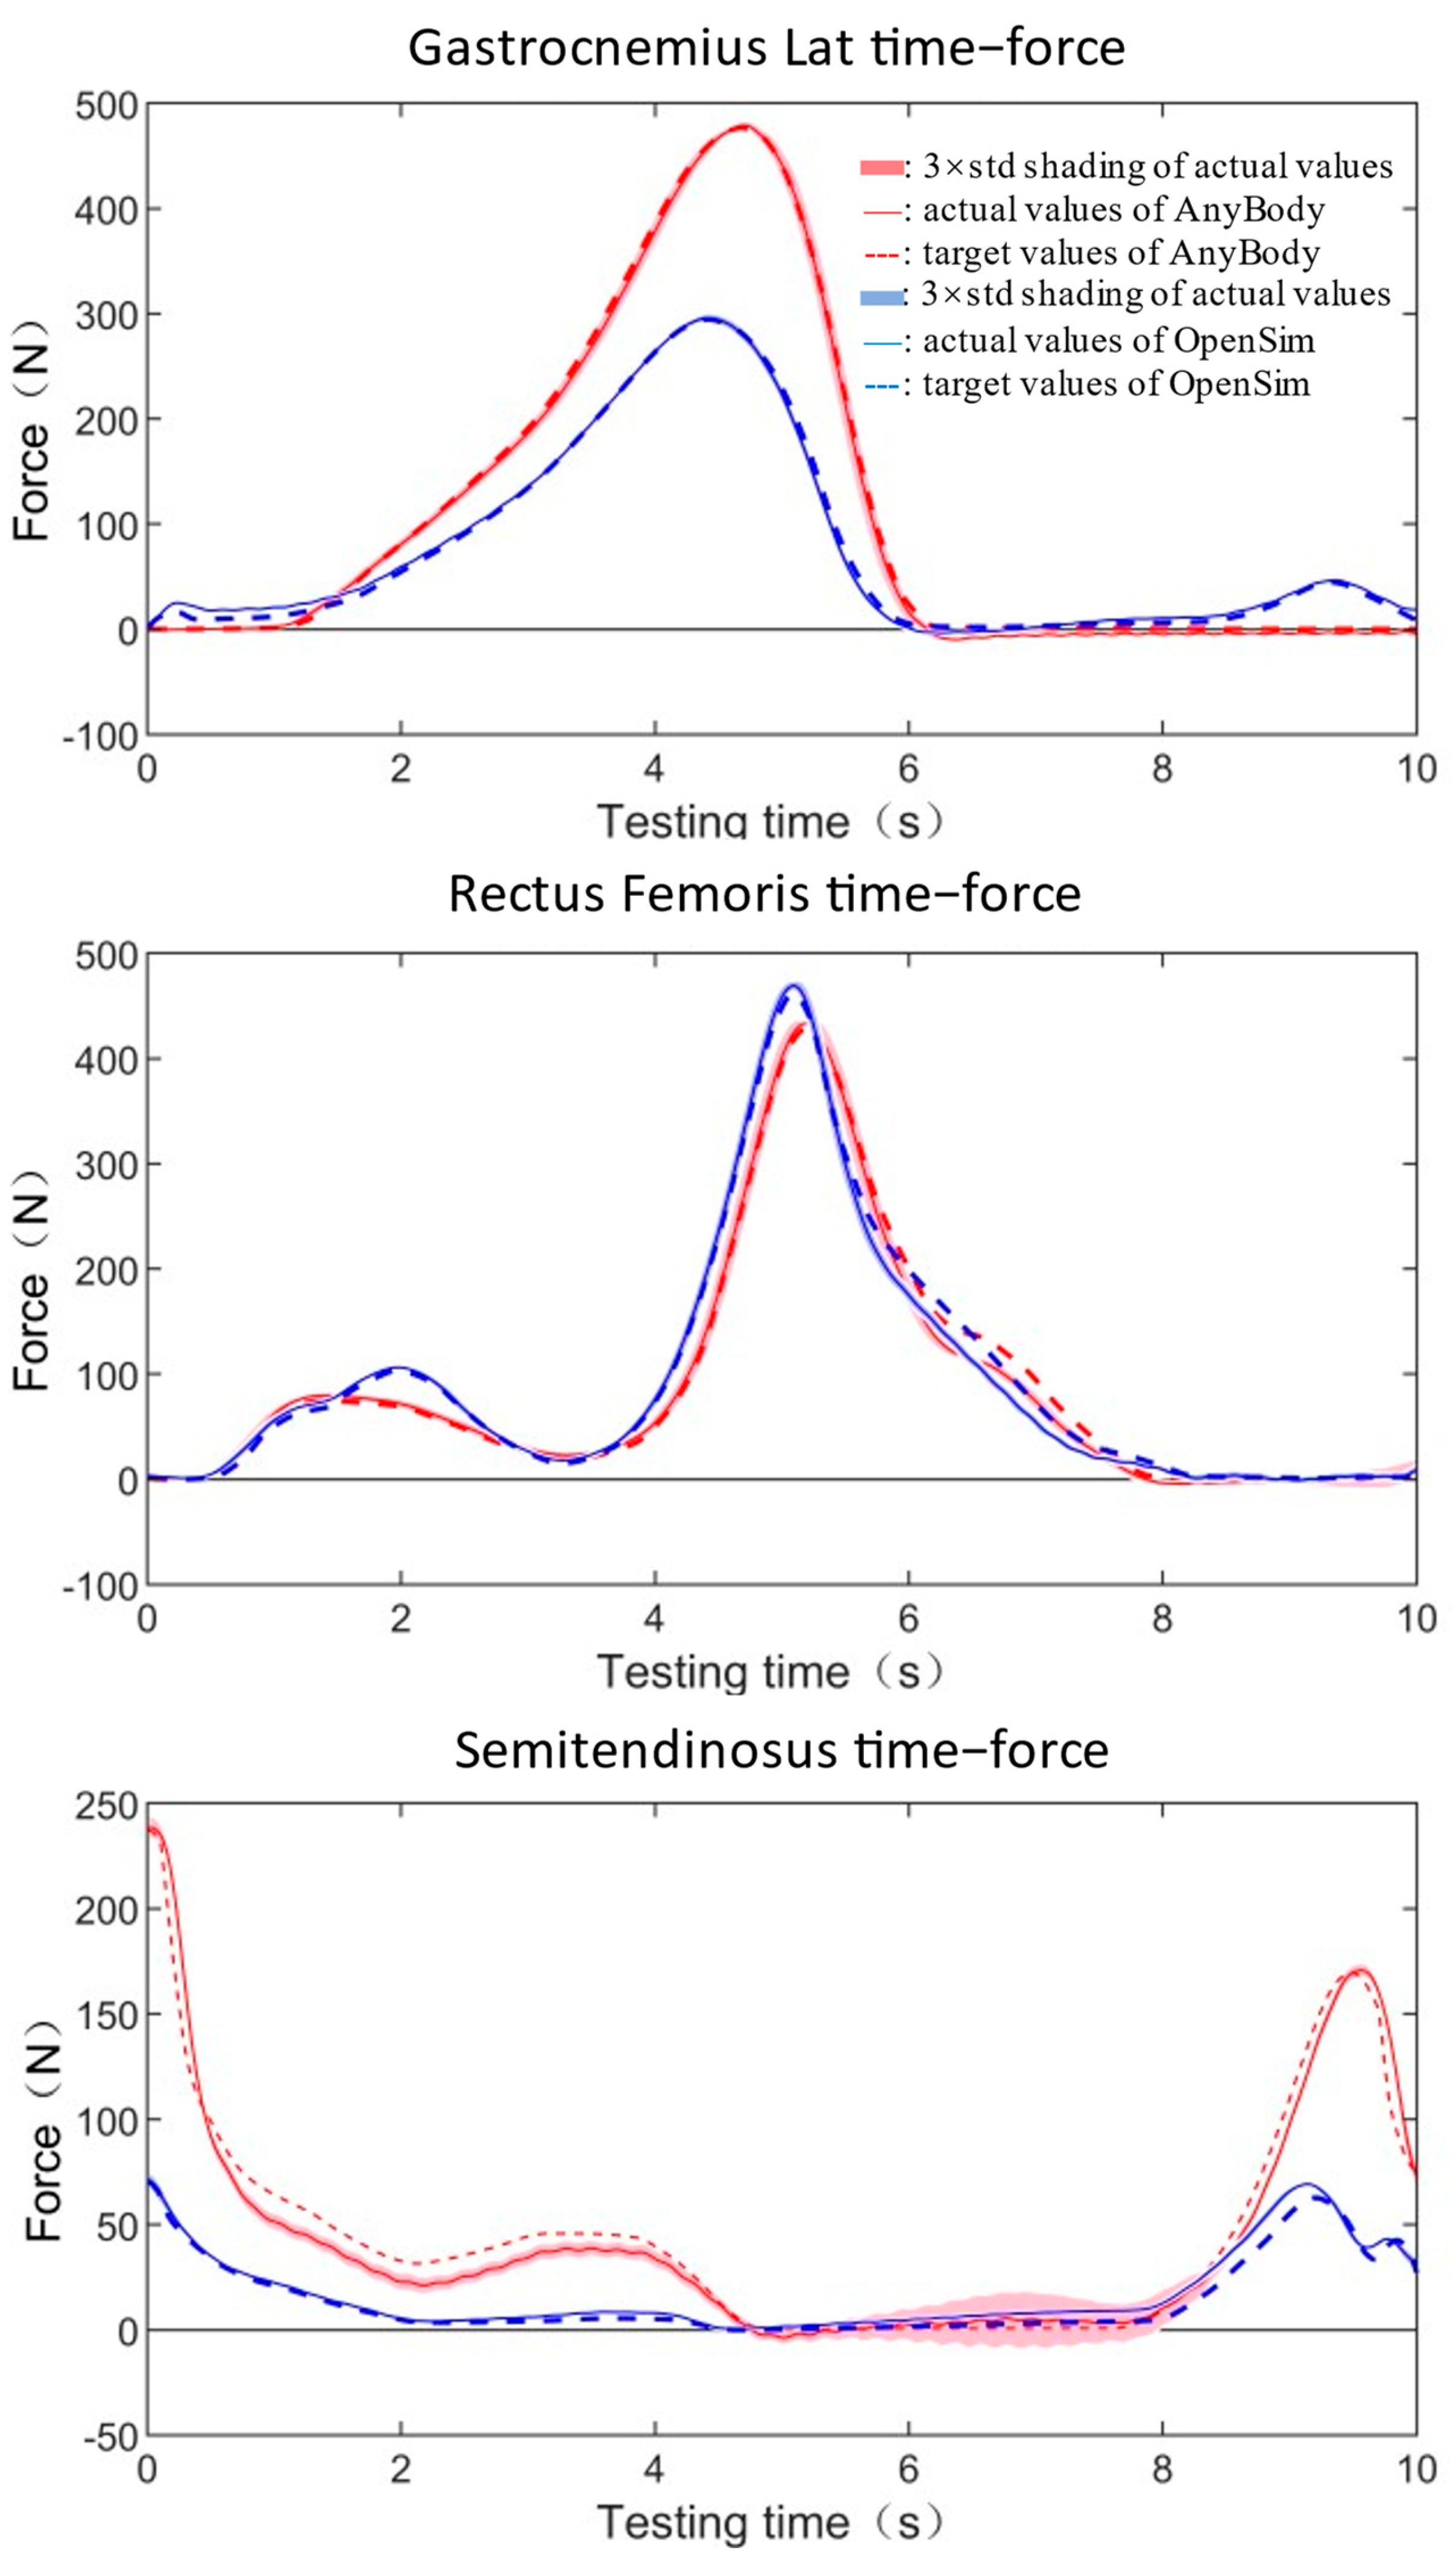
3.2. Actual Muscle Forces Reproducing Tests
4. Discussion
5. Conclusions
Author Contributions
Funding
Institutional Review Board Statement
Informed Consent Statement
Data Availability Statement
Acknowledgments
Conflicts of Interest
References
- Amis, A.A.; Miller, J.H. The mechanisms of elbow fractures: An investigation using impact tests in vitro. Injury 1995, 26, 163–168. [Google Scholar] [CrossRef] [PubMed]
- Zhang, C.; Mannen, E.M.; Sis, H.L.; Cadel, E.S.; Wong, B.M.; Wang, W.; Cheng, B.; Friis, E.A.; Anderson, D.E. Moment-rotation behavior of intervertebral joints in flexion-extension, lateral bending, and axial rotation at all levels of the human spine: A structured review and meta-regression analysis. J. Biomech. 2020, 100, 109579. [Google Scholar] [CrossRef]
- Shalhoub, S.; Fitzwater, F.; Eboch, W.; Dickinson, M.; Akhbari, B.; Louie, E.; Maletsky, L. In Vitro Experimental Testing of the Human Knee: A Concise Review. J. Knee Surg. 2015, 29, 138–148. [Google Scholar] [CrossRef] [PubMed]
- Miyaji, N.; Holthof, S.R.; Bastos, R.P.S.; Ball, S.V.; Espregueira-Mendes, J.; Williams, A.; Amis, A.A. A Triple-Strand Anatomic Medial Collateral Ligament Reconstruction Restores Knee Stability More Completely Than a Double-Strand Reconstruction: A Biomechanical Study In Vitro. Am. J. Sports Med. 2022, 50, 1832–1842. [Google Scholar] [CrossRef]
- Zhu, W.; Zhu, J.; Marshall, B.; Linde, M.A.; Smolinski, P.; Fu, F.H. Single-bundle MCL reconstruction with anatomic single-bundle ACL reconstruction does not restore knee kinematics. Knee Surg. Sports Traumatol. Arthrosc. 2020, 28, 2687–2696. [Google Scholar] [CrossRef] [PubMed]
- Parratte, S.; Price, A.J.; Jeys, L.M.; Jackson, W.F.; Clarke, H.D. Accuracy of a New Robotically Assisted Technique for Total Knee Arthroplasty: A Cadaveric Study. J. Arthroplast. 2019, 34, 2799–2803. [Google Scholar] [CrossRef] [PubMed]
- Bandi, M.; Benazzo, F.; Batailler, C.; Blatter, I.; Siggelkow, E.; Parratte, S. A Morphometric Fixed-Bearing Unicompartmental Knee Arthroplasty Can Reproduce Normal Knee Kinematics. An In Vitro Robotic Evaluation. Arthroplast. Today 2022, 16, 151–157. [Google Scholar] [CrossRef]
- Horbach, A.J.; Staat, M.; Pérez-Viana, D.; Simmen, H.-P.; Neuhaus, V.; Pape, H.-C.; Prescher, A.; Ciritsis, B. Biomechanical in vitro examination of a standardized low-volume tubular femoroplasty. Clin. Biomech. 2020, 80, 105104. [Google Scholar] [CrossRef]
- Manocha, R.H.K.; Banayan, S.; Johnson, J.A.; King, G.J.W. Overhead arm positioning in the rehabilitation of elbow dislocations: An in vitro biomechanical study. J. Hand Ther. 2022, 35, 245–253. [Google Scholar] [CrossRef]
- Spang Iii, R.C.; Nasr, M.C.; Mohamadi, A.; Deangelis, J.P.; Nazarian, A.; Ramappa, A.J. Rehabilitation following meniscal repair: A systematic review. BMJ Open Sport Exerc. Med. 2018, 4, e000212. [Google Scholar] [CrossRef] [PubMed]
- Park, G.; Lee, K.M.; Koo, S. Uniqueness of gait kinematics in a cohort study. Sci. Rep. 2021, 11, 15248. [Google Scholar] [CrossRef] [PubMed]
- Affatato, S.; Modena, E.; Carmignato, S.; Taddei, P. The use of Raman spectroscopy in the analysis of UHMWPE uni-condylar bearing systems after run on a force and displacement control knee simulators. Wear 2013, 297, 781–790. [Google Scholar] [CrossRef]
- Bell, K.M.; Hartman, R.A.; Gilbertson, L.G.; Kang, J.D. In vitro spine testing using a robot-based testing system: Comparison of displacement control and “hybrid control”. J. Biomech. 2013, 46, 1663–1669. [Google Scholar] [CrossRef]
- Volkheimer, D.; Malakoutian, M.; Oxland, T.R.; Wilke, H.-J. Limitations of current in vitro test protocols for investigation of instrumented adjacent segment biomechanics: Critical analysis of the literature. Eur. Spine J. 2015, 24, 1882–1892. [Google Scholar] [CrossRef]
- Woo, S.L.Y.; Fisher, M.B. Evaluation of Knee Stability with Use of a Robotic System. J. Bone Jt. Surg.-Am. Vol. 2009, 91A, 78–84. [Google Scholar] [CrossRef] [PubMed]
- Walker, P.S.; Arno, S.; Borukhoy, I.; Bell, C.P. Characterising knee motion and laxity in a testing machine for application to total knee evaluation. J. Biomech. 2015, 48, 3551–3558. [Google Scholar] [CrossRef]
- Willinger, L.; Shinohara, S.; Athwal, K.K.; Ball, S.; Williams, A.; Amis, A.A. Length-change patterns of the medial collateral ligament and posterior oblique ligament in relation to their function and surgery. Knee Surg. Sports Traumatol. Arthrosc. 2020, 28, 3720–3732. [Google Scholar] [CrossRef]
- He, L.; Xiang, Q.; Yang, Y.; Tsai, T.-Y.; Yu, Y.; Cheng, L. The anterior and traverse cage can provide optimal biomechanical performance for both traditional and percutaneous endoscopic transforaminal lumbar interbody fusion. Comput. Biol. Med. 2021, 131, 104291. [Google Scholar] [CrossRef]
- Darcy, S.P.; Rosvold, J.M.; Beveridge, J.E.; Corr, D.T.; Brown, J.J.Y.; Sutherland, C.A.; Marchuk, L.L.; Frank, C.B.; Shrive, N.G. A comparison of passive flexion-extension to normal gait in the ovine stifle joint. J. Biomech. 2008, 41, 854–860. [Google Scholar] [CrossRef]
- MacWilliams, B.A.; Wilson, D.R.; DesJardins, J.D.; Romero, J.; Chao, E.Y.S. Hamstrings cocontraction reduces internal rotation, anterior translation, and anterior cruciate ligament load in weight-bearing flexion. J. Orthop. Res. 1999, 17, 817–822. [Google Scholar] [CrossRef]
- Wunschel, M.; Leichtle, U.; Lo, J.; Wulker, N.; Muller, O. Differences in tibiofemoral kinematics between the unloaded robotic passive path and a weightbearing knee simulator. Orthop. Rev. 2012, 4, e2. [Google Scholar] [CrossRef][Green Version]
- Panjabi, M.; Abumi, K.; Duranceau, J.; Oxland, T. Spinal Stability and Intersegmental Muscle Forces. Spine 1989, 14, 194–200. [Google Scholar] [CrossRef] [PubMed]
- Li, G.; Zayontz, S.; Defrate, L.E.; Most, E.; Suggs, J.F.; Rubash, H.E. Kinematics of the knee at high flexion angles: An in vitro investigation. J. Orthop. Res. 2004, 22, 90–95. [Google Scholar] [CrossRef] [PubMed]
- Lv, S.; Dudek, D.M.; Cao, Y.; Balamurali, M.M.; Gosline, J.; Li, H. Designed biomaterials to mimic the mechanical properties of muscles. Nature 2010, 465, 69–73. [Google Scholar] [CrossRef] [PubMed]
- Kubo, K.; Ikebukuro, T.; Yata, H. Mechanical properties of muscles and tendon structures in middle-aged and young men. Sci. Rep. 2022, 12, 1702. [Google Scholar] [CrossRef]
- Popovic, D.; Stein, R.B.; Oguztoreli, M.N.; Lebiedowska, M.; Jonic, S. Optimal control of walking with functional electrical stimulation: A computer simulation study. IEEE Trans. Rehabil. Eng. 1999, 7, 69–79. [Google Scholar] [CrossRef]
- Durfee, W.K.; Palmer, K.I. Estimation of force-activation, force-length, and force-velocity properties in isolated, electrically stimulated muscle. IEEE Trans. Biomed. Eng. 1994, 41, 205–216. [Google Scholar] [CrossRef]
- Ferreira, L.M.; Johnson, J.A.; King, G.J.W. Development of an active elbow flexion simulator to evaluate joint kinematics with the humerus in the horizontal position. J. Biomech. 2010, 43, 2114–2119. [Google Scholar] [CrossRef]
- Schall, F.; Seitz, A.M.; Hacker, S.; van Drongelen, S.; Wolf, S.I.; Ignatius, A.; Dürselen, L. German Society of Biomechanics (DGfB) Young Investigator Award 2019: Proof-of-Concept of a Novel Knee Joint Simulator Allowing Rapid Motions at Physiological Muscle and Ground Reaction Forces. Front. Bioeng. Biotechnol. 2019, 7, 244. [Google Scholar] [CrossRef]
- Lin, Y.-C.; Dorn, T.W.; Schache, A.G.; Pandy, M.G. Comparison of different methods for estimating muscle forces in human movement. Proc. Inst. Mech. Eng. Part H-J. Eng. Med. 2012, 226, 103–112. [Google Scholar] [CrossRef]
- Trinler, U.; Hollands, K.; Jones, R.; Baker, R. A systematic review of approaches to modelling lower limb muscle forces during gait: Applicability to clinical gait analyses. Gait Posture 2018, 61, 353–361. [Google Scholar] [CrossRef] [PubMed]
- Trinler, U.; Schwameder, H.; Baker, R.; Alexander, N. Muscle force estimation in clinical gait analysis using AnyBody and OpenSim. J. Biomech. 2019, 86, 55–63. [Google Scholar] [CrossRef] [PubMed]
- Banks, H.T.; Hood, J.B.; Medhin, N.G.; Samuels, J.J.S. A stick-slip/Rouse hybrid model for viscoelasticity in polymers. Nonlinear Anal. Real World Appl. 2008, 9, 2128–2149. [Google Scholar] [CrossRef][Green Version]
- Baibakova, V.; Elzouka, M.; Lubner, S.; Prasher, R.; Jain, A. Optical emissivity dataset of multi-material heterogeneous designs generated with automated figure extraction. Sci. Data 2022, 9, 589. [Google Scholar] [CrossRef]
- Pewowaruk, R.J.; Gepner, A.D. Smooth muscle tone alters arterial stiffness: The importance of the extracellular matrix to vascular smooth muscle stiffness ratio. J. Hypertens. 2022, 40, 512–519. [Google Scholar] [CrossRef]
- Mohammed, G.A.; Hou, M. Optimization of active muscle force–length models using least squares curve fitting. IEEE Trans. Biomed. Eng. 2015, 63, 630–635. [Google Scholar] [CrossRef] [PubMed]
- DeWoody, Y.; Martin, C.; Schovanec, L. A forward dynamic model of gait with application to stress analysis of bone. Math. Comput. Model. 2001, 33, 121–143. [Google Scholar] [CrossRef]
- Park, M.-W.; Jeong, J.-H.; Ryu, J.-H.; Lee, H.-W.; Park, N.-G. Development of speed reducer with planocentric involute gearing mechanism. J. Mech. Sci. Technol. 2007, 21, 1172–1177. [Google Scholar] [CrossRef]
- Beermann, S. Reliability, lifetime and safety factors. Gear Technol. 2018, 8, 58–65. [Google Scholar]
- Lorenz, A.; Rothstock, S.; Bobrowitsch, E.; Beck, A.; Gruhler, G.; Ipach, I.; Leichtle, U.G.; Wülker, N.; Walter, C. Cartilage surface characterization by frictional dissipated energy during axially loaded knee flexion—An in vitro sheep model. J. Biomech. 2013, 46, 1427–1432. [Google Scholar] [CrossRef]
- Wilke, H.J.; Wenger, K.; Claes, L. Testing criteria for spinal implants: Recommendations for the standardization of in vitro stability testing of spinal implants. Eur. Spine J. 1998, 7, 148–154. [Google Scholar] [CrossRef] [PubMed]
- Williamson, P.; Mohamadi, A.; Ramappa, A.J.; DeAngelis, J.P.; Nazarian, A. Shoulder biomechanics of RC repair and Instability: A systematic review of cadaveric methodology. J. Biomech. 2019, 82, 280–290. [Google Scholar] [CrossRef]
- Bakshi, N.K.; Bayer, J.L.; Bigelow, E.M.R.; Jameel, O.F.; Sekiya, J.K. The Effect of Capsulectomy on Hip Joint Biomechanics. Orthop. J. Sports Med. 2017, 5, 2325967117733433. [Google Scholar] [CrossRef] [PubMed]
- Nester, C.J.; Liu, A.M.; Ward, E.; Howard, D.; Cocheba, J.; Derrick, T.; Patterson, P. In vitro study of foot kinematics using a dynamic walking cadaver model. J. Biomech. 2007, 40, 1927–1937. [Google Scholar] [CrossRef] [PubMed]
- Li, G.; Rudy, T.W.; Sakane, M.; Kanamori, A.; Ma, C.B.; Woo, S.L.Y. The importance of quadriceps and hamstring muscle loading on knee kinematics and in-situ forces in the ACL. J. Biomech. 1999, 32, 395–400. [Google Scholar] [CrossRef]
- Amis, A.A.; Senavongse, W.; Bull, A.M.J. Patellofemoral kinematics during knee flexion-extension: An in vitro study. J. Orthop. Res. 2006, 24, 2201–2211. [Google Scholar] [CrossRef]
- Elias, J.J.; Mattessich, S.M.; Kumagai, M.; Mizuno, Y.; Cosgarea, A.J.; Chao, E.Y. In vitro characterization of the relationship between the Q-angle and the lateral component of the quadriceps force. Proc. Inst. Mech. Eng. Part H J. Eng. Med. 2004, 218, 63–67. [Google Scholar] [CrossRef]
- Kebbach, M.; Grawe, R.; Geier, A.; Winter, E.; Bergschmidt, P.; Kluess, D.; D’Lima, D.D.; Woernle, C.; Bader, R. Effect of surgical parameters on the biomechanical behaviour of bicondylar total knee endoprostheses—A robot-assisted test method based on a musculoskeletal model. Sci. Rep. 2019, 9, 14504. [Google Scholar] [CrossRef]
- Erhart, S.; Lutz, M.; Arora, R.; Schmoelz, W. Measurement of intraarticular wrist joint biomechanics with a force controlled system. Med. Eng. Phys. 2012, 34, 900–905. [Google Scholar] [CrossRef]
- Chen, L.; Gordon, K.; Hurtig, M. Design and validation of a cadaveric knee joint loading device compatible with magnetic resonance imaging and computed tomography. Med. Eng. Phys. 2014, 36, 1346–1351. [Google Scholar] [CrossRef]
- Chen, L. Design and Validation of a Cadaveric Knee Joint Loading Device Compatible with Magnetic Resonance Imaging and Micro Computed Tomography; University of Guelph: Guelph, ON, Canada, 2013. [Google Scholar]


| Maximum Force | Mean Standard | GoF (NMSE) | ||||
|---|---|---|---|---|---|---|
| Target Value | Actual Value | Error (%) | ||||
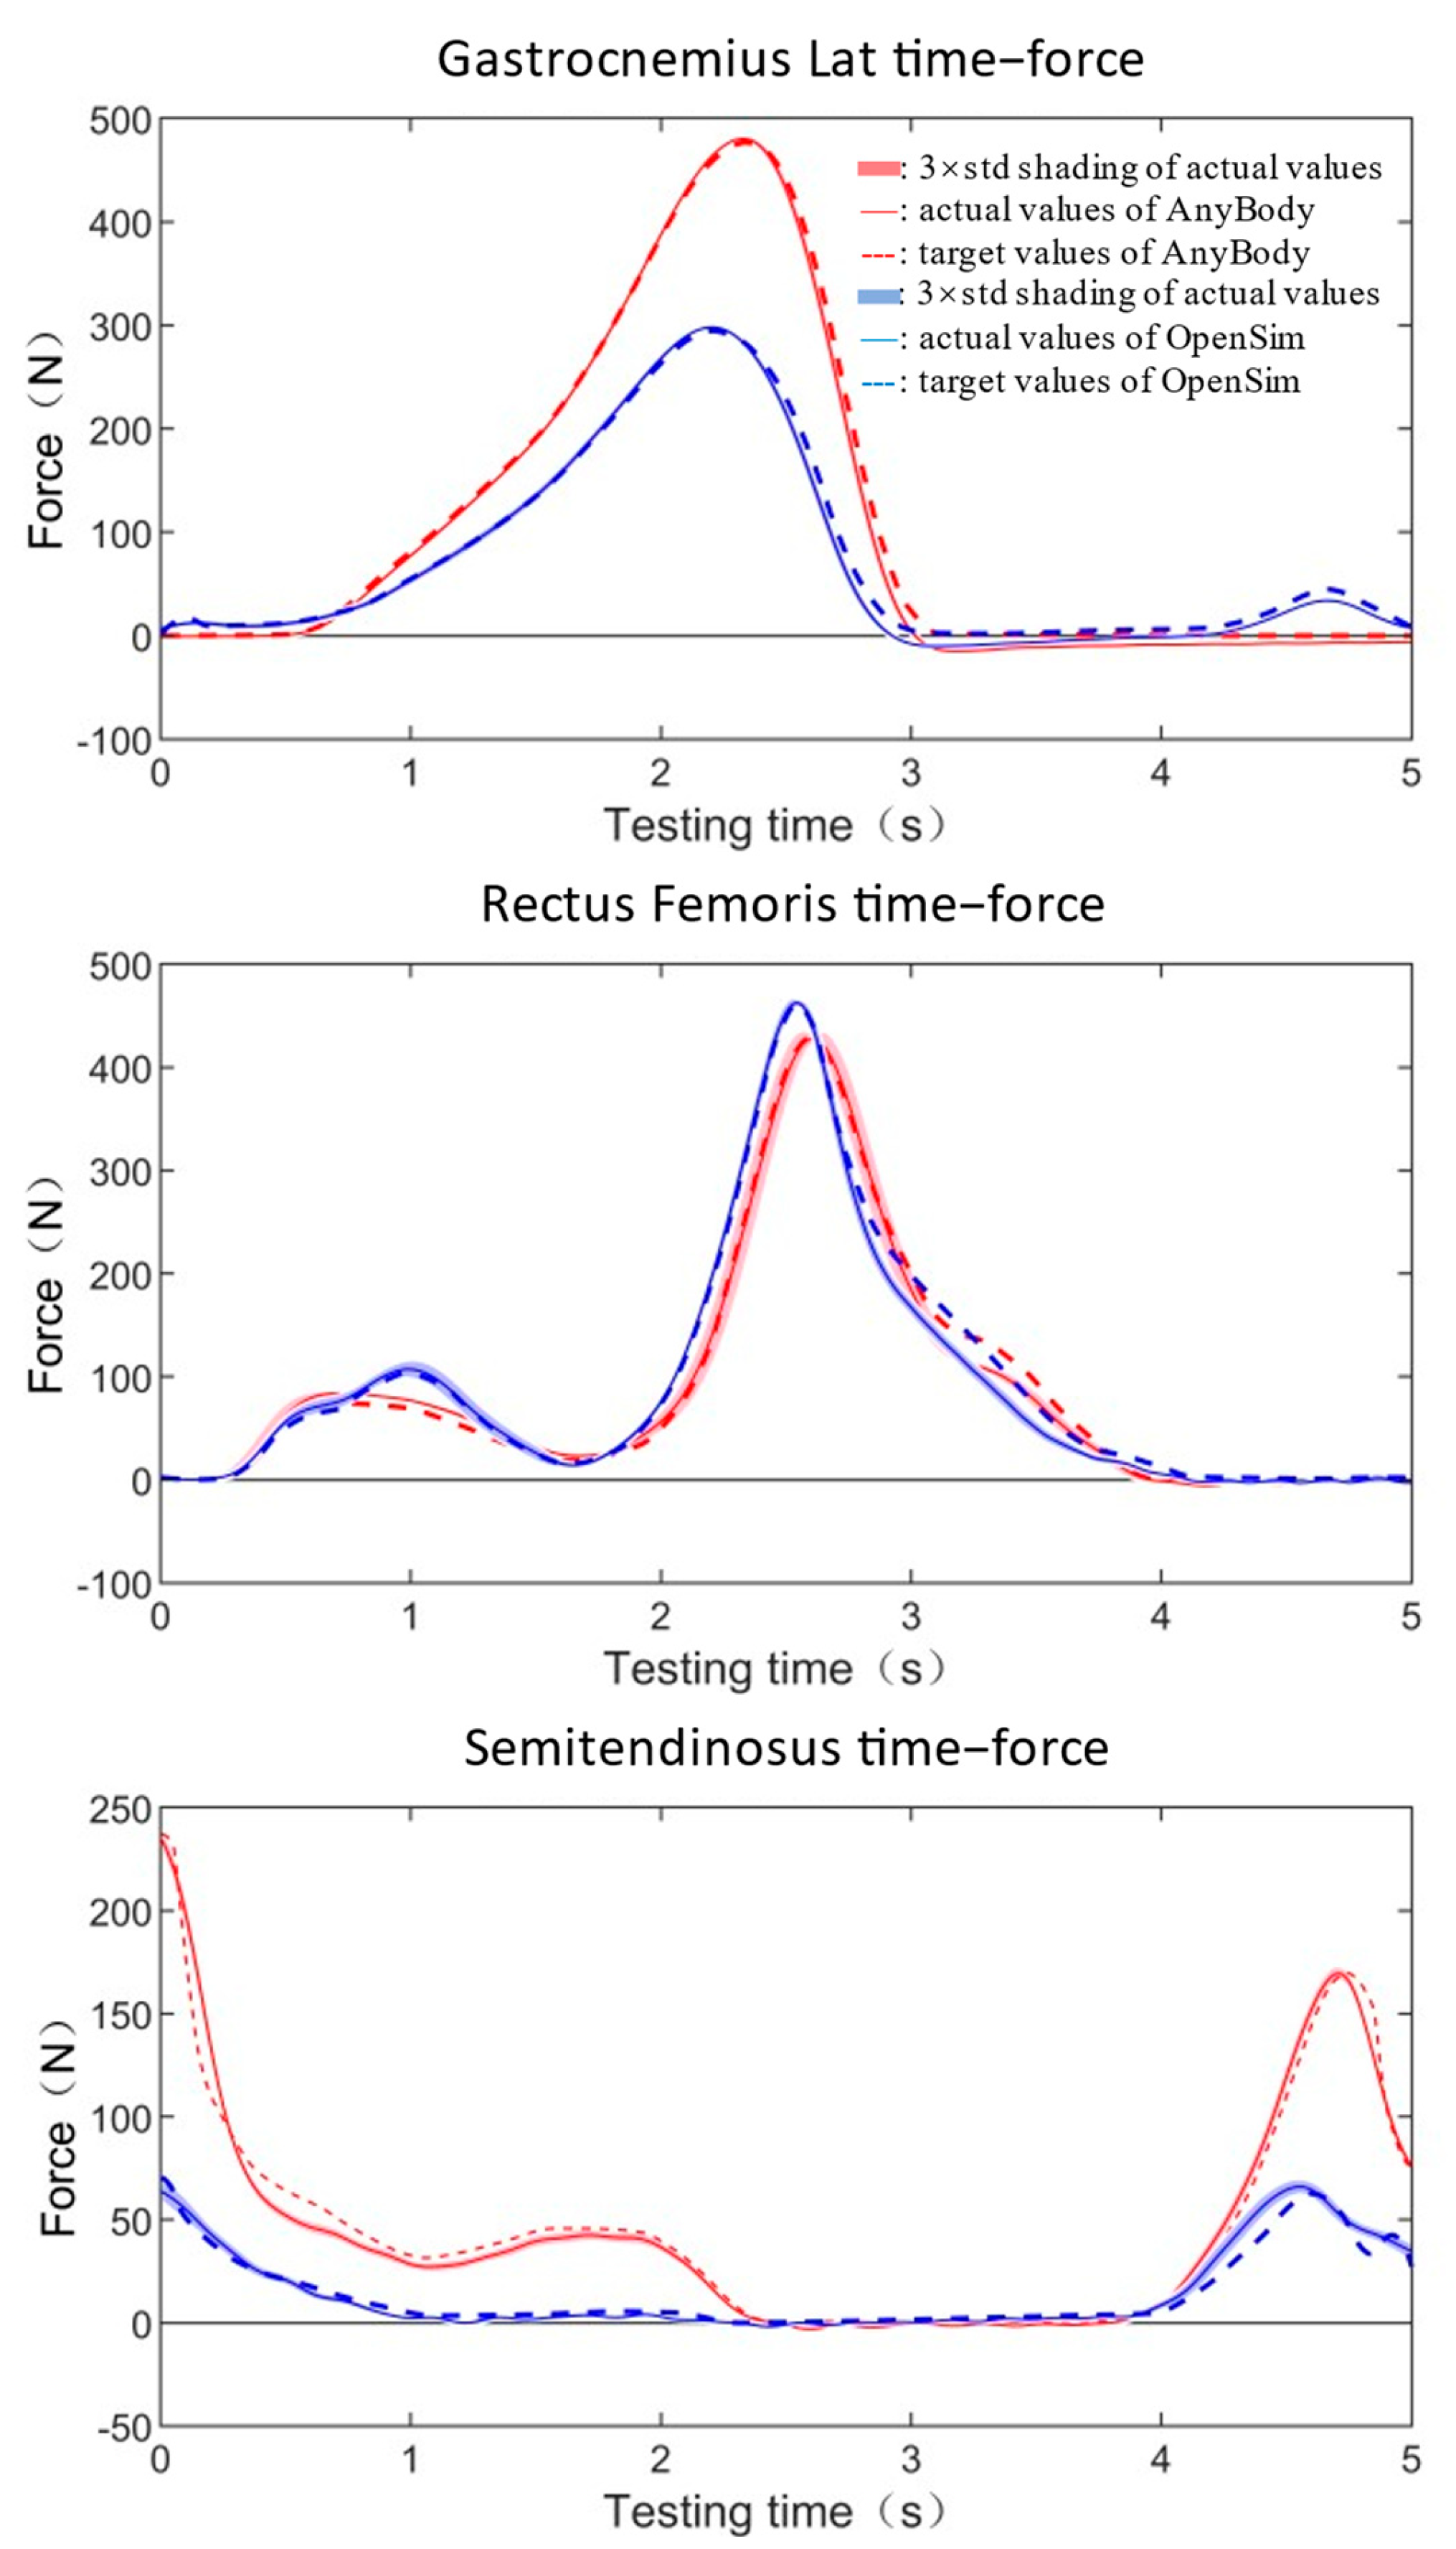
| gastrocnemius lateralis | AnyBody | 476.57 | 479.10 | 0.53 | 2.23 | 0.00 |
| OpenSim | 294.45 | 296.03 | 0.54 | 0.87 | 0.00 | |
| rectus femoris | AnyBody | 427.68 | 433.11 | 1.27 | 2.79 | 0.01 |
| OpenSim | 461.52 | 468.95 | 1.61 | 2.02 | 0.01 | |
| semitendinosus | AnyBody | 237.00 | 238.50 | 0.63 | 1.92 | 0.03 |
| OpenSim | 70.36 | 71.63 | 1.81 | 0.34 | 0.06 | |
| Maximum Force | Mean Standard | GoF (NMSE) | ||||
|---|---|---|---|---|---|---|
| Target Value | Actual Value | Error (%) | ||||
| gastrocnemius lateralis | AnyBody | 476.57 | 480.02 | 0.72 | 1.11 | 0.00 |
| OpenSim | 294.45 | 298.62 | 1.42 | 1.13 | 0.00 | |
| rectus femoris | AnyBody | 427.68 | 427.63 | −0.01 | 2.93 | 0.01 |
| OpenSim | 461.52 | 464.55 | 0.66 | 2.21 | 0.01 | |
| semitendinosus | AnyBody | 237.00 | 234.19 | −1.19 | 0.92 | 0.02 |
| OpenSim | 70.36 | 66.00 | −6.20 | 0.68 | 0.05 | |
Disclaimer/Publisher’s Note: The statements, opinions and data contained in all publications are solely those of the individual author(s) and contributor(s) and not of MDPI and/or the editor(s). MDPI and/or the editor(s) disclaim responsibility for any injury to people or property resulting from any ideas, methods, instructions or products referred to in the content. |
© 2023 by the authors. Licensee MDPI, Basel, Switzerland. This article is an open access article distributed under the terms and conditions of the Creative Commons Attribution (CC BY) license (https://creativecommons.org/licenses/by/4.0/).
Share and Cite
Yang, Y.; Wang, Y.; Zheng, N.; Cheng, R.; Zou, D.; Zhao, J.; Tsai, T.-Y. Development and Validation of a Novel In Vitro Joint Testing System for Reproduction of In Vivo Dynamic Muscle Force. Bioengineering 2023, 10, 1006. https://doi.org/10.3390/bioengineering10091006
Yang Y, Wang Y, Zheng N, Cheng R, Zou D, Zhao J, Tsai T-Y. Development and Validation of a Novel In Vitro Joint Testing System for Reproduction of In Vivo Dynamic Muscle Force. Bioengineering. 2023; 10(9):1006. https://doi.org/10.3390/bioengineering10091006
Chicago/Turabian StyleYang, Yangyang, Yufan Wang, Nan Zheng, Rongshan Cheng, Diyang Zou, Jie Zhao, and Tsung-Yuan Tsai. 2023. "Development and Validation of a Novel In Vitro Joint Testing System for Reproduction of In Vivo Dynamic Muscle Force" Bioengineering 10, no. 9: 1006. https://doi.org/10.3390/bioengineering10091006
APA StyleYang, Y., Wang, Y., Zheng, N., Cheng, R., Zou, D., Zhao, J., & Tsai, T.-Y. (2023). Development and Validation of a Novel In Vitro Joint Testing System for Reproduction of In Vivo Dynamic Muscle Force. Bioengineering, 10(9), 1006. https://doi.org/10.3390/bioengineering10091006