The Effect of Blood Rheology and Inlet Boundary Conditions on Realistic Abdominal Aortic Aneurysms under Pulsatile Flow Conditions
Abstract
1. Introduction
2. Materials and Methods
2.1. Image Segmentation, Surface Reconstruction, and Meshing
2.2. Simulation Setup, Boundary Conditions, and Rheology Models
2.3. Hemodynamic and Flow Parameters
2.4. Statistical Analysis
3. Results
3.1. Mesh Convergence
3.2. ANOVA Models
4. Discussion
5. Conclusions
Author Contributions
Funding
Institutional Review Board Statement
Informed Consent Statement
Data Availability Statement
Acknowledgments
Conflicts of Interest
Nomenclature
| U | fluid velocity |
| P | fluid pressure |
| fluid density | |
| stress tensor | |
| rate-of-deformation tensor | |
| shear rate | |
| μ | dynamic viscosity |
| IVD | Inlet Velocity Distribution |
| CY | Carreau–Yasuda |
| Cs | Casson |
| HB | Herschel–Bulkley |
| N | Newtonian |
| P | Power law |
| WSS | wall shear stress |
| TAWSS | time average wall shear stress |
| OSI | oscillatory shear index |
| RRT | relative residence time |
| fA | flow asymmetry |
| fD | flow dispersion |
| top 15% peak systolic velocity | |
| ANOVA | Analysis of variance |
| CI | Confidence Interval |
| p | order of convergence |
| r | grid refinement ratio |
| GCI | Grid Convergence Index |
| safety factor |
References
- Mendis, S.; Puska, P.; Norrving, B.; World Health Organization; World Heart Federation; World Stroke Organization. Global Atlas on Cardiovascular Disease Prevention and Control; World Health Organization: Geneva, Switzerland, 2011; p. 155. [Google Scholar]
- Minino, A.M.; Heron, M.P.; Murphy, S.L.; Kochanek, K.D.; Centers for Disease Control and Prevention, National Center for Health Statistics, National Vital Statistics System. Deaths: Final data for 2004. Natl. Vital. Stat. Rep. 2007, 55, 1–119. [Google Scholar] [PubMed]
- Bown, M.; Sutton, A.J.; Bell, P.R.F.; Sayers, R.D. A meta-analysis of 50 years of ruptured abdominal aortic aneurysm repair. Br. J. Surg. 2002, 89, 714–730. [Google Scholar] [CrossRef] [PubMed]
- Nordon, I.M.; Hinchliffe, R.J.; Loftus, I.M.; Thompson, M.M. Pathophysiology and epidemiology of abdominal aortic aneurysms. Nat. Rev. Cardiol. 2011, 8, 92–102. [Google Scholar] [CrossRef] [PubMed]
- Soerensen, D.D.; Pekkan, K.; de Zelicourt, D.; Sharma, S.; Kanter, K.; Fogel, M.; Yoganathan, A.P. Introduction of a New Optimized Total Cavopulmonary Connection. Ann. Thorac. Surg. 2007, 83, 2182–2190. [Google Scholar] [CrossRef] [PubMed]
- Taylor, C.A.; Draney, M.T.; Ku, J.P.; Parker, D.; Steele, B.N.; Wang, K.; Zarins, C.K. Predictive medicine: Computational techniques in therapeutic decision-making. Comput. Aided Surg. 1999, 4, 231–247. [Google Scholar] [CrossRef] [PubMed]
- Sauceda, A. A contemporary review of non-invasive methods in diagnosing abdominal aortic aneurysms. J. Ultrason. 2021, 21, 332–339. [Google Scholar] [CrossRef]
- Adams, L.C.; Brangsch, J.; Reimann, C.; Kaufmann, J.O.; Nowak, K.; Buchholz, R.; Karst, U.; Botnar, R.M.; Hamm, B.; Makowski, M.R. Noninvasive imaging of vascular permeability to predict the risk of rupture in abdominal aortic aneurysms using an albumin-binding probe. Sci. Rep. 2020, 10, 3231. [Google Scholar] [CrossRef]
- Elhanafy, A.; Guaily, A.; Elsaid, A. Numerical simulation of blood flow in abdominal aortic aneurysms: Effects of blood shear-thinning and viscoelastic properties. Math. Comput. Simul. 2019, 160, 55–71. [Google Scholar] [CrossRef]
- Tzirakis, K.; Kamarianakis, Y.; Metaxa, E.; Kontopodis, N.; Ioannou, C.V.; Papaharilaou, Y. A robust approach for exploring hemodynamics and thrombus growth associations in abdominal aortic aneurysms. Med. Biol. Eng. Comput. 2017, 55, 1493–1506. [Google Scholar] [CrossRef]
- Xenos, M.; Labropoulos, N.; Rambhia, S.; Alemu, Y.; Einav, S.; Tassiopoulos, A.; Sakalihasan, N.; Bluestein, D. Progression of Abdominal Aortic Aneurysm Towards Rupture: Refining Clinical Risk Assessment Using a Fully Coupled Fluid–Structure Interaction Method. Ann. Biomed. Eng. 2015, 43, 139–153. [Google Scholar] [CrossRef]
- Philip, N.T.; Patnaik, B.S.V.; Sudhir, B.J. Hemodynamic simulation of abdominal aortic aneurysm on idealised models: Investigation of stress parameters during disease progression. Comput. Methods Programs Biomed. 2022, 213, 106508. [Google Scholar] [CrossRef] [PubMed]
- Neofytou, P.; Tsangaris, S. Flow effects of blood constitutive equations in 3D models of vascular anomalies. Int. J. Numer. Methods Fluids 2006, 51, 489–510. [Google Scholar] [CrossRef]
- Arzani, A. Accounting for residence-time in blood rheology models: Do we really need non-Newtonian blood flow modelling in large arteries? J. R. Soc. Interface 2018, 15, 20180486. [Google Scholar] [CrossRef]
- Bilgi, C.; Atalık, K. Numerical investigation of the effects of blood rheology and wall elasticity in abdominal aortic aneurysm under pulsatile flow conditions. Biorheology 2019, 56, 51–71. [Google Scholar] [CrossRef] [PubMed]
- Skiadopoulos, A.; Neofytou, P.; Housiadas, C. Comparison of blood rheological models in patient specific cardiovascular system simulations. J. Hydrodyn. Ser. B 2017, 29, 293–304. [Google Scholar] [CrossRef]
- Morbiducci, U.; Ponzini, R.; Gallo, D.; Bignardi, C.; Rizzo, G. Inflow boundary conditions for image-based computational hemodynamics: Impact of idealized versus measured velocity profiles in the human aorta. J. Biomech. 2013, 46, 102–109. [Google Scholar] [CrossRef] [PubMed]
- Youssefi, P.; Gomez, A.; Arthurs, C.; Sharma, R.; Jahangiri, M.; Figueroa, C.A. Impact of Patient-Specific Inflow Velocity Profile on Hemodynamics of the Thoracic Aorta. J. Biomech. Eng. 2018, 140, 011002. [Google Scholar] [CrossRef]
- Madhavan, S.; Kemmerling, E.M.C. The effect of inlet and outlet boundary conditions in image-based CFD modeling of aortic flow. Biomed. Eng. Online 2018, 17, 66. [Google Scholar] [CrossRef]
- Fuchs, A.; Berg, N.; Wittberg, L.P. Pulsatile Aortic Blood Flow—A Critical Assessment of Boundary Conditions. ASME J. Med. Diagn. 2020, 4, 011002. [Google Scholar] [CrossRef]
- Jiang, Y.; Zhang, J.; Zhao, W. Effects of the inlet conditions and blood models on accurate prediction of hemodynamics in the stented coronary arteries. AIP Adv. 2015, 5, 057109. [Google Scholar] [CrossRef]
- Moyle, K.R.; Antiga, L.; Steinman, D.A. Inlet conditions for image-based CFD models of the carotid bifurcation: Is it reasonable to assume fully developed flow? J. Biomech. Eng. 2006, 128, 371–379. [Google Scholar] [CrossRef] [PubMed]
- Marzo, A.; Singh, P.; Reymond, P.; Stergiopulos, N.; Patel, U.; Hose, R. Influence of inlet boundary conditions on the local haemodynamics of intracranial aneurysms. Comput. Methods Biomech. Biomed. Eng. 2009, 12, 431–444. [Google Scholar] [CrossRef] [PubMed]
- Hardman, D.; Semple, S.I.; Richards, J.M.; Hoskins, P.R. Comparison of patient-specific inlet boundary conditions in the numerical modelling of blood flow in abdominal aortic aneurysm disease. Int. J. Numer. Methods Biomed. Eng. 2013, 29, 165–178. [Google Scholar] [CrossRef] [PubMed]
- Metaxa, E.; Kontopodis, N.; Vavourakis, V.; Tzirakis, K.; Ioannou, C.V.; Papaharilaou, Y. The influence of intraluminal thrombus on noninvasive abdominal aortic aneurysm wall distensibility measurement. Med. Biol. Eng. Comput. 2015, 53, 299–308. [Google Scholar] [CrossRef] [PubMed]
- Yushkevich, P.A.; Piven, J.; Hazlett, H.C.; Smith, R.G.; Ho, S.; Gee, J.C.; Gerig, G. User-guided 3D active contour segmentation of anatomical structures: Significantly improved efficiency and reliability. Neuroimage 2006, 31, 1116–1128. [Google Scholar] [CrossRef]
- Antiga, L.; Piccinelli, M.; Botti, L.; Ene-Iordache, B.; Remuzzi, A.; Steinman, D.A. An image-based modeling framework for patient-specific computational hemodynamics. Med. Biol. Eng. Comput. 2008, 46, 1097–1112. [Google Scholar] [CrossRef]
- Taubin, G. Curve and surface smoothing without shrinkage. In Proceedings of the Fifth International Conference on Computer Vision, IEEE Computer Society, Cambridge, MA, USA, 20–23 June 1995; pp. 852–857. [Google Scholar]
- De Santis, G.; Mortier, P.; De Beule, M.; Segers, P.; Verdonck, P.; Verhegghe, B. Patient-specific computational fluid dynamics: Structured mesh generation from coronary angiography. Med. Biol. Eng. Comput. 2010, 48, 371–380. [Google Scholar] [CrossRef]
- Olufsen, M.S.; Peskin, C.S.; Kim, W.Y.; Pedersen, E.M.; Nadim, A.; Larsen, J. Numerical Simulation and Experimental Validation of Blood Flow in Arteries with Structured-Tree Outflow Conditions. Ann. Biomed. Eng. 2000, 28, 1281–1299. [Google Scholar] [CrossRef]
- Rana, M.S.; Rubby, M.F.; Hasan, A.T. Study of Physiological Flow Through an Abdominal Aortic Aneurysm (AAA). Procedia Eng. 2015, 105, 885–892. [Google Scholar] [CrossRef]
- Kaewchoothong, N.; Algabri, Y.A.; Assawalertsakul, T.; Nuntadusit, C.; Chatpun, S. Computational Study of Abdominal Aortic Aneurysms with Severely Angulated Neck Based on Transient Hemodynamics Using an Idealized Model. Appl. Sci. 2022, 12, 2113. [Google Scholar] [CrossRef]
- Leung, J.H.; Wright, A.R.; Cheshire, N.; Crane, J.; Thom, S.A.; Hughes, A.D.; Xu, Y. Fluid structure interaction of patient specific abdominal aortic aneurysms: A comparison with solid stress models. Biomed. Eng. Online 2006, 5, 33. [Google Scholar] [CrossRef] [PubMed]
- Finol, E.; Amon, C.H. Flow dynamics in anatomical models of abdominal aortic aneurysms: Computational analysis of pulsatile flow. Acta Cient. Venez. 2003, 54, 43–49. [Google Scholar] [PubMed]
- Boyd, A.J.; Kuhn, D.C.; Lozowy, R.J.; Kulbisky, G.P. Low wall shear stress predominates at sites of abdominal aortic aneurysm rupture. J. Vasc. Surg. 2016, 63, 1613–1619. [Google Scholar] [CrossRef] [PubMed]
- Egelhoff, C.; Budwig, R.; Elger, D.; Khraishi, T.; Johansen, K. Model studies of the flow in abdominal aortic aneurysms during resting and exercise conditions. J. Biomech. 1999, 32, 1319–1329. [Google Scholar] [CrossRef] [PubMed]
- Khanafer, K.M.; Bull, J.L.; Upchurch, G.R., Jr.; Berguer, R. Turbulence significantly increases pressure and fluid shear stress in an aortic aneurysm model under resting and exercise flow conditions. Ann. Vasc. Surg. 2007, 21, 67–74. [Google Scholar] [CrossRef] [PubMed]
- Tzirakis, K.; Kamarianakis, Y.; Kontopodis, N.; Ioannou, C.V. Classification of blood rheological models through an idealized bifurcation. Symmetry, 2023; submitted. [Google Scholar]
- Cho, Y.I.; Kensey, K.R. Effects of the non-Newtonian viscosity of blood on flows in a diseased arterial vessel. Part 1: Steady flows. Biorheology 1991, 28, 241–262. [Google Scholar] [CrossRef]
- Weddell, J.C.; Kwack, J.; Imoukhuede, P.I.; Masud, A. Hemodynamic Analysis in an Idealized Artery Tree: Differences in Wall Shear Stress between Newtonian and Non-Newtonian Blood Models. PLoS ONE 2015, 10, e0124575. [Google Scholar] [CrossRef]
- Fung, Y.C. Mechanical properties and active remodeling of blood vessels. In Biomechanics: Mechanical Properties of Living Tissues; Springer: Berlin/Heidelberg, Germany, 1993. [Google Scholar]
- Valant, A.Z.; Ziberna, L.; Papaharilaou, Y.; Anayiotos, A.; Georgiou, G.C. The infuence of temperature on rheological properties of blood mixtures with different volume expanders-implications in numerical arterial hemodynamics simulations. Rheol. Acta 2011, 50, 389–402. [Google Scholar] [CrossRef]
- Soulis, J.V.; Giannoglou, G.D.; Chatzizisis, Y.S.; Seralidou, K.V.; Parcharidis, G.E.; Louridas, G.E. Non-Newtonian models for molecular viscosity and wall shear stress in a 3D reconstructed human left coronary artery. Med. Eng. Phys. 2008, 30, 9–19. [Google Scholar] [CrossRef]
- Souza, M.S.; Souza, A.; Carvalho, V.; Teixeira, S.; Fernandes, C.S.; Lima, R.; Ribeiro, J. Fluid Flow and Structural Numerical Analysis of a Cerebral Aneurysm Model. Fluids 2022, 7, 100. [Google Scholar] [CrossRef]
- Molla, M.; Paul, M. LES of non-Newtonian physiological blood flow in a model of arterial stenosis. Med. Eng. Phys. 2012, 34, 1079–1087. [Google Scholar] [CrossRef] [PubMed]
- Luo, X.; Kuang, Z. A study on the constitutive equation of blood. J. Biomech. 1992, 25, 929–934. [Google Scholar] [CrossRef] [PubMed]
- Husain, I.; Labropulu, F.; Langdon, C.; Schwark, J. A comparison of Newtonian and non-Newtonian models for pulsatile blood flow simulations. J. Mech. Behav. Biomed Mater. 2013, 21, 147–153. [Google Scholar] [CrossRef]
- He, X.; Ku, D.N. Pulsatile Flow in the Human Left Coronary Artery Bifurcation: Average Conditions. J. Biomech. Eng. 1996, 118, 74–82. [Google Scholar] [CrossRef] [PubMed]
- Himburg, H.A.; Grzybowski, D.; Hazel, A.; LaMack, J.; Li, X.-M.; Friedman, M.H. Spatial comparison between wall shear stress measures and porcine arterial endothelial permeability. Am. J. Physiol. Heart Circ. Physiol. 2004, 286, H1916–H1922. [Google Scholar] [CrossRef]
- Malek, A.M.; Alper, S.L.; Izumo, S. Hemodynamic Shear Stress and Its Role in Atherosclerosis. JAMA 1999, 282, 2035–2042. [Google Scholar] [CrossRef]
- Morbiducci, U.; Gallo, D.; Ponzini, R.; Massai, D.; Antiga, L.; Montevecchi, F.M.; Redaelli, A. Quantitative Analysis of Bulk Flow in Image-Based Hemodynamic Models of the Carotid Bifurcation: The Influence of Outflow Conditions as Test Case. Ann. Biomed. Eng. 2010, 38, 3688–3705. [Google Scholar] [CrossRef]
- Mahadevia, R.; Barker, A.; Schnell, S.; Entezari, P.; Kansal, P.; Fedak, P.; Malaisrie, S.C.; McCarthy, P.; Collins, J.; Carr, J.; et al. Bicuspid Aortic Cusp Fusion Morphology Alters Aortic Three-Dimensional Outflow Patterns, Wall Shear Stress, and Expression of Aortopathy. Circulation 2014, 129, 673–682. [Google Scholar] [CrossRef]
- Lawson, J. Design and Analysis of Experiments with R, 1st ed.; Chapman and Hall/CRC: New York, NY, USA, 2014; pp. 65–150. [Google Scholar]
- Wilcox, R. Introduction to Robust Estimation and Hypothesis Testing, 4th ed.; Academic Press: Cambridge, MA, USA, 2012. [Google Scholar] [CrossRef]
- Mair, P.; Wilcox, R. Robust statistical methods in R using the WRS2 package. Behav. Res. Methods 2020, 52, 464–488. [Google Scholar] [CrossRef]
- Benjamin, D.J.; Berger, J.O. Three Recommendations for Improving the Use of p-Values. Am. Stat. 2019, 73, 186–191. [Google Scholar] [CrossRef]
- Wasserstein, R.; Lazar, N. The ASA’s statement on p-values: Context, Process, and Purpose. Am. Stat. 2017, 70, 129–133. [Google Scholar] [CrossRef]
- Roache, P.J. Verification and Validation in Computational Science and Engineering; Hermosa Pub: Albuquerque, Mexico, 1998; p. 464. [Google Scholar]
- ASME. Standard for Verification and Validation in Computational Fluid Dynamics and Heat Transfer; ASME: New York, NY, USA, 2008; p. 100. [Google Scholar]

| Case | Inlet Radius (m) | Mean Re | Max Re | α |
|---|---|---|---|---|
| 2B | 0.01148 | 452.0 | 2026.5 | 15.87 |
| 7A | 0.01167 | 459.4 | 2060.0 | 16.13 |
| 14B | 0.01168 | 459.8 | 2061.8 | 16.15 |
| 16A | 0.01157 | 455.5 | 2042.4 | 16.00 |
| 31A | 0.01157 | 455.5 | 2042.4 | 16.00 |
| 41B | 0.01152 | 453.5 | 2033.5 | 15.93 |
| 63A | 0.01145 | 450.8 | 2021.2 | 15.83 |
| Name (Abbreviation) | Expression | Parameter Values | References |
|---|---|---|---|
| Carreau–Yasuda (CY) | [14,39,40] | ||
| Casson (Cs) | [39,41] | ||
| Herschel–Bulkley (HB) | [10,42] | ||
| Newtonian (N) | [43,44] | ||
| Power law (P) | [45,46,47] |
| # Elements | 194,392 | 388,080 | 776,000 | ||||
|---|---|---|---|---|---|---|---|
| TAWSS | 0.6507 | 0.6523 | 0.6530 | 1.25533 | 0.093225 | 0.222779 | 1.0010 |
| OSI | 0.2209 | 0.2227 | 0.2231 | 2.11008 | 0.069600 | 0.301029 | 1.0019 |
| RRT | 5.0077 | 5.1355 | 5.1875 | 1.29873 | 0.857794 | 2.131632 | 1.0101 |
| Rm | IVD | Rm:IVD | |
|---|---|---|---|
| FA% | 0.999 | 0.719 | 0.999 |
| FD% | 0.415 | 0.002 | 0.999 |
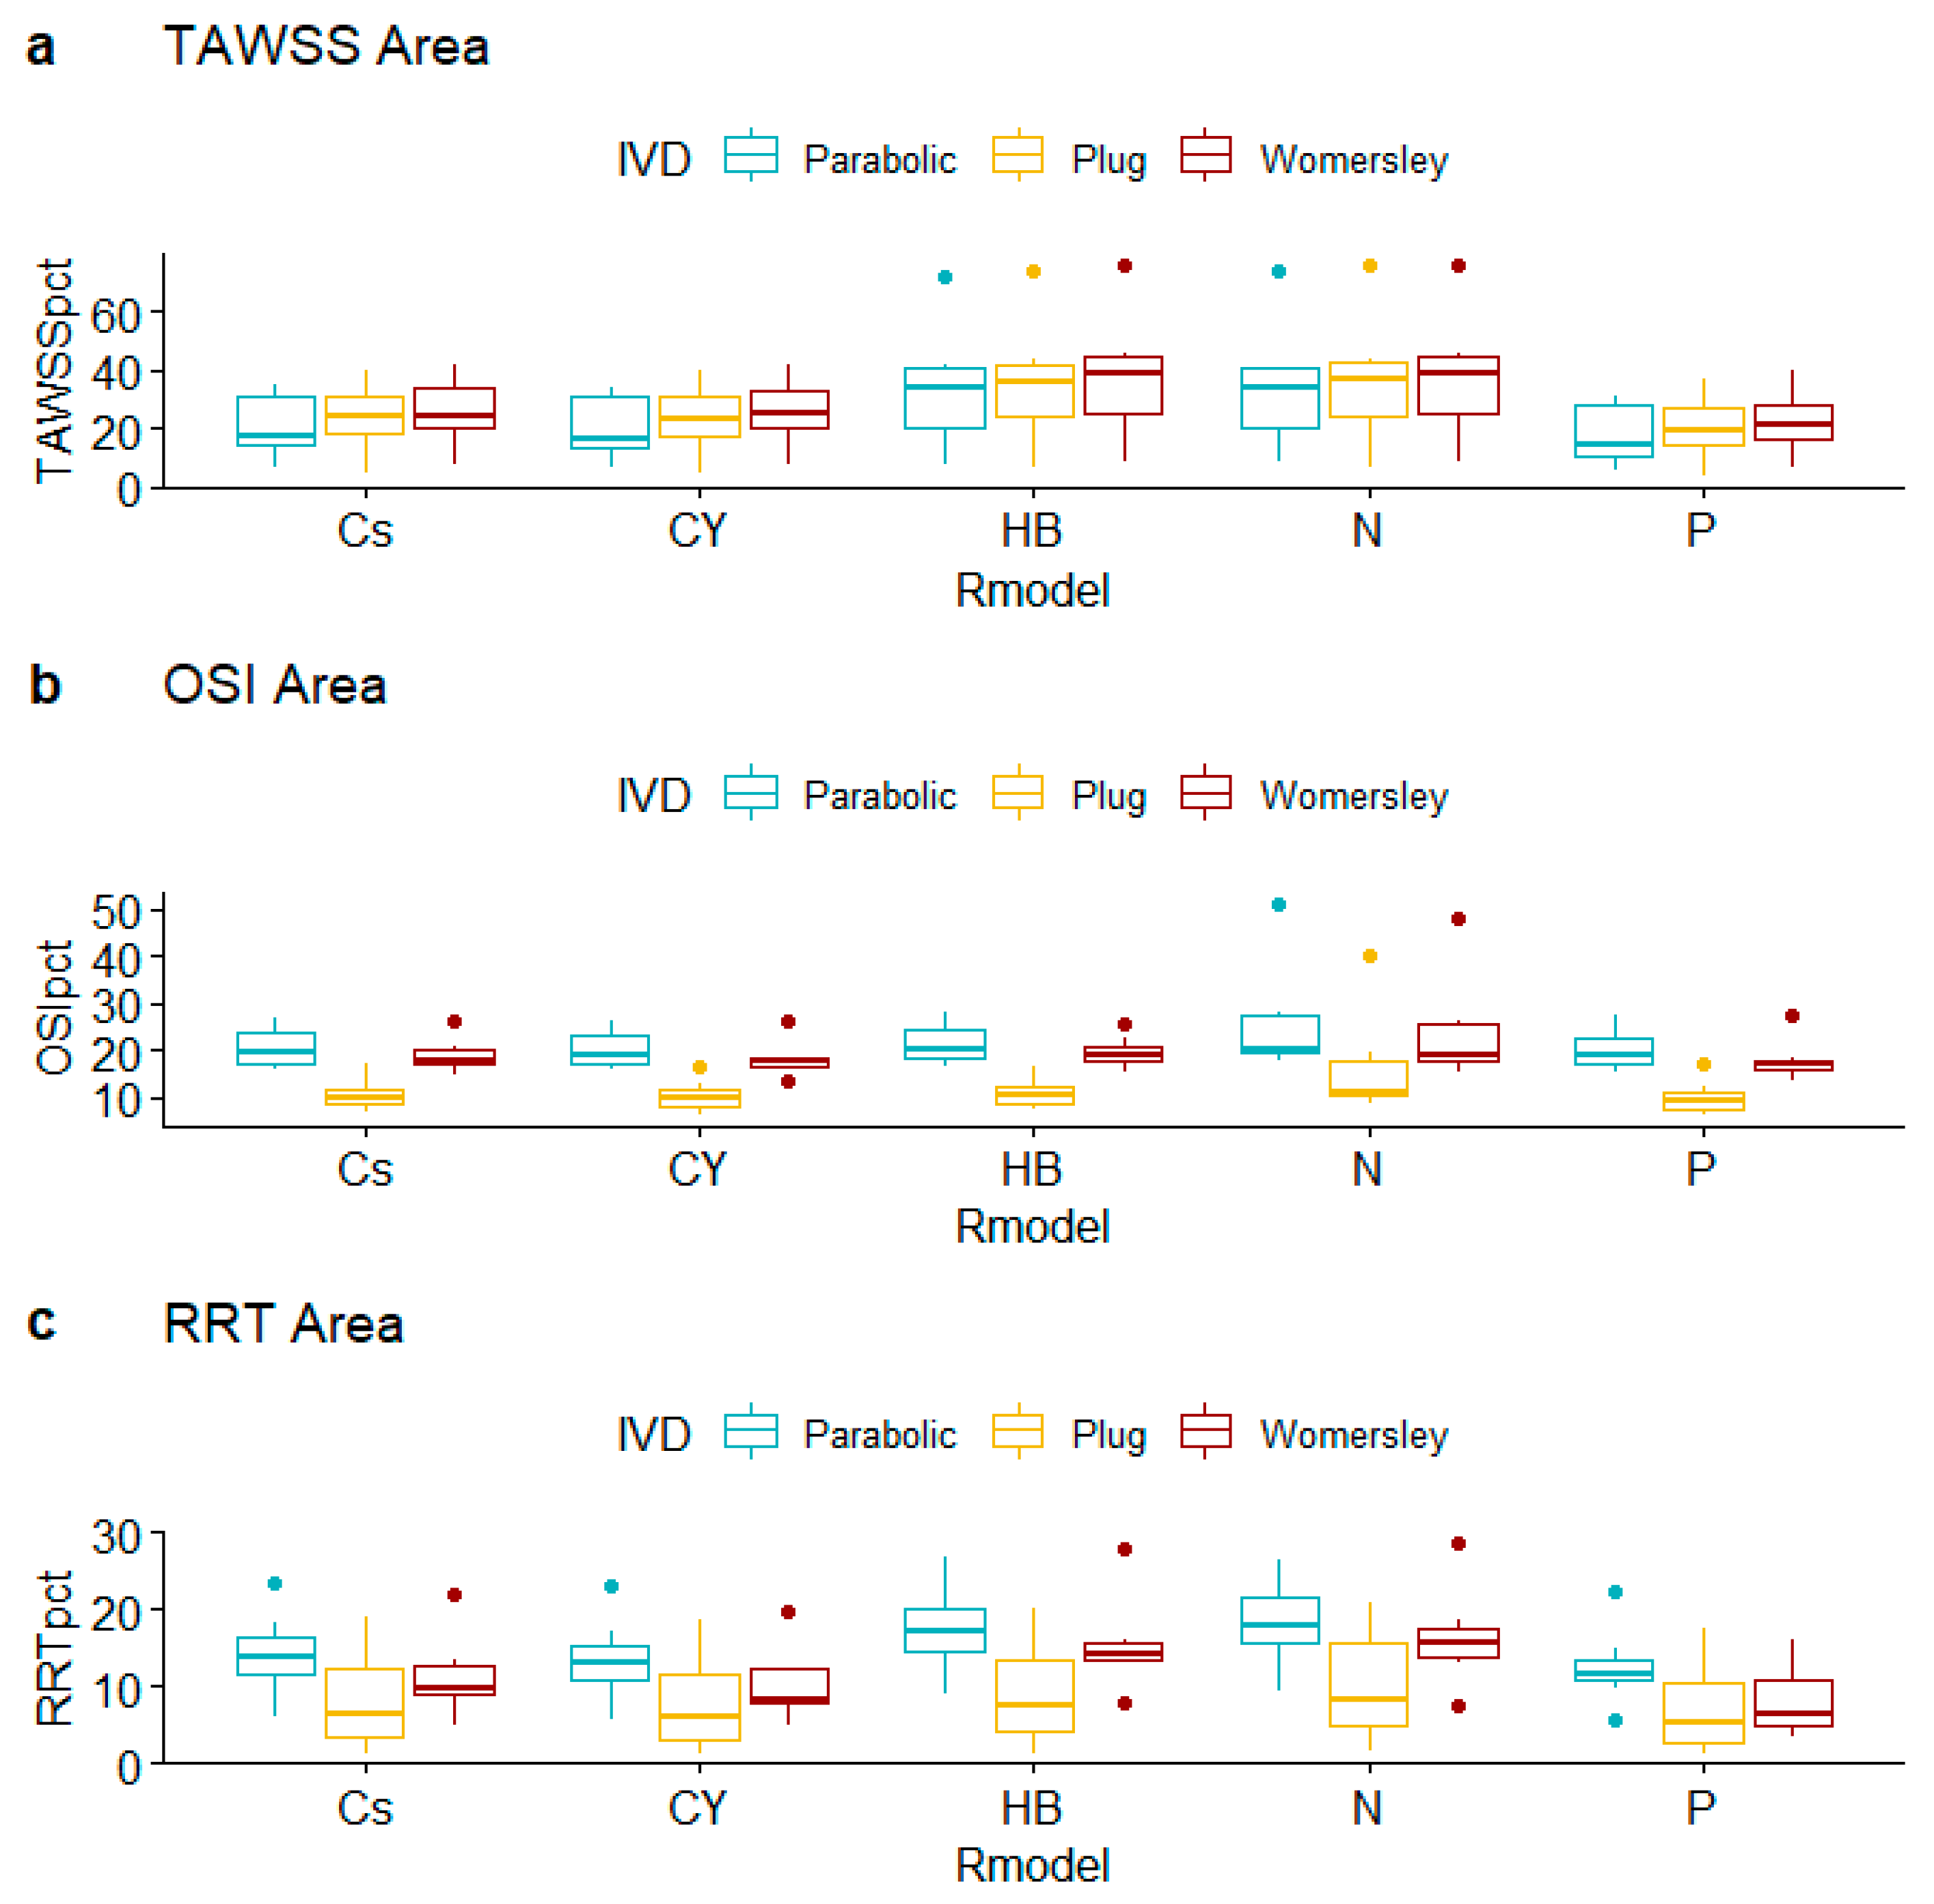
| TAWSS% | 0.009 | 0.392 | 0.999 |
| OSI% | 0.237 | 0.001 | 0.999 |
| RRT% | 0.008 | 0.001 | 0.987 |
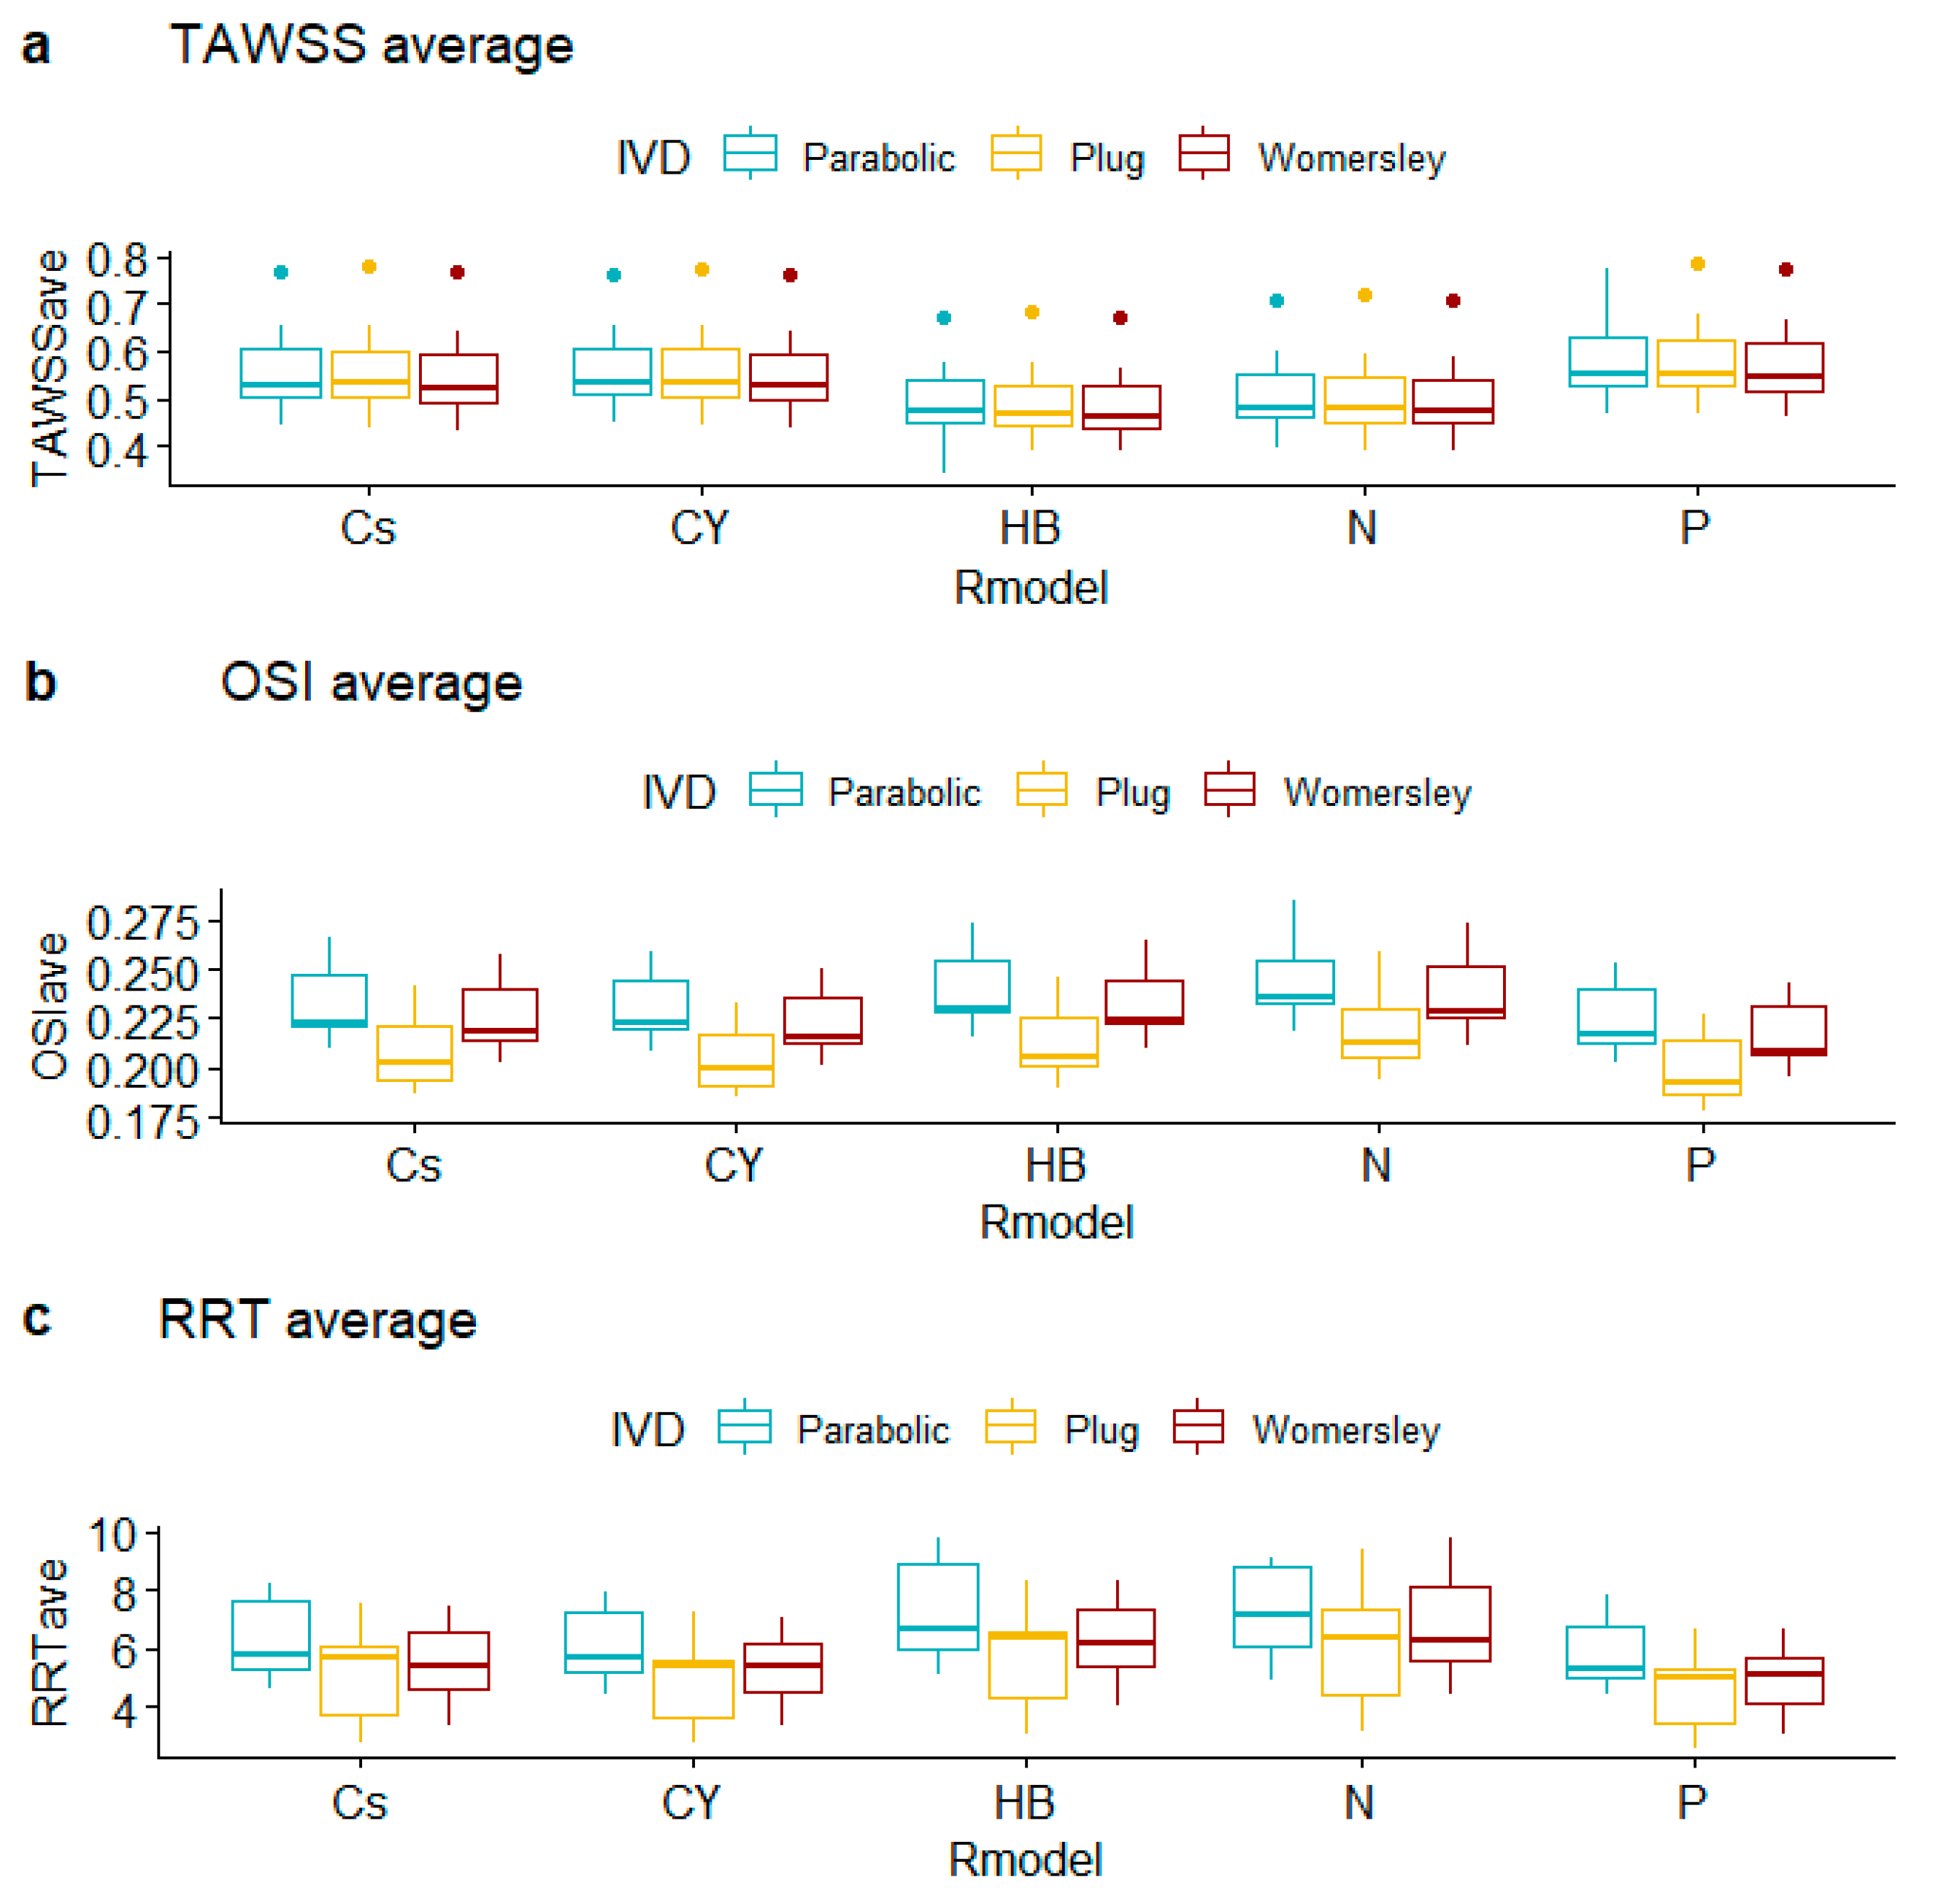
| TAWSSave | 0.030 | 0.916 | 0.999 |
| OSIave | 0.065 | 0.001 | 0.999 |
| RRTave | 0.045 | 0.017 | 0.999 |
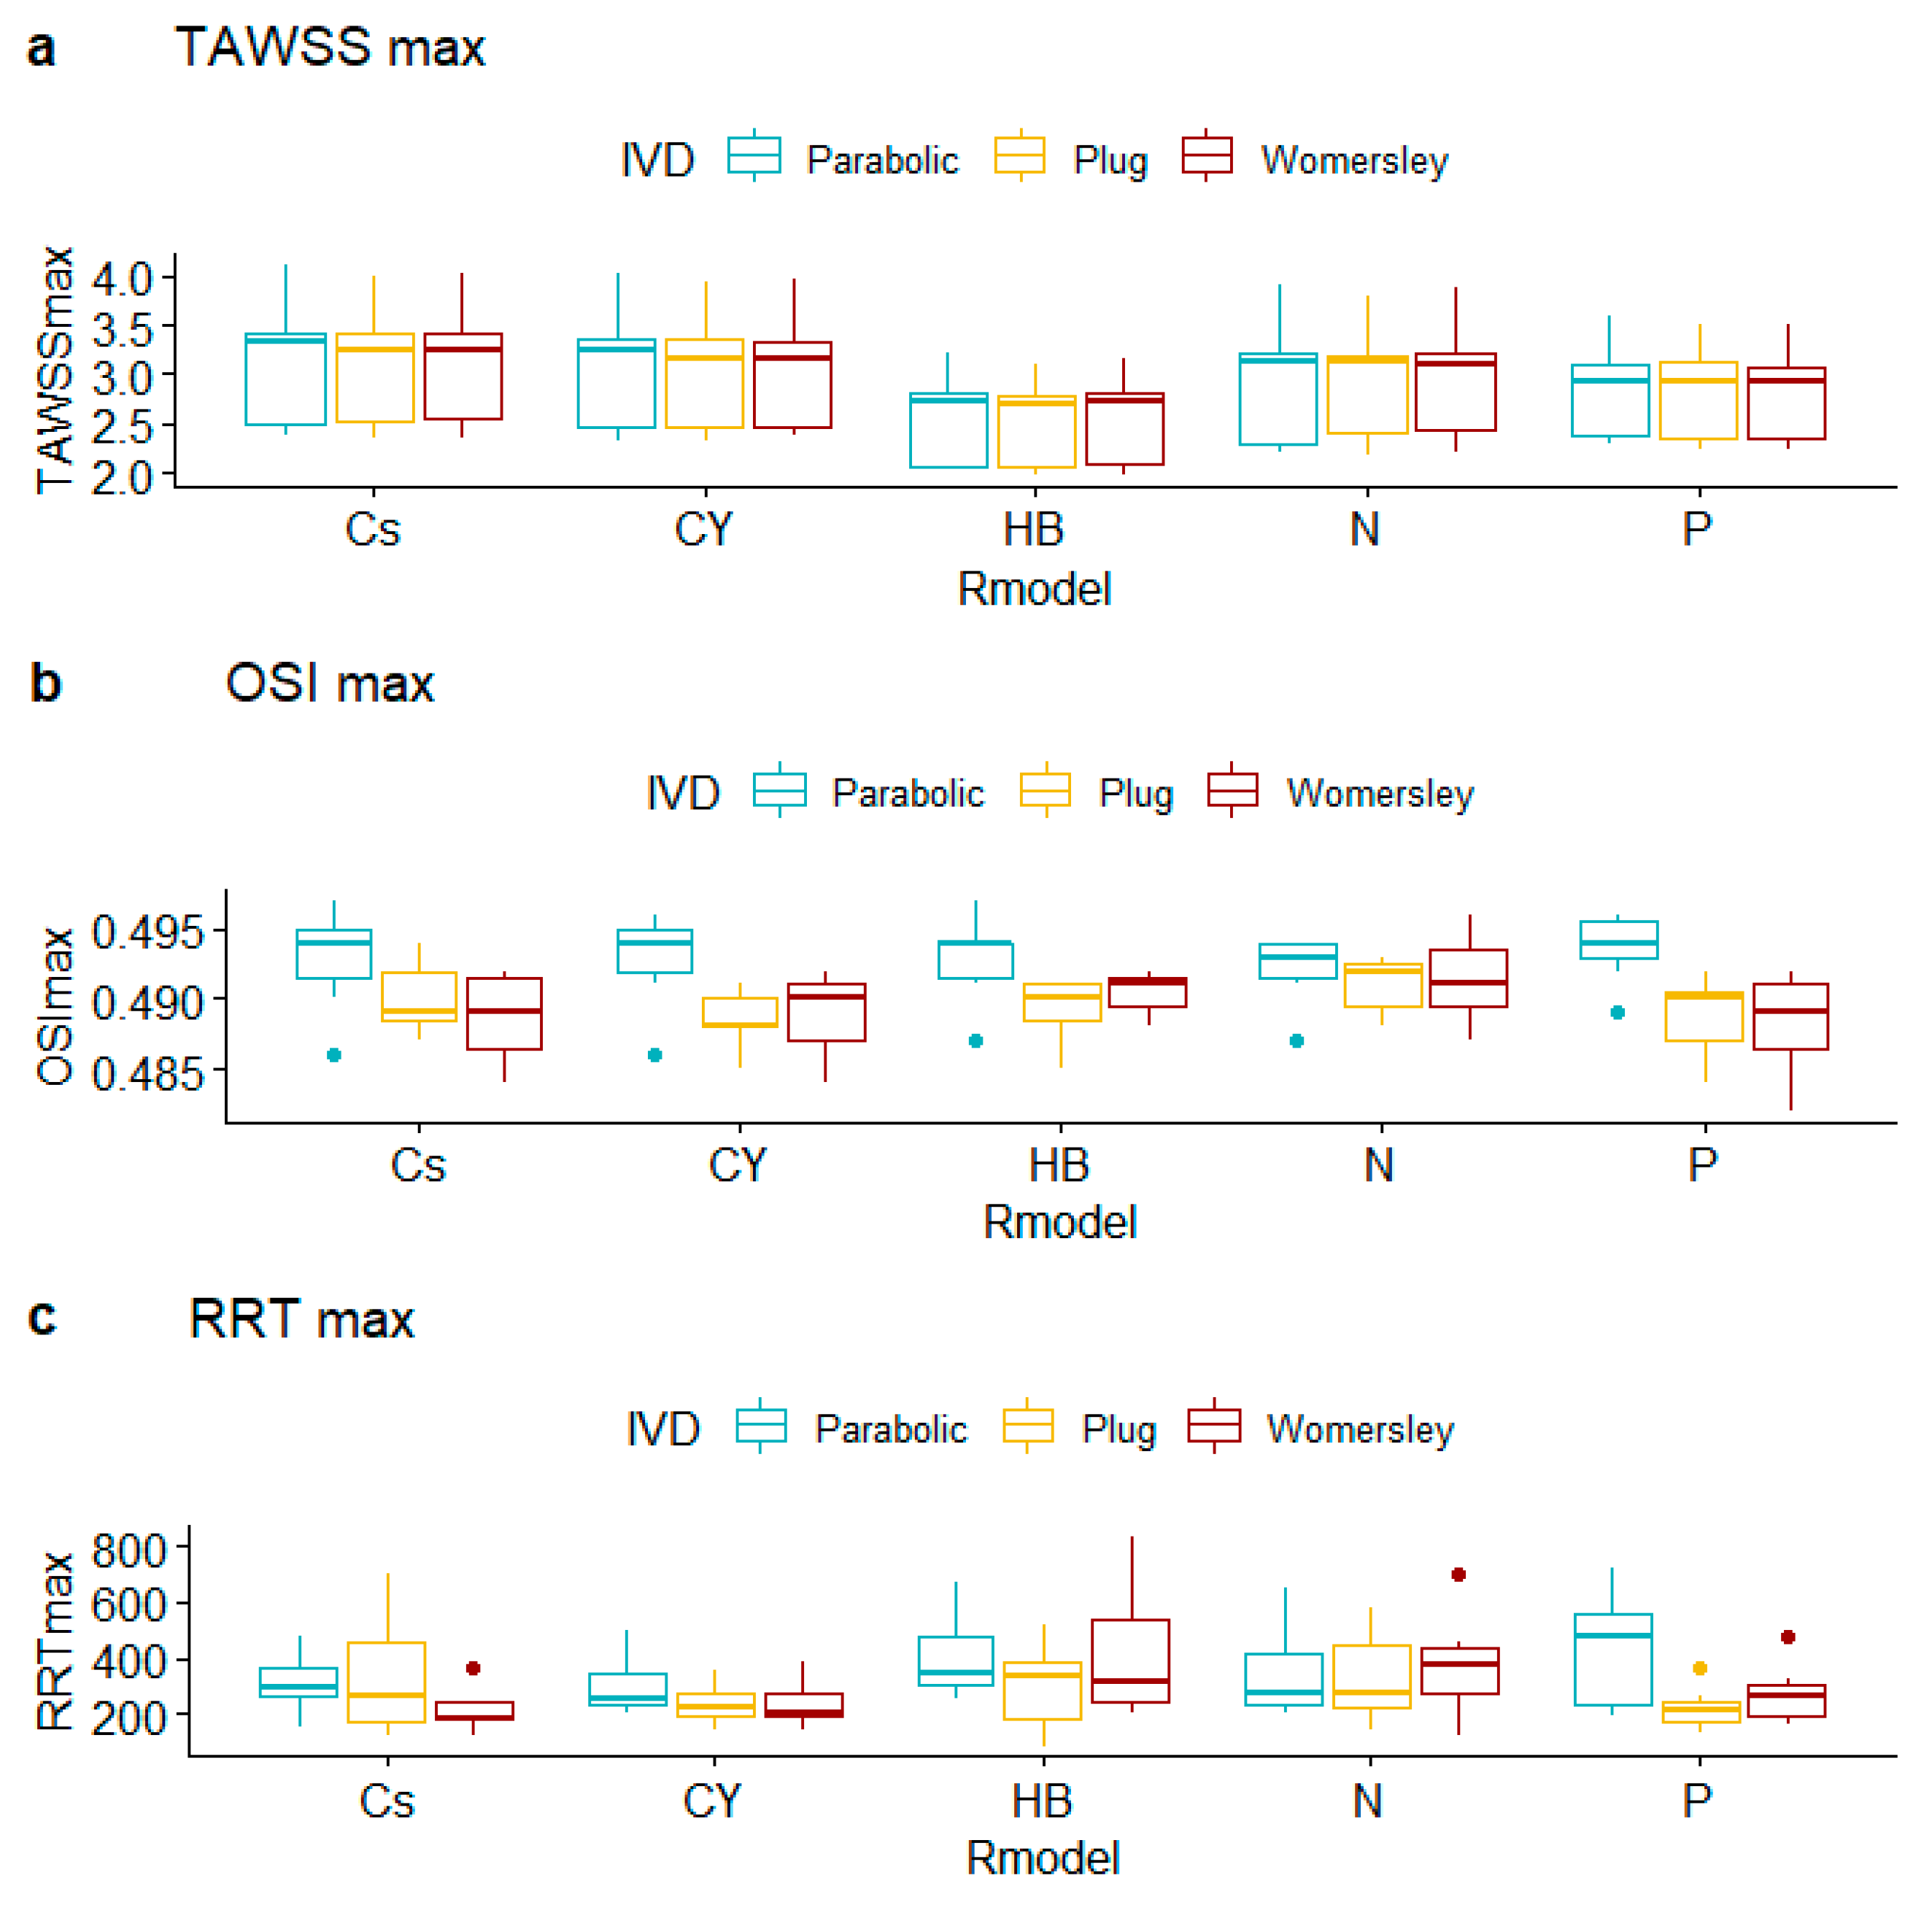
| TAWSSmax | 0.072 | 0.999 | 0.999 |
| OSImax | 0.671 | 0.001 | 0.691 |
| RRTmax | 0.166 | 0.201 | 0.659 |
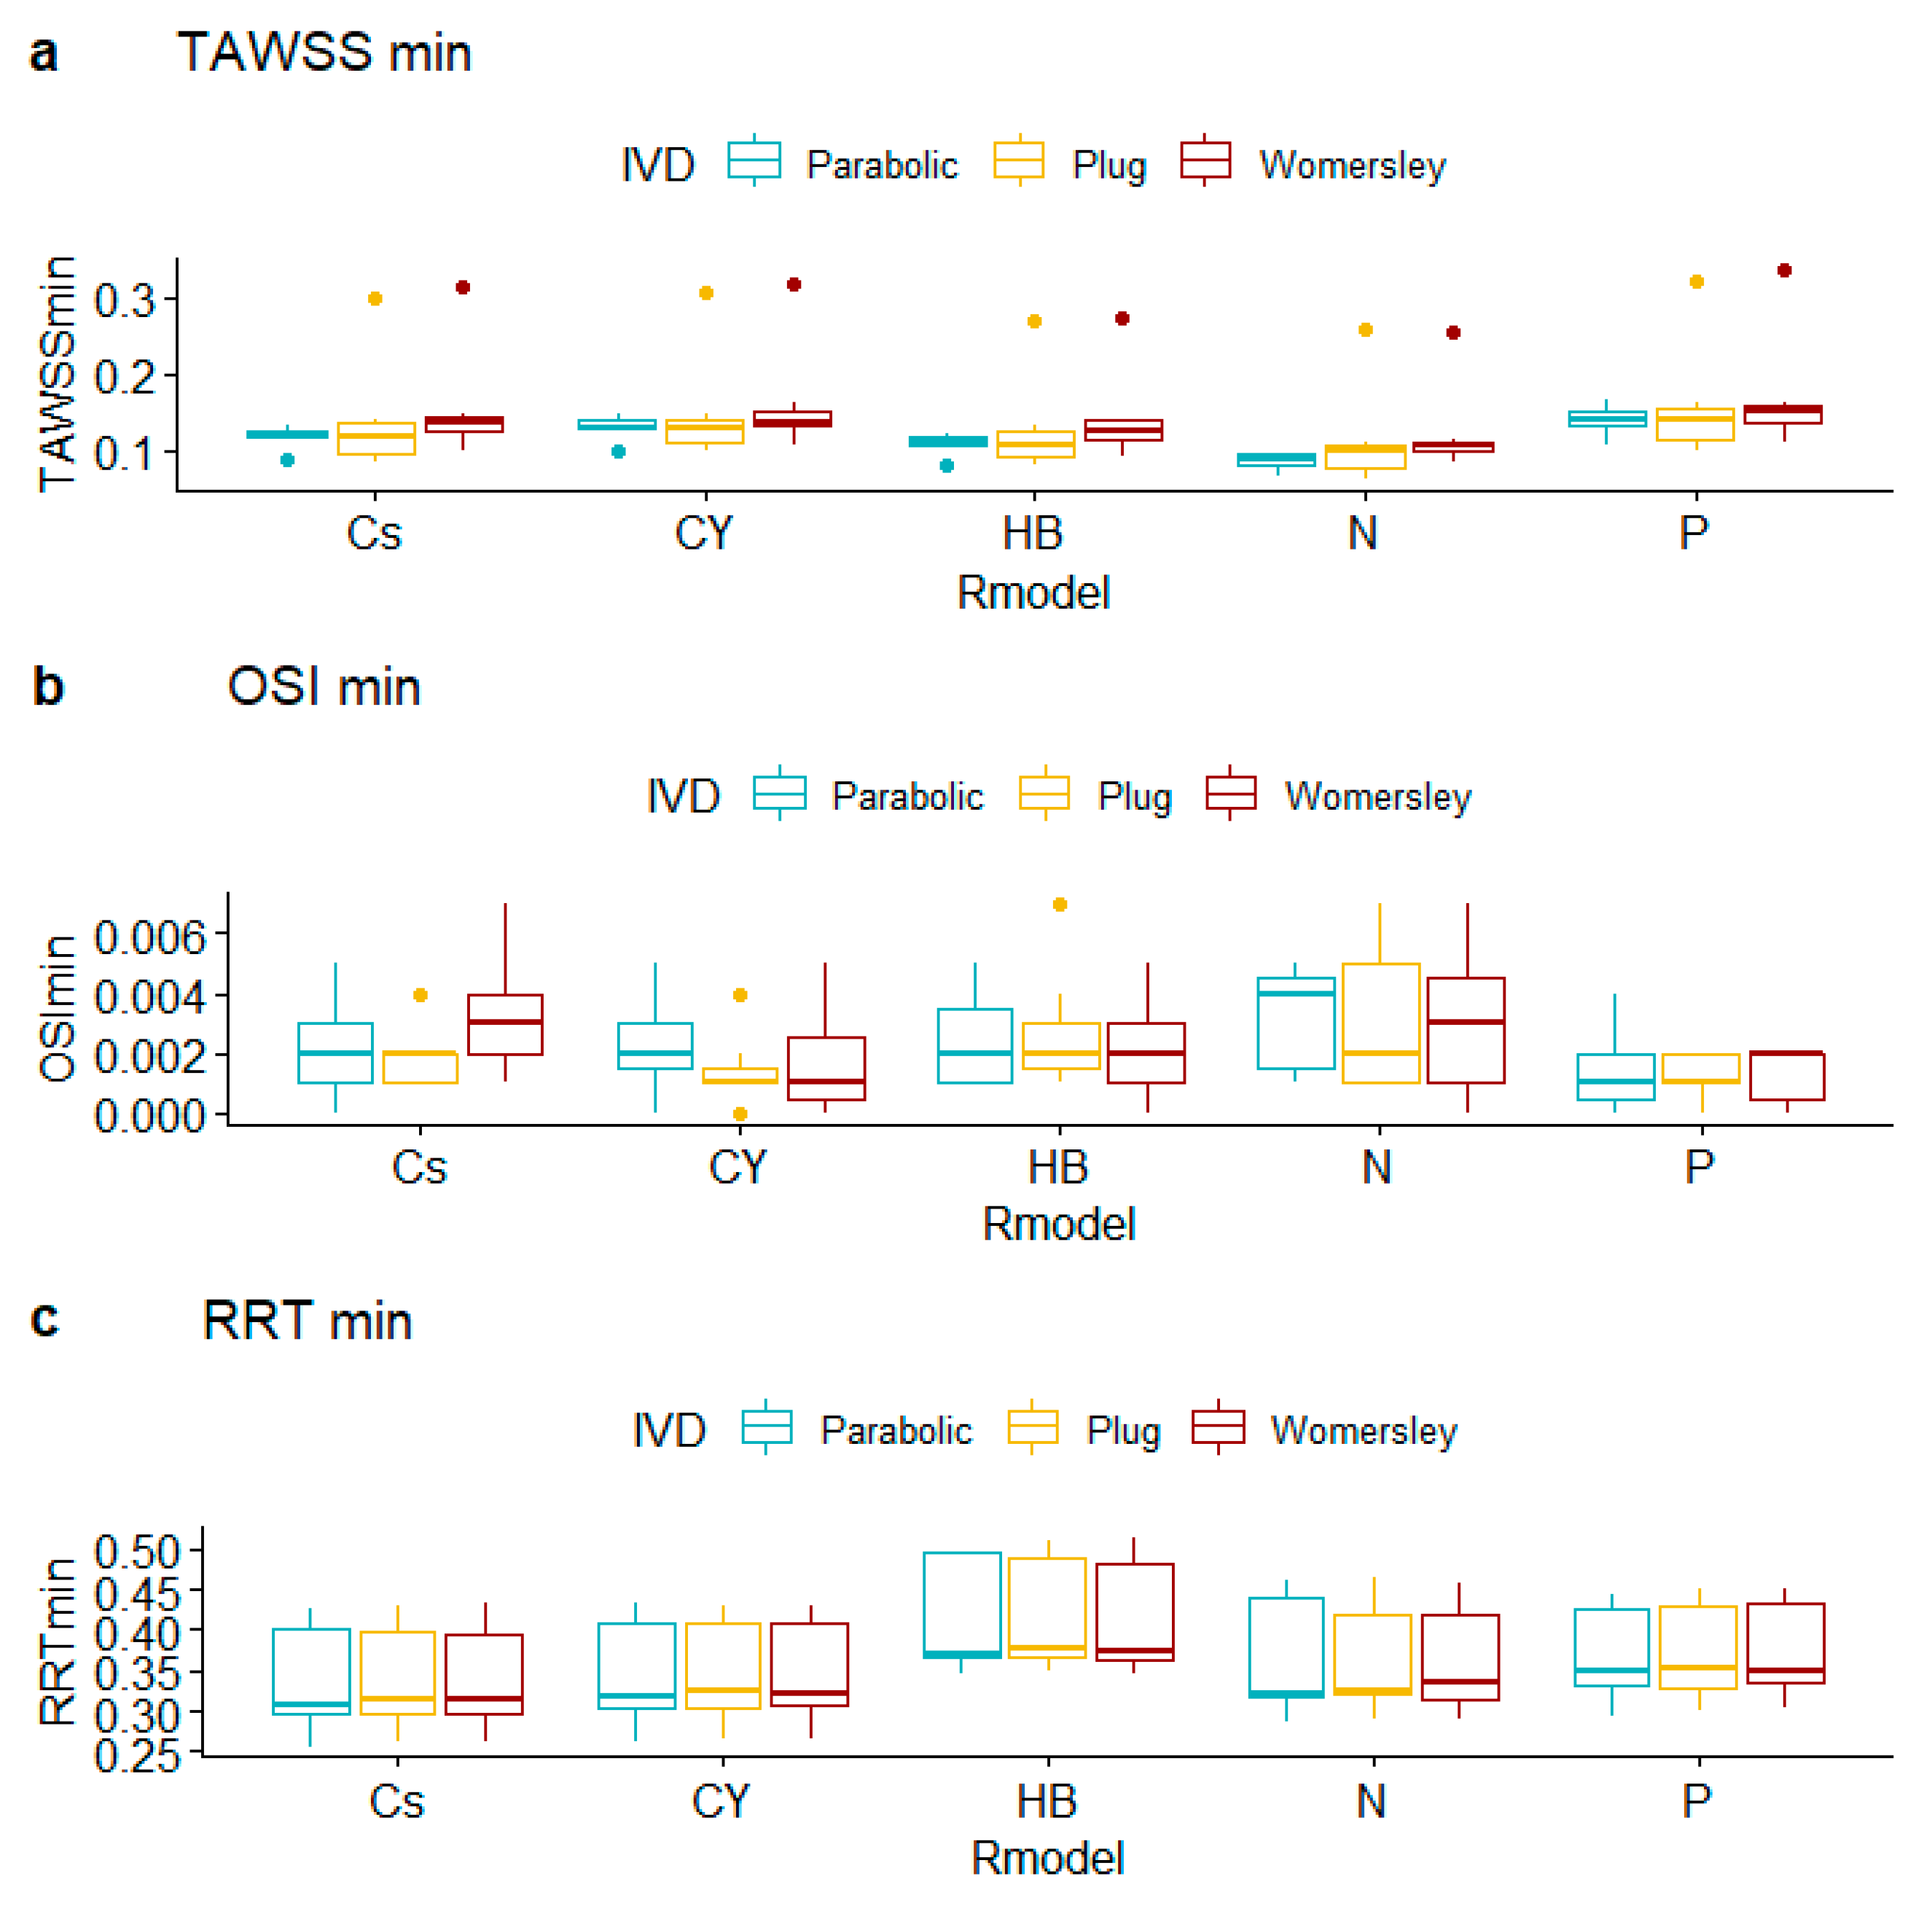
| TAWSSmin | 0.001 | 0.016 | 0.996 |
| OSImin | 0.104 | 0.710 | 0.890 |
| RRTmin | 0.108 | 0.995 | 0.999 |
| Peak Systole | Flow Asymmetry | Flow Dispersion | |||||||||
|---|---|---|---|---|---|---|---|---|---|---|---|
| Cs | CY | HB | N | P | Cs | CY | HB | N | P | ||
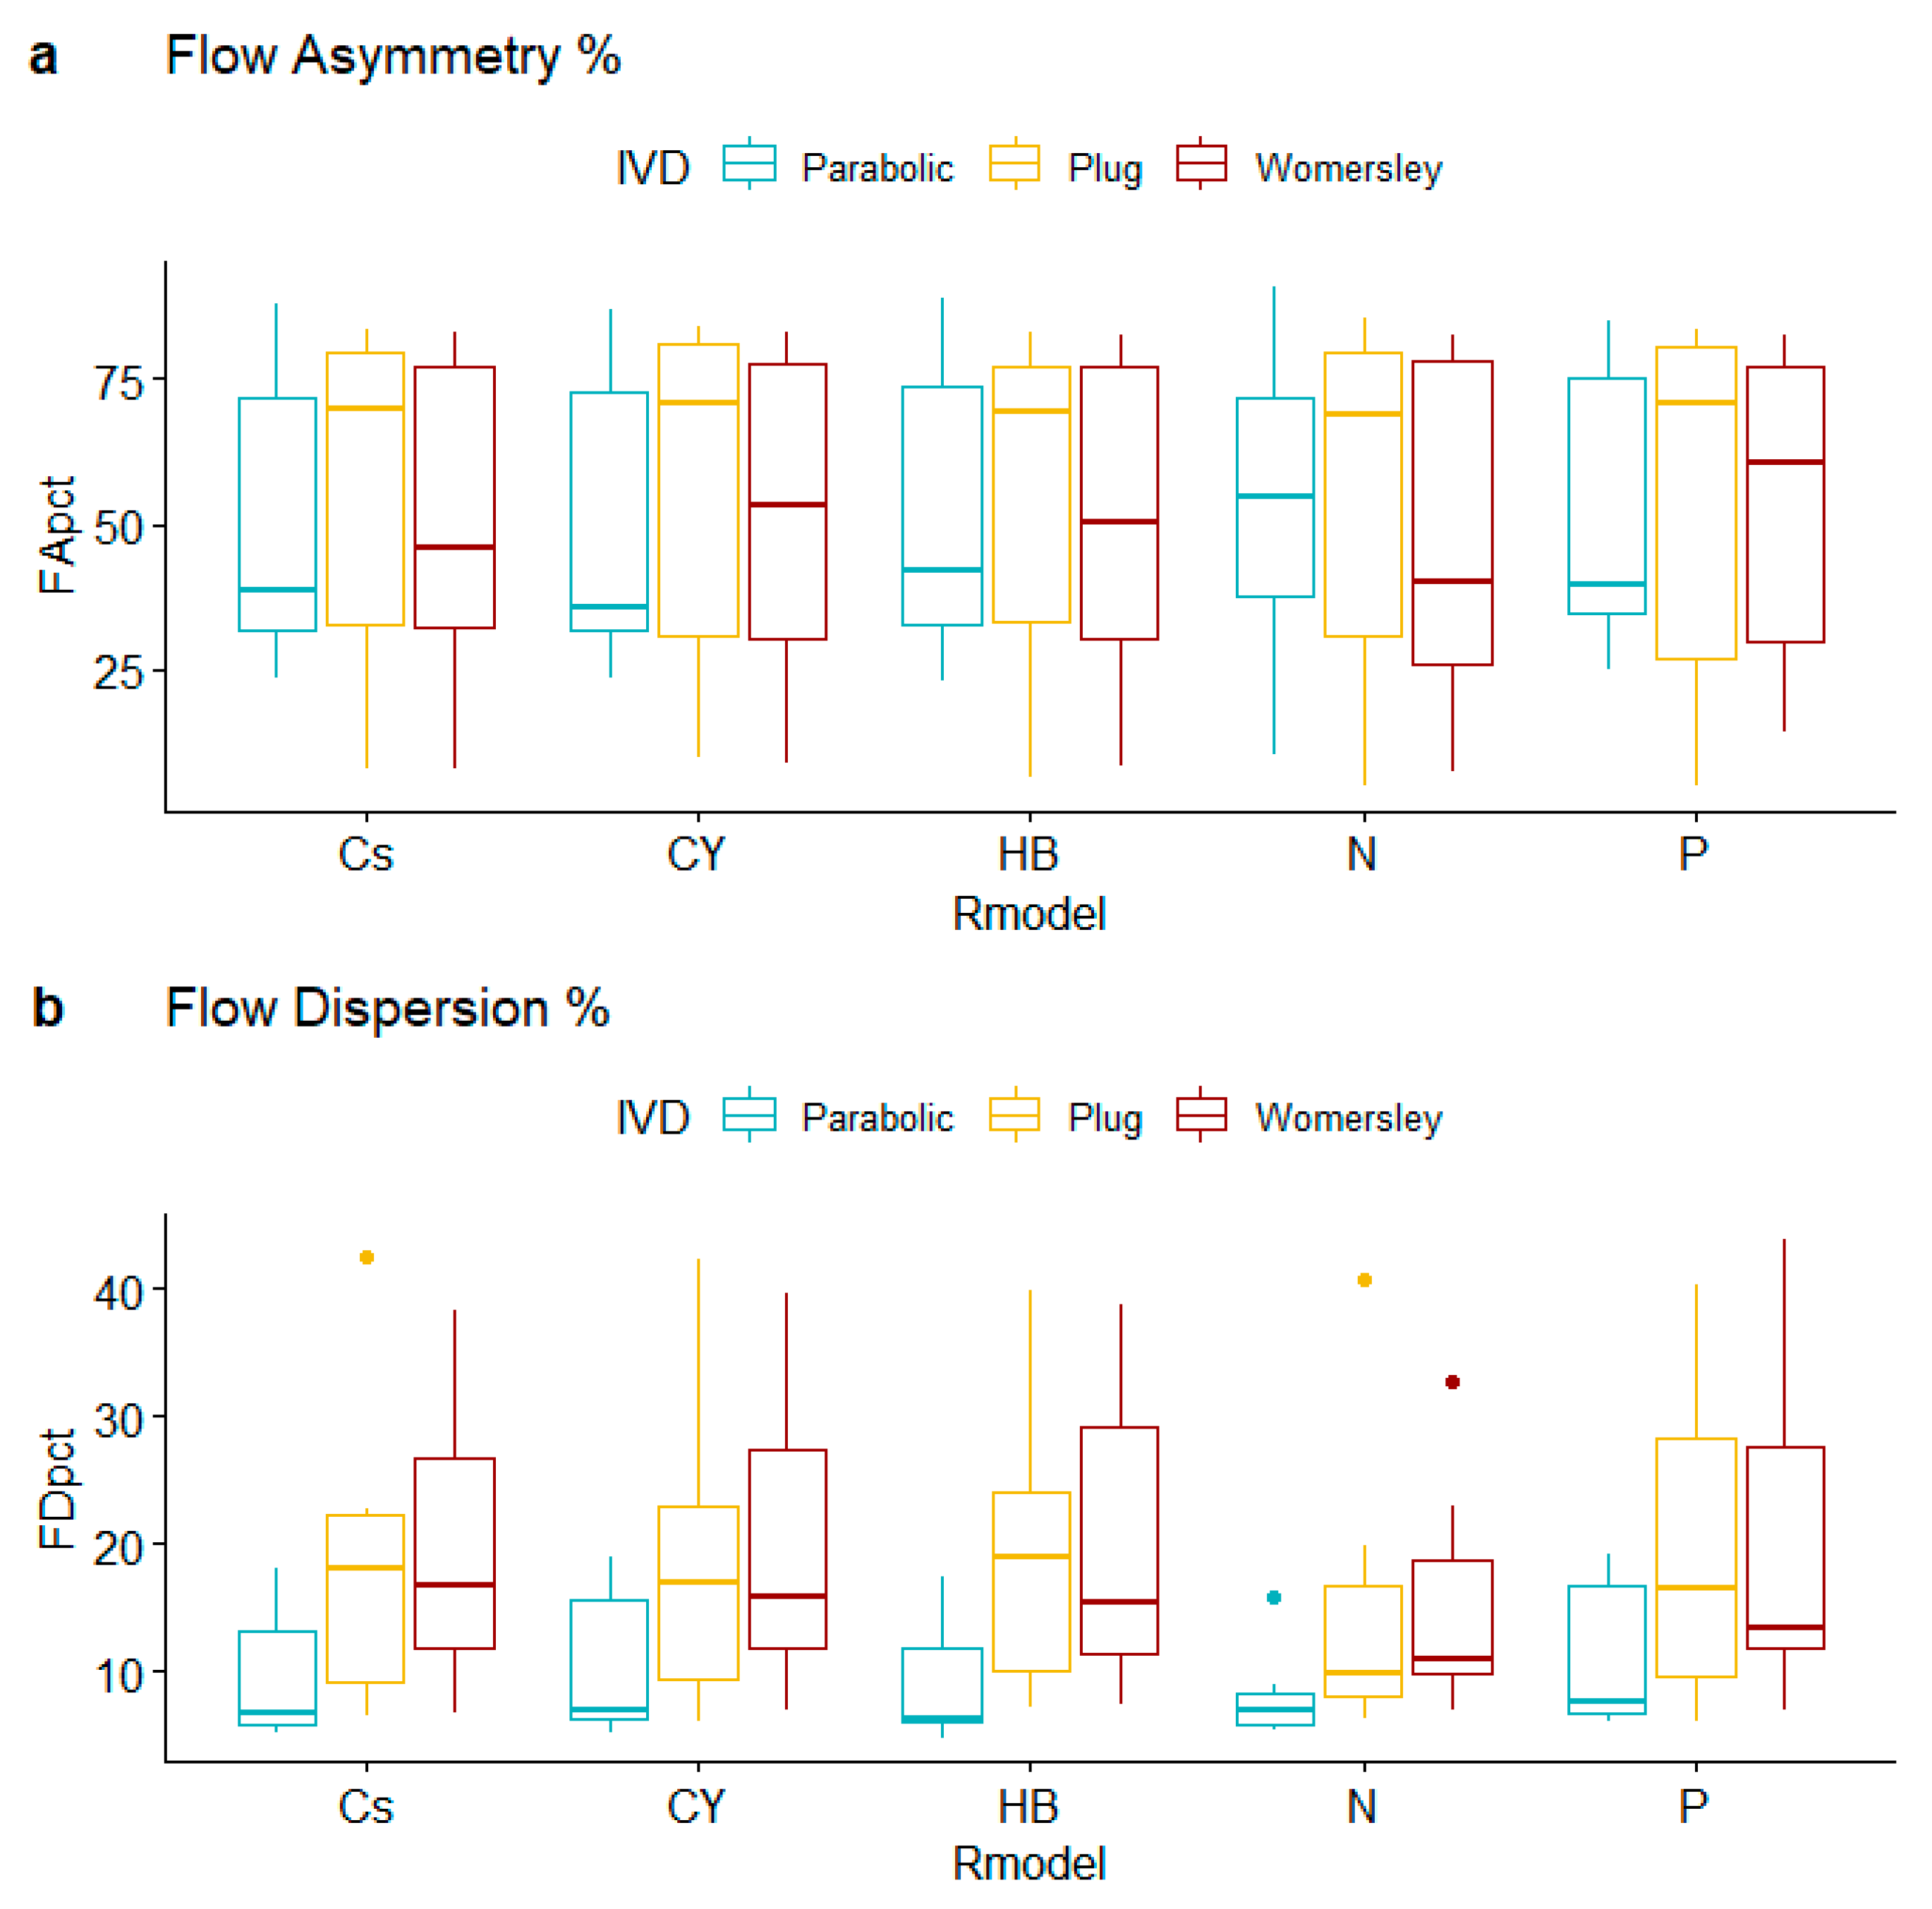
| 2B | Parabolic | 38.45 | 32.87 | 42.09 | 39.87 | 32.08 | 5.11 | 5.22 | 4.79 | 5.94 | 6.28 |
| Plug | 79.61 | 83.54 | 74.70 | 78.37 | 83.02 | 7.05 | 5.99 | 8.90 | 7.75 | 6.03 | |
| Womersley | 46.05 | 53.12 | 50.48 | 30.63 | 60.54 | 16.78 | 15.85 | 15.43 | 10.29 | 13.34 | |
| 7A | Parabolic | 57.87 | 60.21 | 61.78 | 57.14 | 65.57 | 5.87 | 6.31 | 6.06 | 6.97 | 6.94 |
| Plug | 69.90 | 71.08 | 69.35 | 68.82 | 71.07 | 17.96 | 16.94 | 19.00 | 19.73 | 16.48 | |
| Womersley | 73.84 | 73.97 | 74.44 | 74.70 | 73.72 | 12.91 | 13.79 | 12.95 | 10.87 | 12.79 | |
| 14B | Parabolic | 85.62 | 85.24 | 85.76 | 86.72 | 84.88 | 5.79 | 6.03 | 5.87 | 5.42 | 6.10 |
| Plug | 83.75 | 83.85 | 83.28 | 85.32 | 83.36 | 6.53 | 6.60 | 7.19 | 6.21 | 6.89 | |
| Womersley | 82.90 | 83.14 | 82.60 | 82.39 | 82.65 | 6.75 | 6.83 | 7.31 | 6.97 | 6.99 | |
| 16A | Parabolic | 88.11 | 87.08 | 88.77 | 90.74 | 84.92 | 6.63 | 6.97 | 6.29 | 5.64 | 7.61 |
| Plug | 79.80 | 79.12 | 80.12 | 80.64 | 78.19 | 11.24 | 12.07 | 11.24 | 8.50 | 12.20 | |
| Womersley | 80.87 | 81.48 | 80.37 | 81.59 | 80.46 | 10.82 | 9.90 | 9.84 | 9.53 | 10.89 | |
| 31A | Parabolic | 34.44 | 35.62 | 34.59 | 35.67 | 37.35 | 18.06 | 19.03 | 17.31 | 15.91 | 19.13 |
| Plug | 35.06 | 36.10 | 36.25 | 34.27 | 36.81 | 42.48 | 42.30 | 39.95 | 40.81 | 40.41 | |
| Womersley | 35.38 | 37.43 | 40.41 | 39.89 | 37.44 | 38.37 | 39.65 | 35.53 | 32.68 | 36.35 | |
| 41B | Parabolic | 28.96 | 30.63 | 30.40 | 54.89 | 39.39 | 17.29 | 17.83 | 14.86 | 7.44 | 17.85 |
| Plug | 30.10 | 24.99 | 29.96 | 27.29 | 16.99 | 22.64 | 23.49 | 26.74 | 9.87 | 36.70 | |
| Womersley | 29.15 | 22.94 | 19.83 | 20.77 | 22.09 | 32.74 | 35.03 | 38.73 | 14.63 | 43.93 | |
| 63A | Parabolic | 23.69 | 23.50 | 22.99 | 10.07 | 25.16 | 9.07 | 13.15 | 8.56 | 8.96 | 15.48 |
| Plug | 7.69 | 9.67 | 6.59 | 4.91 | 4.87 | 21.77 | 22.26 | 21.56 | 13.53 | 19.72 | |
| Womersley | 7.61 | 8.75 | 8.15 | 7.26 | 13.94 | 20.78 | 19.83 | 22.89 | 22.97 | 18.90 | |
| % Area with TAWSS < 0.4 Pa | % Area with OSI > 0.3 | % Area with RRT > 10 Pa−1 | ||||||||||||||
|---|---|---|---|---|---|---|---|---|---|---|---|---|---|---|---|---|
| Cs | CY | HB | N | P | Cs | CY | HB | N | P | Cs | CY | HB | N | P | ||
| 2B | Parabolic | 16.74 | 15.78 | 24.27 | 25.29 | 12.06 | 17.10 | 16.99 | 17.20 | 19.82 | 17.34 | 12.34 | 11.76 | 15.21 | 16.78 | 11.74 |
| Plug | 23.97 | 23.52 | 27.47 | 27.98 | 19.00 | 6.686 | 6.257 | 7.248 | 9.636 | 6.135 | 3.778 | 3.438 | 4.792 | 4.810 | 2.801 | |
| Womersley | 24.34 | 24.75 | 27.86 | 27.58 | 20.75 | 18.78 | 18.52 | 18.92 | 18.59 | 18.12 | 9.646 | 7.513 | 15.09 | 16.20 | 4.266 | |
| 7A | Parabolic | 17.14 | 16.50 | 72.52 | 74.26 | 14.04 | 20.25 | 19.98 | 21.52 | 51.21 | 19.72 | 13.68 | 13.07 | 17.54 | 17.85 | 12.42 |
| Plug | 20.73 | 20.23 | 74.24 | 75.87 | 17.03 | 10.08 | 9.522 | 10.99 | 40.00 | 9.337 | 6.328 | 5.990 | 7.590 | 8.158 | 5.203 | |
| Womersley | 21.93 | 21.87 | 75.82 | 75.99 | 19.21 | 17.88 | 17.47 | 18.80 | 47.79 | 17.56 | 9.891 | 8.384 | 13.70 | 14.16 | 5.767 | |
| 14B | Parabolic | 6.703 | 6.420 | 7.536 | 8.149 | 5.482 | 15.96 | 15.74 | 16.74 | 17.56 | 15.35 | 6.121 | 5.616 | 8.872 | 9.348 | 5.575 |
| Plug | 4.920 | 4.483 | 6.405 | 6.670 | 3.220 | 9.223 | 9.037 | 9.428 | 10.99 | 8.367 | 1.400 | 1.392 | 1.382 | 1.759 | 1.369 | |
| Womersley | 7.594 | 7.446 | 8.310 | 8.411 | 6.815 | 16.02 | 15.94 | 16.75 | 17.31 | 15.07 | 5.050 | 4.969 | 8.009 | 7.514 | 3.603 | |
| 16A | Parabolic | 30.67 | 30.54 | 33.91 | 34.32 | 27.94 | 17.42 | 16.75 | 18.81 | 20.31 | 16.58 | 14.14 | 13.45 | 16.99 | 18.42 | 11.50 |
| Plug | 31.82 | 31.32 | 36.25 | 36.74 | 28.69 | 10.02 | 9.818 | 10.15 | 10.55 | 9.889 | 12.61 | 12.10 | 13.86 | 15.73 | 10.62 | |
| Womersley | 34.05 | 33.44 | 38.53 | 38.78 | 30.06 | 14.37 | 13.70 | 15.23 | 15.29 | 13.30 | 11.97 | 12.00 | 14.16 | 15.61 | 10.58 | |
| 31A | Parabolic | 11.66 | 11.44 | 16.58 | 15.71 | 9.094 | 19.45 | 19.16 | 19.80 | 19.72 | 19.11 | 10.83 | 10.14 | 14.20 | 14.27 | 9.897 |
| Plug | 14.89 | 13.71 | 21.33 | 21.05 | 10.63 | 7.300 | 6.747 | 7.570 | 8.490 | 6.607 | 3.100 | 2.941 | 3.857 | 4.802 | 2.950 | |
| Womersley | 18.14 | 17.83 | 22.86 | 22.84 | 13.99 | 17.58 | 17.26 | 18.38 | 18.57 | 17.03 | 8.299 | 7.894 | 13.28 | 13.21 | 6.488 | |
| 41B | Parabolic | 31.07 | 30.68 | 41.50 | 41.10 | 27.22 | 26.66 | 26.00 | 27.96 | 28.10 | 25.21 | 18.42 | 17.17 | 22.60 | 24.36 | 14.79 |
| Plug | 30.75 | 29.74 | 40.77 | 41.60 | 26.20 | 13.63 | 12.84 | 13.77 | 15.79 | 12.40 | 11.74 | 10.75 | 13.07 | 15.90 | 10.09 | |
| Womersley | 33.64 | 31.79 | 45.37 | 45.39 | 26.13 | 20.90 | 18.34 | 22.49 | 25.27 | 16.78 | 13.57 | 12.37 | 15.90 | 18.55 | 10.97 | |
| 63A | Parabolic | 34.81 | 34.00 | 41.01 | 40.22 | 31.08 | 26.73 | 26.29 | 27.41 | 26.26 | 27.45 | 23.36 | 22.88 | 26.78 | 26.35 | 22.33 |
| Plug | 40.31 | 39.84 | 43.62 | 43.44 | 36.81 | 16.85 | 16.66 | 16.64 | 19.41 | 17.07 | 19.10 | 18.46 | 20.09 | 20.77 | 17.37 | |
| Womersley | 42.09 | 41.95 | 44.94 | 44.85 | 40.02 | 26.04 | 26.40 | 25.68 | 26.25 | 27.32 | 22.12 | 19.81 | 27.81 | 28.78 | 15.87 | |
| Average Values | TAWSS | OSI | RRT | |||||||||||||
|---|---|---|---|---|---|---|---|---|---|---|---|---|---|---|---|---|
| Cs | CY | HB | N | P | Cs | CY | HB | N | P | Cs | CY | HB | N | P | ||
| 2B | Parabolic | 0.558 | 0.561 | 0.498 | 0.502 | 0.586 | 0.221 | 0.219 | 0.228 | 0.236 | 0.213 | 5.363 | 5.204 | 6.236 | 6.562 | 5.012 |
| Plug | 0.548 | 0.550 | 0.486 | 0.494 | 0.574 | 0.196 | 0.193 | 0.202 | 0.208 | 0.187 | 4.075 | 3.893 | 4.678 | 4.742 | 3.629 | |
| Womersley | 0.546 | 0.546 | 0.487 | 0.496 | 0.571 | 0.218 | 0.215 | 0.224 | 0.229 | 0.208 | 4.801 | 4.673 | 5.599 | 5.689 | 4.241 | |
| 7A | Parabolic | 0.443 | 0.447 | 0.340 | 0.397 | 0.467 | 0.266 | 0.259 | 0.273 | 0.285 | 0.253 | 7.685 | 7.341 | 9.214 | 9.063 | 7.119 |
| Plug | 0.438 | 0.443 | 0.392 | 0.392 | 0.466 | 0.241 | 0.233 | 0.246 | 0.259 | 0.227 | 5.702 | 5.423 | 6.419 | 6.986 | 5.030 | |
| Womersley | 0.433 | 0.438 | 0.389 | 0.390 | 0.460 | 0.257 | 0.250 | 0.264 | 0.273 | 0.243 | 6.297 | 5.938 | 7.199 | 7.603 | 5.487 | |
| 14B | Parabolic | 0.765 | 0.761 | 0.674 | 0.708 | 0.773 | 0.210 | 0.208 | 0.216 | 0.218 | 0.203 | 4.584 | 4.464 | 5.071 | 4.882 | 4.457 |
| Plug | 0.777 | 0.773 | 0.684 | 0.718 | 0.784 | 0.186 | 0.185 | 0.190 | 0.194 | 0.178 | 2.783 | 2.761 | 3.097 | 3.144 | 2.607 | |
| Womersley | 0.767 | 0.763 | 0.674 | 0.710 | 0.775 | 0.202 | 0.201 | 0.209 | 0.211 | 0.195 | 3.388 | 3.327 | 4.065 | 4.417 | 3.079 | |
| 16A | Parabolic | 0.530 | 0.532 | 0.471 | 0.480 | 0.553 | 0.222 | 0.220 | 0.229 | 0.233 | 0.213 | 5.781 | 5.703 | 6.627 | 7.135 | 5.298 |
| Plug | 0.531 | 0.533 | 0.470 | 0.480 | 0.554 | 0.202 | 0.200 | 0.206 | 0.212 | 0.193 | 5.987 | 5.408 | 6.398 | 6.375 | 5.054 | |
| Womersley | 0.524 | 0.526 | 0.464 | 0.473 | 0.547 | 0.213 | 0.212 | 0.220 | 0.223 | 0.206 | 5.364 | 5.390 | 6.123 | 6.230 | 5.065 | |
| 31A | Parabolic | 0.653 | 0.652 | 0.575 | 0.597 | 0.670 | 0.223 | 0.222 | 0.230 | 0.232 | 0.217 | 5.188 | 5.106 | 5.731 | 5.532 | 4.977 |
| Plug | 0.654 | 0.655 | 0.573 | 0.593 | 0.675 | 0.192 | 0.190 | 0.199 | 0.203 | 0.185 | 3.457 | 3.364 | 3.897 | 4.022 | 3.243 | |
| Womersley | 0.644 | 0.644 | 0.566 | 0.585 | 0.663 | 0.215 | 0.214 | 0.224 | 0.227 | 0.207 | 4.380 | 4.265 | 5.237 | 5.407 | 3.922 | |
| 41B | Parabolic | 0.510 | 0.512 | 0.454 | 0.463 | 0.532 | 0.247 | 0.244 | 0.254 | 0.257 | 0.239 | 7.573 | 7.145 | 8.525 | 8.727 | 6.453 |
| Plug | 0.515 | 0.518 | 0.457 | 0.465 | 0.540 | 0.216 | 0.212 | 0.220 | 0.226 | 0.208 | 6.203 | 5.817 | 6.791 | 7.595 | 5.536 | |
| Womersley | 0.505 | 0.508 | 0.448 | 0.455 | 0.529 | 0.235 | 0.230 | 0.241 | 0.249 | 0.225 | 6.829 | 6.324 | 7.452 | 9.815 | 5.893 | |
| 63A | Parabolic | 0.499 | 0.501 | 0.445 | 0.458 | 0.519 | 0.248 | 0.245 | 0.254 | 0.253 | 0.242 | 8.257 | 7.884 | 9.734 | 8.800 | 7.831 |
| Plug | 0.486 | 0.489 | 0.431 | 0.438 | 0.509 | 0.226 | 0.223 | 0.230 | 0.235 | 0.219 | 7.532 | 7.224 | 8.326 | 9.404 | 6.685 | |
| Womersley | 0.484 | 0.486 | 0.431 | 0.439 | 0.506 | 0.244 | 0.242 | 0.249 | 0.253 | 0.237 | 7.446 | 7.035 | 8.267 | 8.589 | 6.653 | |
| Maximum Values | TAWSS | OSI | RRT | |||||||||||||
|---|---|---|---|---|---|---|---|---|---|---|---|---|---|---|---|---|
| Cs | CY | HB | N | P | Cs | CY | HB | N | P | Cs | CY | HB | N | P | ||
| 2B | Parabolic | 2.389 | 2.337 | 2.049 | 2.207 | 2.299 | 0.490 | 0.491 | 0.491 | 0.493 | 0.492 | 152.1 | 227.5 | 348.6 | 223.3 | 271.9 |
| Plug | 2.438 | 2.332 | 1.971 | 2.356 | 2.235 | 0.487 | 0.488 | 0.491 | 0.493 | 0.489 | 260.5 | 178.0 | 338.5 | 247.6 | 162.1 | |
| Womersley | 2.511 | 2.398 | 2.080 | 2.426 | 2.244 | 0.485 | 0.491 | 0.489 | 0.492 | 0.482 | 185.3 | 387.2 | 836.6 | 290.3 | 268.0 | |
| 7A | Parabolic | 3.467 | 3.348 | 2.790 | 3.249 | 3.149 | 0.495 | 0.493 | 0.497 | 0.494 | 0.496 | 249.6 | 200.0 | 426.6 | 202.7 | 476.4 |
| Plug | 3.440 | 3.363 | 2.814 | 3.193 | 3.151 | 0.489 | 0.488 | 0.488 | 0.488 | 0.490 | 203.0 | 203.2 | 203.5 | 190.4 | 262.3 | |
| Womersley | 3.393 | 3.328 | 2.818 | 3.095 | 3.099 | 0.491 | 0.487 | 0.491 | 0.490 | 0.489 | 186.4 | 180.8 | 217.6 | 412.7 | 166.6 | |
| 14B | Parabolic | 4.098 | 4.010 | 3.227 | 3.888 | 3.600 | 0.497 | 0.495 | 0.492 | 0.491 | 0.495 | 419.9 | 326.4 | 523.0 | 392.8 | 596.1 |
| Plug | 3.998 | 3.945 | 3.097 | 3.783 | 3.498 | 0.488 | 0.490 | 0.485 | 0.488 | 0.490 | 118.7 | 223.9 | 85.62 | 138.5 | 128.6 | |
| Womersley | 4.010 | 3.952 | 3.145 | 3.860 | 3.496 | 0.488 | 0.490 | 0.491 | 0.496 | 0.490 | 124.8 | 141.7 | 389.7 | 454.1 | 199.3 | |
| 16A | Parabolic | 3.369 | 3.352 | 2.726 | 3.140 | 3.045 | 0.486 | 0.486 | 0.487 | 0.487 | 0.489 | 295.7 | 242.1 | 258.0 | 274.6 | 191.3 |
| Plug | 3.409 | 3.362 | 2.766 | 3.180 | 3.076 | 0.494 | 0.488 | 0.491 | 0.492 | 0.484 | 701.2 | 253.6 | 516.4 | 579.2 | 218.0 | |
| Womersley | 3.447 | 3.350 | 2.813 | 3.305 | 3.021 | 0.484 | 0.487 | 0.488 | 0.487 | 0.485 | 231.4 | 244.3 | 279.8 | 120.9 | 477.8 | |
| 31A | Parabolic | 2.598 | 2.560 | 2.029 | 2.380 | 2.439 | 0.494 | 0.495 | 0.494 | 0.494 | 0.496 | 301.9 | 359.8 | 327.8 | 238.3 | 521.6 |
| Plug | 2.627 | 2.568 | 2.141 | 2.439 | 2.397 | 0.491 | 0.490 | 0.489 | 0.492 | 0.491 | 150.4 | 146.5 | 165.6 | 270.7 | 181.5 | |
| Womersley | 2.585 | 2.545 | 2.109 | 2.425 | 2.384 | 0.492 | 0.492 | 0.490 | 0.491 | 0.492 | 174.8 | 200.6 | 204.0 | 263.4 | 177.5 | |
| 41B | Parabolic | 2.420 | 2.388 | 2.056 | 2.207 | 2.291 | 0.495 | 0.496 | 0.494 | 0.494 | 0.494 | 284.9 | 257.4 | 273.5 | 441.5 | 200.2 |
| Plug | 2.363 | 2.379 | 2.002 | 2.194 | 2.302 | 0.489 | 0.485 | 0.490 | 0.493 | 0.485 | 428.3 | 297.5 | 373.5 | 473.0 | 227.5 | |
| Womersley | 2.354 | 2.376 | 1.977 | 2.214 | 2.293 | 0.489 | 0.484 | 0.492 | 0.495 | 0.488 | 247.3 | 203.5 | 319.8 | 703.1 | 276.9 | |
| 63A | Parabolic | 3.317 | 3.237 | 2.805 | 3.198 | 2.938 | 0.493 | 0.494 | 0.494 | 0.492 | 0.494 | 478.0 | 493.5 | 671.8 | 646.5 | 724.2 |
| Plug | 3.232 | 3.155 | 2.698 | 3.115 | 2.919 | 0.493 | 0.491 | 0.491 | 0.491 | 0.492 | 481.5 | 352.8 | 394.8 | 420.5 | 362.5 | |
| Womersley | 3.245 | 3.165 | 2.724 | 3.139 | 2.921 | 0.492 | 0.491 | 0.492 | 0.489 | 0.492 | 370.2 | 312.8 | 690.5 | 379.0 | 328.5 | |
| Minimum Values | TAWSS | OSI | RRT | |||||||||||||
|---|---|---|---|---|---|---|---|---|---|---|---|---|---|---|---|---|
| Cs | CY | HB | N | P | Cs | CY | HB | N | P | Cs | CY | HB | N | P | ||
| 2B | Parabolic | 0.131 | 0.147 | 0.118 | 0.089 | 0.165 | 0.005 | 0.003 | 0.005 | 0.005 | 0.004 | 0.425 | 0.433 | 0.496 | 0.462 | 0.439 |
| Plug | 0.119 | 0.130 | 0.106 | 0.099 | 0.149 | 0.002 | 0.001 | 0.002 | 0.001 | 0.002 | 0.412 | 0.431 | 0.510 | 0.427 | 0.449 | |
| Womersley | 0.142 | 0.138 | 0.141 | 0.109 | 0.155 | 0.003 | 0.002 | 0.003 | 0.005 | 0.002 | 0.401 | 0.419 | 0.485 | 0.418 | 0.449 | |
| 7A | Parabolic | 0.120 | 0.129 | 0.110 | 0.095 | 0.127 | 0.003 | 0.002 | 0.003 | 0.004 | 0.002 | 0.297 | 0.309 | 0.371 | 0.317 | 0.331 |
| Plug | 0.084 | 0.101 | 0.083 | 0.065 | 0.098 | 0.002 | 0.001 | 0.002 | 0.005 | 0.001 | 0.300 | 0.308 | 0.367 | 0.323 | 0.330 | |
| Womersley | 0.098 | 0.108 | 0.092 | 0.083 | 0.110 | 0.003 | 0.001 | 0.002 | 0.003 | 0.002 | 0.303 | 0.310 | 0.366 | 0.334 | 0.335 | |
| 14B | Parabolic | 0.113 | 0.129 | 0.102 | 0.078 | 0.143 | 0.003 | 0.003 | 0.004 | 0.005 | 0.001 | 0.256 | 0.261 | 0.344 | 0.286 | 0.293 |
| Plug | 0.298 | 0.308 | 0.271 | 0.259 | 0.321 | 0.004 | 0.004 | 0.007 | 0.007 | 0.002 | 0.262 | 0.266 | 0.349 | 0.289 | 0.301 | |
| Womersley | 0.313 | 0.319 | 0.274 | 0.256 | 0.336 | 0.005 | 0.005 | 0.005 | 0.007 | 0.002 | 0.261 | 0.266 | 0.347 | 0.288 | 0.302 | |
| 16A | Parabolic | 0.088 | 0.099 | 0.082 | 0.067 | 0.105 | 0.001 | 0.001 | 0.001 | 0.002 | 0.001 | 0.299 | 0.300 | 0.370 | 0.322 | 0.330 |
| Plug | 0.105 | 0.117 | 0.098 | 0.091 | 0.116 | 0.001 | 0.001 | 0.004 | 0.005 | 0.001 | 0.296 | 0.301 | 0.366 | 0.318 | 0.328 | |
| Womersley | 0.115 | 0.126 | 0.105 | 0.089 | 0.131 | 0.007 | 0.001 | 0.001 | 0.001 | 0.001 | 0.292 | 0.301 | 0.359 | 0.305 | 0.333 | |
| 31A | Parabolic | 0.123 | 0.132 | 0.112 | 0.086 | 0.139 | 0.000 | 0.000 | 0.001 | 0.001 | 0.000 | 0.386 | 0.392 | 0.494 | 0.423 | 0.410 |
| Plug | 0.140 | 0.149 | 0.132 | 0.110 | 0.162 | 0.001 | 0.001 | 0.001 | 0.001 | 0.001 | 0.381 | 0.391 | 0.469 | 0.412 | 0.418 | |
| Womersley | 0.146 | 0.161 | 0.138 | 0.108 | 0.164 | 0.001 | 0.000 | 0.000 | 0.000 | 0.000 | 0.390 | 0.395 | 0.478 | 0.418 | 0.421 | |
| 41B | Parabolic | 0.121 | 0.128 | 0.118 | 0.093 | 0.140 | 0.002 | 0.002 | 0.002 | 0.004 | 0.002 | 0.420 | 0.425 | 0.497 | 0.460 | 0.443 |
| Plug | 0.130 | 0.133 | 0.122 | 0.106 | 0.139 | 0.002 | 0.002 | 0.002 | 0.002 | 0.002 | 0.431 | 0.428 | 0.511 | 0.464 | 0.443 | |
| Womersley | 0.135 | 0.138 | 0.125 | 0.106 | 0.144 | 0.003 | 0.003 | 0.003 | 0.004 | 0.002 | 0.432 | 0.428 | 0.515 | 0.459 | 0.444 | |
| 63A | Parabolic | 0.132 | 0.147 | 0.120 | 0.096 | 0.161 | 0.001 | 0.005 | 0.001 | 0.001 | 0.000 | 0.308 | 0.316 | 0.366 | 0.318 | 0.349 |
| Plug | 0.088 | 0.104 | 0.080 | 0.061 | 0.112 | 0.001 | 0.000 | 0.001 | 0.001 | 0.000 | 0.315 | 0.323 | 0.378 | 0.326 | 0.351 | |
| Womersley | 0.132 | 0.141 | 0.120 | 0.114 | 0.150 | 0.001 | 0.000 | 0.001 | 0.001 | 0.000 | 0.314 | 0.322 | 0.375 | 0.324 | 0.350 | |
Disclaimer/Publisher’s Note: The statements, opinions and data contained in all publications are solely those of the individual author(s) and contributor(s) and not of MDPI and/or the editor(s). MDPI and/or the editor(s) disclaim responsibility for any injury to people or property resulting from any ideas, methods, instructions or products referred to in the content. |
© 2023 by the authors. Licensee MDPI, Basel, Switzerland. This article is an open access article distributed under the terms and conditions of the Creative Commons Attribution (CC BY) license (https://creativecommons.org/licenses/by/4.0/).
Share and Cite
Tzirakis, K.; Kamarianakis, Y.; Kontopodis, N.; Ioannou, C.V. The Effect of Blood Rheology and Inlet Boundary Conditions on Realistic Abdominal Aortic Aneurysms under Pulsatile Flow Conditions. Bioengineering 2023, 10, 272. https://doi.org/10.3390/bioengineering10020272
Tzirakis K, Kamarianakis Y, Kontopodis N, Ioannou CV. The Effect of Blood Rheology and Inlet Boundary Conditions on Realistic Abdominal Aortic Aneurysms under Pulsatile Flow Conditions. Bioengineering. 2023; 10(2):272. https://doi.org/10.3390/bioengineering10020272
Chicago/Turabian StyleTzirakis, Konstantinos, Yiannis Kamarianakis, Nikolaos Kontopodis, and Christos V. Ioannou. 2023. "The Effect of Blood Rheology and Inlet Boundary Conditions on Realistic Abdominal Aortic Aneurysms under Pulsatile Flow Conditions" Bioengineering 10, no. 2: 272. https://doi.org/10.3390/bioengineering10020272
APA StyleTzirakis, K., Kamarianakis, Y., Kontopodis, N., & Ioannou, C. V. (2023). The Effect of Blood Rheology and Inlet Boundary Conditions on Realistic Abdominal Aortic Aneurysms under Pulsatile Flow Conditions. Bioengineering, 10(2), 272. https://doi.org/10.3390/bioengineering10020272


