

An Integrated Multi-Channel Deep Neural Network for Mesial Temporal Lobe Epilepsy Identification Using Multi-Modal Medical Data

 ,
, 
Abstract
:
1. Introduction
2. Materials and Methods
2.1. Subjects
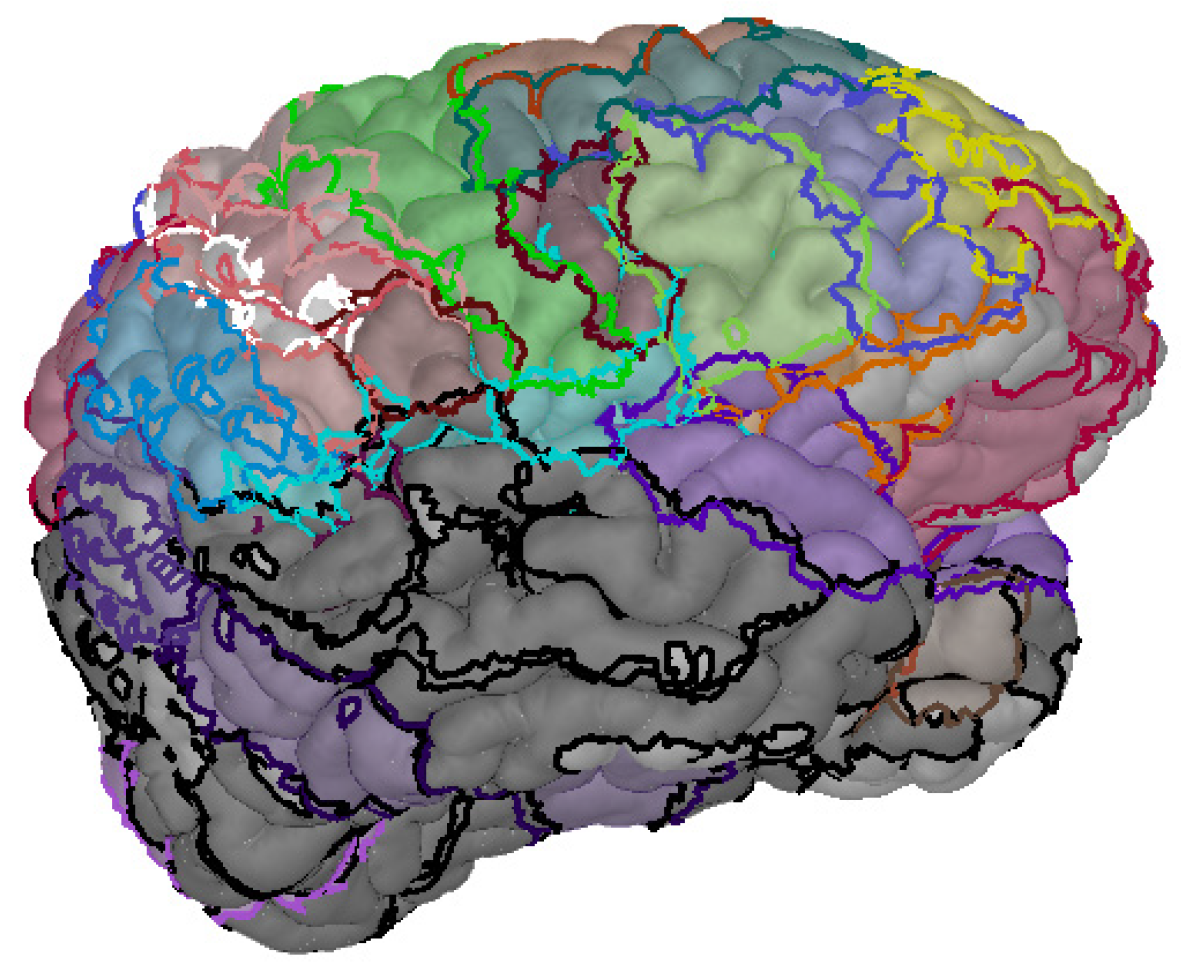
2.2. MRI System and Image Pre-Processing
2.3. PET System and Image Pre-Processing
3. Experimental Design
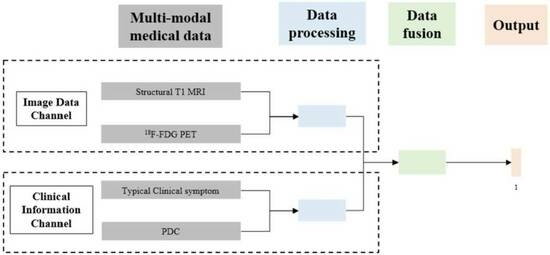
3.1. Multi-Modal Data Integration
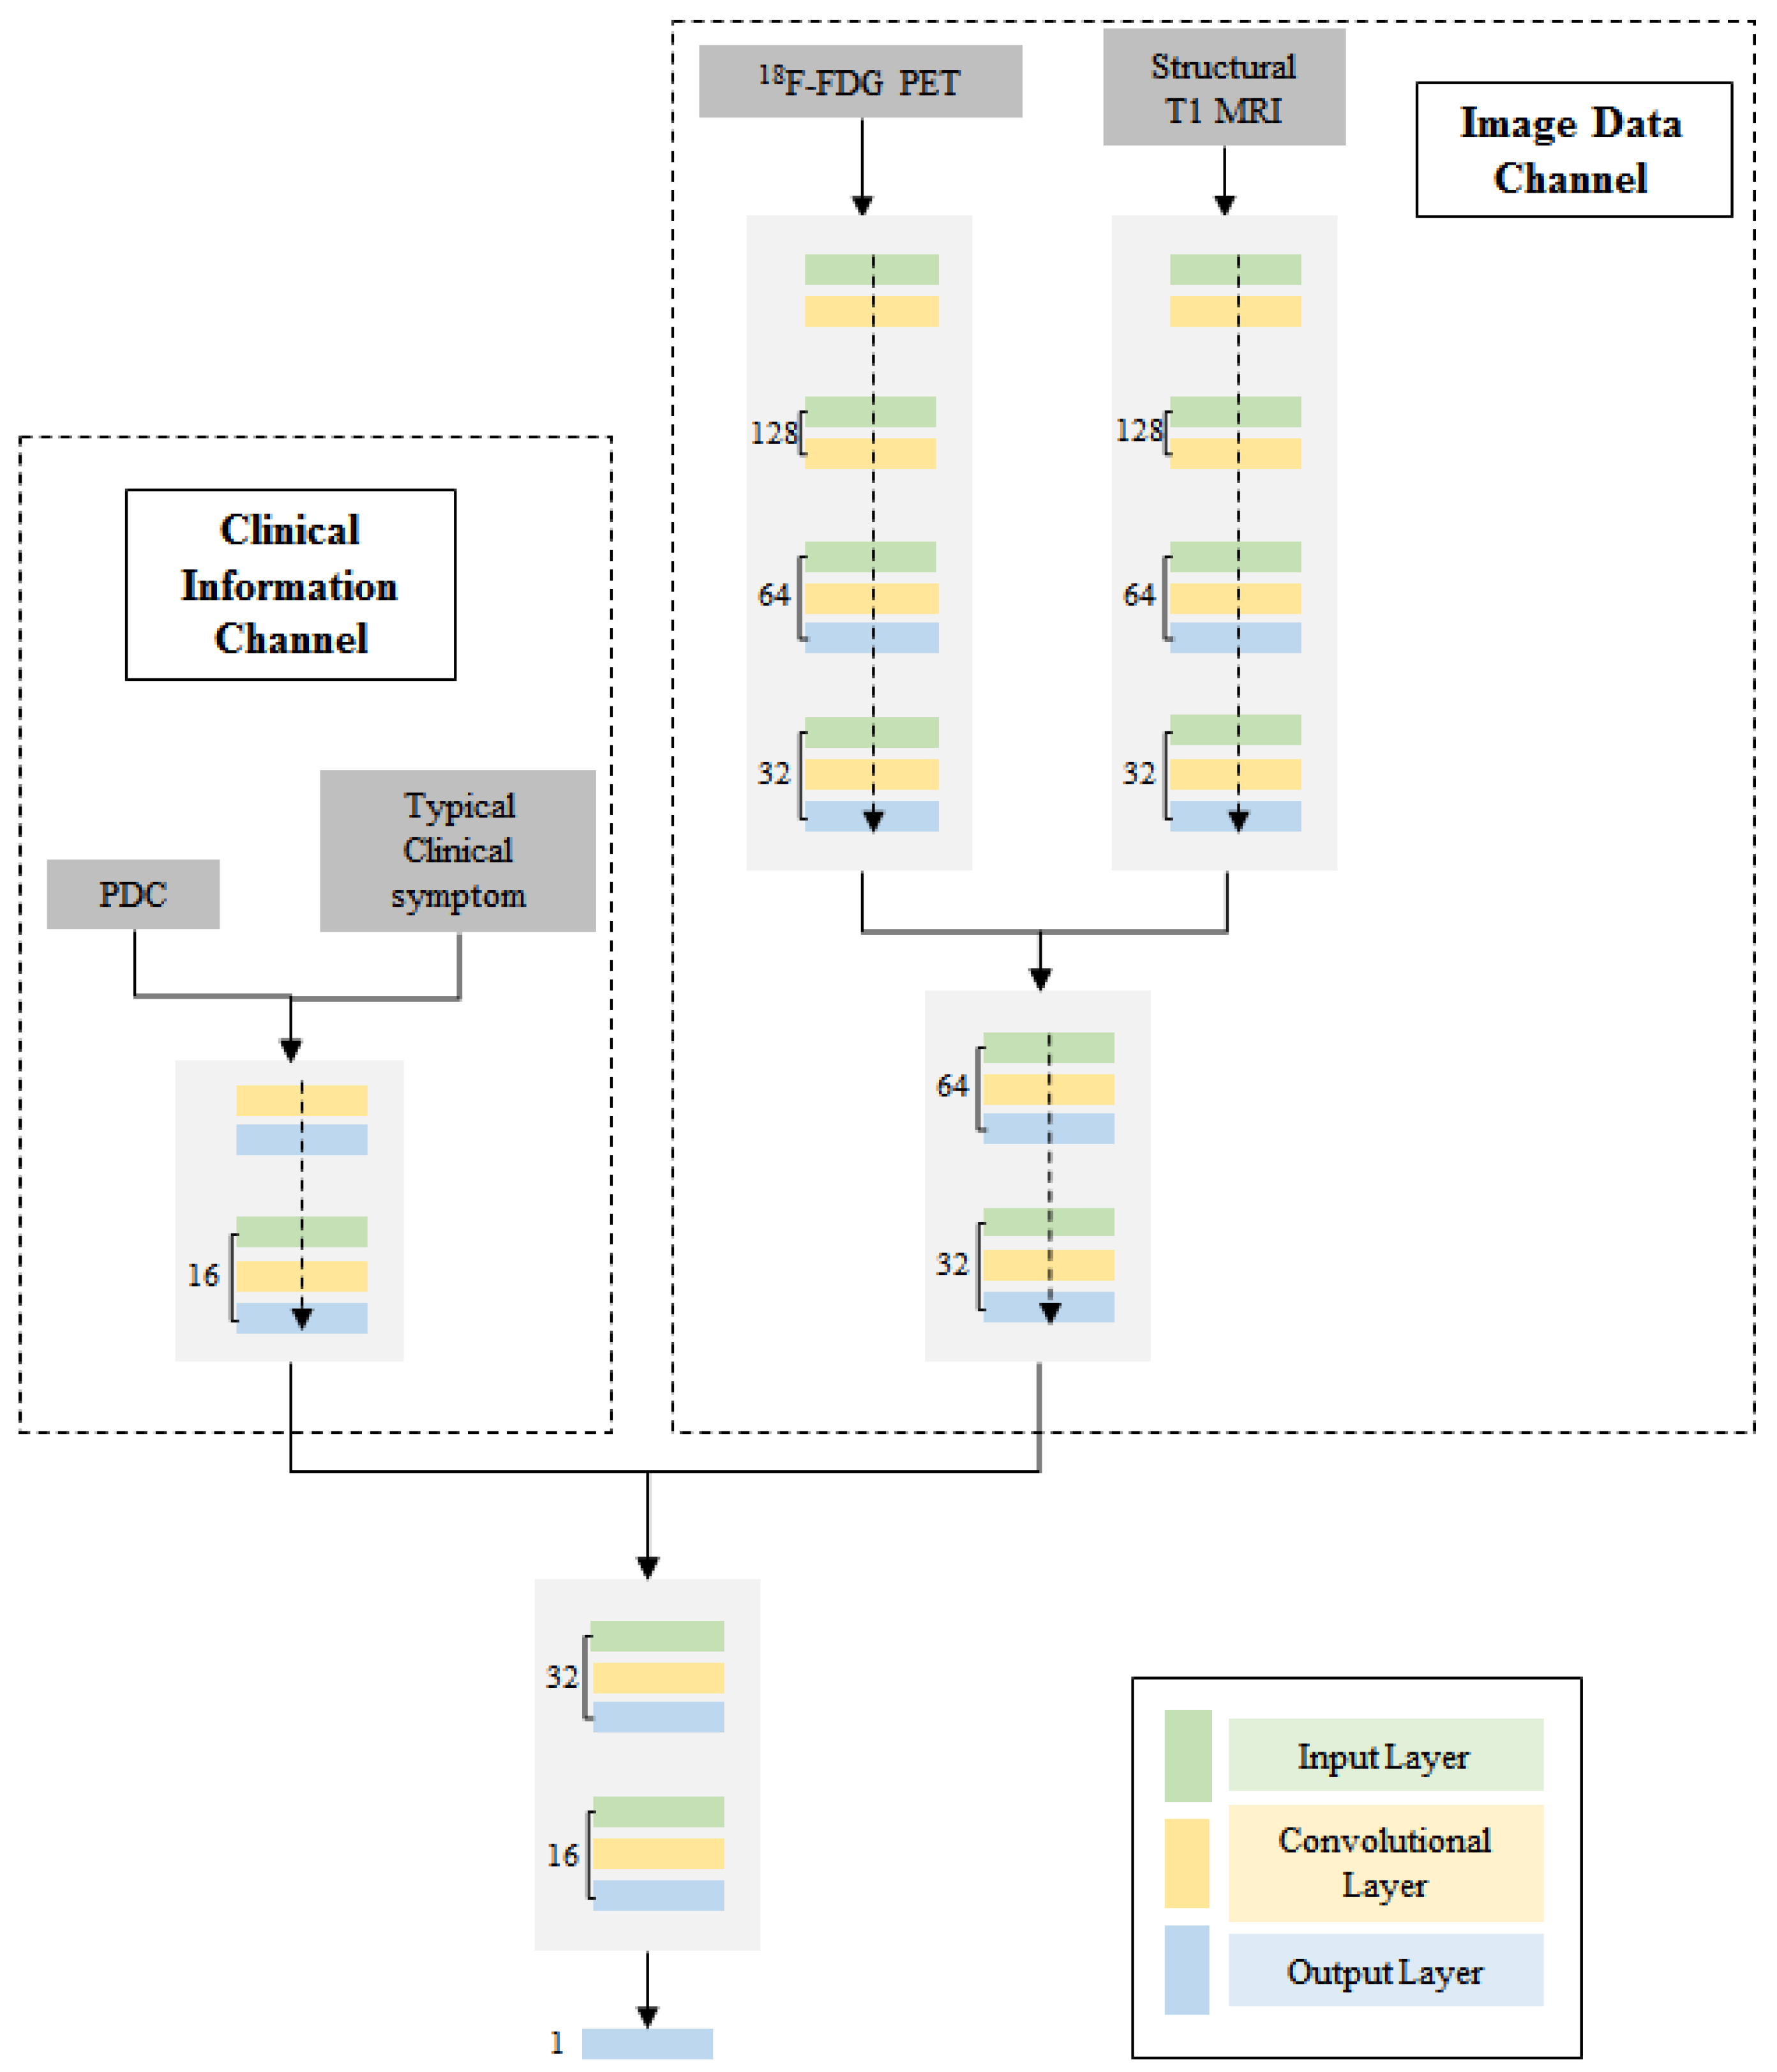
3.2. Multi-Channel Deep Neural Network
4. Results
4.1. Identification Result in Different Algorithms
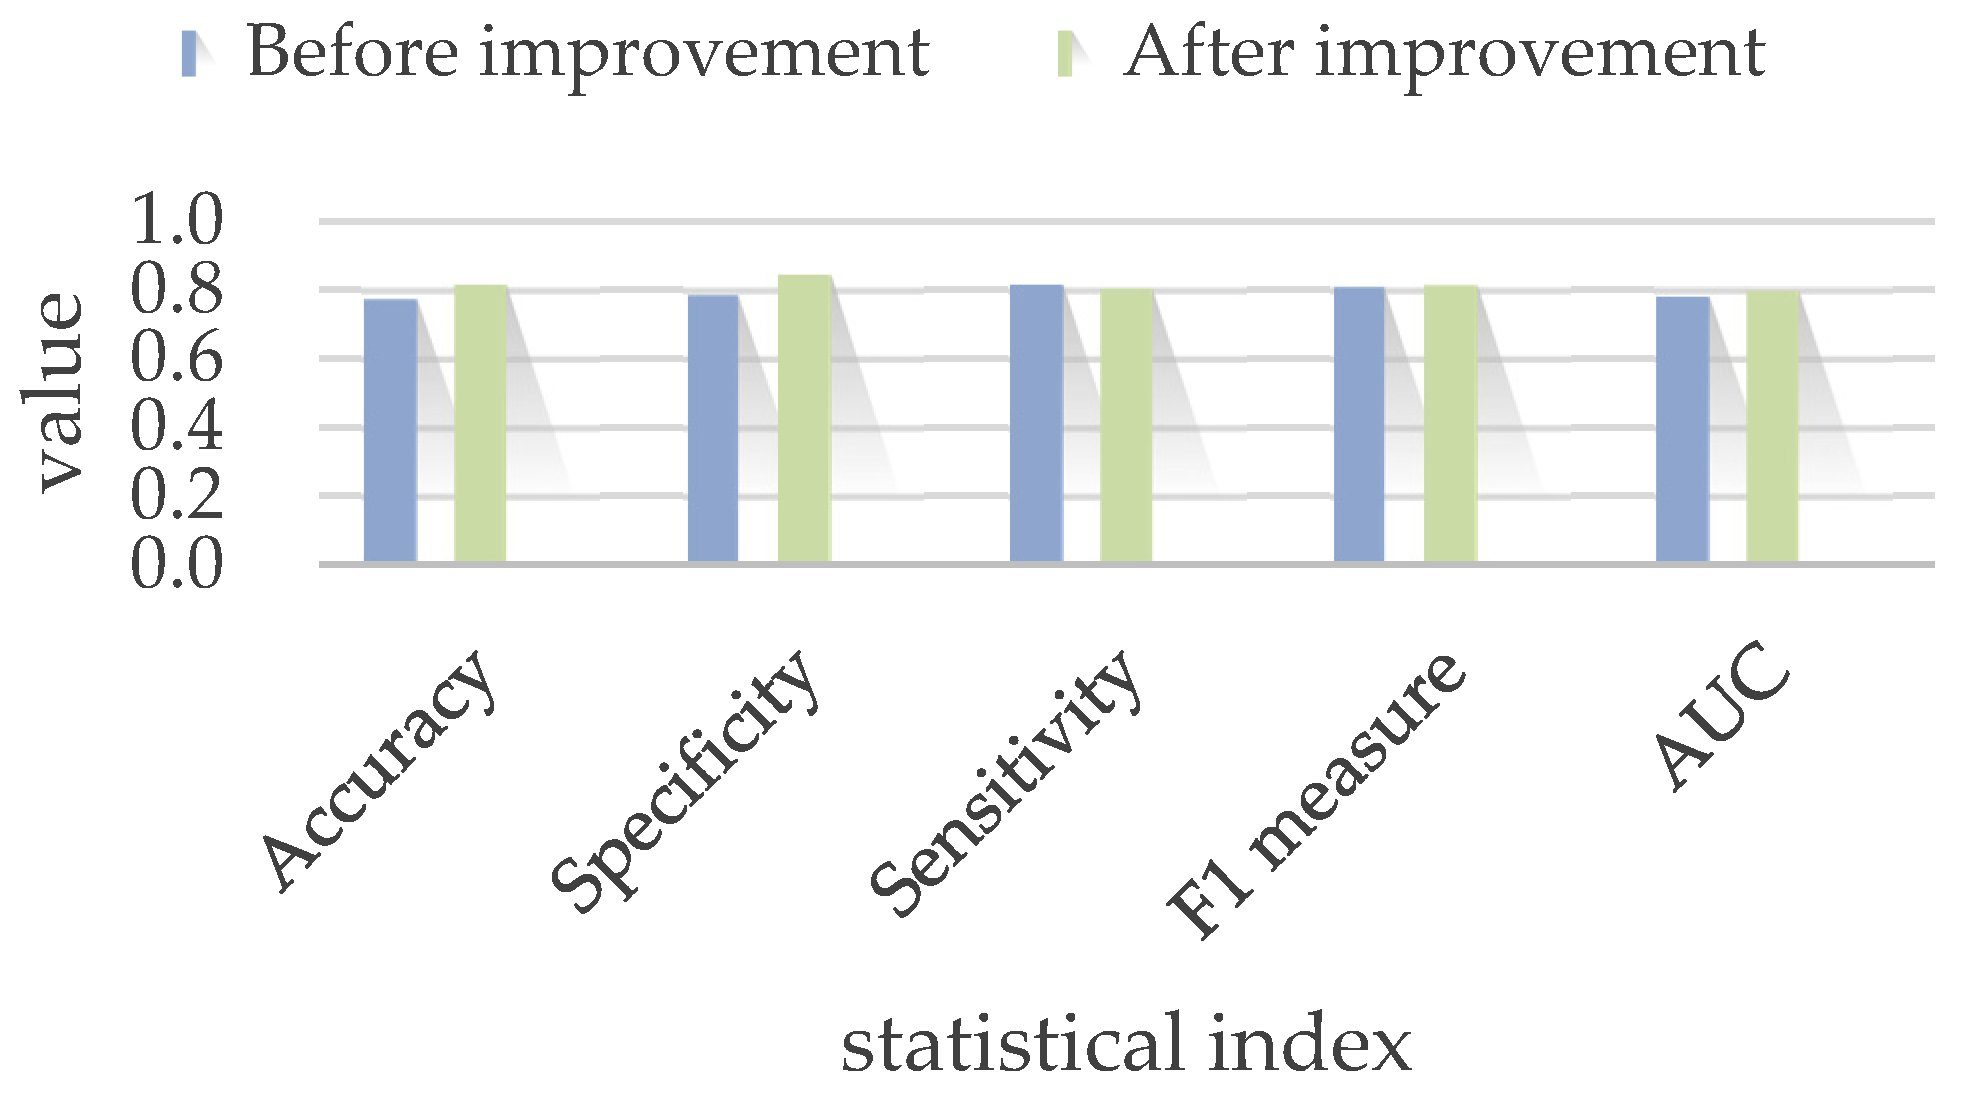
4.2. Model Improvement
5. Discussion
6. Conclusions
Author Contributions
Funding
Institutional Review Board Statement
Informed Consent Statement
Conflicts of Interest
References
- Sergio, J.Z.; Jorge, Z. A Deep Learning Approach for Epilepsy Seizure Identification Using Electroencephalogram Signals: A Preliminary Study. IEEE Lat. Am. Trans. 2023, 21, 419–426. [Google Scholar]
- Sobhana, J.; Farhana, N.; Mahathir, M.A.; Md, S.R.; Kaiser, S.M.; Hosen, A.S.M.S.; Ra, I. AI-Based Epileptic Seizure Detection and Prediction in Internet of Healthcare Things: A Systematic Review. IEEE Access 2023, 11, 30690–30725. [Google Scholar]
- Yu, Y.; Han, F.; Wang, Q. A Hippocampal-Entorhinal Cortex Neuronal Network for Dynamical Mechanisms of Epileptic Seizure. IEEE Trans. Neural Syst. Rehabil. 2023, 31, 1986–1996. [Google Scholar] [CrossRef] [PubMed]
- Salafian, B.; Ben, E.F.; Shlezinger, N.; Ribaupierre, D.S.; Farsad, N. MICAL: Mutual Information-Based CNN-Aided Learned Factor Graphs for Seizure Detection from EEG Signals. IEEE Access 2023, 11, 23085–23096. [Google Scholar] [CrossRef]
- Mertz, L. How a Tiny Electrical Current to the Brain is Treating Medical Symptoms. IEEE Pulse 2019, 10, 6–11. [Google Scholar] [CrossRef] [PubMed]
- Joshua, D.; Sinisa, C.; Yotin, C.; Carlen, P.L.; Bardakjian, B.L. Identification of brain regions of interest for epilepsy surgery planning using support vector machines. In Proceedings of the 2015 37th Annual International Conference of the IEEE Engineering in Medicine and Biology Society (EMBC), Milan, Italy, 25–29 August 2015. [Google Scholar]
- Ali, S.; Dave, C.; Eric, P.; Denison, T. A micropower support vector machine based seizure detection architecture for embedded medical devices. In Proceedings of the 31st 2009 Annual International Conference of the IEEE Engineering in Medicine and Biology Society, Minneapolis, MN, USA, 3–6 September 2009. [Google Scholar]
- Jerald, Y. On-chip epilepsy detection: Where machine learning meets patient-specific healthcare. In Proceedings of the 2017 International SoC Design Conference (ISOCC), Seoul, Republic of Korea, 5–8 November 2017. [Google Scholar]
- Calos, A.; Reyna, D.; Antonio, D. Identification of new epilepsy syndromes using machine learning. In Proceedings of the 2019 IEEE 39th Central America and Panama Convention (CONCAPAN XXXIX), Guatemala City, Guatemala, 20–22 November 2019. [Google Scholar]
- Rachael, G.; Paul, A. A machine learning model to predict seizure susceptibility from resting-state fMRI connectivity. In Proceedings of the 2019 Spring Simulation Conference (SpringSim), Tucson, AZ, USA, 29 April–2 May 2019. [Google Scholar]
- Sujitha, V.; Sivagami, P.; Vijaya, S. Predicting epileptic seizure from MRI using fast single shot proximal support vector machine. In Proceedings of the 2011 3rd International Conference on Electronics Computer Technology, Kanyakumari, India, 8–10 April 2011. [Google Scholar]
- Abdulla, S.; Mohd, W.; Nidal, R. Classification of seizure through SVM based classifier. In Proceedings of the 2018 International Conference on Computer Communication and Informatics (ICCCI), Coimbatore, India, 4–6 January 2018. [Google Scholar]
- Dorin, M. Crow search algorithm based ensemble of machine learning classifiers for epileptic seizures detection. In Proceedings of the 2020 International Conference on e-Health and Bioengineering (EHB), Iasi, Romania, 29–30 October 2020. [Google Scholar]
- Anupam, S.; Ritu, T.; Pabhdeep, K. Intelligent system for the diagnosis of epilepsy. In Proceedings of the 2009 WRI World Congress on Computer Science and Information Engineering (WCCSIE), Los Angeles, CA, USA, 31 March–2 April 2009. [Google Scholar]
- Si, X.; Zhang, X.; Zhou, Y. Automated detection of Juvenile Myoclonic Epilepsy using CNN based transfer learning in diffusion MRI. In Proceedings of the 2020 42nd Annual International Conference of the IEEE Engineering in Medicine & Biology Society (EMBC), Montreal, QC, Canada, 20–24 July 2020. [Google Scholar]
- Zhang, M.; Lin, X.; Du, P. An epilepsy and seizure classification approach based on multi-spike liquid state machines. In Proceedings of the 2019 15th International Conference on Computational Intelligence and Security (CIS), Macao, China, 13–16 December 2019. [Google Scholar]
- Cao, J.; Hu, D.; Wang, Y. Epileptic classification with deep transfer learning based feature fusion algorithm. IEEE Trans. Cogn. Dev. Syst. 2021, 10, 668–680. [Google Scholar] [CrossRef]
- Lee, M.; Nolan, O.; Masaki, S. Novel deep learning network analysis of electrical stimulation mapping-driven diffusion MRI tractography to improve preoperative evaluation of pediatric epilepsy. IEEE Trans. Biomed. Eng. 2020, 67, 3151–3162. [Google Scholar] [CrossRef] [PubMed]
- Pankaj, K.; Mukesh, G.; Basant, A. Deep learning with multi modal ensemble fusion for epilepsy diagnosis. In Proceedings of the 2020 3rd International Conference on Emerging Technologies in Computer Engineering: Machine Learning and Internet of Things (ICETCE), Jaipur, India, 7–8 February 2020. [Google Scholar]
- Ingrid, S.; Samuel, B.; Giuseppe, C. ILAE classification of the epilepsies: Position paper of the ILAE commission for classification and terminology. Epilepsy 2017, 58, 512–521. [Google Scholar]
- Qu, R.; Wang, S.; Liu, Z.; Gu, J.; Xu, G. 3D-CNN frameworks for mesial temporal lobe epilepsy diagnosis in MRI images. Int. J. Appl. Electromagn. Mech. 2022, 70, 515–523. [Google Scholar]
- Zhang, Q.; Liao, Y.; Wang, X.; Zhang, T.; Feng, J.; Deng, J.; Shi, K.; Chen, L.; Feng, L.; Ma, M.; et al. A deep learning framework for 18F-FDG PET imaging diagnosis in pediatric patients with temporal lobe epilepsy. Eur. J. Nucl. Med. Mol. Imaging 2021, 48, 2476–2485. [Google Scholar] [CrossRef] [PubMed]
- Torres-Velázquez, M.; Hwang, G.; Cook, C.J.; Hermann, B.; Prabhakaran, V.; Meyerand, M.E.; McMillan, A.B. Multi-Channel Deep Neural Network For Temporal Lobe Epilepsy Classification Using Multimodal Mri Data. In Proceedings of the 2020 IEEE 17th International Symposium on Biomedical Imaging Workshops (ISBI Workshops), Iowa City, IA, USA, 4 April 2020. [Google Scholar]


| Inputs | PET Images Along | Structural T1 MRI Along | PET Images and T1 MRI | All Information |
|---|---|---|---|---|
| Neural Network | Image-Data Channel | Image-Data Channel | Image-Data Channel | Whole Network |
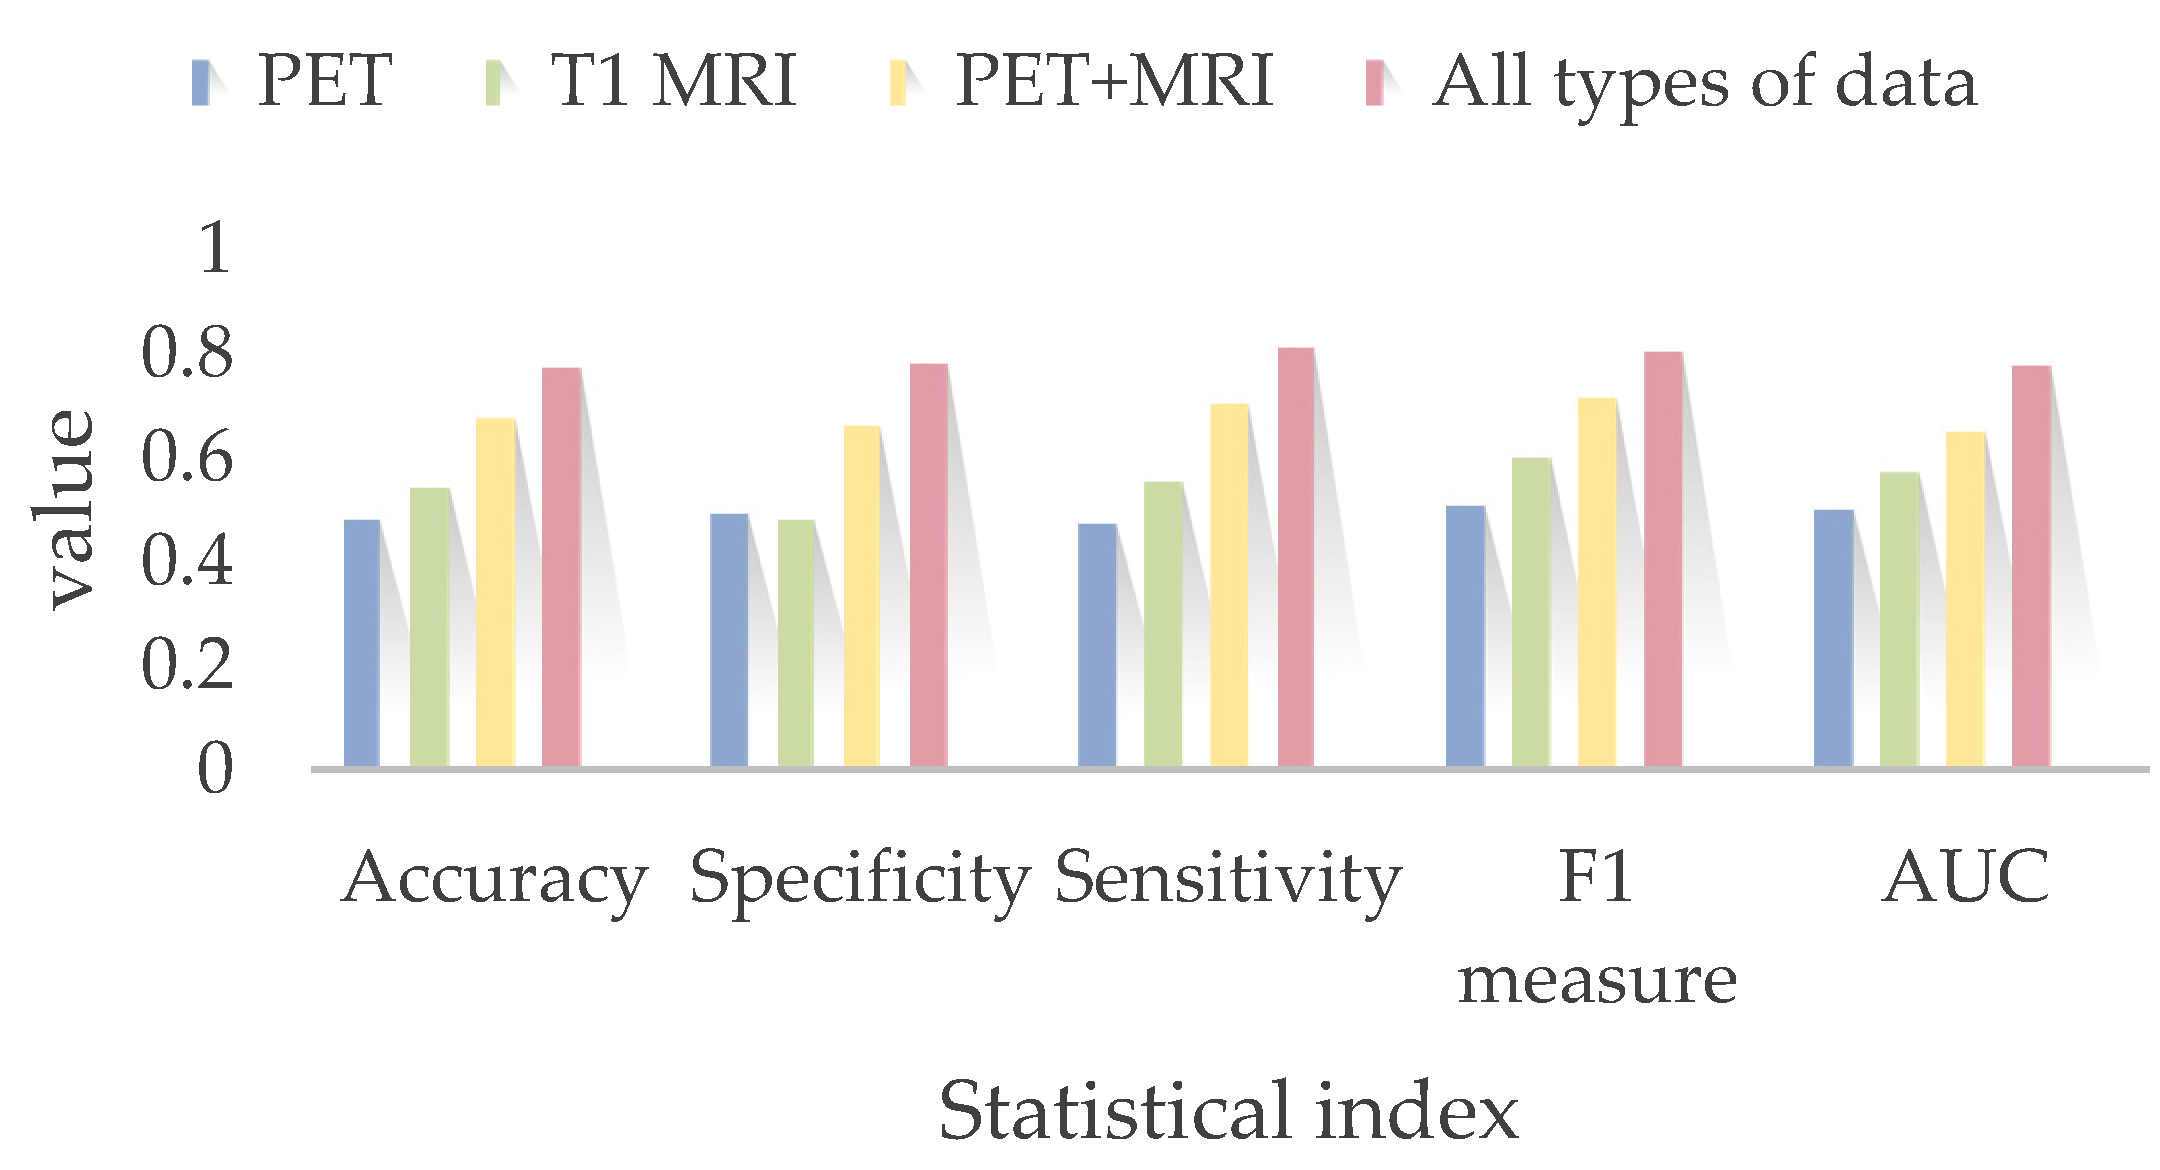
| Accuracy | 48% ± 19.85% | 54.33% ± 7.67% | 67.33% ± 50.25% | 77.33% ± 14% |
| Specificity | 49.33% ± 20.01% | 48.35% ± 6.63% | 66.35% ± 7.32% | 78.44% ± 19.35% |
| Sensitivity | 47.85% ± 15.73% | 55.67% ± 3.38% | 70.68% ± 19.34% | 81.51% ± 15.86% |
| F1-measure | 50.74% ± 13.21% | 60.30% ± 11.59% | 71.65% ± 11.94% | 80.71% ± 2.21% |
| AUC | 0.50 | 0.57 | 0.65 | 0.78 |
| Model | Accuracy | Specificity | Sensitivity | F1 Measure | AUC |
|---|---|---|---|---|---|
| Before improvement | 77.33% ± 14% | 78.44% ± 19.35% | 81.51% ± 15.86% | 80.71% ± 2.21% | 0.78 |
| After improvement | 81.67% ± 10.33% | 84.33% ± 16.58% | 80.33% ± 50.25% | 81.33% ± 14% | 0.80 |
Disclaimer/Publisher’s Note: The statements, opinions and data contained in all publications are solely those of the individual author(s) and contributor(s) and not of MDPI and/or the editor(s). MDPI and/or the editor(s) disclaim responsibility for any injury to people or property resulting from any ideas, methods, instructions or products referred to in the content. |
© 2023 by the authors. Licensee MDPI, Basel, Switzerland. This article is an open access article distributed under the terms and conditions of the Creative Commons Attribution (CC BY) license (https://creativecommons.org/licenses/by/4.0/).
Share and Cite
Qu, R.; Ji, X.; Wang, S.; Wang, Z.; Wang, L.; Yang, X.; Yin, S.; Gu, J.; Wang, A.; Xu, G. An Integrated Multi-Channel Deep Neural Network for Mesial Temporal Lobe Epilepsy Identification Using Multi-Modal Medical Data. Bioengineering 2023, 10, 1234. https://doi.org/10.3390/bioengineering10101234
Qu R, Ji X, Wang S, Wang Z, Wang L, Yang X, Yin S, Gu J, Wang A, Xu G. An Integrated Multi-Channel Deep Neural Network for Mesial Temporal Lobe Epilepsy Identification Using Multi-Modal Medical Data. Bioengineering. 2023; 10(10):1234. https://doi.org/10.3390/bioengineering10101234
Chicago/Turabian StyleQu, Ruowei, Xuan Ji, Shifeng Wang, Zhaonan Wang, Le Wang, Xinsheng Yang, Shaoya Yin, Junhua Gu, Alan Wang, and Guizhi Xu. 2023. "An Integrated Multi-Channel Deep Neural Network for Mesial Temporal Lobe Epilepsy Identification Using Multi-Modal Medical Data" Bioengineering 10, no. 10: 1234. https://doi.org/10.3390/bioengineering10101234
APA StyleQu, R., Ji, X., Wang, S., Wang, Z., Wang, L., Yang, X., Yin, S., Gu, J., Wang, A., & Xu, G. (2023). An Integrated Multi-Channel Deep Neural Network for Mesial Temporal Lobe Epilepsy Identification Using Multi-Modal Medical Data. Bioengineering, 10(10), 1234. https://doi.org/10.3390/bioengineering10101234