Article

Event Scale Analysis of Streamflow Response to Wildfire in Oregon, 2020

Department of Geography, Portland State University, Portland, OR 97201, USA
*
Author to whom correspondence should be addressed.
Hydrology 2022, 9(9), 157; https://doi.org/10.3390/hydrology9090157
Submission received: 28 July 2022 / Revised: 26 August 2022 / Accepted: 31 August 2022 / Published: 2 September 2022
(This article belongs to the Section Hydrology–Climate Interactions)

Abstract

:
Wildfire increases the magnitude of runoff in catchments, leading to the degradation of ecosystems, risk to infrastructure, and loss of life. The Labor Day Fires of 2020 provided an opportunity to compare multiple large and severe wildfires with the objective of determining potential changes to hydrologic processes in Oregon Cascades watersheds. Geographic information systems (GIS) were implemented to determine the total percentage burned and percentage of high burn severity class of six watersheds on the west slope of the Oregon Cascade Range. In addition, two control watersheds were included to contrast the influence of climatic effects. Spatial arrangements of burned patches were investigated for correlation to streamflow response by utilizing landscape metrics algorithms, including Largest Patch Index (LPI), mean gyration (GYRATE), Contiguity Index (CONTIG), Patch Cohesion Index (COHESION), and Clumpiness Index (CLUMPY). Results of the first-year post-fire response were consistent with other studies of fire effects in the Pacific Northwest (PNW) and indicated changes to runoff dynamics were difficult to detect with inferential statistics, but the largest changes in runoff coefficients occurred in watersheds having the greatest percentage burned. Correlation analysis indicated relationships between event runoff coefficients and percentage burned during the 2020 fire season. Control watersheds show confounding runoff coefficients, point to the influence of ongoing drought, and complicate conclusions about the role of spatial burn severity patterns. These results could guide future post-fire studies of spatial patterns of burn severity and could assist watershed managers to prioritize at-risk PNW catchments to minimize harm to ecological and societal values.

1. Introduction

In the western United States, over 60% of municipal water supplies originate in forested areas, and wildfire reduces the water resiliency of communities that rely on these sources [1]. Stresses to water resources are increasingly common in burned watersheds due to changes to runoff dynamics that result from enhanced surface runoff and soil erosion [2]. Implications of these shifts include changes in annual water yield [3] and degradation of water quality [4,5], which challenges the flexibility of socio-economic systems to adapt. Additionally, severely burned watersheds can have a reduced capacity to hold water in the soil, which increases the occurrence of extreme hydrological events such as floods and landslides, threatening expanding populations near the urban–wildland interface and leading to loss of life and property [6].
Classes of burn severity are determined by the assessment of remotely sensed imagery and/or field reconnaissance of watershed disturbances that are driven by fire intensity, the physical release of energy from combusting organic material over a period of time, which can cause a gradient of alterations to biomass and soil properties occurring during a wildfire event [7,8]. Measures of burn severity have been shown to be correlated with increased runoff in plot-scale studies and attributed to alterations of soil and vegetative cover [9,10]. First, the removal of vegetative canopy and forest litter increases throughfall to the soil surface [11]. Secondly, alterations of soil structure include the reduction in aggregation and water repellency, which can drastically reduce the hydraulic conductivity of soils [12]. Fire disturbance is dependent on the fire intensity, duration [13], and soil properties [14] and varies spatially [15]. These disturbances can be categorically mapped in a landscape using remotely sensed imagery including Landsat data. Landsat data can be adapted to represent burn severity by first developing a Normalized Difference Vegetation Index (NDVI), which can be transformed into the Normalized Burn Ratio (NBR) to represent burn severity [16]. These map coverages are commonly used as proxies for the level of consumption of ground cover and alteration of the soil, assisting land managers to prioritize responses in burned areas, and have been increasingly used in fire research [17].
Streamflow metrics can quantify the influence of fire severity on hydrological response at the catchment and watershed scale. Higher burn severity often results in increased runoff and erosion rates on catchment hillslopes due to a reduction in soil infiltration [10]. At the watershed scale, these alterations can lead to changes in streamflow characteristics, such as peak flow, timing of runoff, base flow, and water yield [18]. While comparing burned and unburned catchments using the unit peak discharge method, [6] found that peak flow is more sensitive to wildfire disturbance than annual water yield. Short-term increases in base flow have been observed because of the transitory reduction of evapotranspiration and increased groundwater availability [19,20]. Timing of runoff has been shown to be correlated with percentage of burned area within watersheds [21,22].
The influence of burn patch connectivity on hydrologic response has been little studied, but it has been proposed that there is a link between the distribution and location of fire disturbances in a basin and increased runoff delivery to stream channels [23]. Additionally, the spatial heterogeneity of burn severity can form a patchy mosaic, further increasing the spatial variability of soil infiltration rates, which enhances overland flow in some areas [24] or acts as a sink for runoff [25,26]. Preferential flow paths have been described with the term functional connectivity, which describes the tendency of landscape patterns to regulate the movement of overland flow [27]. Thereby, the hydrological response of catchments to precipitation is a balance between functional connectivity of runoff processes and storage [28]. In this sense, the removal of ground cover and alteration of hydraulic soil properties can further enhance the functional connectivity in areas of high disturbance [29]. Conversely, normal infiltration rates remain in unburned areas within the fire perimeter, effectively reducing connectivity and increasing soil storage. The destabilization of this balance can be rapid and highly variable due to the spatial heterogeneity of precipitation and catchment characteristics [30]. Additional variability in fire extent, severity, and overlapping disturbances cause difficulties in comparing the hydrological response of different watersheds to fire disturbance [11].
Understanding how the spatial distribution of landcover might influence physical processes between different locations is a primary interest of geographers. One method of describing these patterns is the use of landscape metrics—algorithms that allow the quantification of landcover pattern and arrangement [31]. Additionally, landscape metrics can quantify subjective descriptions of landcover aggregation and density observed in spatial, categorical data to produce comparable indices. There are many metrics that can be calculated, but often, metrics describe similar aspects of patch characteristics. Furthermore, it has been suggested that metrics describing patch compaction, the number of patches, contagion, texture, patch shape, and average patch composition are adequate in describing the spatial arrangement of most landscape patterns [32]. Fire ecologists have modified this rationale to fit project objectives, having described significant relationships between forest composition and burn severity patterns [33,34]. Landscape metrics have been used to quantify spatial patterns in the post-fire environment representing two drivers of streamflow response: vegetation mortality [35] and soil hydrophobicity [36]. The configuration of burn patches has been quantified with landscape metrics across modeled hillslopes, and the spatial structure of vegetative patterns has been found to be significant in describing runoff and discharge [37,38].
In urban environments, the spatial arrangement of landcover on hydrologic response has been well studied. For example, the fragmentation of impervious urban surfaces was found to be negatively correlated with flashiness and streamflow variability in North Carolina and Utah, with large, continuous urban patches producing flashier streamflow responses [39]. Landscape metrics have been utilized in quantifying the effect of urban land cover change on aquatic health, indicating a correlation of spatial patterns with water quality and degradation at accelerating rates [40]. Similarly, landscape fragmentation metrics have been employed to examine changes in total suspended solids in an urbanizing Oregon watershed [41]. The use of landscape metrics in determining runoff response in forested catchments is less common, but modeling efforts directed at the influence of hydrological connectivity on runoff response demonstrate that landscape metrics are effective as a proxy for heterogeneity that influences runoff [42]. Studies using experimental plots in burned areas indicate that unburnt patches effectively reduce hydrologic connectivity and produce less post-fire runoff [26]. Additionally, modeling experiments have tested the ability of patch aggregation metrics such as the Contiguity Index (CONTAG) to represent hydrological connectivity in an idealized snow-dominated catchment in Idaho, USA, finding spatial patterns of burned and unburned patches that are important in explaining variations in discharge and soil condition, with less aggregated burn mosaics showing a greater departure from normal [37]. Limited investigation at increased scales shows that there is a need to examine the ability of landscape metrics to represent spatial patterns of wildfire and possible effects on watershed runoff, with the caveat that landscape patterns do not always represent physical hydrological processes [43].
Specifically, this work seeks to answer the following questions:
  • To what degree does the arrangement of burn severity patches influence streamflow response at event scales?
  • Are changes to event runoff ratios more detectable using daily values or using instantaneous values for individual events?

2. Materials and Methods

2.1. Context of 2020 Labor Day Fires

The 2020 fire season in western Oregon was remarkably severe and resulted from extreme atmospheric aridity that coincided with a strong east to north-east katabatic wind event, which drove the rapid expansion of existing lightning ignitions and human-caused fires [44]. Between September 7 and September 15, these strong down-slope winds drove multiple large wildfires into populated areas, forcing the evacuation of about 40,000 people and placing almost 500,000 people under evacuation readiness notices [45]. Ultimately, 400,000 hectares burned across Oregon in 2020, representing the most substantial fire season in about 120 years. Despite causing extensive harm to life and property, the 2020 fires were not unusual for Cascade west-slope mesic forests. Several large fire events, greater than 300,000 hectares, have occurred post-European settlement, which include the Great Fire of 1845 and Yacolt Burn of 1902 [46]. The most unprecedented aspect of the Labor Day Fires of 2020 was the population centers that were impacted, both directly through loss of socioeconomic values and indirectly due to cumulative threats of poor air quality and interrupted water delivery. It is unclear what implications these fires will have on the forest ecology and what the ongoing impacts will be for communities that may suffer degraded water sources. The Oregon Labor Day Fires provide a unique opportunity to compare the hydrologic response of multiple watersheds in a relatively small geographic area with the aim of determining the effect of burn severity patterns on the rate and timing of rainfall-runoff at the event scale.

2.2. Study Area Overview

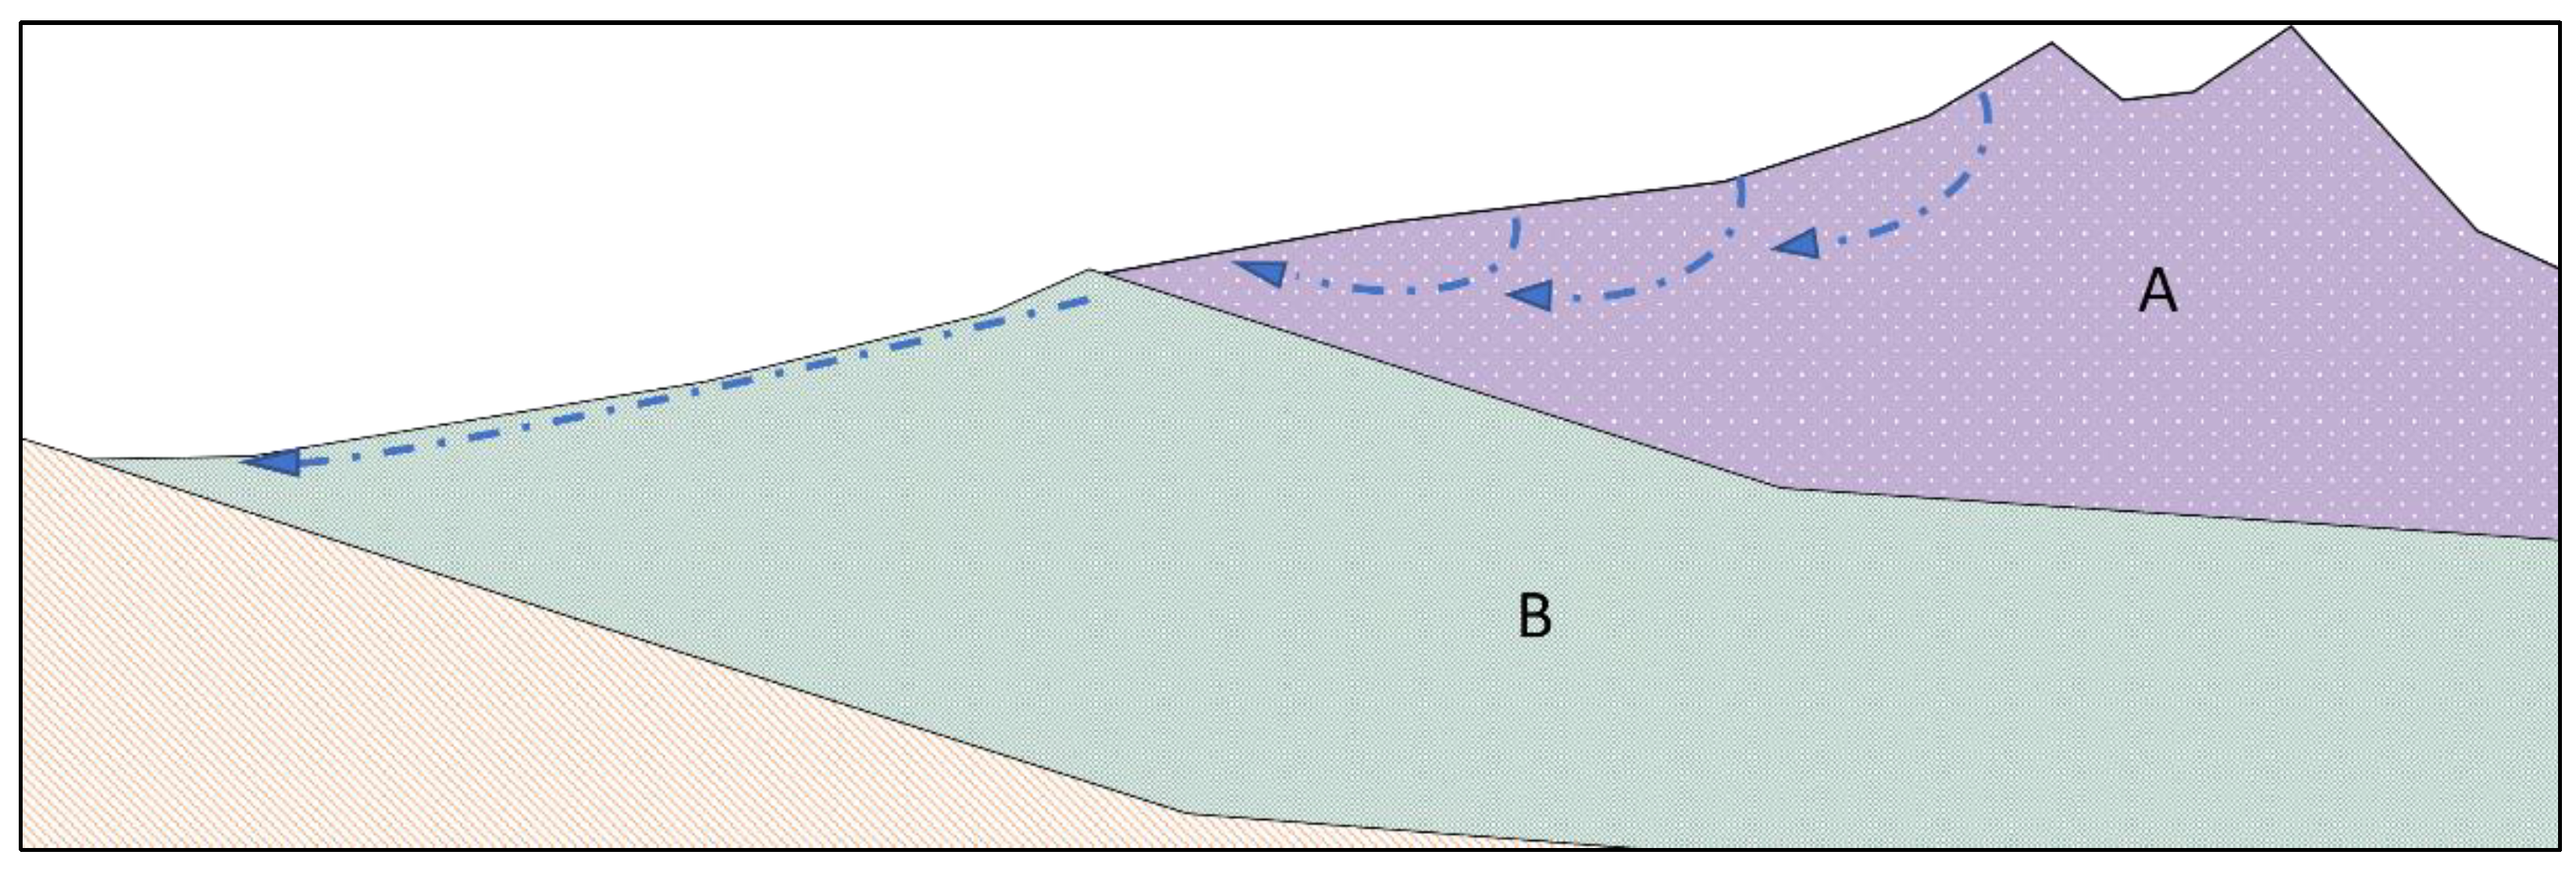
The study area is located in the Western Cascades ecoregion, with two distinct geologic provinces: the High Cascade and the Western Cascade (Figure 1). These provinces have contrasting influences on the hydrology of the watersheds that drain them due to the unique underlying geology [47]. The High Cascade province contains Quaternary and Pliocene volcanics, related to the subduction of the Juan de Fuca plate. These areas have primarily produced basaltic and andesitic lava flows from young shield and cinder volcanos, resulting in a broad north to south running plateau. These volcanic terrains provide strong subsurface pathways for groundwater interaction in the headwaters of west-slope Cascade watersheds. At lower elevations, the geology is dominated by Tertiary aged rocks of the Western Cascade Province, which have much lower permeability and provide greater runoff rates (Figure 2).
The hydrology of these areas is characterized by high rates of erosion and sedimentation, punctuated by frequent mass wasting events [48]. In addition, the hydrology of the region is heavily influenced by the percentage of permeable High Cascade terrain within the contributing area, where watersheds with greater mean elevations translate to greater mean permeability and lower elevation watersheds to low mean permeability (Table 1). The permeable geology obtained from USGS StreamStats was originally produced from a 1:2,500,000 map considering the percentage of the basin surface area that contained high permeability geologic units, which were Pliocene volcanic rocks, Upper Tertiary andesite, and Quaternary volcanic rocks [49]. For soil permeability, we used watershed-wide average soil permeability (SOILPERM) in mm per hour, estimated with a data layer created from a 1:250,000 STATSGO map [50]. Permeability values are assumed to be uniform across watersheds (Table 1), although the permeability of these formations can vary spatially due to local hydrothermal alterations and depth of soil formation [51].
The dominance of the High Cascades province in the upper portion of the watersheds contributes to the low intra-annual variability of watersheds in the Oregon cascades [52]. Most precipitation falls from November to May, and the amount and type are dependent on the elevation of the watershed, with lower elevation watersheds receiving a rain–snow mix and higher elevations accumulating dense snowpacks [53]. Many watersheds in this region are utilized for timber extraction, which occurs on private, federal, and state-managed lands. It is worth mentioning that extensive salvage logging, the commercial harvesting of burned trees, was undertaken shortly after the fire, primarily concentrated on state managed lands, but specific information about the extent was not available at the time of study and not accounted for herein.

2.3. Individual Watershed Characteristics
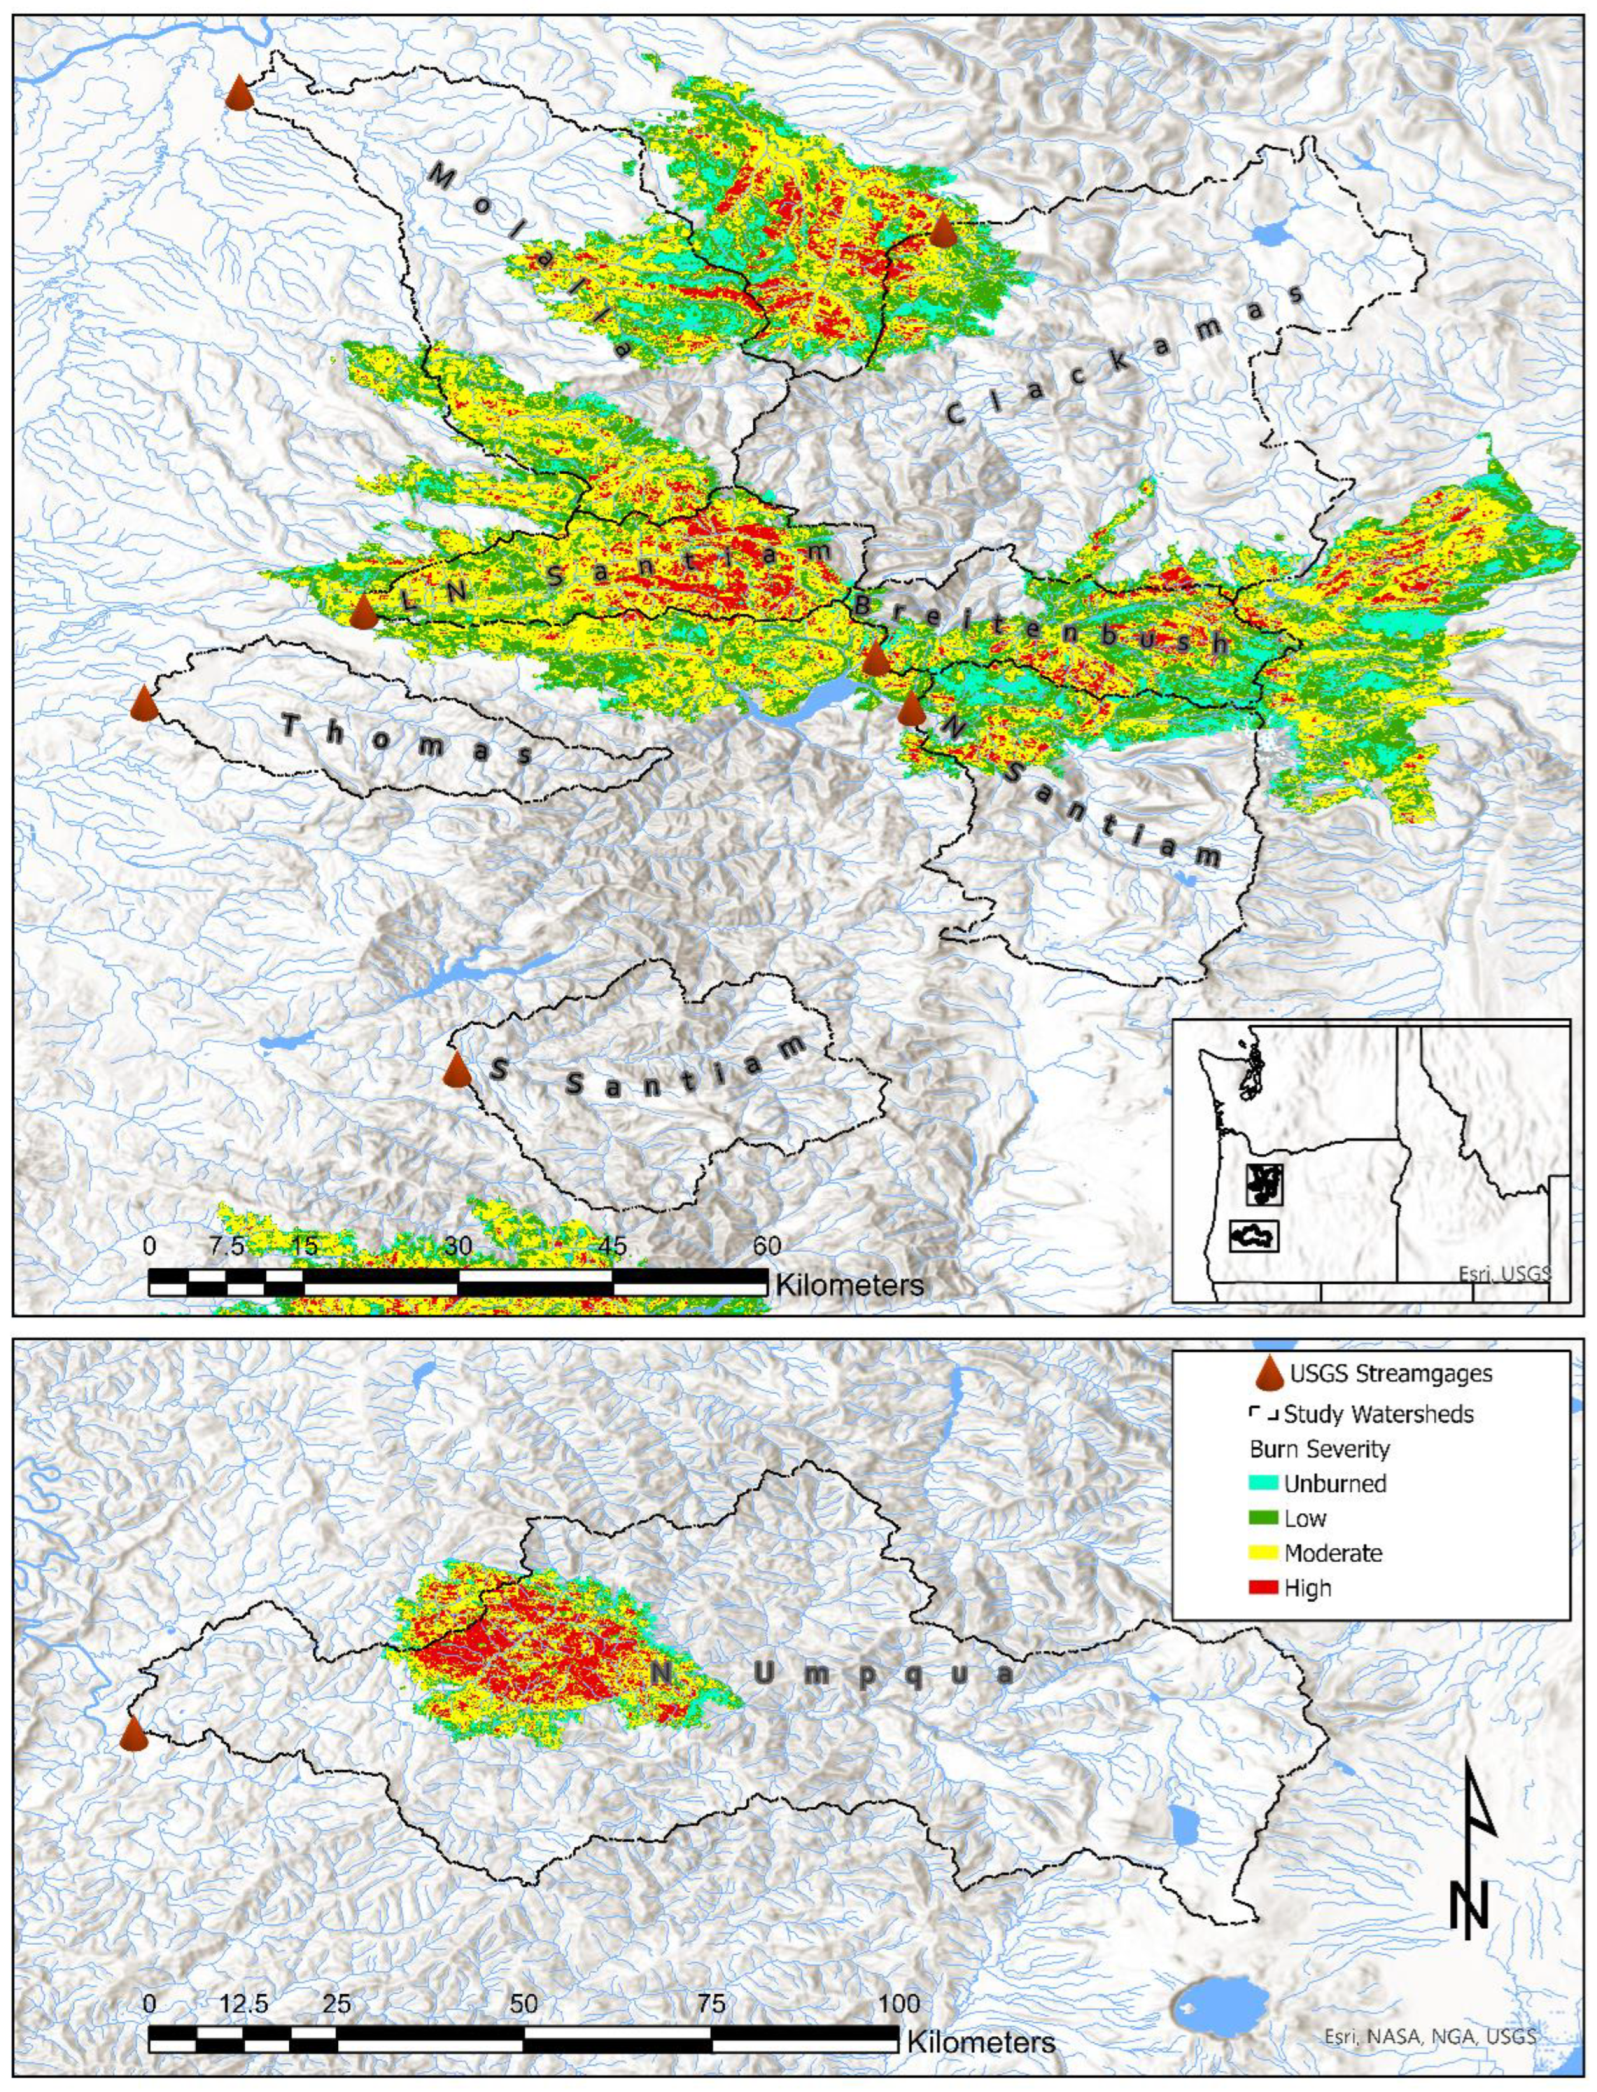
To investigate the streamflow response to burn severity patterns, six watersheds in the Oregon Cascades that burned in the 2020 Labor Day Fires were selected (Table 1, Figure 1, Figure 3). Criteria for selection included having greater than 5% burned area within the watershed boundary and containing a complete discharge record of one pre-fire and post-fire year. These watersheds were also limited to having either unregulated streamflow or minimum impacts by upstream reservoirs to reduce the influence of anthropogenic alterations. Additionally, two watersheds that were not burned by the fires were selected as control watersheds (Table 1, Figure 1, Figure 3). These control watersheds were selected based on having similar watershed areas, low flow alteration, and complete discharge records for the pre- and post-fire periods.
Figure 3. Oregon study area including the location USGS streamgaging stations, watershed boundaries, and burn severity classes. Low burn severity includes areas where surface organics have not been completely combusted, roots are intact, and some patches of grey ash are present. Moderate burn severity includes areas where some surface organics and roots have been consumed, some needles and leaves may remain, and patches of grey/black ash are present. High burn severity includes areas where almost all the organic groundcover has been destroyed, many surface roots are consumed, bare soil is exposed and soil structure has been disturbed, stumps and trees are completely burned out in places, and thick deposits of white and grey ash are present [54].
Hydrology 09 00157 g003
Table 1. Oregon watershed characteristics obtained from USGS StreamStats web tool [55].
WatershedArea (km2)Mean Basin Elevation (m)Mean Basin Slope
(degrees)
Mean Annual Precip. (mm)Mean Soil Perm. (mm/hr)Permeable Geology (%)Forested (%)
Clackamas1266176014.118518866.389.9
LN Santiam28781721.72235606.195.7
Breitenbush274115521.6205711554.590.0
N Umpqua3515100527.014965926.088.4
Molalla84158813.419585025.882.3
N Santiam558125814.7218414885.087.1
S Santiam45189919.72143505.692.6
Thomas28555713.72045294.780.4
Beginning in the southern portion of the study area, the North Umpqua River at Winchester, OR (USGS site 14319500) has the largest contributing area (1005 km2) and receives 19% less annual precipitation than the Clackamas watershed in the north. Overall, the North Umpqua has the third highest mean elevation (1005 m) and contains about 26% permeable geology (Table 1). The North Umpqua is primarily a snow-driven watershed that can respond rapidly to rain on snow events despite the porous High Cascades geology that facilitates ground water inputs. The Winchester Dam is located just upstream of the gaging station, one of eight dams in the watershed, but all dams have a small storage capacity and limited influence on the streamflow of the North Umpqua River. The North Umpqua was impacted by the Archie Creek fire, which originated 20 miles upstream of Glide, OR and spread to 53,233 hectares. The USGS gage North Umpqua River near Winchester sustained 12.9% of its drainage area burned, with 4.5% burning at high severity (Table 2). Due to fragmented landcover, the burn severity patterns were highly influenced by the availability of fuels in lands dissected by timber parcels [56]. The northwestern portion of the watershed contains densely clustered high burn severity patches primarily located in the Rock Creek drainage.
The North Santiam watershed drains 558 km2 above the USGS streamgage (North Santiam River below Boulder Creek near Detroit, OR) before entering the Detroit Lake reservoir. The geology of the upper North Santiam watershed is typical of other west-slope watersheds in Oregon, having soils dominated by easily mobilized, unconsolidated volcanic parent material containing abundant smectite clays and kaolinite deposits [57]. The underlying geology is similar to the above-mentioned description of the North Umpqua but contains a greater proportion of High Cascade province than Western Cascade province, resulting in a much higher percentage of permeable geology (Table 1). Additionally, the hydrology is primarily influenced by snow accumulation in high elevation areas and rain on snow events that produce the largest peak flows. The northwestern section above the USGS streamgage was impacted the Lionshead fire, and 24.9% was within the fire perimeter, although much of the upper watershed was not disturbed. The investigation of the burn severity classes within the drainage area shows a majority low burn severity with only 1.7% high burn severity (Table 2). Areas of high burn severity are concentrated in the Marys Creek and Boulder Creek drainages near the streamgaging location.
The Breitenbush River is a subbasin in the North Santiam watershed that drains 274 km2 into the Detroit Reservoir near Detroit, OR (Table 1). The geology of the Breitenbush river differs slightly from nearby watersheds as it is dominated by the Little Butte Terrain containing late Oligocene to early Miocene volcanics with highly varying lithologies. These ignimbrites and breccia are the oldest exposed rocks in the north central cascades resulting from pyroclastic density currents [58]. The upper watershed contains rocks typical of the Western Cascade and High Cascade terrains. The Breitenbush watershed was heavily burned (79%) by the Lionshead fire in the mid to upper watershed and, to a lesser extent, the Beachie Creek fire in the lower watershed (Table 2).
The Little North Santiam River flows into the North Santiam downstream and west of the Breitenbush River. Although the neighboring watersheds have moderate permeabilities, the Little North Santiam watershed has the lowest permeability among the burned watersheds (Table 1). Additionally, high concentrations of suspended sediment in the North Santiam River often originate from the Little North Santiam due to aquitard forming, clay-rich soils, which cause frequent mass movement events [57]. The geology is dominated by Oligocene and Miocene volcanics at the valley bottom and is capped by younger andesitic rocks of the Late High Cascade Volcanic event. This follows the same trend of less permeable geologies at low elevations and highly permeable geologies at high elevation. Annual precipitation averages 2235 mm, which is the highest of the study watersheds. The largest percentages of high severity burn class and burned area are found in the Little North Santiam River (Table 2).
In the northernmost portion of the area of interest, the upper Clackamas River (USGS site 14209500, Clackamas River above Three Lynx Creek) has a contributing area of 1266 km2 (Table 1). The geology of the Clackamas River watershed is consistent with the descriptions of other west-slope Cascade watersheds, containing proportional amounts of High Cascade and Western Cascade provinces. The contributing area was affected by the Riverside Fire, burning approximately 11.3% of the watershed. The watershed holds the lowest percentage of high soil burn severity class out of the six burned watersheds (Table 2).
The Molalla River has only one active stream gage near the town of Canby, OR (14200000) with an upstream area of 841 km2 (Table 1). Almost all of the headwaters of the Molalla River originate in less permeable Western Cascade terrain, and the low elevation areas are comprised of a mixture of course and fine-grained fluvial deposits from the Missoula Floods [59]. Most of the burned areas are found in the headwaters of the Molalla River (Table 2).
Two unburned watersheds were selected as controls to check the influence of climate on streamflow. The first control was the South Santiam River, which has a contributing area 451 km2 above the USGS streamgage (14185000) and flows into the Foster Reservoir near Sweet Home, OR. Approximately 5% of the watershed area is comprised of permeable geology, with the majority being Western Cascade terrain. Second, Thomas Creek was also unburned by the Labor Day Fires of 2020 and has the lowest mean elevation of all sites at 557 m. Thomas Creek has the lowest percentage of permeable geology and the lowest average soil permeability (Table 1).

2.4. Precipitation and Flow

Daily precipitation time-series from the PRISM Climate Group [60] were retrieved for watershed centroid coordinates using the PRISM R package [61]. PRISM time-series for single locations were preferred over precipitation observations due to the limited number and inconsistent distribution of meteorological stations in the study area. Daily and instantaneous discharge values were obtained from National Water Information System (NWIS) using the R package dataRetrieval [62].

2.5. Streamflow Metrics

At the event scale, two streamflow metrics were selected to capture potential changes to the rainfall-runoff pathways caused by varying spatial arrangements of patch size, aggregation, and fragmentation. The first was the event runoff ratio (Qr), which is the quotient of runoff depth to precipitation amount or the amount of precipitation that is transferred to the catchment outlet as stormflow. This metric was selected based on the findings of other studies, including [63], who found that runoff ratio increased most at the event scale compared with daily and monthly time steps. Some have found runoff coefficients to be most altered for individual events as opposed to longer time scales, noting that preceding soiling moisture influenced some storms [64].
A second runoff metric, event peak runoff ratio (Qp), was selected to account for the influence of antecedent soil moisture conditions on surface runoff. Several studies have used the metric for the long-term comparison of runoff ratios for annual peak flow events [65,66]. Here, it is adapted to any runoff event to aid intra-storm comparison without the compounding effects of antecedent soil conditions. In the context of individual storms, the event peak runoff ratio is defined as the net storm flow divided by the 3 day precipitation amount leading up to the peak flow event. Net storm flow is the difference between the peak-flow and minimum daily average discharge during the 3 day period. The peak runoff ratio is then normalized to the watershed area to aid comparison between catchments of different sizes. The benefit of this method is that soils can be considered for rainfall-runoff events, where runoff can be highly dependent on antecedent moisture conditions—an important factor in explaining non-linear streamflow response [66,67]. The event peak runoff ratio was included in the analysis because the metric can account for antecedent soil conditions preceding a precipitation event. Considering the influence of soil properties is an important part of any comparative watershed study, it was expected that this metric would be paramount for parsing fire effects from drought impacts.
It was hypothesized that Qr and Qp would increase most in watersheds with a greater coverage of high burn severity patches and show little to no change for the control watersheds. Because high burn severity patches can be associated with hydrophobic soil conditions, reduced rainfall interception, and increased hillslope connectivity, these areas can influence rainfall-runoff pathways, leading to a more efficient transfer of precipitation to the catchment outlet.

2.6. Landscape Metrics

The R package Landscape Metrics [68] was implemented to calculate landscape metrics for the Largest Patch Index (LPI), Clumpiness Index (CLUMPY), mean gyration (GYRATE), Contiguity Index (CONTIG), and Cohesion Index (COHESION). Metrics were selected out of the suite of shape metrics compiled by [31] that pertain to landscape aggregation, complexity, and density. Some caution during the selection of the landscape metrics was considered because landscape patterns do not always equate to landscape processes [42]. Thus, landscape metrics were carefully evaluated for their relevance to the hypothesis that the level of aggregation and continuity of severe burn patches explain some variability of post-fire streamflow response. Using this logic, CLUMPY was selected due to linear behavior when measuring class aggregation and complexity without problems of autocorrelation between class areas [69]. CLUMPY measures the proportion of like adjacencies that match a landscape with a random distribution. It ranges from −1 (fragmented) to 1 (aggregated), with 0 representing complete spatial randomness. The high burn severity class area was assessed using LPI, which has linear behavior to allow for simple interpretation. GYRATE was included because it can be considered a “shape” index and provides information about the elongation of a patch. Burned areas with higher levels of GYRATION would translate to large and elongated burn patches that could provide efficient runoff pathways. Small values of GYRATION would result in discontinuous burned patches, which would be more contained by other burn classes that could potentially buffer runoff. CONTIG measures the connectivity between classes from 0 (less connected) to 1 (highly connected) using a 9-by-9 moving window focal filter to determine the mean of a class belonging to that class. Finally, COHESION offers information about the dispersion of burn classes, with 0 being the most isolated and 100 being the most aggregated. It is important to note that landscape metrics applied are an attempt to represent the pattern and arrangement of burned patches and were not intended to quantify the hydrological connectivity of the burned area because the suite of metrics were not designed within a hydrologic context. Table 3 summarizes the values of the total burned area and the selected landscape metrics for the high severity patches in each burned watershed.

2.7. Comparison of Pre- and Post-Fire Streamflow Response

Often, land and water resource managers are concerned with the immediate response to wildfire, which is challenged by uncertainty in unique watershed attributes that produce variable responses to disturbance. To approach this problem, burn severity maps were quantified using landscape metrics to determine if there were differences in burned area characteristics between locations. Then, event-based runoff metrics were produced to determine if there was a significant difference between pre- and post-fire responses to precipitation events.
Post-fire runoff events were investigated for changes using hydrologic data obtained at the daily resolution for water year 2021. Pre-fire years were compared based on precipitation totals and drought indices, with the period of interest set as 2010 to 2020 to reduce influence from long-term climatic shifts. Extreme drought conditions during the 2021 water year challenged the selection of a similar pre-fire year. Ultimately, water year 2015 was selected as the most similar pre-fire year, receiving slightly greater precipitation totals in the Oregon Cascades.
The event scale was further investigated using fine-resolution hydrologic data for individual precipitation events following wildfire. Due to the well-defined seasonality of the Oregon Cascades, two distinct periods were investigated following wildfire disturbance. The early-wet season was defined as the first major rainfall-runoff event occurring from September through November—a period which is characterized as having low antecedent soil moisture conditions. The mid-wet season, from December through February, was typical as having high antecedent soil moisture conditions, making the occurrence of saturation excess runoff likely.

2.8. Hydrograph Separation

To detect the quickflow component from each storm event, the baseflow separation method by Lyne and Hollick was applied, using a low-pass numerical filtering that splits the hydrograph into multiple signals, analogous to the filtering of electronic frequencies [70]. This method has been adapted as an automated function in the EcoHydRology R package [71], which was used to derive baseflow and stormflow hydrograph components consistently between sites. Filter parameters were set to 0.925 for time-series having a daily interval [72] and increased to 0.98 for instantaneous time-series [73]. A recursive filter was applied forward, backward, and forward again, for a total of three passes.

2.9. Selection of Storm Events

Storm event delineation was performed using the Eventseq function from the HydroMad R package [74]. This function allows for multiple hyetograph and hydrograph time series to be utilized to set thresholds for the start and termination of rainfall-runoff events. Because of differing watershed characteristics and variable antecedent moisture conditions, the Eventseq function parameters were varied for each event. The event delineation results were verified using hyetograph plots to determine appropriate start and end times.
For determination of events using daily streamflow and precipitation data, the Eventseq function was set as follows:
  • Starting threshold was set to 7 mm of rainfall depth,
  • A minimum event gap of 1 day,
  • A minimum event duration of 2 days,
  • Ending threshold was varied between 2 mm and 4 mm of runoff depth depending on watershed area and remained below the threshold for at least 1 day.
To delineate events using instantaneous 15 minute streamflow and precipitation data, the Eventseq function was set as follows:
  • Starting threshold was set to 0.1 mm of rainfall depth,
  • A minimum gap of 6 hours,
  • A minimum duration of 6 hours,
  • The ending threshold was varied using precipitation or runoff depth for each event based on the visual inspection of the recession limb of the hydrograph.

2.10. GIS Analysis

The USGS StreamStats web tool [54] was used to investigate the catchment attributes of each candidate watershed to determine the relative similarities between watersheds. Before landscape metrics could be applied to the six burned watersheds, geospatial data were compiled in a GIS to determine the burned area falling within watershed boundaries and individual burn classes were isolated. The preprocessing of geospatial data was conducted in ArcGIS Pro version 2.8.0 (ESRI, 2021) and output for further landscape metric analysis. Watershed boundaries and streamgaging locations were obtained as shapefile and point feature classes from the USGS NHDplus v2.1 database and input into ArcGIS Pro. Then, soil burn severity maps were sourced from BAER Imagery Support and overlain in the GIS to determine the percentage of each burn severity class within the watersheds. These burn severity maps were downloaded in raster format but were converted to polygon feature classes to calculate the percentage coverage of each burn severity class within the watershed boundaries. Burn severity rasters were input into the R environment as simple features using the raster package [75]. Then, watershed area shapefiles were read using the sf package, which preserves the geospatial attributes of the features by considering both the vector geometry and spatial projection of each object. Finally, the burn severity rasters were cropped to the respective watershed area, and each burn severity class was isolated.

2.11. Statistical Analysis

Descriptive statistics were used to summarize the distribution of runoff coefficients between pre- and post-fire periods for the group of sites. Inferential statistics were used to test for differences between pre- and post-fire periods. All statistical computations and visualizations were created using R version 4.1.2 [76]. Specifically, box-whisker plots were created to characterize the distribution of runoff coefficients, identify outliers, and compare median values. Due to the small sample size, a non-parametric Mann–Whitney test for paired groups was used to evaluate statistical differences between distributions of runoff coefficients between pre- and post-fire years. Lastly, Spearman’s rank correlation was used to investigate the relationship between burn severity derived landscape metrics and change in runoff coefficients.

3. Results

3.1. Event Runoff Ratio (Qr)

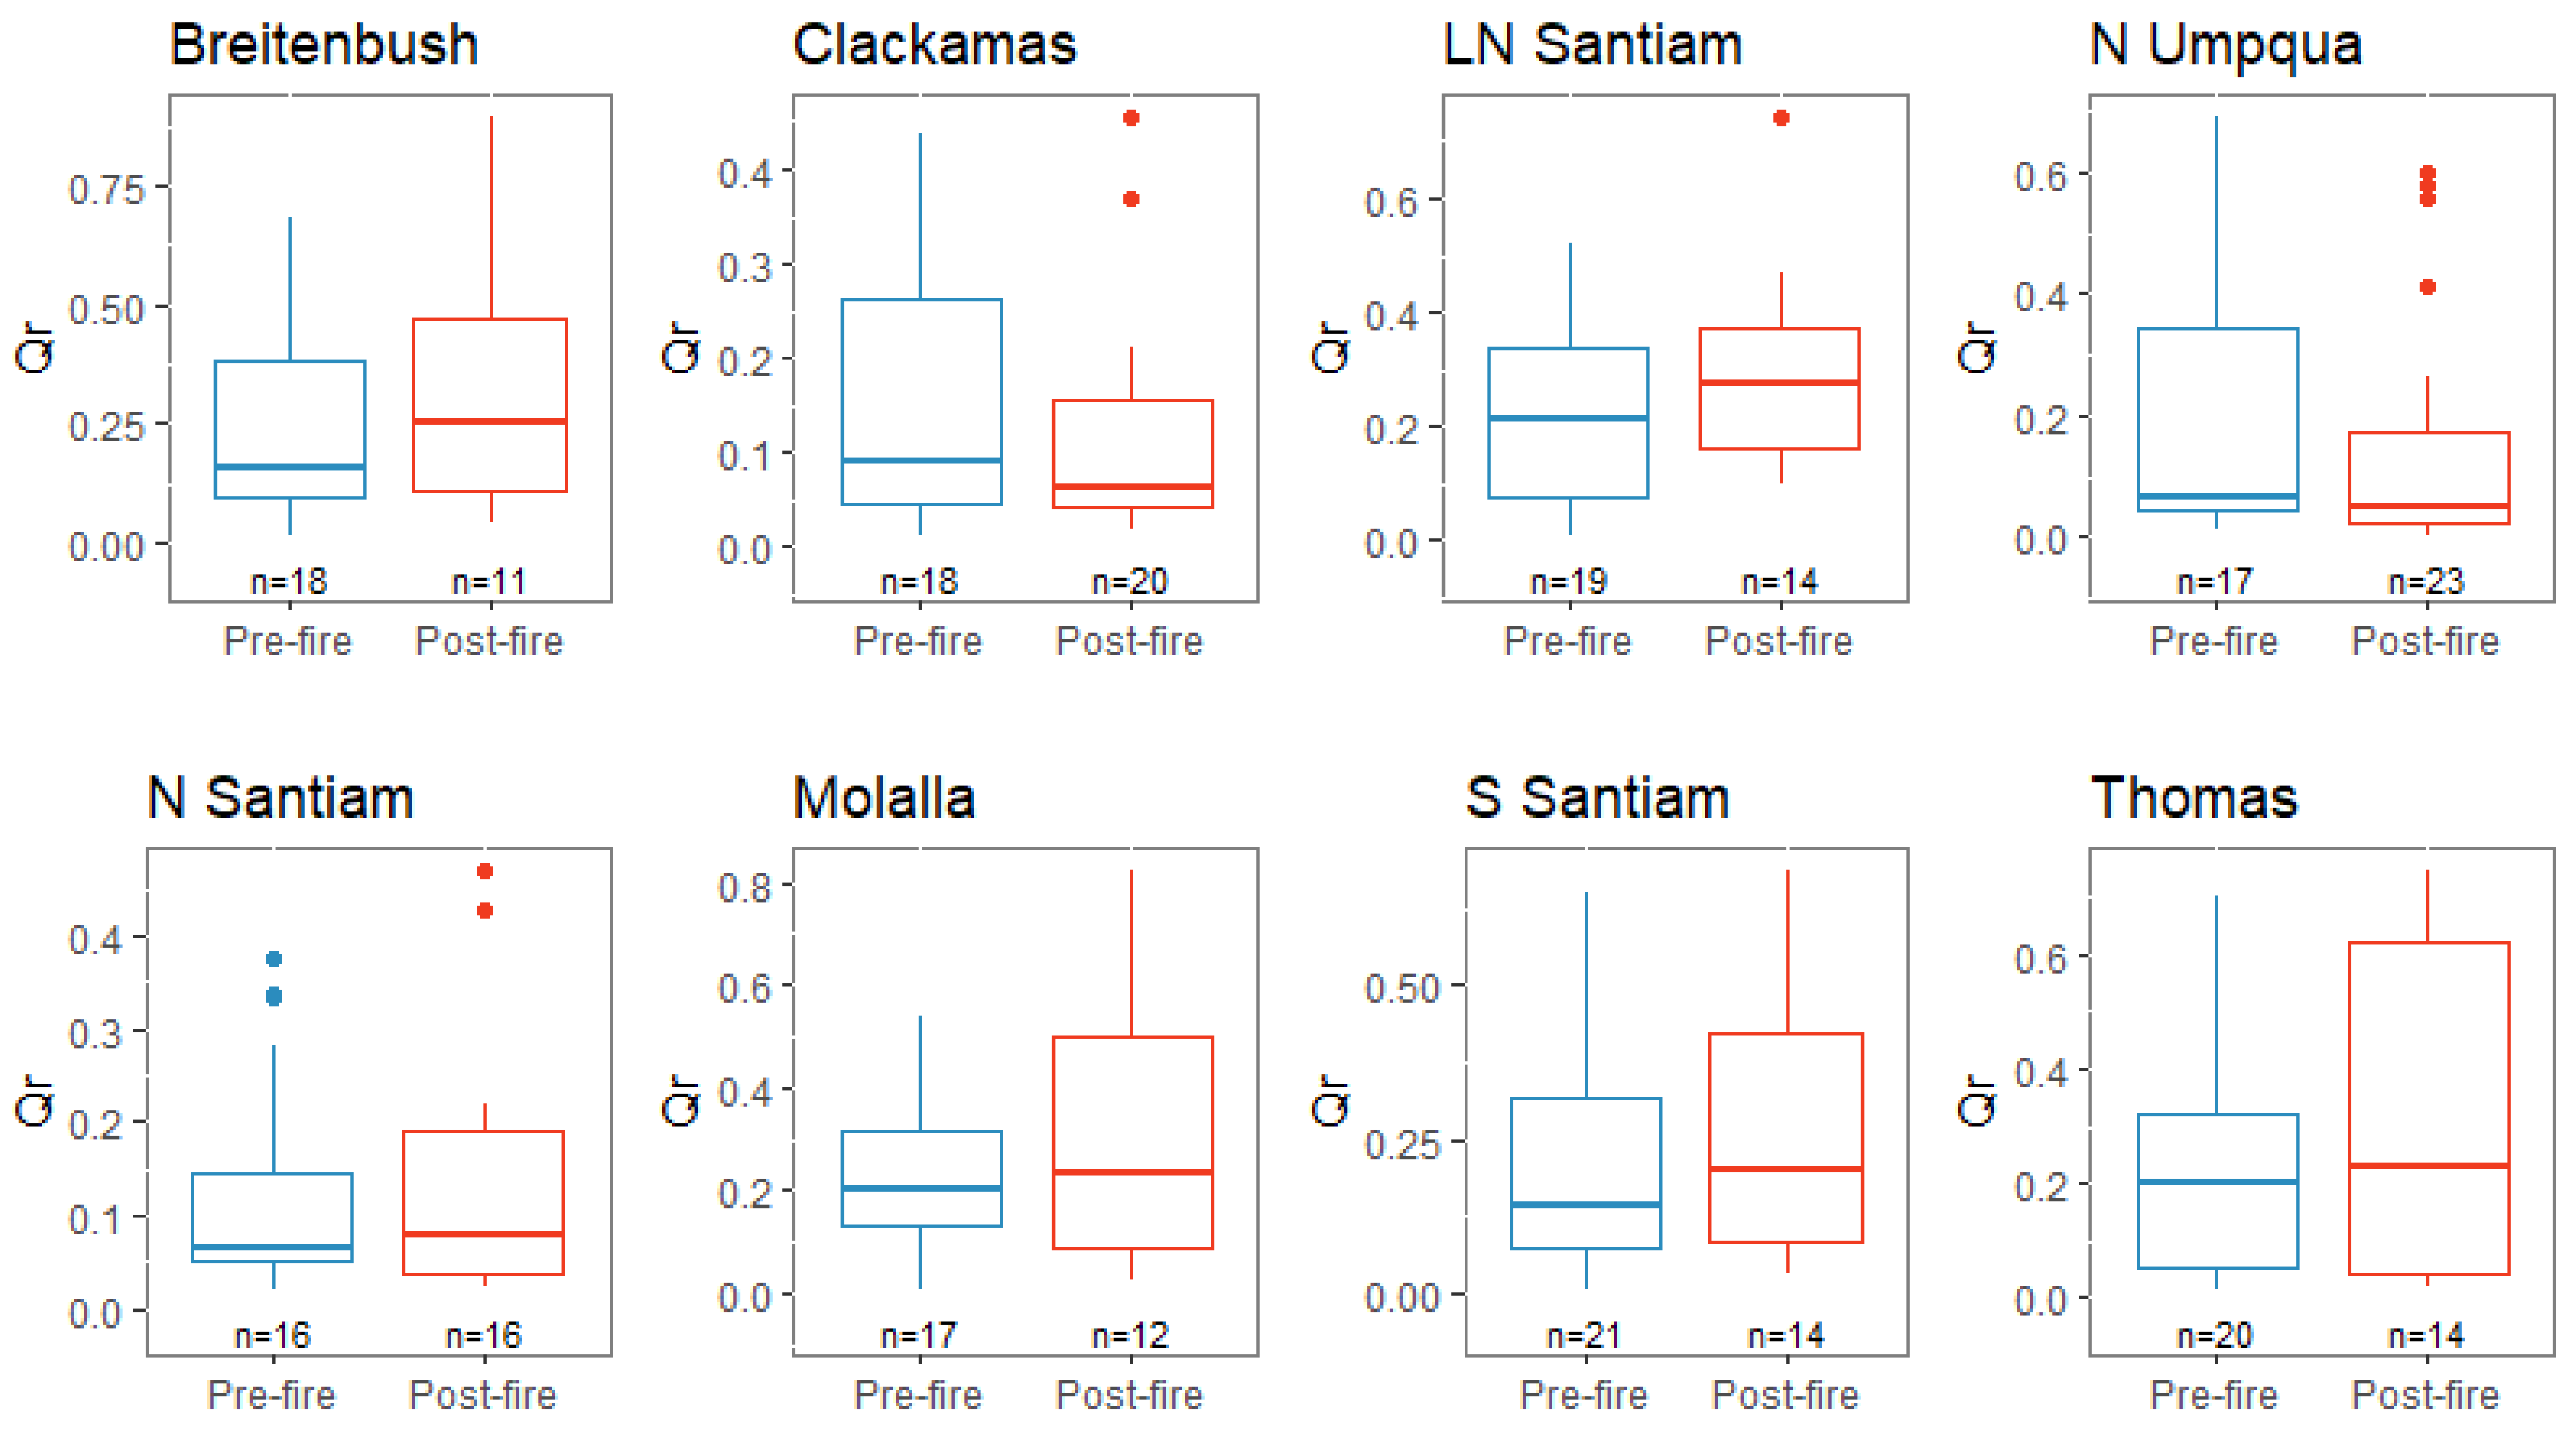
Results of the Mann–Whitney U test could not reject the null hypothesis that no difference existed between the median Qr values of the pre- and post-fire groups (Table 4). Although only minor shifts in median Qr were observed at burned sites, some showed slight increases in median Qr (Figure 4). Breitenbush River shows the largest post-fire increase in Qr of 0.09 while also having several outliers corresponding to wet season storm events (0.85 for 12 December 2020 event and 0.89 for 12 January 2021 event). Other sites having increases in Qr include Little North Santiam, with an increase of 0.07, and one outlier of 0.79 occurring during an event on 16 December 2020. The Molalla River saw a 0.04 increase in median Qr and an extreme value of 0.82 occurring during the post-fire period on 12 January 2021. Minimal change in Qr occurred in the North Santiam watershed, but several wet season post-fire events show elevated Qr over pre-fire response. The Clackamas River watershed shows a slight decrease in Qr values from pre-fire median Qr. Thomas Creek and South Santiam control watersheds show increases in Qr during the post-fire period. Both sites show highest Qr values occurring during wet season events, and outliers are less pronounced than in the burned watersheds. Percentage of area burned was significantly correlated to Qr (rs = 0.94, p = 0.005), and percentage of high severity class area was marginally correlated to Qr (rs = 0.77, p = 0.07). Computed landscape metrics did not show a relationship to changes in Qr.

3.2. Event Peak Runoff Ratio (Qp)

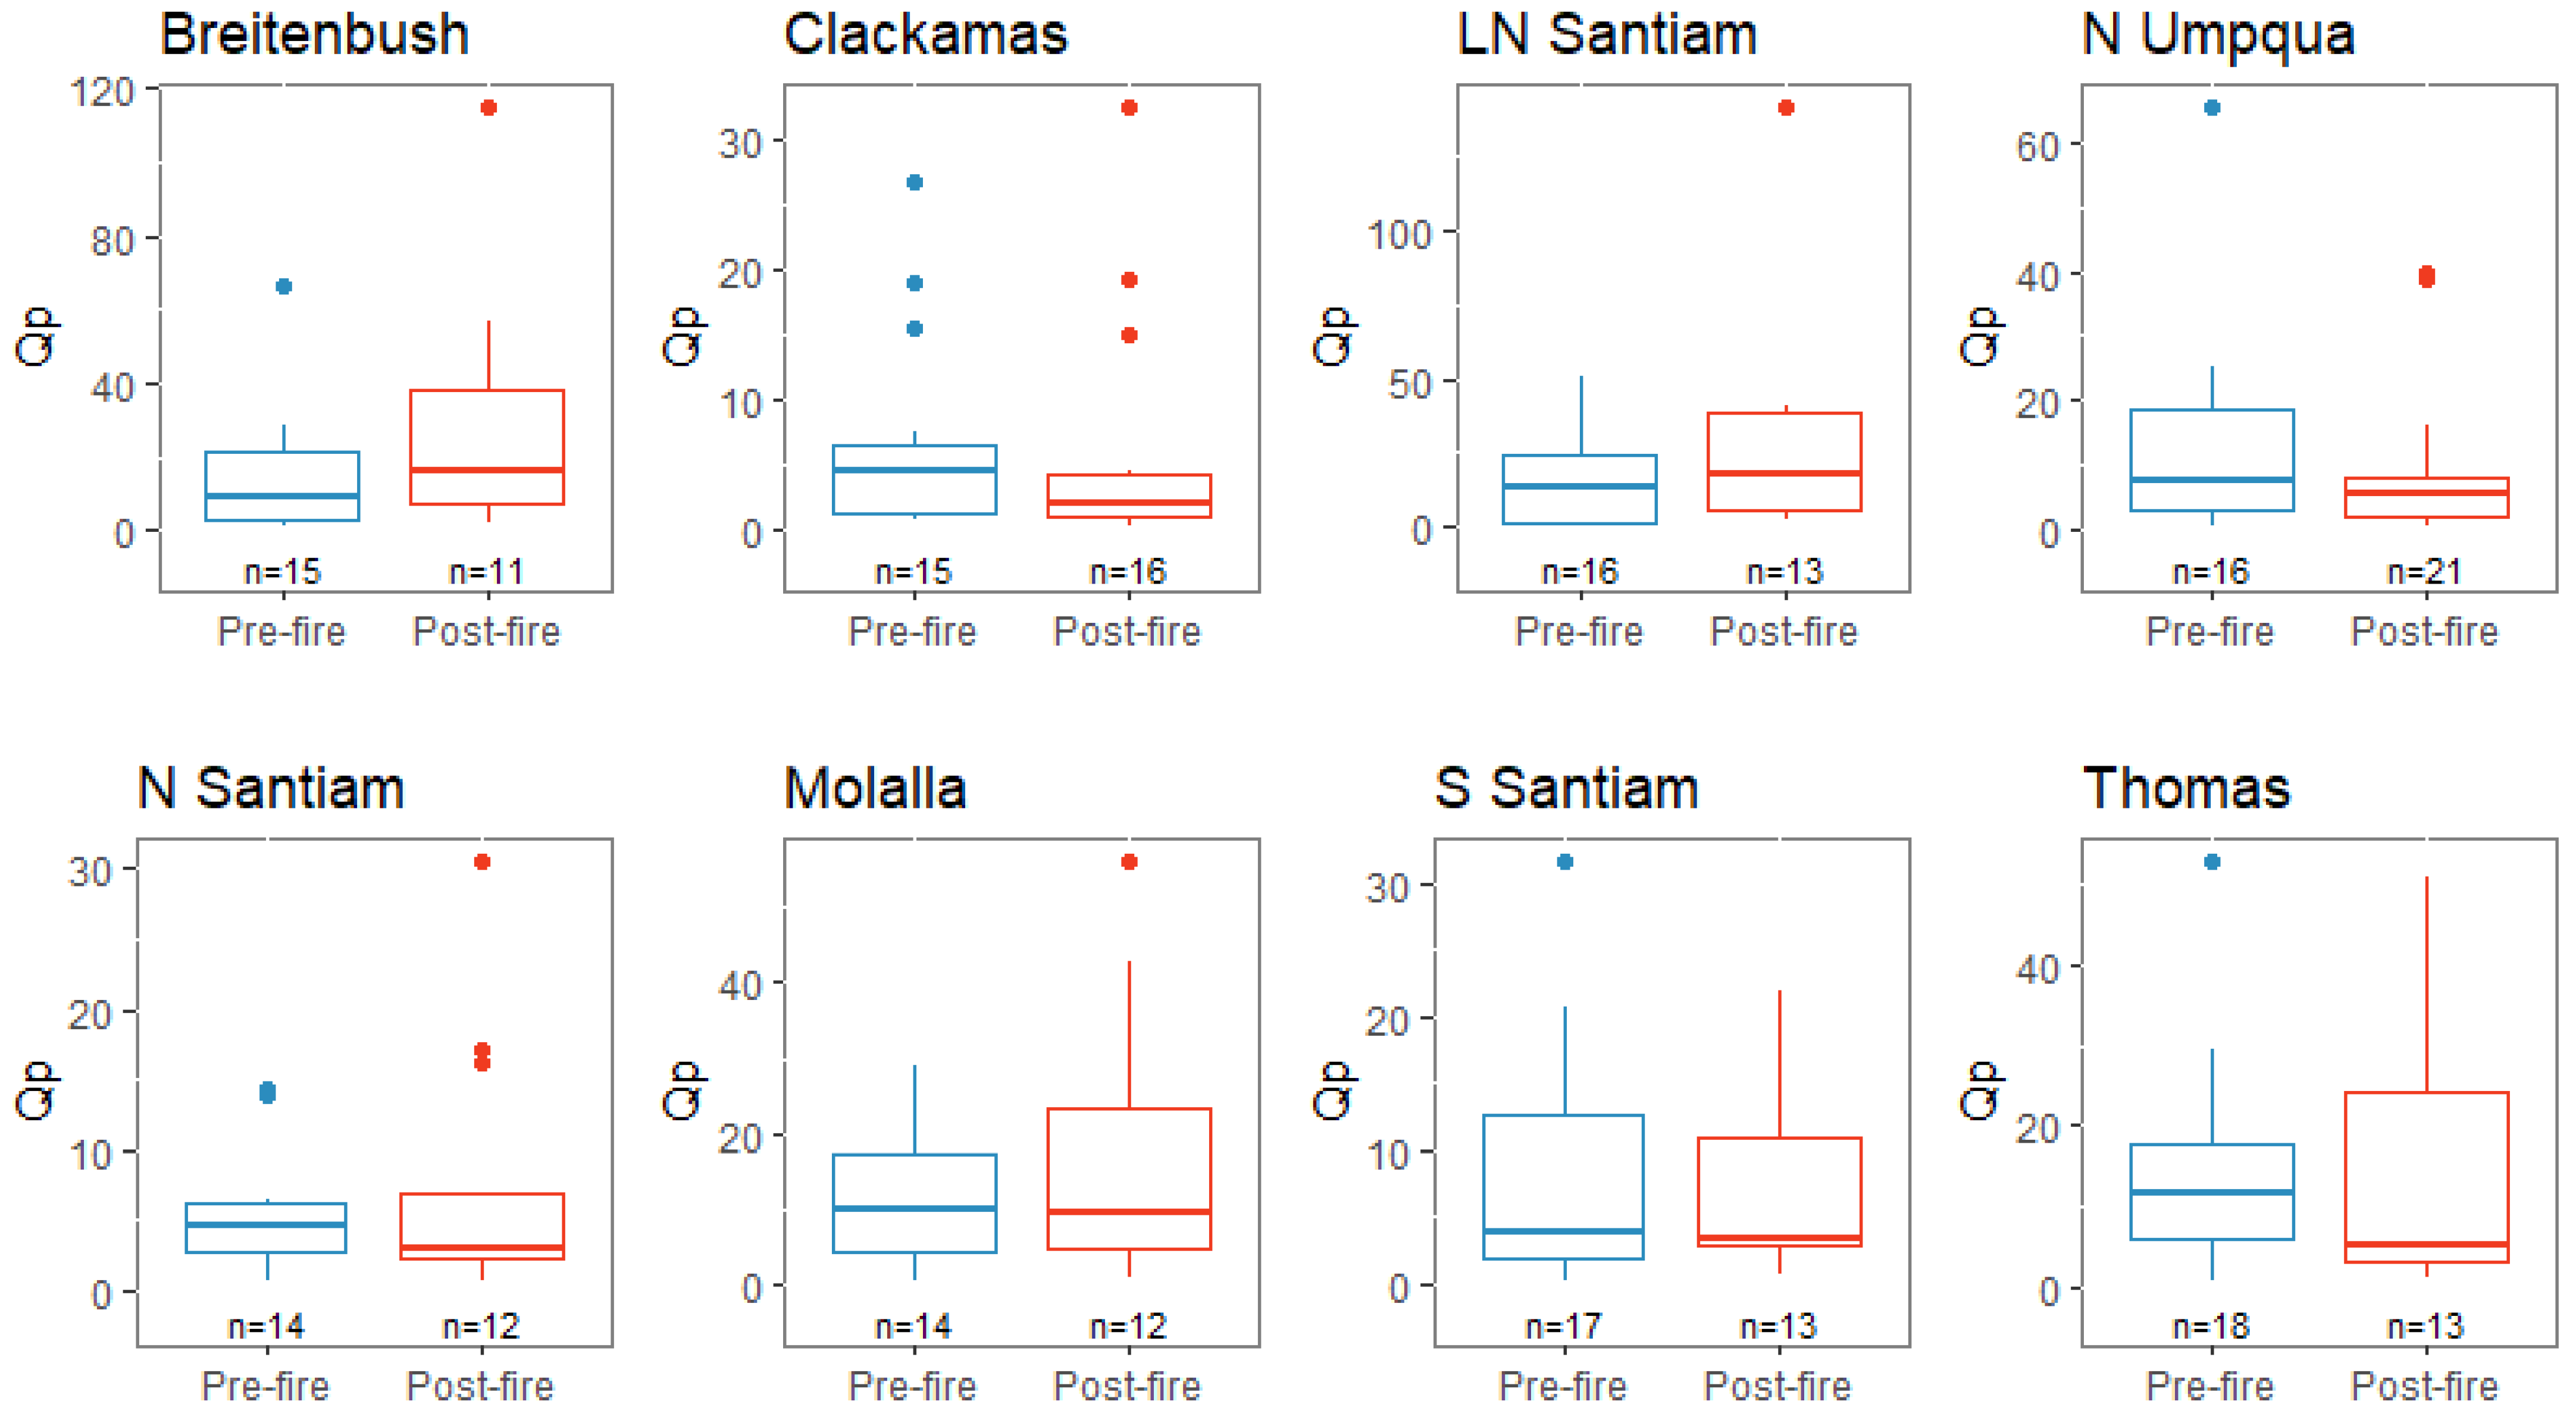
Like Qr, the null hypothesis of the Mann–Whitney u-test could not be rejected for burned and unburned watersheds, even at a 0.10 significance level (Table 5). The Qp median value was slightly less in the post-fire year than in pre-fire years for control sites (Thomas Creek and South Santiam) and in sites that had the least amount of burned area (North Santiam, North Umpqua, and Clackamas) (Figure 5). The largest change in median Qp values was found in the Breitenbush watershed (43% increase) and North Santiam watershed (33% increase). All other sites showed negative median change in Qp values, with the unburned Thomas Creek showing the largest decrease in median Qp (−55%) and Clackamas River having the largest decrease among burned sites (−60%), percentage area burned and Qp (rs = 0.89, p-value = 0.02), and percentage high burn severity and Qp (rs = 0.89, p-value = 0.02).

4. Discussion

4.1. Event Runoff Ratio (Qr)

Due to the short temporal scale of this study, runoff ratios at the event scale were chosen to compare one-year pre-fire and one-year post-fire. It was assumed that change would be most detectable at the event scale because runoff ratios have been shown to increase most for individual rainfall events over monthly and annual scales [63]. The comparison of median Qr and landscape metric values shows that sites with a greater burned area and greater area of high severity patches have a larger magnitude of change in Qr values (Table 2, Figure 4). As expected, the heavily burned Breitenbush and Little North Santiam watersheds show the greatest change in Qr. Both control watersheds have increased median Qr, with a decrease in the number of post-fire events (n = 14) from the pre-fire year (n = 21). Surprisingly, several of the burned watersheds show decreases in Qr values: Clackamas and North Umpqua. These two watersheds hold the largest contributing areas, and it is possible that undetermined precipitation thresholds were not reached to produce enhanced runoff [77,78]. In order to determine these thresholds, finer-resolution precipitation data are needed to determine the exact duration and intensities of precipitation events.
It is clear that the heavily burned Breitenbush and Little North Santiam watersheds show differences in runoff coefficients that are likely attributed to post-fire effects, but in those watersheds with less fire disturbance, the influence of disturbance is less certain. It is possible that the drought conditions coinciding with water year 2021 may attenuate the hydrologic response to wildfire by reducing the duration, intensity, and number of wet-season precipitation events [79]. The influence of climatic effects can be difficult to disentangle from watershed disturbance, and ongoing drought in the PNW might complicate runoff change detection. In addition, drought can decrease soil moisture by increasing evaporative demand, thereby encouraging infiltration and reducing runoff rates [80].

4.2. Event Peak Runoff Ratio (Qp)

The event peak runoff ratio, Qp, was included in the study to account for soil moisture conditions leading up to runoff events. In the case of water year 2021, antecedent soil conditions were likely variable due to a reduced number of high-intensity precipitation events, abnormal seasonal variability, and as many regions of the state experienced all-time positive temperature anomalies that increased evaporative demand, effectively lowering soil moisture [81]. For comparison, Oregon started the 2020 water year with no counties with drought, but conditions had shifted by the end of September 2020 to 34% of the state experiencing drought. By the end of water year 2021, 96% of Oregon was experiencing some form of drought [82]. The severe drought conditions in water year 2021 caused difficulties in selecting a comparable reference water year. This method assumes that climatic variability between pre- and post-fire years can be controlled for by selecting a pre-fire year with similar levels of drought. Because of distinct differences between climatic zones east and west of the Cascade Range, drought indices were examined for the North Santiam watershed, which is centrally located in the study area (Figure 1). Water year 2015 was the most comparable year to 2021 based on the percentage area of the North Santiam watershed in U.S. drought monitoring categories [83]. Differences in the percentage of drought levels can be observed between the two years: drought in water year 2015 progressively worsened from abnormally dry winter conditions to moderate and severe drought during the spring and summer months and finally developing into extreme drought near the end of the year. Post-fire water year 2021 began under extreme drought conditions but improved with normal levels of winter precipitation before progressing into extreme drought for much of the summer (Figure 6).
Drought conditions likely dulled post-fire runoff effects across the study area, although alterations to runoff were still detected in the highly burned Breitenbush and Little North Santiam watersheds. One surprising finding was that the low elevation control site, Thomas Creek, had the greatest decrease in Qp. A possible explanation for this inconsistency was that high valley temperatures might have driven large vapor pressure deficits, thereby increasing transpiration and further lowering soil moisture conditions.
Although the pre- and post-fire periods do not show different median values, the largest changes in Qp values occurred in the sites with the greatest percentage of burn area and the greatest percentage of high burn area (Breitenbush and Little North Santiam). The median Qp value in the Mollala watershed remained unchanged, despite a widening of the distribution. The most notable difference is the decrease in Qp values for watersheds with less percentage burned including Clackamas, North Umpqua, and North Santiam. Both control watersheds (South Santiam and Thomas Creek) also displayed decreases in median Qp. Generally, these less burned watersheds had tighter distributions except for several large outliers. These results agree with other studies in the WCONUS that found consistent negative streamflow response in post-fire year one of eastern California, western Nevada, and western Oregon watersheds [84]. They interpret these results as indicating that burned watersheds in these areas are likely show small to non-existent streamflow responses. Additional findings of regional post-fire research support the lack of runoff response observed in the present study. Runoff response is more likely in Mediterranean and semi-arid watersheds, while high elevation, snow-driven watersheds such as the Cascades and Rocky Mountains are less vulnerable to increases in runoff response [85].

4.3. Landscape Metrics

The six landscape metrics selected to represent patch density, elongation, and aggregation (Table 3) did not show correlations with percentage change in either runoff metric. Intuitively, burned area and high severity area were colinear (rs = 0.83, Figure 7). In addition, multicollinearity was present between landscape metrics, suggesting that the selected aggregation metrics were not independent and measured similar patch characteristics.
These findings are consistent with several post-fire studies that find percentage area burned to be significant in describing changes to hydrologic response [84,86]. Most applicable to this study, an investigation into the influence of percentage area burned, vegetation recovery, and soil conditions in southern and central California shows that regional streamflow increases among watersheds with percentages burned above 20% and are most pronounced in wet years [87].
Several explanations exist for the lack of correlation between landscape metrics and runoff ratios. Although landscape metrics have been applied in watershed hydrology before, they were first developed to aid ecological studies of structural connectivity. They might fail to represent basic mechanics of the functional connectivity that govern runoff pathways. Some have attempted to quantify patch-based processes by integrating ecological and process-based connectivity metrics with node-based theory [88], which bypasses numeric descriptions of aggregation and could more realistically represent the directional connectivity present in a burned watershed. Second, processes that influence runoff generation may be present at different scales than what can be described with burned patch landscape metrics. Studies into the patchiness of hydrophobic soils have found evidence for small-scale hydrologic connectivity in shrub-dominated burned areas [29]. The spatial variability of burned forest soils may display discontinuous areas of hydrophobicity, ash, and macro pores, likely complicating the quantification of hydrologic connectivity across broad catchments. The current study sought to increase the spatial scale of investigation to the catchment scale and assumes that high severity burn classes can accurately represent conditions that allow for increased runoff magnitude.

4.4. Limitations

The lack of significant change to post-fire runoff coefficients could be affected by several aspects of the study design as well as uncertainties in the data used in the study. While water years 2015 and 2021 were closely matched according to their above-normal temperature and precipitation totals, the timing and type of precipitation were different. In 2015, the state of Oregon experienced record low snowpack despite precipitation totals staying close to normal [89]. The shift from winter snow accumulation to rain, as observed in 2015, is considered the result of climate warming trends, as opposed to climate variability [90]. In contrast, water year 2021 had normal snowpack, but exceptionally dry spring conditions led to extremely low soil moisture conditions across much of Oregon, which progressed into the warmest summer on record [81].
Precipitation data used in calculating event-based runoff coefficients contain uncertainty due to the lack of precipitation observations across the study region. The 4 km resolution gridded PRISM daily time series do not include a measure of uncertainty, but it is assumed that increased error of modeled values would be associated with greater distance from locations of observed precipitation. Another source of precipitation uncertainty is the relatively coarse temporal resolution of the time-series, which limit precise delineation of storm events.
While differences between watershed characteristics were observed (Table 1), such differences were not directly accounted for between watersheds. Specifically, the watersheds have widely ranging permeability values (Table 1), dependent on unique combinations of geology and soils. Given that watersheds in the High Cascades (i.e., Clackamas and North Santiam) have buffering capacity due to groundwater input, post-fire stream response might have been delayed or have not been detected yet. Additionally, the size and location of burned areas, slope, and aspect are not consistent between watersheds, potentially challenging the comparability of post-fire runoff values.
Finally, this study assumes that all watersheds have similar pre-fire land management histories and that the post-fire response was consistent. Depending on land ownership, post-fire salvage logging likely influenced these watersheds as private, federal, and state land managers had operations began immediately after the 2020 fire season due to categorical exclusions to permitting processes [91]. Additional post-fire investigations should consider varying land management practices across these watersheds.

5. Conclusions

Event runoff ratios were computed for Oregon watersheds burned by the Labor Day Fires of 2020 to determine if post-fire runoff response was altered, whether the spatial arrangement of burn patterns was related to alterations, and at what temporal resolution the disturbance was most evident. Linking changes to burn severity patterns was difficult due to the non-significantly different runoff coefficient distributions, but climatic trends could play a role in concealing post-fire runoff characteristics. The role of drought on post-fire runoff dynamics was evident in the two control watersheds that both had declining Qp. This finding suggests that the magnitude of runoff responses could have been larger in burned watersheds had the runoff enabling effect of reduced canopy interception on throughfall been dominant over evapotranspiration driven by high summer temperatures. Breitenbush and Little North Santiam watersheds, two of the most burned watersheds, had the most positive change in runoff coefficients. It is assumed that fire-inflicted disturbances were widespread enough to overtake the influence of increasing temperature trends.
Plot and small catchment scale studies [24,26,29,37] have indicated that the burned patch arrangement is important for determining the degree to which rainfall events are intercepted, allowed to infiltrate, or find efficient surface pathways. This study aimed to build upon these findings by increasing the spatial scale at which burned patchiness might influence watershed hydrology. However, the aforementioned issues of drought-induced soil conditions limit such conclusions. Another limitation is that the selected landscape metrics used in this study were not developed within a hydrologic framework and may misrepresent the complex sequences of patches found in burned watersheds. Future work will include the creation of burned watershed patch metrics that account for directional, functional connectivity within a hydrologic framework. This work could be used to further understand the complexity of watershed response to wildfire, including null responses, and to build regional knowledge of the Oregon Cascades, which will likely continue to be threatened by accelerating fire occurrence.

Author Contributions

Conceptualization, W.B.L. and H.C.; methodology, W.B.L. and H.C.; software, W.B.L.; validation, W.B.L. and H.C.; formal analysis, W.B.L.; investigation, W.B.L.; data curation, W.B.L.; writing—original draft preparation, W.B.L.; writing—review and editing, W.B.L. and H.C.; visualization, W.B.L.; supervision, H.C. All authors have read and agreed to the published version of the manuscript.

Funding

This research received no external funding.

Data Availability Statement

The data presented in this study are available upon request from the corresponding author.

Acknowledgments

We thank the USGS–PSU Partnership (UPP) which made this research possible through tuition support provided to the lead author (W.L.).

Conflicts of Interest

The authors declare no conflict of interest.

References

  1. Furniss, M.J.; Staab, B.P.; Hazelhurst, S.; Clifton, C.F.; Roby, K.B.; Ilhadrt, B.L.; Todd, A.H.; Reid, L.M.; Hines, S.J.; Bennett, K.A.; et al. Water, Climate Change, and Forests: Watershed Stewardship for a Changing Climate; General Technical Report PNW-GTR-812; Department of Agriculture, Forest Service, Pacific Northwest Research Station: Portland, OR, USA, 2010; 75p. [Google Scholar] [CrossRef]
  2. Neary, D.G.; Gottfried, G.J.; DeBano, L.F.; Tecle, A. Impacts of Fire on Watershed Resources. J. Ariz. Nev. Acad. Sci. 2003, 35, 23–41. [Google Scholar]
  3. Hallema, D.; Sun, G.; Caldwell, P.; Robinne, F.-N.; Bladon, K.D.; Norman, S.; Liu, Y.; Cohen, E.C.; McNulty, S. Wildland Fire Impacts on Water Yield across the Contiguous United States; General Technical Report SRS-238; Department of Agriculture Forest Service, Southern Research Station: Asheville, NC, USA, 2019; pp. 1–118. [Google Scholar] [CrossRef]
  4. Rust, A.J.; Hogue, T.S.; Saxe, S.; McCray, J. Post-fire water-quality response in the western United States. Int. J. Wildland Fire 2018, 27, 203–216. [Google Scholar] [CrossRef]
  5. Chen, J.; Chang, H. A Review of Wildfire Impacts on Stream Temperature and Turbidity across Scales. Prog. Phys. Geogr. 2022. [Google Scholar] [CrossRef]
  6. Moody, J.A.; Martin, D.A. Post-fire, rainfall intensity-peak discharge relations for three mountainous watersheds in the western USA. Hydrol. Process. 2001, 15, 13. [Google Scholar] [CrossRef]
  7. Eidenshink, J.; Schwind, B.; Brewer, K.; Zhu, Z.-L.; Quayle, B.; Howard, S. A Project for Monitoring Trends in Burn Severity. Fire Ecol. 2007, 3, 3–21. [Google Scholar] [CrossRef]
  8. Keeley, J.E. Fire intensity, fire severity and burn severity: A brief review and suggested usage. Int. J. Wildland Fire 2009, 18, 116–126. [Google Scholar] [CrossRef]
  9. Scott, D.F.; Versfeld, D.B.; Lesch, W. Erosion and sediment yield in relation to afforestation and fire in the mountains of the western cape province, South Africa. S. Afr. Geogr. J. 1998, 80, 52–59. [Google Scholar] [CrossRef]
  10. Robichaud, P. Fire effects on infiltration rates after prescribed fire in Northern Rocky Mountain forests, USA. J. Hydrol. 2000, 231–232, 220–229. [Google Scholar] [CrossRef]
  11. Moody, J.A.; Shakesby, R.A.; Robichaud, P.R.; Cannon, S.H.; Martin, D.A. Current research issues related to post-wildfire runoff and erosion processes. Earth-Sci. Rev. 2013, 122, 10–37. [Google Scholar] [CrossRef]
  12. Mataix-Solera, J.; Cerdà, A.; Arcenegui, V.; Jordán, A.; Zavala, L.M. Fire effects on soil aggregation: A review. Earth Sci. Rev. 2011, 109, 44–60. [Google Scholar] [CrossRef]
  13. Certini, G. Effects of fire on properties of forest soils: A review. Oecologia 2005, 143, 1–10. [Google Scholar] [CrossRef]
  14. Huffman, E.L.; MacDonald, L.H.; Stednick, J.D. Strength and persistence of fire-induced soil hydrophobicity under ponderosa and lodgepole pine, Colorado Front Range. Hydrol. Process. 2001, 15, 2877–2892. [Google Scholar] [CrossRef]
  15. Doerr, S.H.; Shakesby, R.A.; Walsh, R.P. Spatial variability of soil hydrophobicity in fire-prone eucalyptus and pine forests, Portugal. Soil Sci. 1998, 163, 313–324. [Google Scholar] [CrossRef]
  16. Cocke, A.E.; Fulé, P.Z.; Crouse, J.E. Comparison of burn severity assessments using Differenced Normalized Burn Ratio and ground data. Int. J. Wildland Fire 2005, 14, 189–198. [Google Scholar] [CrossRef]
  17. Picotte, J.J.; Bhattarai, K.; Howard, D.; Lecker, J.; Epting, J.; Quayle, B.; Benson, N.; Nelson, K. Changes to the Monitoring Trends in Burn Severity program mapping production procedures and data products. Fire Ecol. 2020, 16, 16. [Google Scholar] [CrossRef]
  18. Shakesby, R.A.; Doerr, S.H. Wildfire as a Hydrological and Geomorphological Agent. Earth Sci. Rev. 2006, 74, 269–307. [Google Scholar] [CrossRef]
  19. Kinoshita, A.M.; Hogue, T.S. Spatial and temporal controls on post-fire hydrologic recovery in Southern California watersheds. Fuel Energy Abstr. 2011, 87, 240–252. [Google Scholar] [CrossRef]
  20. Bart, R.R.; Tague, C.L. The impact of wildfire on baseflow recession rates in California. Hydrol. Process. 2017, 31, 1662–1673. [Google Scholar] [CrossRef]
  21. Westerling, A.L.; Hidalgo, H.G.; Cayan, D.R.; Swetnam, T.W. Warming and Earlier Spring Increase Western U.S. Forest Wildfire Activity. Science 2006, 313, 940–943. [Google Scholar] [CrossRef] [Green Version]
  22. Holden, Z.A.; Luce, C.H.; Crimmins, M.A.; Morgan, P. Wildfire extent and severity correlated with annual streamflow distribution and timing in the Pacific Northwest, USA (1984–2005). Ecohydrology 2011, 5, 677–684. [Google Scholar] [CrossRef]
  23. Moody, J.A.; Martin, D.A.; Haire, S.L.; Kinner, D.A. Linking runoff response to burn severity after a wildfire. Hydrol. Process. 2007, 22, 2063–2074. [Google Scholar] [CrossRef]
  24. Ortíz-Rodríguez, A.J.; Muñoz-Robles, C.; Borselli, L. Changes in connectivity and hydrological efficiency following wildland fires in Sierra Madre Oriental, Mexico. Sci. Total Environ. 2018, 655, 112–128. [Google Scholar] [CrossRef]
  25. Kutiel, P.; Lavee, H.; Segev, M.; Benyamini, Y. The effect of fire-induced surface heterogeneity on rainfall-runoff-erosion relationships in an eastern Mediterranean ecosystem, Israel. CATENA 1995, 25, 77–87. [Google Scholar] [CrossRef]
  26. Cawson, J.G.; Sheridan, G.J.; Smith, H.G.; Lane, P.N.J. Effects of fire severity and burn patchiness on hillslope-scale surface runoff, erosion and hydrologic connectivity in a prescribed burn. For. Ecol. Manag. 2013, 310, 219–233. [Google Scholar] [CrossRef]
  27. Bélisle, M. Measuring Landscape Connectivity: The Challenge of Behavioral Landscape Ecology. Ecology 2005, 86, 1988–1995. [Google Scholar] [CrossRef]
  28. Ebel, B.A.; Mirus, B.B. Disturbance Hydrology: Challenges and Opportunities. Hydrol. Process. 2014, 28, 5140–5148. [Google Scholar] [CrossRef]
  29. Williams, C.J.; Pierson, F.B.; Robichaud, P.R.; Al-Hamdan, O.Z.; Boll, J.; Strand, E.K. Structural and functional connectivity as a driver of hillslope erosion following disturbance. Int. J. Wildland Fire 2016, 25, 306. [Google Scholar] [CrossRef]
  30. Singh, V.P. Effect of spatial and temporal variability in rainfall and watershed characteristics on stream flow hydrograph. Hydrol. Process. 1997, 11, 1649–1669. [Google Scholar] [CrossRef]
  31. McGarigal, K. Landscape Pattern Metrics. In Wiley StatsRef: Statistics Reference Online; John Wiley & Sons, Ltd.: Hoboken, NJ, USA, 2014; ISBN 978-1-118-44511-2. [Google Scholar]
  32. Riitters, K.H.; O’Neill, R.V.; Hunsaker, C.T.; Wickham, J.D.; Yankee, D.H.; Timmins, S.P.; Jones, K.B.; Jackson, B.L. A factor analysis of landscape pattern and structure metrics. Landsc. Ecol. 1995, 10, 23–39. [Google Scholar] [CrossRef]
  33. Lee, S.-W.; Lee, M.-B.; Lee, Y.-G.; Won, M.-S.; Kim, J.-J.; Hong, S.-K. Relationship between landscape structure and burn severity at the landscape and class levels in Samchuck, South Korea. For. Ecol. Manag. 2009, 258, 1594–1604. [Google Scholar] [CrossRef]
  34. Lloret, F.; Calvo, E.; Pons, X.; Díaz-Delgado, R. Wildfires and landscape patterns in the Eastern Iberian Peninsula. Landsc. Ecol. 2002, 17, 745–759. [Google Scholar] [CrossRef]
  35. Tran, B.N.; Tanase, M.A.; Bennett, L.T.; Aponte, C. High-severity wildfires in temperate Australian forests have increased in extent and aggregation in recent decades. PLoS ONE 2020, 15, e0242484. [Google Scholar] [CrossRef]
  36. Woods, S.W.; Birkas, A.; Ahl, R. Spatial variability of soil hydrophobicity after wildfires in Montana and Colorado. Geomorphology 2007, 86, 465–479. [Google Scholar] [CrossRef]
  37. Boer, M.; Puigdefábregas, J. Effects of spatially structured vegetation patterns on hillslope erosion in a semiarid Mediterranean environment: A simulation study. Earth Surf. Process. Landf. 2005, 30, 149–167. [Google Scholar] [CrossRef]
  38. Telfer, L. Exploring Hydrologic Responses to Different Wildfire Spatial Patterns Through the Lens of Computational Modeling. Master’s Thesis, Boise State University, Boise, ID, USA. December 2021. [CrossRef]
  39. McMahon, G.; Bales, J.D.; Coles, J.F.; Giddings, E.M.P.; Zappia, H. Use of stage data to characterize hydrologic conditions in an urbanizing environment. JAWRA J. Am. Water Resour. Assoc. 2003, 39, 15291546. [Google Scholar] [CrossRef]
  40. Zhou, T.; Wu, J.; Peng, S. Assessing the effects of landscape pattern on river water quality at multiple scales: A case study of the Dongjiang River watershed, China. Ecol. Indic. 2012, 23, 166–175. [Google Scholar] [CrossRef]
  41. Chang, H.; Makido, Y.; Foster, E. Effects of land use change, wetland fragmentation, and best management practices on total suspended solids concentrations in an urbanizing Oregon watershed, USA. J. Environ. Manag. 2021, 282, 111962. [Google Scholar] [CrossRef]
  42. Van Nieuwenhuyse, B.H.J.; Antoine, M.; Wyseure, G.; Govers, G. Pattern-process relationships in surface hydrology: Hydrological connectivity expressed in landscape metrics. Hydrol. Process. 2011, 25, 3760–3773. [Google Scholar] [CrossRef]
  43. Li, H.; Wu, J. Use and misuse of landscape indices. Landsc. Ecol. 2004, 19, 389–399. [Google Scholar] [CrossRef]
  44. Higuera, P.E.; Abatzoglou, J.T. Record-setting climate enabled the extraordinary 2020 fire season in the western United States. Glob. Chang. Biol. 2021, 27, 1–2. [Google Scholar] [CrossRef]
  45. Oregon Office of Emergency Management 2020 Oregon Wildfire Spotlight. Available online: https://storymaps.arcgis.com/stories/6e1e42989d1b4beb809223d5430a3750 (accessed on 20 December 2021).
  46. Morris, W.G. Forest Fires in Western Oregon and Western Washington. Or. Hist. Q. 1934, 35, 313–339. [Google Scholar]
  47. Tague, C.; Grant, G.E. A Geological Framework for Interpreting the Low-Flow Regimes of Cascade Streams, Willamette River Basin, Oregon. Water Resour. Res. 2004, 40, W04303. [Google Scholar] [CrossRef]
  48. Wallick, J.R.; O’Connor, J.E.; Anderson, S.; Keith, M.K.; Cannon, C.; Risley, J.C. Channel Change and Bed-Material Transport in the Umpqua River Basin, Oregon; Scientific Investigations Report; U.S. Geological Survey: Reston, VA, USA, 2011; Volume 5041, p. 124. [Google Scholar]
  49. Schruben, P.G.; Arndt, R.E.; Bawiec, W.J. Geology of the Conterminous United States at 1:125,000 Scale—A Digital Representation of the 1974 P.B. King and H.M. Beikman Map. Available online: https://pubs.usgs.gov/dds/dds11/ (accessed on 17 February 2022).
  50. Soil Survey Staff, Natural Resources Conservation Service, United States Department of Agriculture. Web Soil Survey. Available online: https://websoilsurvey.nrcs.usda.gov/ (accessed on 2 February 2022).
  51. Gannett, M.W. (Ed.) Ground-Water Hydrology of the Upper Klamath Basin, Oregon and California; Scientific Investigations Report; Geological Survey (U.S.): Portland, OR, USA; U.S. Department of the Interior: Washington, DC, USA; U.S. Geological Survey: Reston, VA, USA, 2007. [Google Scholar]
  52. Jefferson, A.; Grant, G.E.; Lewis, S.L.; Lancaster, S.T. Coevolution of Hydrology and Topography on a Basalt Landscape in the Oregon Cascade Range, USA. Earth Surf. Process. Landf. 2010, 35, 803–816. [Google Scholar] [CrossRef]
  53. Chang, H.; Jung, I.-W. Spatial and temporal changes in runoff caused by climate change in a complex large river basin in Oregon. J. Hydrol. 2010, 388, 186–207. [Google Scholar] [CrossRef]
  54. Parsons, A.; Robichaud, P.; Lewis, S.; Napper, C. Field Guide for Mapping Post-Fire Soil Burn Severity; General Technical Report RMRS-GTR-243; U.S. Department of Agriculture, Forest Service, Rocky Mountain Research Station: Collins, CO, USA, 2010; Volume 243, 49p. [Google Scholar]
  55. Ries, K.G., III; Newson, J.K.; Smith, M.J.; Guthrie, J.D.; Steeves, P.A.; Haluska, T.; Kolb, K.; Thompson, R.F.; Santoro, R.D.; Vraga, H.W. StreamStats, Version 4; Fact Sheet; U.S. Geological Survey: Reston, VA, USA, 2017; Volume 3046. [Google Scholar]
  56. Robbins, W.G. Oregon and Climate Change: The Age of Megafires in the American West. Or. Hist. Q. 2021, 122, 250–277. [Google Scholar] [CrossRef]
  57. Sobieszczyk, S. Using Turbidity Monitoring and LiDAR-Derived Imagery to Investigate Sources of Suspended Sediment in the Little North Santiam River Basin, Oregon, Winter 2009–2010. Master’s Thesis, Portland State University, Portland, OR, USA, 2010. [Google Scholar] [CrossRef]
  58. White, C. Geology of the Breitenbush Hot Springs Quadrangle, Oregon; Department of Geology and Mineral Industries: Portland, OR, USA, 1980. [Google Scholar]
  59. O’Connor, J.E.; Sarna-Wojcicki, A.; Wozniak, K.C.; Polette, D.J.; Fleck, R.J. Origin, Extent, and Thickness of Quaternary Geologic Units in the Willamette Valley, Oregon; US Geological Survey Professional Paper; U.S. Geological Survey: Portland, OR, USA, 2001; pp. 1–40. [Google Scholar]
  60. PRISM Climate Group, Oregon State University. Available online: https://prism.oregonstate.edu/ (accessed on 12 January 2022).
  61. Hart, E.; Bell, K. Prism: Access Data from The Oregon State Prism Climate Project 2015. Available online: https://zenodo.org/record/33663 (accessed on 27 July 2022).
  62. Hirsch, R.M.; De Cicco, L.A. User Guide to Exploration and Graphics for RivEr Trends (EGRET) and DataRetrieval: R Packages for Hydrologic Data; Techniques and Methods; U.S. Geological Survey: Reston, VA, USA, 2015; Volume 4-A10, p. 104. [Google Scholar]
  63. Moreno, H.A.; Gourley, J.J.; Pham, T.G.; Spade, D.M. Utility of satellite-derived burn severity to study short- and long-term effects of wildfire on streamflow at the basin scale. J. Hydrol. 2019, 580, 124244. [Google Scholar] [CrossRef]
  64. Burke, M.P.; Hogue, T.S.; Kinoshita, A.M.; Barco, J.; Wessel, C.; Stein, E.D. Pre- and post-fire pollutant loads in an urban fringe watershed in Southern California. Environ. Monit. Assess. 2013, 185, 10131–10145. [Google Scholar] [CrossRef]
  65. Changnon, S.A.; Demissie, M. Detection of changes in streamflow and floods resulting from climate fluctuations and land use-drainage changes. Clim. Chang. 1996, 32, 411–421. [Google Scholar] [CrossRef]
  66. Chang, H. Comparative streamflow characteristics in urbanizing basins in the Portland Metropolitan Area, Oregon, USA. Hydrol. Process. 2006, 21, 211–222. [Google Scholar] [CrossRef]
  67. Vivoni, E.R.; Gutiérrez-Jurado, H.A.; Aragón, C.A.; Méndez-Barroso, L.A.; Rinehart, A.J.; Wyckoff, R.L.; Rodríguez, J.C.; Watts, C.J.; Bolten, J.D.; Lakshmi, V.; et al. Variation of Hydrometeorological Conditions along a Topographic Transect in Northwestern Mexico during the North American Monsoon. J. Clim. 2007, 20, 1792–1809. [Google Scholar] [CrossRef]
  68. Hesselbarth, M.H.K.; Sciaini, M.; With, K.A.; Wiegand, K.; Nowosad, J. Landscapemetrics: An open-source R tool to calculate landscape metrics. Ecography 2019, 42, 1648–1657. [Google Scholar] [CrossRef]
  69. Neel, M.C.; McGarigal, K.; Cushman, S.A. Behavior of class-level landscape metrics across gradients of class aggregation and area. Landsc. Ecol. 2004, 19, 435–455. [Google Scholar] [CrossRef]
  70. Lyne, V.; Hollick, M. Stochastic Time-Variable Rainfall-Runoff Modeling. In Proceedings of the Institute of Engineers Australia National Conference, Barton, Australia, 1 January 1979; Volume 79. [Google Scholar]
  71. Fuka, D.R.; Schwind, B.; Archibald, J.A.; Steenhuis, T.S.; Easton, Z.M. Ecohydrology: A Community Modeling Foundation for Eco-Hydrology 2014. R Package Version 0.4, 12. Available online: http://cran.nexr.com/web/packages/EcoHydRology/EcoHydRology.pdf (accessed on 27 July 2022).
  72. Nathan, R.J.; McMahon, T.A. Evaluation of automated techniques for base flow and recession analyses. Water Resour. Res. 1990, 26, 1465–1473. [Google Scholar] [CrossRef]
  73. Duncan, H.P. Baseflow separation—A practical approach. J. Hydrol. 2019, 575, 308–313. [Google Scholar] [CrossRef]
  74. Andrews, F.T.; Croke, B.F.W.; Jakeman, A.J. An open software environment for hydrological model assessment and development. Environ. Model. Softw. 2011, 26, 1171–1185. [Google Scholar] [CrossRef]
  75. Hijmans, R.J.; van Etten, J.; Sumner, M.; Cheng, J.; Baston, D.; Bevan, A.; Bivand, R.; Busetto, L.; Canty, M.; Fasoli, B.; et al. Raster: Geographic Data Analysis and Modeling 2022. R Package Version 3.5-29. Available online: https://cran.r-project.org/web/packages/raster/raster.pdf (accessed on 27 July 2022).
  76. R Studio Team. R: A Language and Environment for Statistical Computing. 2021. Available online: https://www.R-project.org/ (accessed on 27 July 2022).
  77. Kunze, M.D.; Stednick, J.D. Streamflow and suspended sediment yield following the 2000 Bobcat fire, Colorado. Hydrol. Process. 2005, 20, 1661–1681. [Google Scholar] [CrossRef]
  78. Adams, R.; Western, A.W.; Seed, A.W. An analysis of the impact of spatial variability in rainfall on runoff and sediment predictions from a distributed model. Hydrol. Process. 2011, 26, 3263–3280. [Google Scholar] [CrossRef]
  79. Biederman, J.A.; Robles, M.D.; Scott, R.L.; Knowles, J.F. Streamflow Response to Wildfire Differs with Season and Elevation in Adjacent Headwaters of the Lower Colorado River Basin. Water Resour. Res. 2022, 58. [Google Scholar] [CrossRef]
  80. Roderick, M.L.; Farquhar, G.D. A simple framework for relating variations in runoff to variations in climatic conditions and catchment properties. Water Resour. Res. 2011, 47, W00G07. [Google Scholar] [CrossRef]
  81. Bumbaco, K.A.; Raymond, C.L.; Hoekema, D.J. 2021 Pacific Northwest Water Year Impacts Assessment; Office of Washington State Climatologist: Seattle, WA, USA; Climate Impacts Group, University of Washington: Seattle, WA, USA; Oregon Climate Service: Corvallis, OR, USA; Idaho Department of Water Resources: Boise, ID, USA, 2022; p. 46. [Google Scholar]
  82. Bumbaco, K.A.; Raymond, C.L.; O’Neill, L.; Hoekema, D.J. 2020 Pacific Northwest Water Year Impacts Assessment; Office of Washington State Climatologist: Seattle, WA, USA; Climate Impacts Group, University of Washington: Seattle, WA, USA; Oregon Climate Service: Corvallis, OR, USA; Idaho Department of Water Resources: Boise, ID, USA, 2021; p. 42. [Google Scholar]
  83. National Drought Mitigation Center. Available online: https://droughtmonitor.unl.edu/DmData/TimeSeries.aspx (accessed on 25 July 2022).
  84. Saxe, S.; Hogue, T.S.; Hay, L.E. Characterization and Evaluation of Controls on Post-Fire Streamflow Response across Western, U.S. Watersheds. Hydrol. Earth Syst. Sci. 2019, 22, 17. [Google Scholar]
  85. Hallema, D.W.; Sun, G.; Bladon, K.; Norman, S.P.; Caldwell, P.V.; Liu, Y.; McNulty, S.G. Regional patterns of postwildfire streamflow response in the Western United States: The importance of scale-specific connectivity. Hydrol. Process. 2017, 31, 2582–2598. [Google Scholar] [CrossRef]
  86. Wine, M.L.; Cadol, D.; Makhnin, O. In ecoregions across western USA streamflow increases during post-wildfire recovery. Environ. Res. Lett. 2018, 13, 014010. [Google Scholar] [CrossRef]
  87. Bart, R.R. A regional estimate of postfire streamflow change in California. Water Resour. Res. 2016, 52, 1465–1478. [Google Scholar] [CrossRef]
  88. Larsen, L.G.; Choi, J.; Nungesser, M.K.; Harvey, J.W. Directional connectivity in hydrology and ecology. Ecol. Appl. 2012, 22, 2204–2220. [Google Scholar] [CrossRef] [PubMed]
  89. Cooper, M.G.; Nolin, A.W.; Safeeq, M. Testing the recent snow drought as an analog for climate warming sensitivity of Cascades snowpacks. Environ. Res. Lett. 2016, 11, 084009. [Google Scholar] [CrossRef]
  90. Hidalgo, H.; Das, T.; Dettinger, M.; Cayan, D.; Pierce, D.; Barnett, T.; Govindasamy, B.; Mirin, A.; Wood, A.; Bonfils, C. Detection and Attribution of Streamflow Timing Changes to Climate Change in the Western United States. J. Clim. 2009, 22, 3838–3855. [Google Scholar] [CrossRef]
  91. Profita, C. Post-Wildfire Logging Is Moving Fast, Raising Environmental Concerns. Available online: https://www.opb.org/article/2021/03/12/oregon-wildfires-2020-logging-rules-environmental-problems/ (accessed on 2 February 2022).
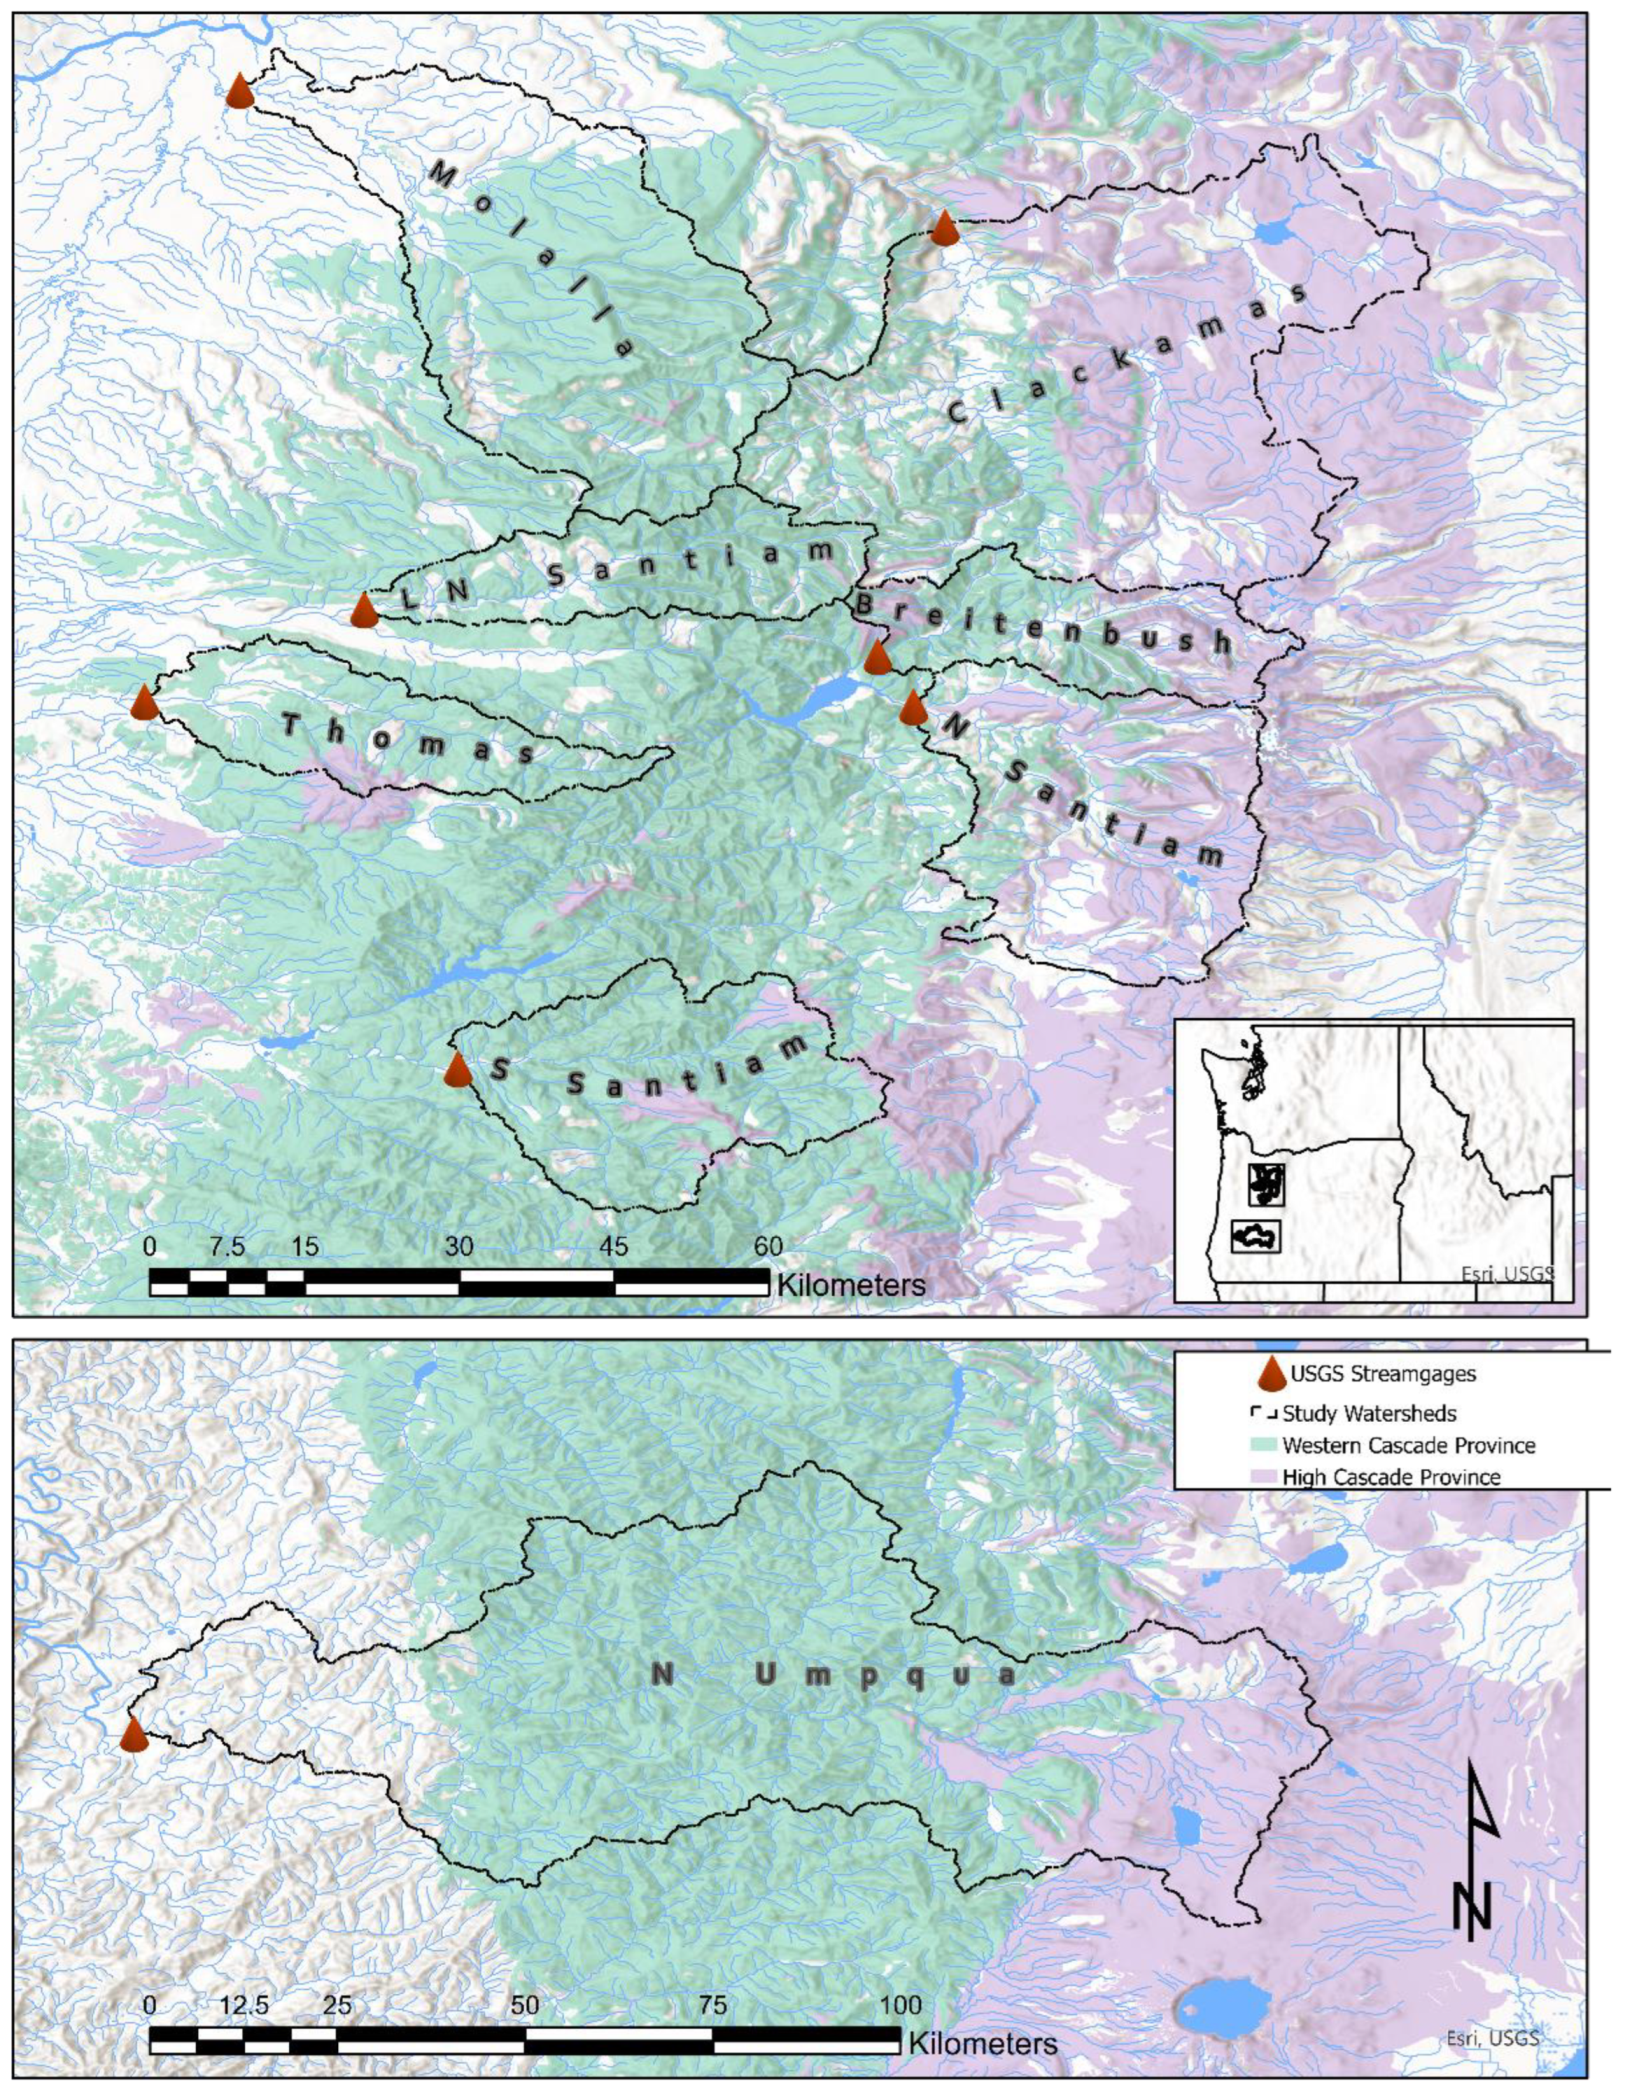
Figure 1. Surface geology of the study area displaying rocks of the Western Cascade Province and the High Cascade Province.
Hydrology 09 00157 g001
Figure 2. Generalized geological cross section of the study area where (A) represents the High Cascade Province, which is more permeable, allowing for rapid groundwater exchange, while the Western Cascade Province (B) encourages surface runoff due to less permeable characteristics.
Hydrology 09 00157 g002
Figure 4. Box whisker plots of Qr values and for pre-fire and post-fire periods for eight Oregon Cascade watersheds.
Hydrology 09 00157 g004
Figure 5. Box whisker plots of Qp values and for pre-fire and post-fire periods for eight Oregon Cascade watersheds.
Hydrology 09 00157 g005
Figure 6. Comparison of pre- and post-fire year percentage area of North Santiam watershed (HUC 17090005) in U.S. drought monitoring categories. The figure was created using the web-based tool available at U.S. Drought Monitor [83].
Hydrology 09 00157 g006
Figure 7. Spearman’s rank correlation (rs) matrix for change in post-fire runoff coefficients to burned area landscape metrics. Only significant (p-value < 0.05) correlation values are shown.
Hydrology 09 00157 g007
Table 2. Characteristics of six burned watersheds in Oregon with the total percentage burned and percentage of each burn severity class (low, moderate, and high burned areas).
WatershedSite
Number
Area (Km2)Total Burned (%)Low Burned (%)Moderate Burned (%)High Burned (%)
Clackamas 14209500126611.36.53.81.0
LN Santiam 1418250028794.020.753.419.9
Breitenbush 1417900027479.639.930.39.4
N Umpqua14319500351512.92.95.54.5
Molalla 1420000084236.616.717.22.7
N. Santiam 1431950055824.915.97.31.7
Table 3. Landscape metrics calculated for the high severity patches in each burned watershed.
SiteBurned (%)LPICLUMPYGYRATECONTIGCOHESION
N Umpqua12.911.50.8957.10.4199.4
Clackamas11.32.130.8968.90.5396.8
N Santiam24.90.700.8777.20.5794.5
Molalla36.61.540.8663.20.5495.5
Breitenbush79.61.520.8669.90.5296.6
LN Santiam94.03.330.8877.20.5497.8
Table 4. Qr results of Mann–Whitney U test and change in Qr values for six burned watersheds (B) and two controlled watersheds (C). The significance level was considered p-value < 0.10.
Watershed∆ Median QrIQR
Pre-Fire
IQR
Post-Fire
nWp-Value
N Umpqua (B)−0.010.05–0.340.02–0.17402250.43
Clackamas (B)−0.030.05–0.260.04–0.16381950.67
N Santiam (B)0.010.05–0.150.04–0.19321230.87
Molalla (B)0.040.13–0.320.09–0.5029920.67
Breitenbush (B)0.090.09–0.380.11–0.4729790.38
LN Santiam (B)0.070.07–0.340.16–0.37331030.28
S Santiam (C)0.070.07–0.320.08–0.42351270.51
Thomas (C)0.030.06–0.320.04–0.62341260.64
Table 5. Qp results of Mann–Whitney U test and change in median Qp values and interquartile range (IQR) of pre- and post-fire Qp values for six burned watersheds (B) and two controlled watersheds (C). The significance level was considered at a p value < 0.10.
Watershed∆ Median QpIQR
Pre-Fire
IQR
Post-Fire
nWp-Value
N Umpqua (B)−1.693.1–18.41.9–7.9371960.40
Clackamas (B)−2.641.2–6.50.9–4.1311470.29
N Santiam (B)−1.862.6–6.22.3–7.0271080.42
Molalla (B)−0.654.2–17.14.6–23.426770.74
Breitenbush (B)6.732.8–21.87.1–38.626580.21
LN Santiam (B)4.481.8–23.96.3–38.729740.20
S Santiam (C)−0.461.9–12.72.7–10.9301130.93
Thomas (C)−6.376.1–17.83.2–24.4311320.56
Publisher’s Note: MDPI stays neutral with regard to jurisdictional claims in published maps and institutional affiliations.