Article

Soil Erosion, Sediment Yield, and Runoff Modeling of the Megech Watershed Using the GeoWEPP Model

1
Department of Civil Engineering, Addis Ababa Science and Technology University, Addis Ababa P.O. Box 16417, Ethiopia
2
Center of Excellence for Sustainable Energy, Addis Ababa Science and Technology University, Addis Ababa P.O. Box 16417, Ethiopia
3
Department of Earth and Environment, Florida International University, Miami, FL 33199, USA
*
Author to whom correspondence should be addressed.
Hydrology 2022, 9(12), 208; https://doi.org/10.3390/hydrology9120208
Submission received: 20 October 2022 / Revised: 17 November 2022 / Accepted: 18 November 2022 / Published: 22 November 2022
(This article belongs to the Section Soil and Hydrology)

Abstract

:
Modeling soil erosion, sediment yield, and runoff are crucial for managing reservoir capacity, water quality, and watershed soil productivity. However, the monitoring and modeling of soil erosion and sedimentation rates in developing countries such as Ethiopia is not well practiced; thus, the reservoir capacity is diminishing at faster rates. In this study, the soil erosion, sediment yield, and runoff in the Megech watershed, Upper Blue Nile Basin, Ethiopia were modeled using the physically-based geospatial interface, the Water Erosion Prediction Project (GeoWEPP). The GoWEPP model was calibrated and validated at the Angereb sub-watershed and simulated to representative sites to capture the spatiotemporal variability of soil erosion and sediment yield of the Megech watershed. The model parameter sensitivity analysis showed that the hydraulic conductivity (Ke) for all soil types was found to be the dominant parameter for runoff simulation, while rill erodibility (Kr), hydraulic conductivity (Ke), critical shear stress (τc), and inter rill erodibility (Ki) were found to be sensitive for sediment yield and soil loss simulation. The model calibration (2000–2002) and validation (2003–2004) results showed the capability of the GeoWEPP model; with R2 and NSE values, respectively, of 0.94 and 0.94 for calibration; and 0.75 and 0.65 for validation. In general, the results show that the sediment yield in the study watershed varied between 10.3 t/ha/year to 54.8 t/ha/year, with a weighted mean value of 28.57 t/ha/year. The GeoWEPP model resulted in higher sediment value over that of the design sediment yield in the study basin, suggesting the implementation of the best watershed management practices to reduce the rates of watershed sediment yield. Moreover, the mean soil loss rate for the Angerb sub-watershed was found to be 32.69 t/ha/year.

1. Introduction

Soil erosion and siltation by water is a big problem in the world and its impact is more serious in a developing country such as Ethiopia due to intensive agriculture, overgrazing, and high population stress [1,2,3]. Soil erosion and sedimentation have two major consequences for water resources: onsite and offsite effects. One of the key offsite effects identified is reservoir capacity drop that brings inordinate challenges to use reservoirs sustainably to their design life due to the high rate of siltation [3,4,5,6,7,8,9]. Ref. [10] studied the influences of accelerated soil erosion on reservoir capacity loss at a faster rate and suggested catchment management, sediment flushing, and sediment routing as general mitigation measures. However, [11,12] identified that land and water management play an important role to combat life storage depletion and sustaining dams to their useful life in the highlands of the Ethiopian watershed. Reservoir sedimentation rates varied across reservoir size, watershed management interventions, and physiographic and climate conditions, but worldwide more than 1% of reservoir total capacity is lost annually [13,14]. The study by [7] on the Angereb reservoir in Northern Ethiopia using a bathymetric approach revealed annual reservoir capacity loss rate due to sedimentation is higher than 3.0%.
On the other hand, onsite impacts are mainly described by soil erosion and deposition processes by quantifying it, and identifying the hot spot area within the watershed is the key effort to mitigate and reduce its overall impact [3,15,16,17,18,19]. According to [20], the multi-criteria decision analysis and GIS technique is used in the Upper Blue Nile Basin to identify hotspot areas where slope and soil types contribute to high soil erosion and to alleviate it, integrated soil and water conservation practices are suggested. On the contrary [21], identified accelerated agricultural area expansion intensifies soil erosion problems and its onsite impacts in the Ethiopian highlands and conservation measures used to lessen the problem. Water erosion is also a major cause of land degradation, reducing agricultural productivity, particularly in the steep slope and population-stressed areas, necessitating intervention by government and environmental institutions [22]. Nevertheless, [23] identified such land degradation is better alleviated by farmer participation in constructing soil and water conservation, such as bunds, to reduce erosion. Applying any of the above-mentioned soil erosion protections at the watershed level is so costly that it requires identifying the hot spot areas for watershed management and soil and water conservation works.
Several methods have been developed for the spatial assessment of soil erosion and sediment yield rates. These methods are broadly classified into three approaches. The first approach consists of quantifying erosion from experimental erosion plot measurement [24,25,26,27,28,29], the second is to map erosion features by executing an erosion survey or by visual interpretation of satellite images or aerial photographs [30,31], and the third and most widely used approach is through integrating spatial data on erosion factors by using erosion models [32]. Field measurement and modeling works can give better soil erosion estimation results [33]. Hydrologic models play an important role in understanding the erosion process, quantification of runoff and sediment yield at the watershed scale [34,35,36], and one of the steps used to plan suitable soil protection measures and detect erosion hotspots [37].
Plenty of models exist for the study of the soil erosion and sediment yield processes which vary significantly in terms of their capability and complexity, input requirements, representation of processes, spatial and temporal scale accountability, practical applicability, and types of output they provide [38,39,40]. Soil erosion hydrological models are in lesser use in developing countries [41], though applications of empirical soil erosion models, such as the Universal Soil Loss Equation (USLE), the Revised Universal Soil Loss Equation (RUSLE), and/or the Modified Universal Soil Loss Equation (MUSLE), are improved through time and becoming common these days [42], but are still incapable of simulating event-based erosion [43]. Because process-based physical models appear far more constrained due to data and scale limitations, spatial soil water erosion mostly relies on empirical models [40,41]. Yet, physically-based models are more capable of simulating sediment yield and soil erosion for both continuous or event-based modes [40]. Therefore, it is vital to find an effective soil erosion prediction model to develop a reasonable and scientific soil erosion control at a specific sub-watershed level.
The Water Erosion Prediction Project (WEPP) is a physical-based model that most widely used tools for simulating sediment yield and water erosion [38], and the most cited soil erosion model was preceded by RUSLE and USLE [37]. It is proved that the WEPP model is suitable to estimate soil loss and sediment yield at various scales of the study area’s [44,45] field and watershed scales, respectively, and can also simulate soil erosion both at the slope and watershed scales [46]. The geospatial Water Erosion Prediction Project of the GeoWEPP model is a GIS-based model and is applicable in estimating sediment yield, soil loss, and runoff successfully for varying size, topography, and land use. It was tested [47,48,49] and its computational performance was compared with other soil erosion models. For example, [50,51,52] compared WEPP with empirical USLE or RUSLE and WEPP produced better results [53,54,55] compared with the Soil and Water Assessment Tool (SWAT) conceptual model, indicating the WEPP simulation was nearer to measured values [44]. Erosion 3D and WEPP model performance compared still better in estimating soil erosion and sediment yield. According to [56], the WEPP model can provide soil loss or net soil loss for the whole or part of the hillslope or at watershed spatial scales at daily, monthly, or annual temporal scales. The objective of this research is to estimate soil loss, sediment yield, runoff, and produce a hot spot area map for the sub-watershed of the Megech watershed using the physically-based geospatial Water Erosion Prediction Project (GeoWEPP) model.

2. Materials and Methods

2.1. Study Area

The research area watershed named the Megech watershed is located at 11°45′40″ and 12°44′57″ N latitude and 37°24′2″ and 37°37′21″ E longitude in the Upper Blue Nile Basin of the tributary of Lake Tana, the biggest lake in Ethiopia (Figure 1). The Megech watershed covers an area of 424 km2 at the dam site with a mean annual flow of 5.6 m3/s. The watershed is characterized as a mountainous, wedge-shaped, and steep sloped watershed.
The study site has two distinctive seasons: a rainy season from May to October and a dry season that extends from November to April. Monthly rainfall varies from 67 mm in October to 306 mm in July and the mean annual precipitation is about 1100 mm. The mean monthly minimum and maximum temperatures are about 14.16 °C and 27.63 °C, respectively.

2.2. Methods and Datasets

This research employs the GeoWEPP model for the estimation of runoff, soil loss, and sediment yield in the studied watershed. The main input data for the model are the digital elevation model (DEM), the land use land cover map (LULC), the soil map, and climate data. The three raster maps of the soil, DEM, and LULC are prepared in rectangular shapes containing the studied watershed with the same grid size of 30 m × 30 m using ArcGIS 10.2 and then converted to the American Standard Code for Information Interchange (ASCII) file format to feed them the model. For the methodology flow chart, see Figure 2.

2.2.1. GeoWEPP Model Description and Applications

The Water Erosion Prediction Project (WEPP) model is a process-oriented, continuous simulation, erosion prediction model [56,57,58]. The GeoWEPP was the first geospatial interface to the WEPP model [59,60,61] to provide two simulation options watersheds (offsite) and a flow path (onsite) for sediment yield (SY) and soil loss (SL) assessments, respectively, as per our interest. The model used for this study consists of three independent software products. The WEPP model Version 2012.8 for the ArcGIS 10.2 to soil erosion calculation is linked via the GeoWEPP for the ArcGIS 10.x, a project that is one of the interfaces through which the WEPP model can be used. The GeoWEPP package for ArcGIS 10.x is available for free download at the University of Buffalo, Department of Geography. The GeoWEPP model combines three functions: the Topographic Parameterization Tool (TOPAZ) for topographic evaluation, drainage identification, watershed identification, watershed segmentation, and sub-catchment parameterization; the PRISM (Parameter-elevation Regressions on Independent Slopes Model) for editing existing climate data; and the WEPP (Water Erosion Prediction Project) for soil erosion calculation [62]. The GeoWEPP successfully reproduced the continuous sediment discharge in watersheds of varying size, topography, and land use [44,49,63,64]. The GeoWEPP also has the ability to determine where the sediment yield and runoff occur and locates possible deposition places and also indicate when they happened.

2.2.2. Onsite and Offsite Model Simulation

There are two simulation methods available in the GeoWEPP model simulation: onsite and offsite. The onsite method calculated soil loss at the cell level, and the results were aggregated to provide soil loss at the hillslopes and sub-watersheds; whereas the offsite method first aggregated raster inputs of cells in the hillslope, followed by sediment yield estimation at the hillslopes and channels, and the results were aggregated to downstream outlet points. Depending on the output required, one or both methods are chosen during model simulation, and we used both methods in this study.

Digital Elevation Model (DEM)

From 30 × 30 m, the Digital Elevation Model (DEM) elevation values range from 1878 to 2966 m above the mean sea level collected from the Ethiopian Ministry of Water and Energy (MoWE). The watershed slope steepness classes were performed using the ArcGIS 10.2 spatial analyst slope tool from the input Digital Elevation Model (DEM) using FAO 2002 classification [17] and identified 67.67% of the watershed area is a steep slope >15% gradient highly sensitive to soil erosion (Table 1). To delineate and create channel networking topographic parameterization (TOPAZ), software was used with the criteria of a critical source area (CSA) and a minimum source channel length (MCSL) 5 ha and 100 m, respectively. These values are default values for the GeoWEPP model for runoff, and sediment yield estimation can be applicable for such steep slopes [48].

Land Use Land Cover (LULC) Data

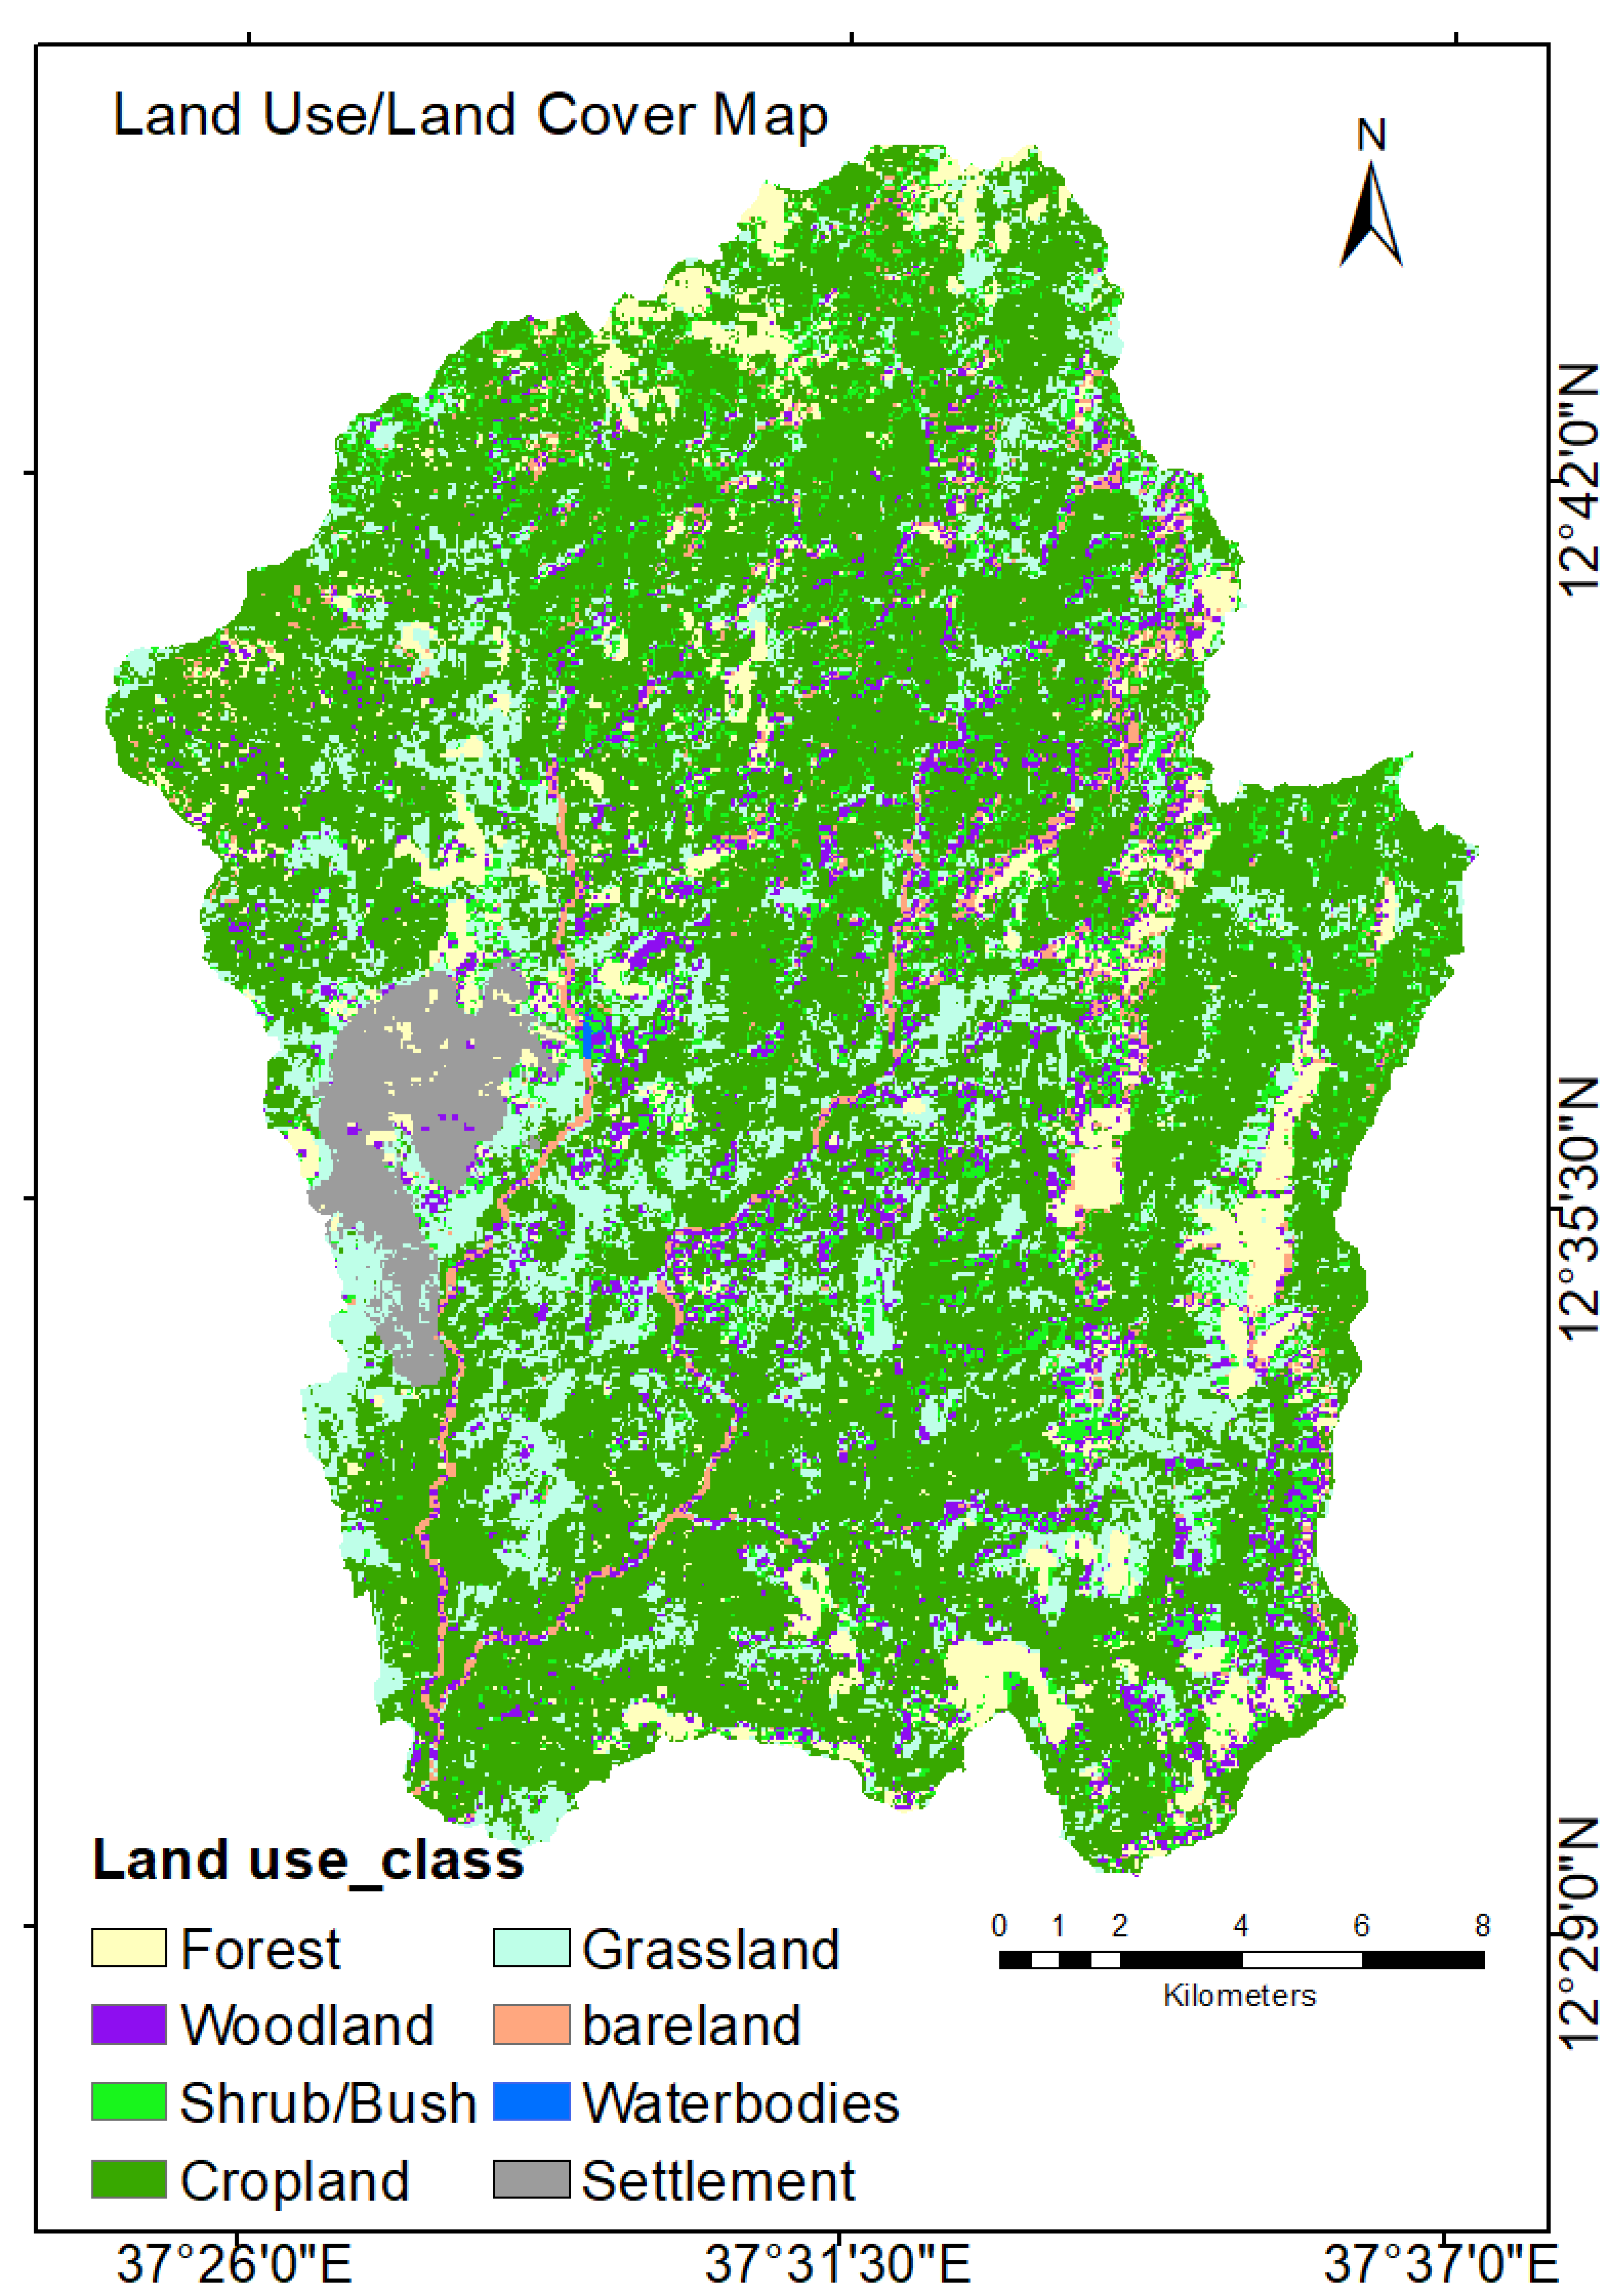
According to the recently available land use land cover map (Figure 3) collected from the land and water resources center (LWRC) and also available in the Ethiopian Mapping Agency (EMA), crop (cultivated) land covers 59.31%, followed by grassland at about 15%, forest (7.5%), while shrub land (6.8%), woodland (5.8%), others such as settlement (2.8%), bare land (2.3%), and water bodies (0.03%) cover smaller areas. In the context of this study, the forest represents land covered with dense trees while woodland represents land with trees dominated by open spaces.

Soil Data

There are six types of soils within the Megech dam watershed as data collected by the Ministry of Waters and Energy (MoWE). Soils type coverage, according to ArcGIS zonal geometric analysis, can be stated as eutric leptosols (78.94%), and eutric nitisols (14.00%) covering more than 90%, lithic leptosol (2.71%), orthic luvisols (2.02%), chromic vertisols (1.91%), and eutric cambisols (0.43%) (See Figure 4).

Climate Data

The observed climate data were collected from the Ethiopian National Meteorological Agency (NMA) for stations in and nearby the Megech watershed precipitation, maximum and minimum temperatures. For climate data preparation, rock clime application in the WEPP was used to access a database of PRISM (Parameter-elevation Regression on Independent Slope Models) which estimates precipitation and temperature-based orographic effects [65]. Mean monthly precipitation, maximum and minimum temperature, number of wet days, station name location, and elevation were provided to the rock clime internet-based simulator as an input, and the (.cli) climate data were generated as an input to the GeoWEPP model.
The spatial model inputs, DEM, LULC, and soil were prepared with rectangular shape raster ASCII file format enclosing the study watershed as small as possible to reduce model processing time. The GeoWEPP model is an improvement of the WEPP model [59,60], and used digital spatial data and climate files for the estimation of runoff, soil erosion, and sediment yield at hill slopes and smaller watersheds.

Watershed Delineation

In the GeoWEPP environment stream networking and watershed, delineation was performed automatically by the topographic parameterization (TOPAZ) function for selected outlet points by defining critical sources (CSA) and (MSCL) arbitrarily [62]. Watershed delineation was performed at 5 ha CSA and 500 m MSCL.

Model Calibration and Validation

To calibrate the GeoWEP model, two datasets were used at the gauge site of the Angereb River, a tributary of the Megech River, near Gondar: (i) Daily runoff data and (ii) Sediment concentration from the Ministry of Water and Energy (MoWE) and the Abbay Basin Authority (ABA). We took measurements of flow and sediment concentration at high, medium, and low flow times to validate the collected data. Although the GeoWEPP model has the ability of daily simulation of flow and sediment in its event-based simulation method, our study areas lack such continuous event-based measurement data. To solve such a problem for model calibration and validation, a sediment rating curve was prepared to obtain continuous sediment flow. Finally, calibration was performed for the monthly flow, and sediment data were set from 2000 to 2002, and validation used data from 2003 to 2004 at a monthly time step.

Model Performance Evaluation

Model performance assessment was performed to check how the model simulation results replicate the observed data. Hydrological model performance rating for monthly time steps can be performed either by overview or recommended statistical indicators [66]. Coefficient of determination (R2) and the Nash graphical approach provides visual model Sutcliff efficiency (NSE), and percent of bias (PBIAS) statistical indicators are used to check model performance during the calibration and validation period for the Angereb sub-watershed.
Coefficient of determination(R2): values range from 0 to 1 and an optimal value = 1, which means observed and simulated values are in a fit. For monthly time step data, if it is >0.7, it is generally considered as good and >0.5 is accepted [66].
R 2 = [ i = 1 n ( S i S ¯ ) ( O i O ¯ ) / i = 1 n ( S i S ¯ ) 2 i = 1 n ( O i O ¯ ) 2 ] 2
Nash Sutcliffe efficiency: model performance rating values range from −∞ to 1 and the optimal value is 1, and for monthly time step data >0.75 is very good, >0.65 is considered as good performance, >0.5 is satisfactory, and ≤0.5 is unsatisfactory [66].
NSE = 1 i = 1 n ( S i O i ) 2 / i = 1 n ( O i O ¯ ) 2
Percent bias (PBIAS): Percent bias (PBIAS) measures the average tendency of the simulated data to be larger or smaller than their observed. A negative sign indicates the model overpredicts and a positive value model underpredicts, and 0 is optimal value. According to Moriasi et al. [66], model performance evaluation for the monthly time step for the PBIAS statistic measure is satisfactory and acceptable when it is between −25% and 25% for stream flow estimation, and between −55% and 55% for the sediment simulation model.
PBIAS = i = 1 n ( O i S i ) 100 / i = 1 n O i
where Si is the simulated value; Oi is the observed value; and i is the counter of observed and simulated values.

Sensitivity Ratio

Sensitivity analysis can be used in all phases of the modeling process: model formulation, model calibration, and model verification. According to [67,68], simulation of runoff and sediment yield are sensitive to effective hydraulic conductivity (Ke), rill erodibility (Kr), critical shear stress (τc), and inter rill erodibility (Ki). Runoff is sensitive to only Ke and sediment yield and soil loss are sensitive to Ke, Kr, τc, and Ki, respectively.
Sensitivity ( S ) = [ ( O 2 O 1 ) I ¯ ] / [ ( I 2 I 1 ) O ¯ ]
where I2 and I1 are the maximum and minimum input parameters, Ī is the mean input value; O2 and O1 are the maximum and minimum model outputs, and Ō is mean output value. As can be seen in Table 2, runoff is sensitive only for effective hydraulic conductivity parameter (Ke) for different soil types in the Angereb sub-watershed with sensitivity ratio ranges from −0.3487 to −1.7263 for euticl leptosols and eutic cambislos, respectively.

3. Results

3.1. Model Sensitvity

Model sensitivity was performed manually to all soil parameters for the Angereb sub-watershed soil types (Table 2). Runoff is sensitive for only effective hydraulic conductivity with a sensitivity ratio varied from −0.3487 to −1.7263 for eutric leptosol and eurtic cambisol, respectively. Soil loss (SL) and sediment yield (SY) are sensitive to all soil sensitivity parameters and the degree of sensitivity for different soil parameters vary soil across the soil types.

3.2. Model Calibration and Validation

Event-based continuous model simulation results for runoff and sediment yield were utilized for model calibration and validation. Manual calibration of the GeoWEPP model was carried out at the Angereb gauge site by perturbing the soil parameters one at a time within acceptable limits as recommended by the WEPP user manual [69].

3.2.1. Runoff

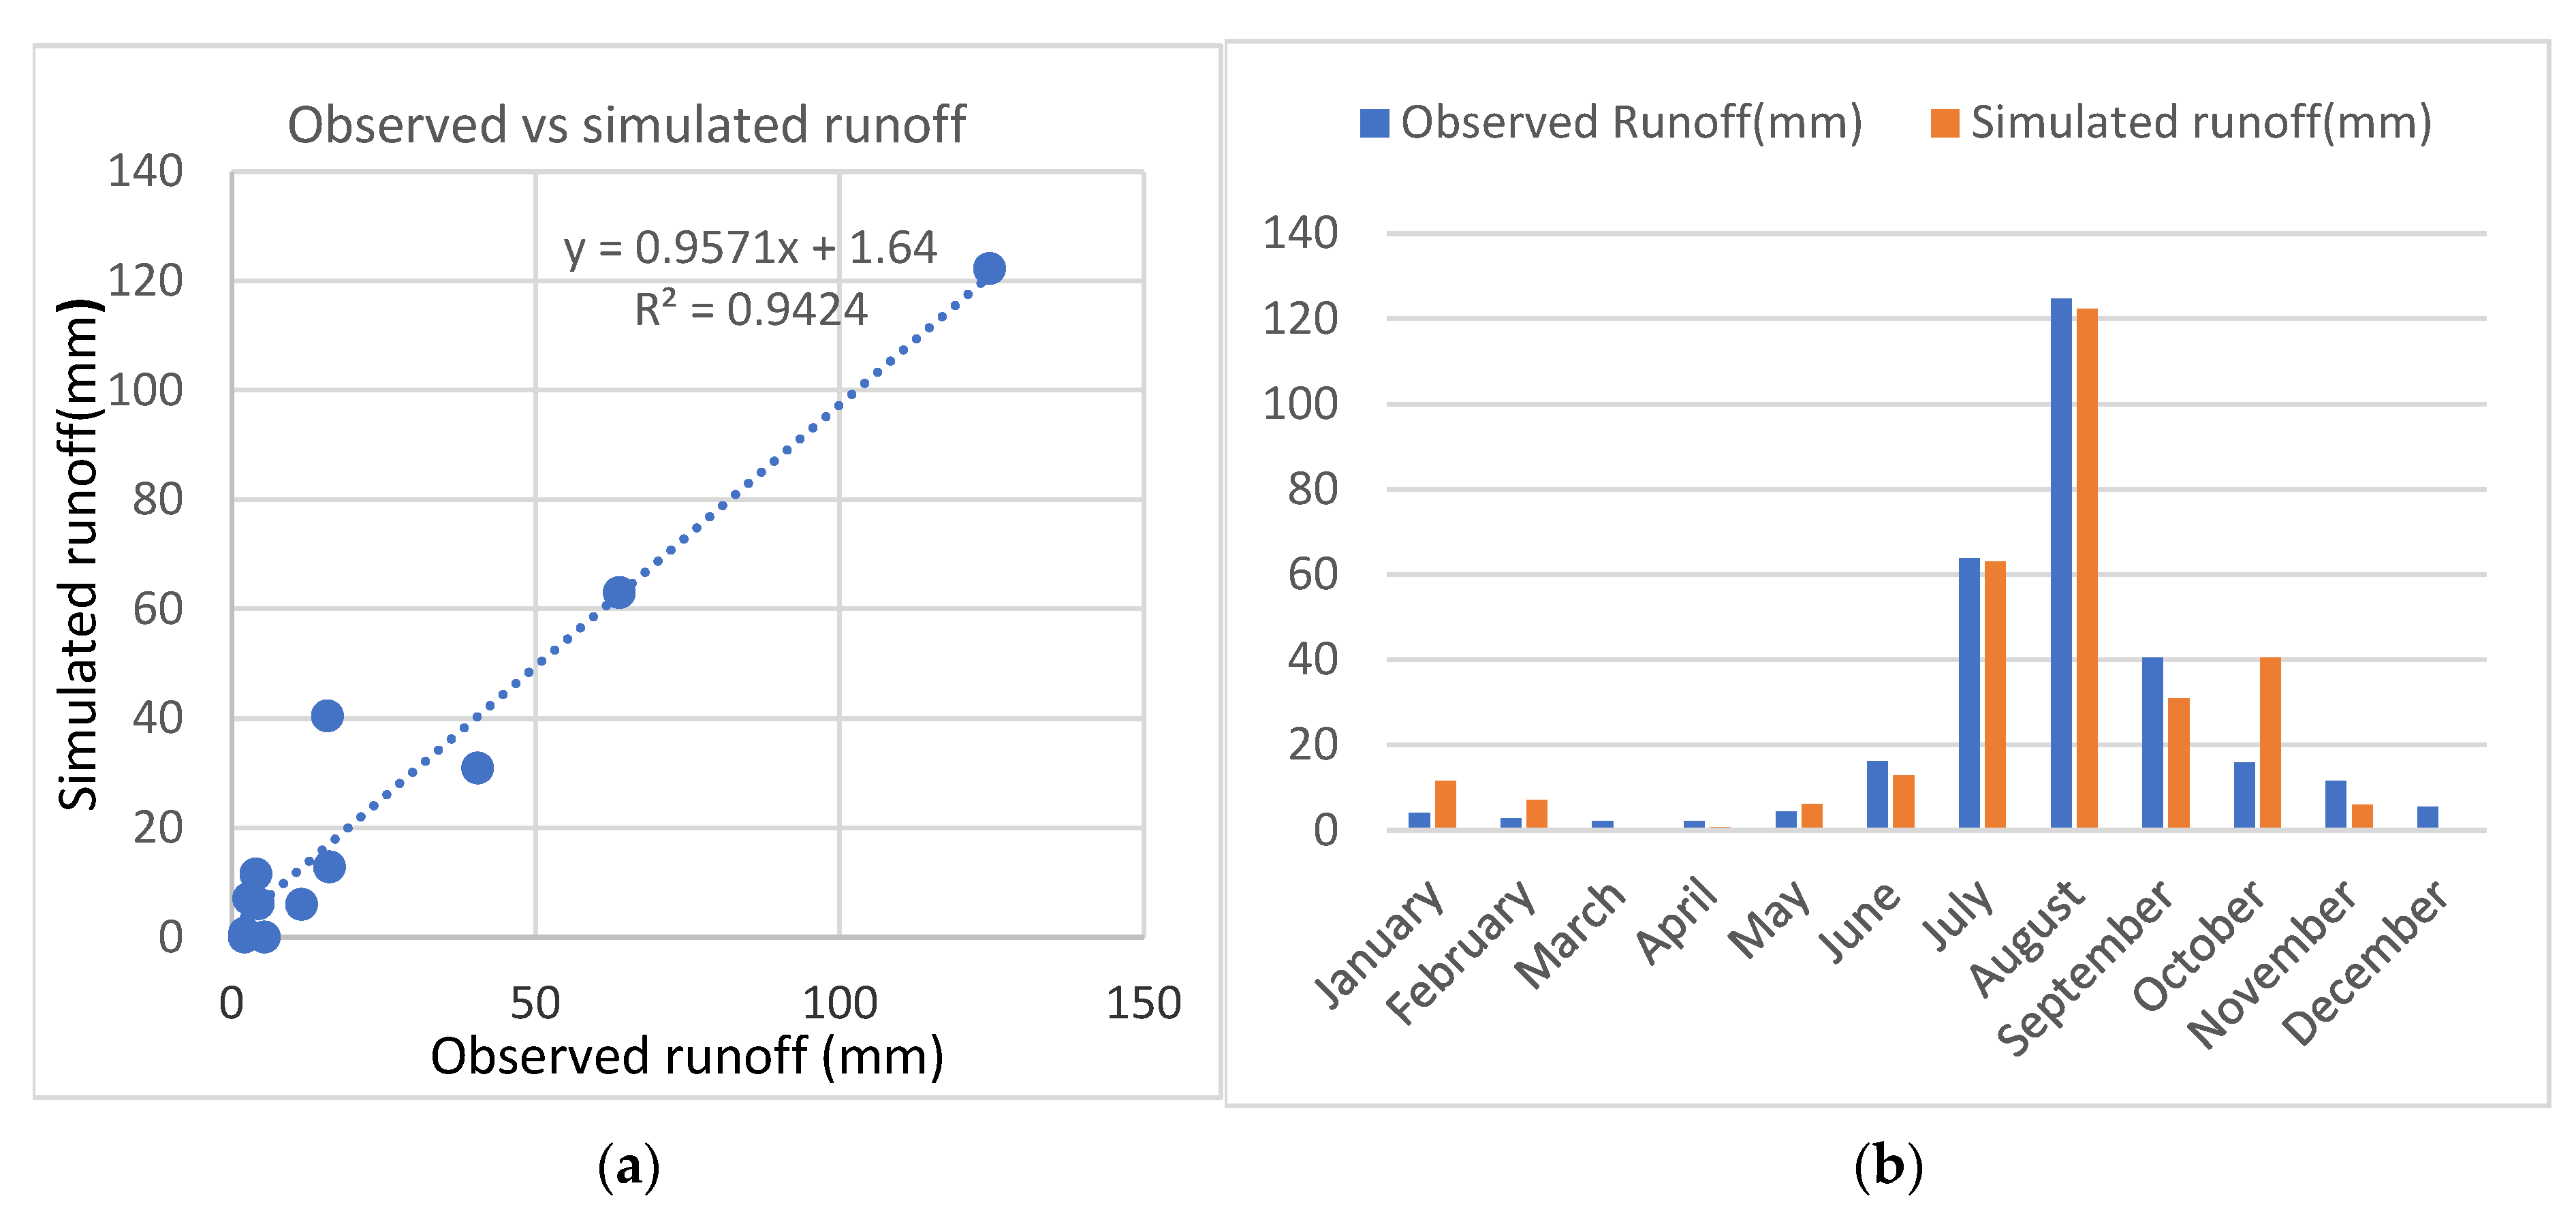
The model calibrated was performed for the time period (2000–2002) using the simulated and observed monthly runoff depths. Visual inspection reveals that the simulated runoff follows the same pattern as the measured runoff (see Figure 5b). Additionally, the coefficient of determination R2, NSE, and PBIAS model performance indicators with values of 0.942, 0.941, and −2.41%, respectively, indicated simulated runoff well duplicate the measured runoff during the calibration period.
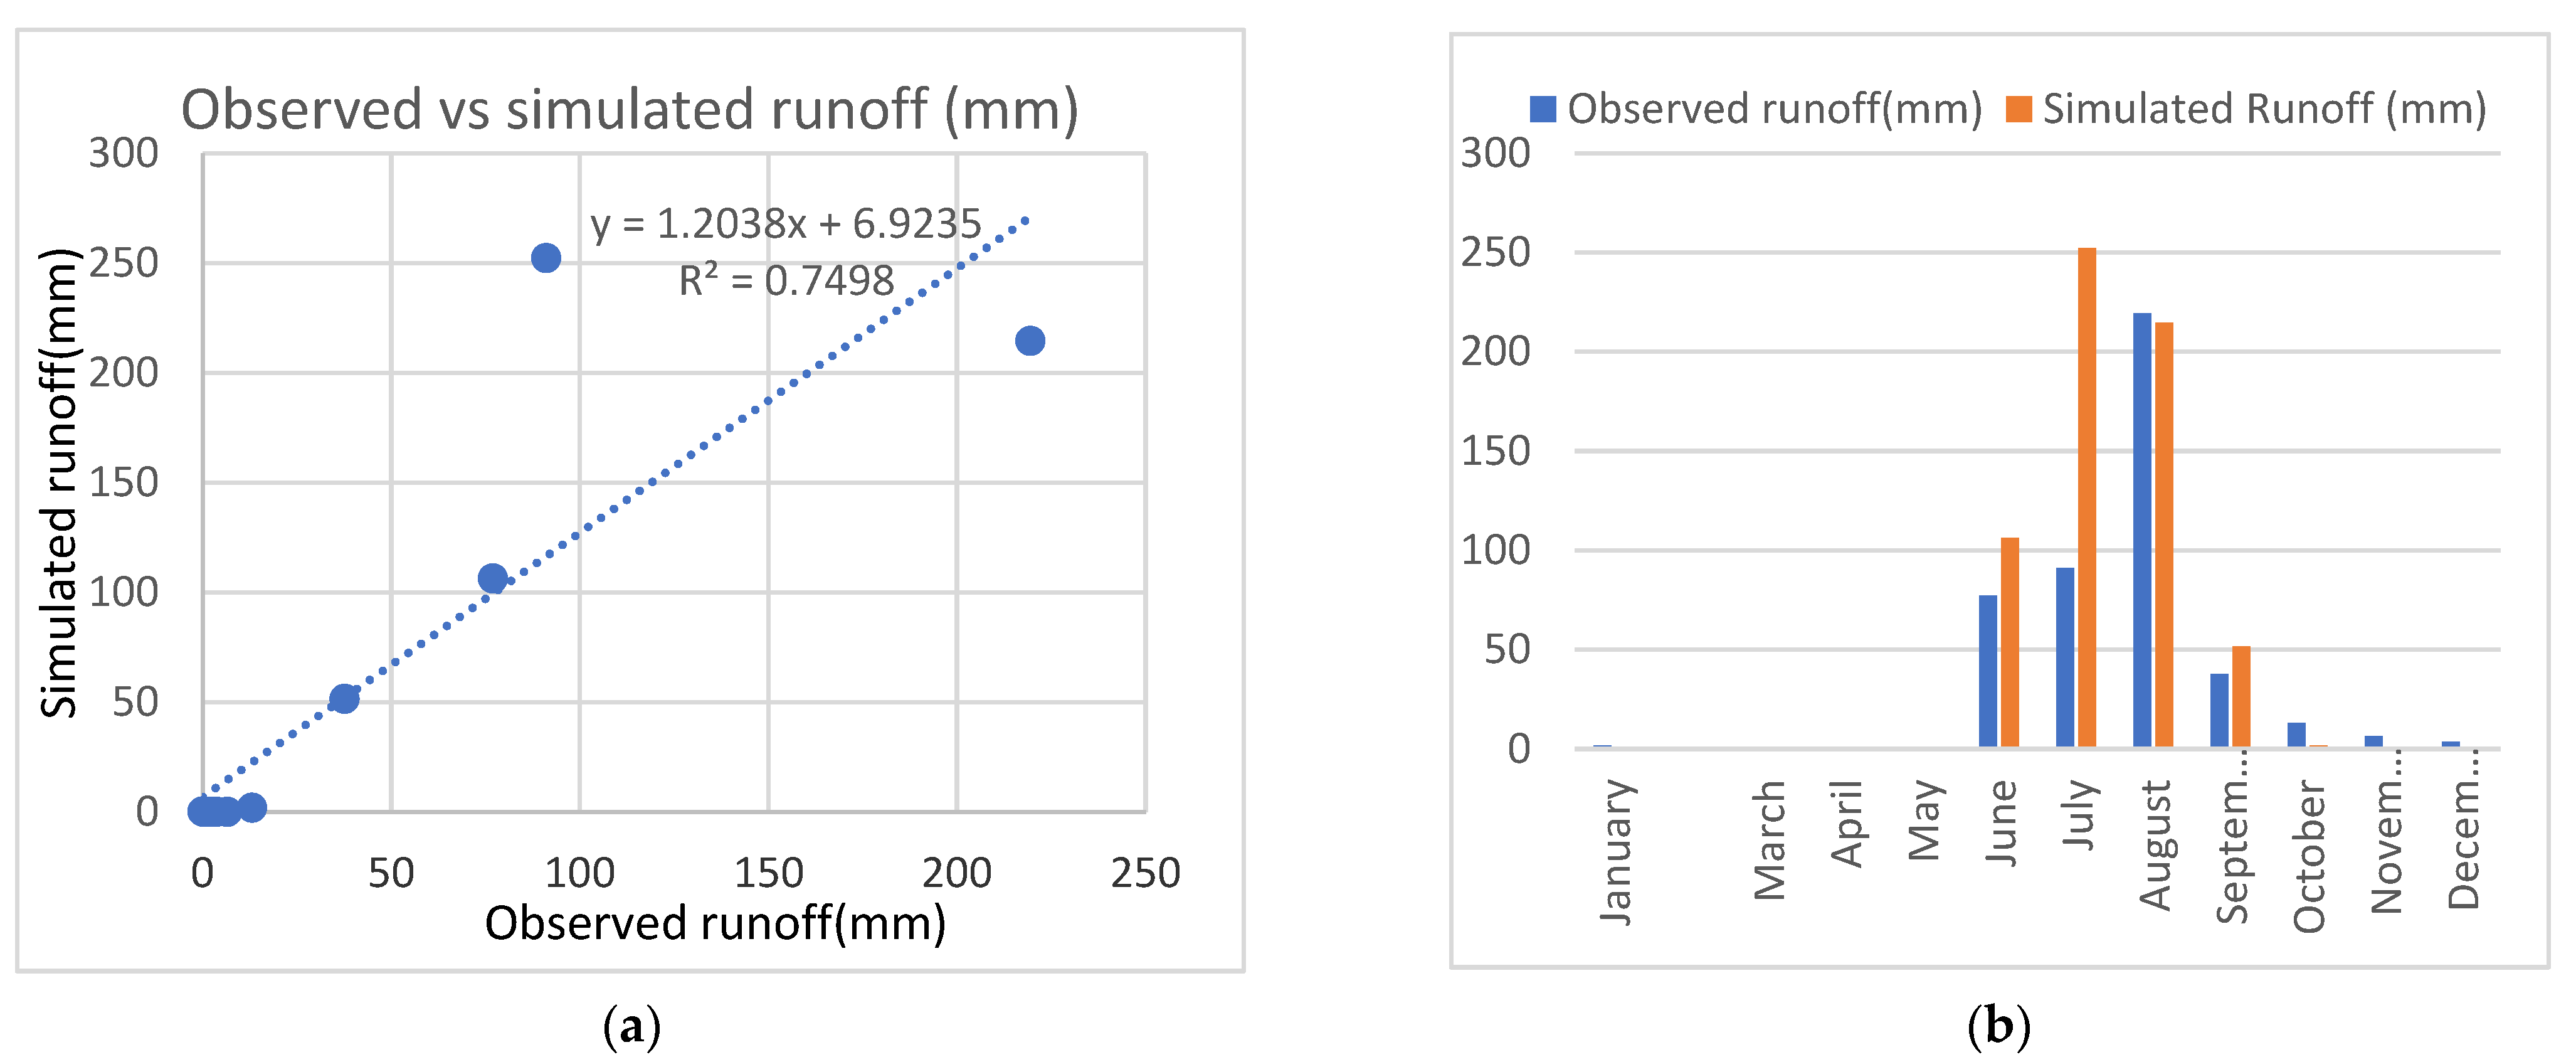
In order to validate the GeoWEPP model, simulations were performed for different time periods (2003–2004) without altering any soil properties by merely changing the climate data. A reasonable model result was produced and compared with the measured runoff of the same time period, as presented in Figure 6a,b, and statistical model performance indicators for R2, NSE, and PBIAS were estimated as 0.75, 0.65, and −38.77%, correspondingly. Despite the fact that the PBIAS values indicated poor model performance [66], the model was used for runoff estimation, because the R2 and NSE model performance metrics indicated a strong relationship between model results and measured values.

3.2.2. Sediment

Model calibration and validation for sediment data are equally important to that of the runoff. During calibration, adjusting soil parameters of effective hydraulic conductivity (Ke), rill erodibility (Kr), inter-rill edibility (Ki), and critical shear stress (τc), which are sensitive to sediment yield and soil loss comparison, with observed sediment data until satisfactory results were produced [67,70].

Sediment Rating Curve

To obtain continuous sediment data, a sediment rating curve was prepared using sediment concertation, C(mg/L) data collected from the Ministry of Water and Energy (MWE,) and the Abbay Basin Authority (ABA), after converting to instantaneous sediment load (tons/day) by the formula in equation 5 [71].
Qs = CKQw
The rating curve prepared in the log–log scale provides us sediment rating equation for the Angereb river gauge site (Figure 7).
Qs = 22.192 × Qw1.247
where the Qs-daily sediment load (ton/day), C-sediment concentration(mg/L), Qw-water discharge(m3/s), and K-dimension less conversion factor is 0.0864. The sediment rating curve bias correction was performed using the Duan method by HECRAS 6.2 as 1.99. Since the GeoWEPP calculates the total load bed, load estimation is necessary. Bed load estimated in the Blue Nile is not well established and varies between 10 and 20% of the suspended load, and 15% is considered in this study to estimate bed load [72].
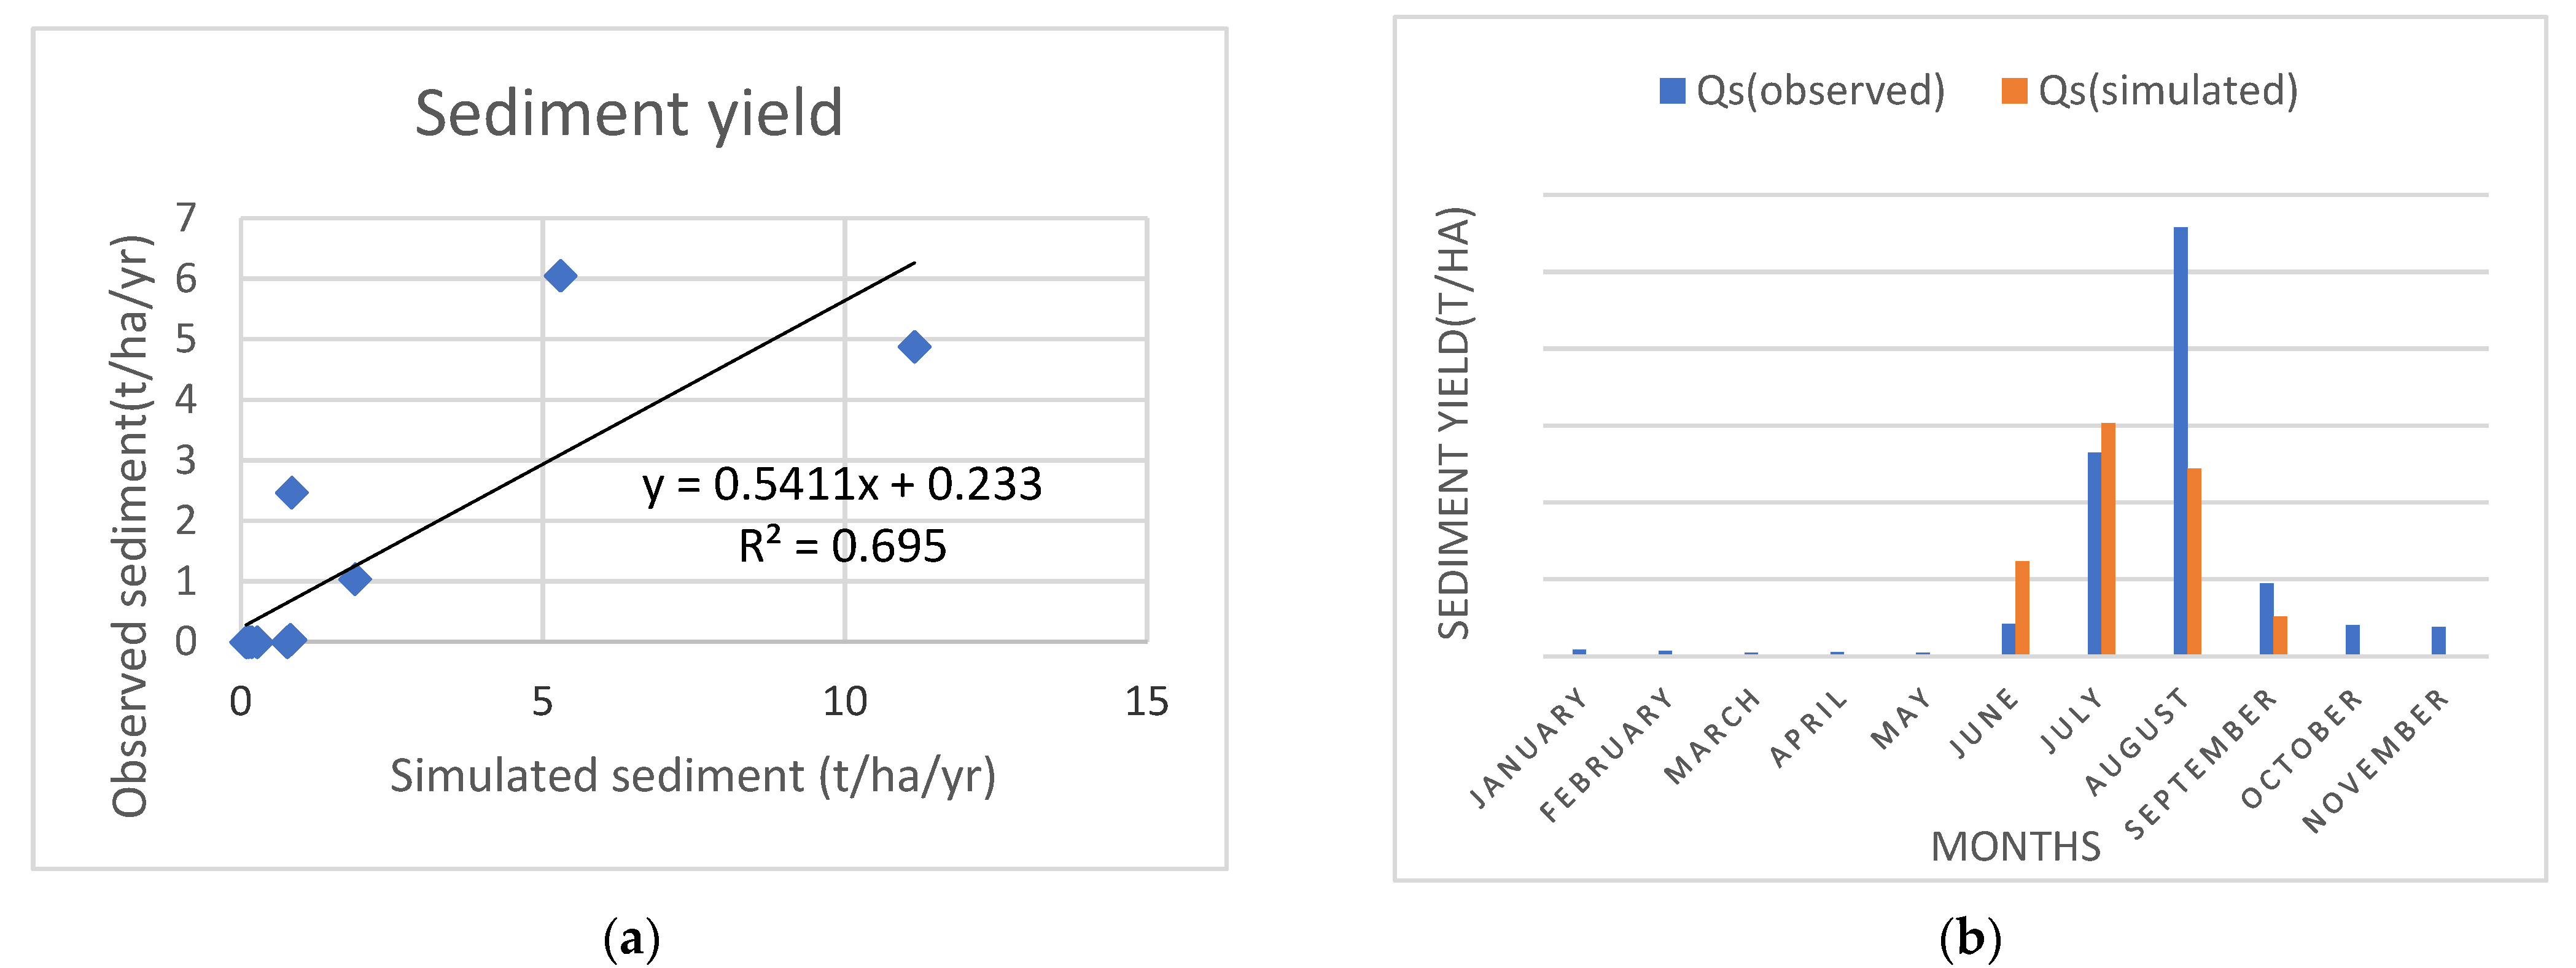
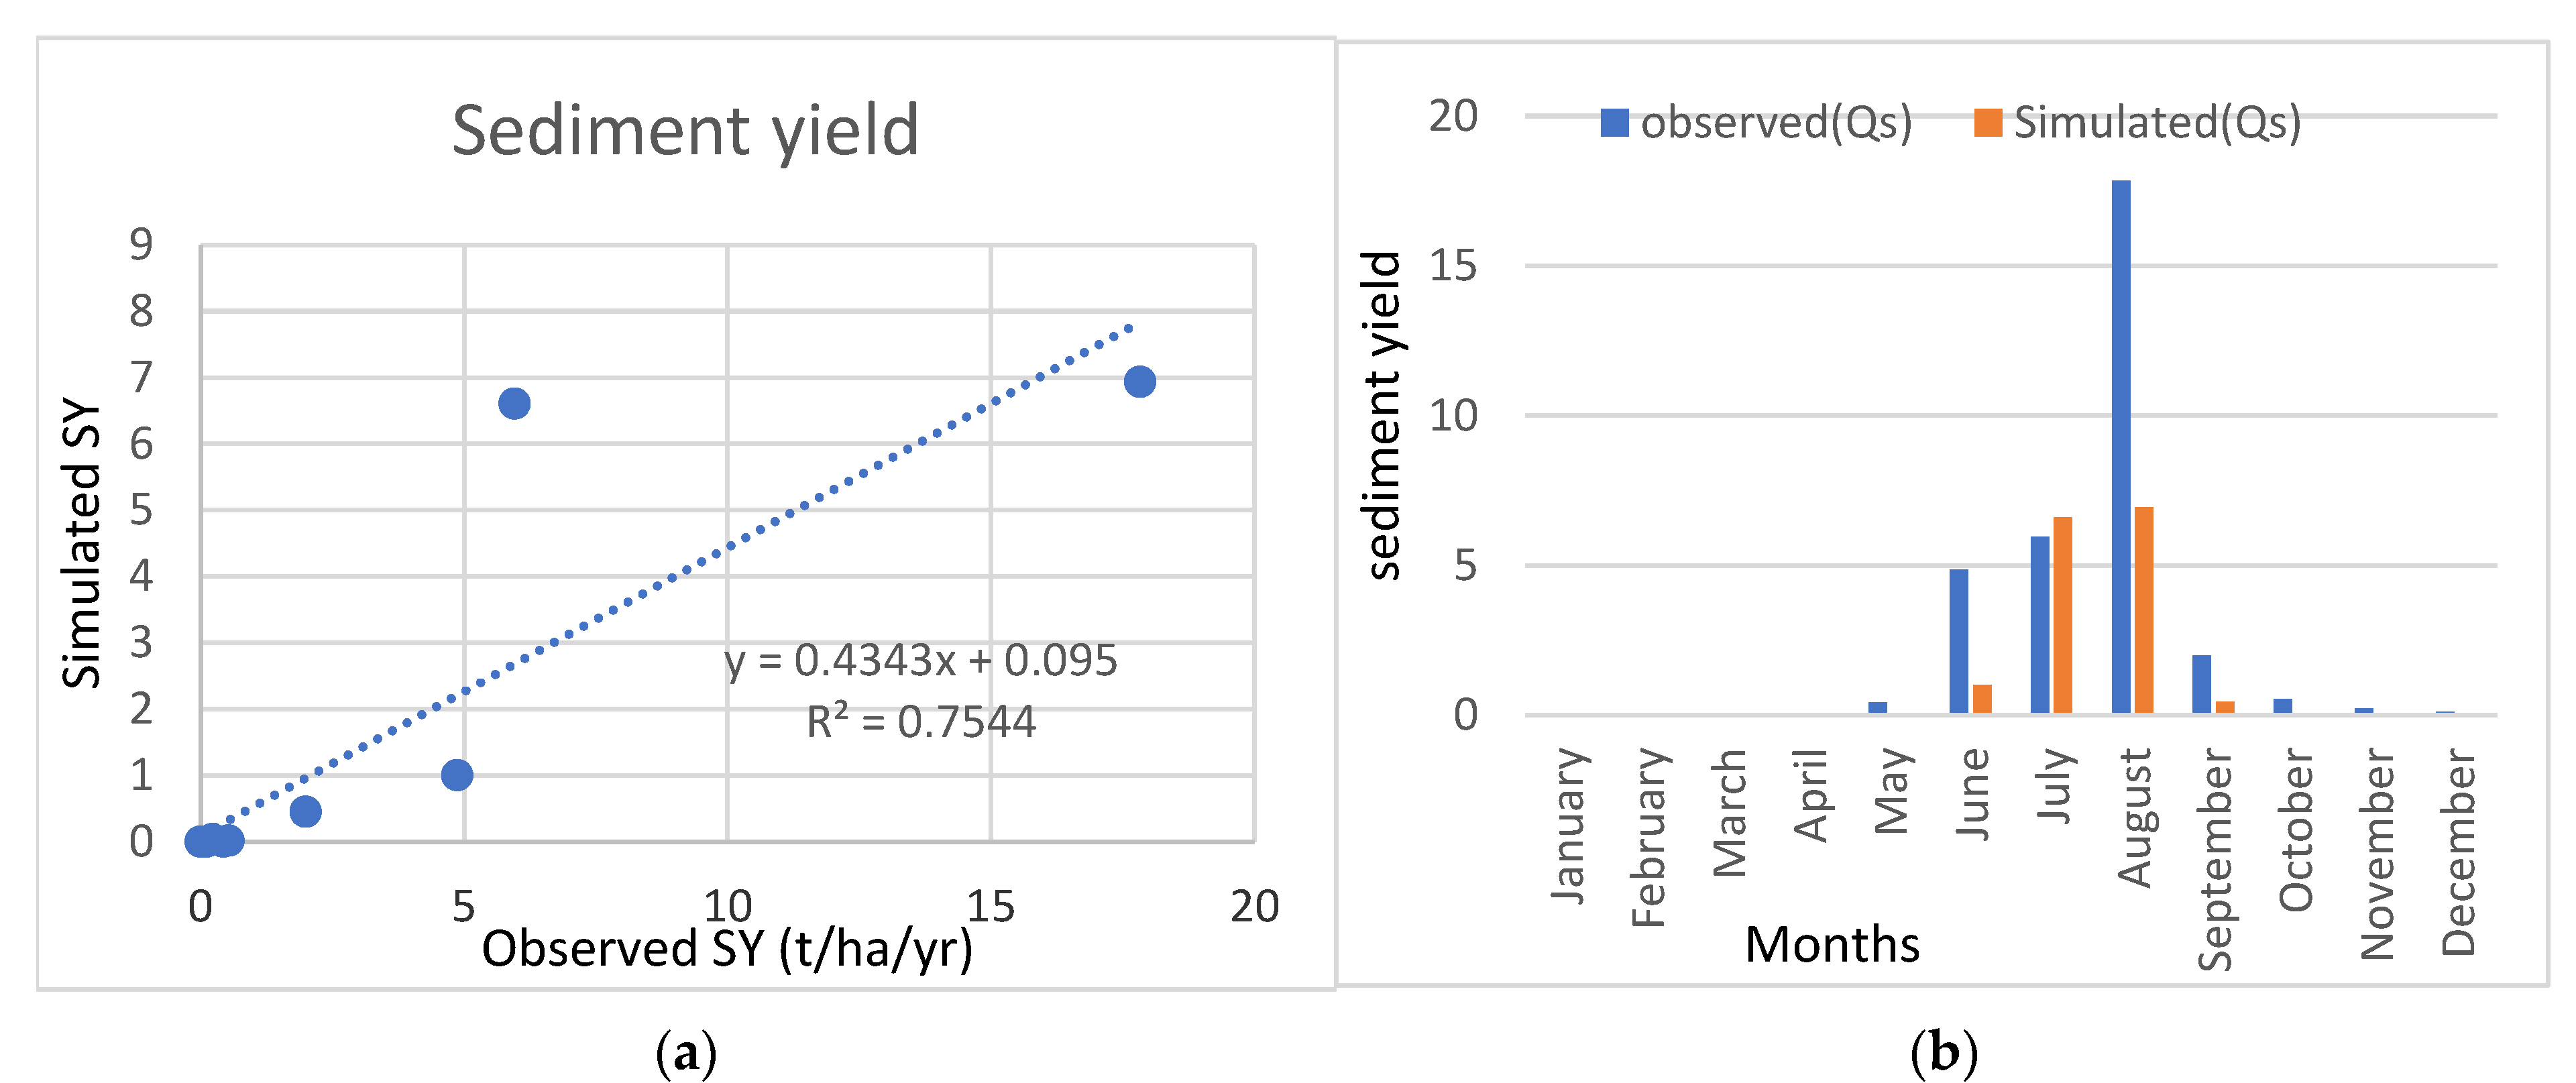
Sensitivity analysis results illustrated that all four soil parameters shall be used to calibrate the model to estimate sediment yield and soil loss within the suggested range for each type of soil. Calibration for sediment yield was performed using the monthly time step data and model performance rating-recommended statistics were computed for the (2000–2002) time period. Visual examination (Figure 8a,b) and test statistics of the R2, NSE, and PBIAS estimation values of 0.69, 0.70, and +3.77%, respectively, showed that calibration gave acceptable model testing results. Before utilizing the model to forecast sediment yield and soil loss at ungauged representative sub-watersheds, validation following calibration is crucial, just as it was performed for runoff. In the validation stage, model performance testing indicators are judged without changing any soil parameter except input climate. Values of R2, NSE, and PBIAS for the validation period (2003–2004) are 0.75, 0.54, and +53.01%, respectively. Percent of bias looks very high, but up to ±55% model estimation is accepted for sediment in the monthly time step evaluation [66].
Following manual calibration, the calibrated four soil parameter values used for model simulation are presented in Table 3 for the three soil types in the Angereb sub-watershed. These parameter values were stored in the GeoWEPP database and used during model validation to estimate runoff, soil loss, and sediment yield for the ungauged sub-watersheds.
The results of the sediment yield rate at the Angereb sub-watershed were also compared with previous works performed with diverse approaches within the same and nearby watersheds (see Table 4), which indicated good agreement with this research. Therefore, the GeoWEPP model can be used to predict runoff, soil loss, and sediment yield for ten representative sub-watersheds in the Megech watershed that incorporate a possible combination of soil, LULC, and slopes.

Sub-Watershed Model Analysis

The GeoWEPP model development was focused on a smaller agricultural watershed area [57,59,79]; therefore, the modeling of smaller spatial scale areas is very important to obtain better runoff, soil loss, and sediment yield results. Ten representative sub-watersheds were selected at varying area sizes, LULC types, soil types, and slope compositions to identify which parameters are affect the rate of soil loss and sediment yield to manage the watershed. For all sub-watersheds, calibrated soil parameters were applied during both offsite and onsite model simulations to obtain soil loss, sediment yield and runoff model outputs at the hill slopes and sub-watershed levels.

Onsite Model Simulation

In the onsite or flow path method, the GeoWEPP model simulation assessment approach aggregation comes after the WEPP run [80]. It can quantify and visualize soil loss at the sub-watershed level, as well as total soil loss for the entire watershed by aggregating the sub-watershed values [81]. The result data illustrates soil loss and deposition rates for each hill slope and distributed flow path (Table 5). The ArcGIS10.2 zonal histogram statistics are used to identify percent frequency distribution for soil loss and deposition classes resulted from the GeoWEPP. Aggregating the last four rows of Table 5, soil erosion rate is higher than the tolerable (10 t/ha/year) for all ten sub-watersheds at 44.95%. That shows that the Megech watershed is under high rates of soil erosion. Sub-watershed 1 is identified with the highest percentage of intolerable erosion rate (67.72%), followed by sub-watershed 3 (52.24%), where watershed management prioritization is applied.

Offsite (Watershed) Method

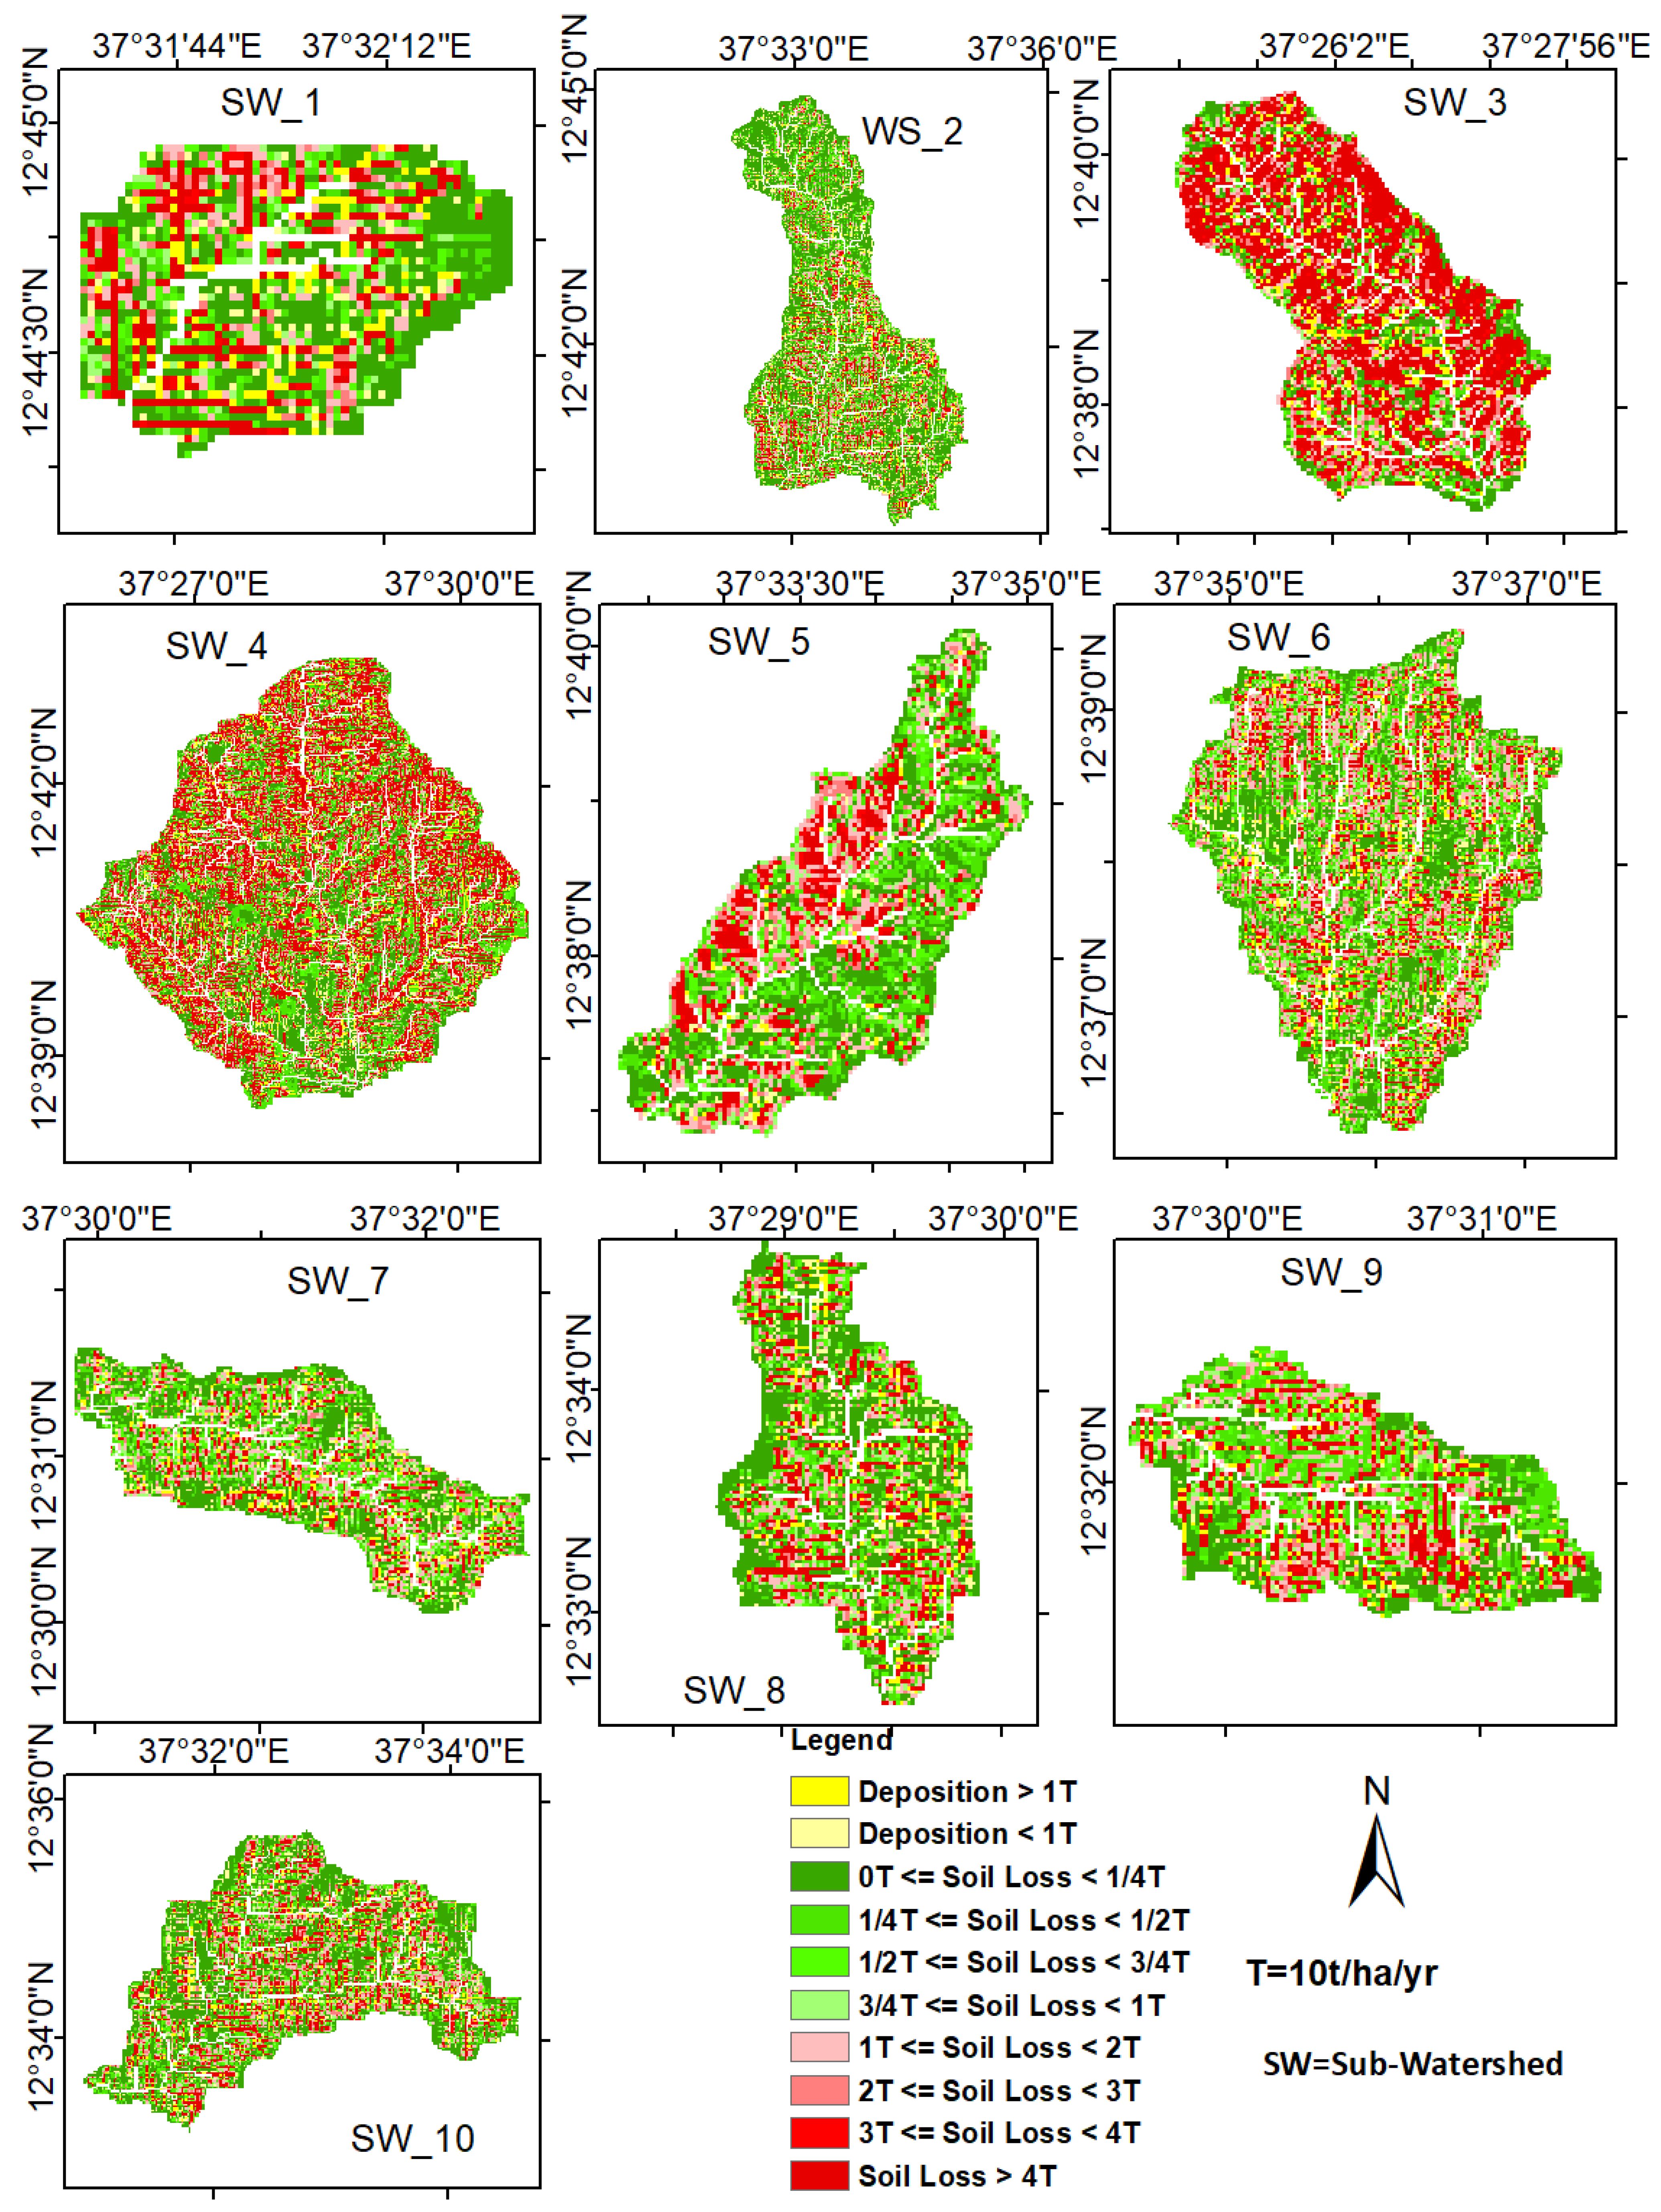
The map of the GeoWEPP onsite model simulation results varied from a deep green to a light green map is designated within the tolerable limit, whereas from light red to deep red colors are soil erosion areas above the tolerable limit. In the case of local sediment deposition rate, deep- and light-yellow colors are for above and below the tolerable limit value, respectively. In Figure 9, model maps can illustrate the spatial distribution of soil erosion and deposition rates for the selected ten sub-watersheds in order to identify hot spot erosion areas for watershed management [79,81].

Offsite (Watershed) Method

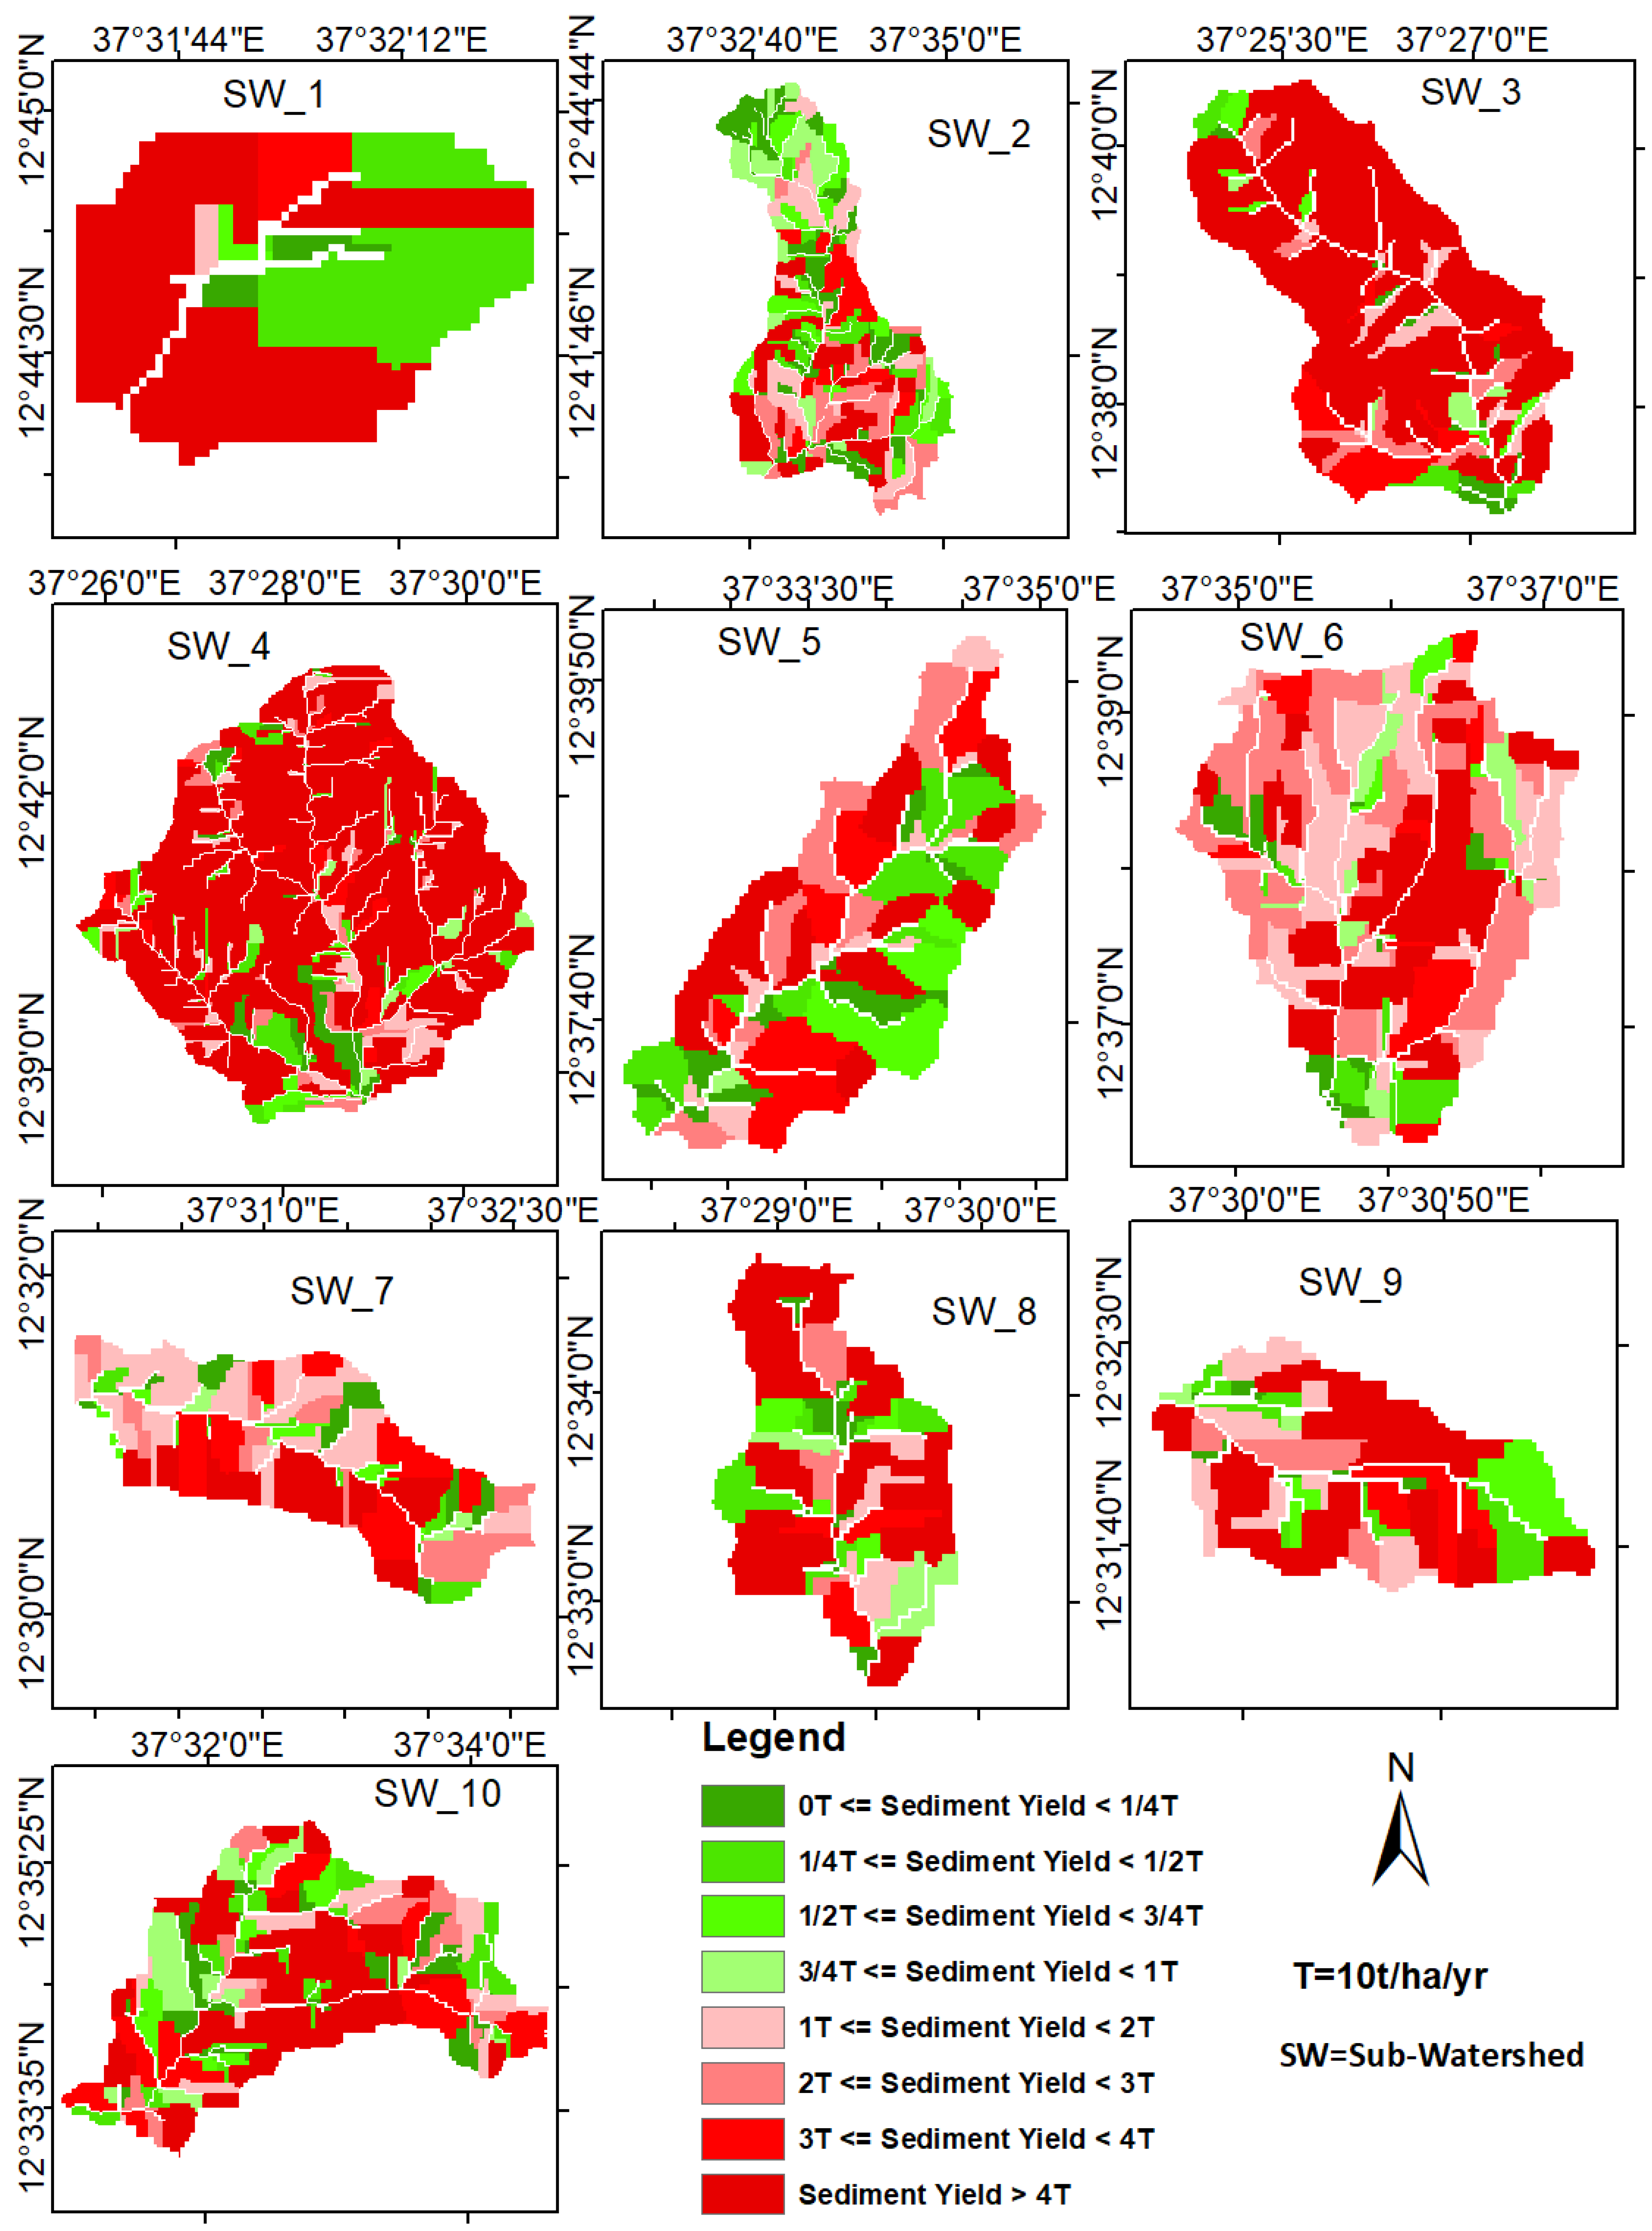
The offsite assessment option aggregation was performed before the WEPP run for the representative hill slopes and channels [80] produced sediment yield at the outlets of the watershed.
Figure 10 shows the GeoWEPP model simulation result using the offsite method; the annual sediment yield (SY) designated by either green or red colors respective to the tolerable or target value (T) of the study area of 10 t/ha/year [63]. Green represents soil erosion that is within the tolerable limit and red is above the tolerable limit areas. A calculated weighted mean SY value for the sample watersheds is (SY = 28.57 t/ha/year), but the design sediment yield for the Megech dam is 11.7 t/ha/year is computed using the composite rating curve method from the neighboring catchments (Gilgel Abbay, Gumara and Rib) due to the sediment yield rate being too low and a lack of records [76]. Therefore, the result of this study is more than two folds of the design sediment indicated watershed management; soil and water conservation measures are very critical to sue the dam to its design life.
In the divided sub-watershed sediment, yield rate results vary from 10.3 t/ha/year to 54.8 t/ha/year due to different compositions of input parameters across the selected ten sub-watersheds (see Table 6). Using the ArcGIS 10.2 zonal histogram tool, the frequency distribution of slope classes, soil, and LULC types of composition, the sediment yield rate across the sub-watershed areas are identified. From this analysis relationship, input variables such as soil type, LULC type, slope steepness, and sediment yield (SY) were identified. For example, in the sub-watershed, 1 SY = 54.8 t/ha/year slopes of steep and very steep slopes of >15% cover 70.15%, cropland (52.17%), bare land (5.23%), eutric leptosols (40.65%), eutric cambsols (38.81%), and eutric nitosols (20.55%). This result indicates the combination of a steep slope and high percent of cultivated land results in a high sediment yield rate. On the other hand, sub-watersheds with a similar percentage of slope steepness and LULC have different sediment yields, for instance, sub-watersheds three and four are due to different soil types. Additionally, sub-watersheds two and five have similar LULC percentages of cultivated and bare land smaller than SY deriving from the slope steepness. Sub-watershed seven, has an SY value of 51.7 t/ha/year. It has eutric leptosols (100%), a steep slope of >15% (74.11%), and cultivated land (68.04%) of the area. From the above examples, it is clear that steep slope, cultivated land, and soil of high rill and inter rill erodibility contributes to high sediment yield rates, yet it cannot be concluded that a single input variable is not a decisive controller for sediment yield rates in the Megech watershed.
Model simulation results specify the mean SY values for all sub-catchments under analysis are higher than tolerable value (10 t/ha/year) with a maximum and minimum value of 54.8 t/ha/year and 10.3 t/ha/year, respectively. Further studies are necessary to identify which input parameter is very important and the degree of contribution within the sub-watershed levels.

4. Discussion

4.1. GeoWEPP Model Performance in Upper Abbay Basin

In this research, we examined the applicability of the GeoWEPP model for the Upper Blue Nile Basin for the estimation of runoff, soil loss, and sediment yield. Model calibration and validation were performed for the years (2000–2002) and (2003–2004), respectively, and some years back due to lack of data because of the duty overlap between the Abbay Basin Authority (ABA) and the Ministry of Water and Energy (MWE) and impossibility of converting recorded data to measurements. The study illustrated that the GeoWEPP, physically-based continuous simulation model performs well in the estimation of runoff, soil loss, and sediment yield in the Megech watershed. The WEPP calibration and validation contain details of topography, plant management, soil, and climate [57]. However, such detailed and continuous data are ideal to calibrate and validate such physically-based hydrological models because of the lack of intensive flow and sediment recorded data at sub-watershed and hillslope levels. To measure model estimation accuracy, simulation results are also compared with previous studies in the area, as is presented in Table 4. Figures designated by Figure 5, Figure 6, Figure 8, and Figure 9 in the Section 3 have shown how model simulation and measured values of runoff and sediment yield replicate in monthly time steps for calibration and validation periods.

4.2. Spatial Variability of Soil Loss (SL) and Sediment Yield (SY)

Table 5 and Figure 11 in the Section 3 from the onsite (flow path) model simulation technique demonstrated the soil loss rates and their spatial variation by comparing them with tolerable soil loss rates (T = 10 t/ha/year). From these results, watershed managers and policymakers can easily identify hot spot soil erosion areas and take cost-effective watershed management actions at agricultural land and hillslope levels. Table 6 summarized the sediment yield rate and sediment delivery ratio results for 10 sub-watershed areas ranging from 162 ha to 4902.2 ha, indicating that model results are not sensitive to the area size of the watershed.
Previous studies in the Angereb sub-watershed using bathymetric techniques and numerical 1-dimensional modeling approaches resulted in an annual sediment yield of 26 t/ha [7] and 42 t/ha [78], and our model resulted in 32.69 t/ha, agreeing with these studies as presented in sub-watershed four in Table 6.
Although the GeoWEPP model produced good results for runoff, soil loss, and sediment yield, it has a limitation in applying to large size watersheds that forced us to divide the Megech watershed into 10 repetitive sub-watersheds to run the model easily and reliably [82] to predict downstream impacts sediment yield and to identify the critical sediment source area and the model in the studied watershed. In this study, we used spatial data such as soil, LULC, and DEM resolutions of 30 m × 30 m and further investigation of finer resolution at the plot level to obtain a better result. Future studies also shall check the model performance for longer data points if the basin limitation is improved or uses continuously recorded sediment data rather than using the rating curve results as a model comparison. In this research, climate variability within the watershed was not considered rather mean watershed climate was considered in the simulation. Therefore, another study that considered the spatial variability of climates within the study area shall be conducted.

5. Conclusions

In this study, the GeoWEPP model was used to simulate the soil erosion, sediment yield, and runoff in the Megech watershed, Upper Blue Nile, Ethiopia. It is verified that the GeoWEPP can be used to predict soil loss, sediment yield, and runoff in the Megech dam watershed with acceptable model accuracy. Parameter sensitivity analysis showed that runoff is only sensitive to hydraulic conductivity, whereas sediment yield and soil loss are sensitive to rill erodibility (Kr), hydraulic conductivity (Ke), critical shear stress (τc), and inter rill erodibility (Ki), in varying order across soil types in the watershed. Model calibration was performed for both runoff and sediment yield at the Angereb sub-watershed, with a R2, NSE, and PBIAS, respectively, of 0.94, 0.94, and −2.41% for runoff; and 0.69, 0.70, and +3.77% for sediment yield. On the other hand, during the validation period, the R2, NSE, and PBIAS, respectively, were 0.75, 0.65, and −38.77% for runoff; and were 0.75, 0.54, and +53.01% for sediment yield. The results of flow path (onsite) maps are very important for visualizing soil loss and deposition rates in relation to tolerable soil loss or target values, as well as for identifying erosion hotspot areas and making decisions on soil and water conservation measures. The offsite model assessment method to rank the degree of urgency by sub-watersheds to watershed management to reduce impacts of sedimentation [83]. Sediment yield varies from 10.3/ha/year to 54.8 t/ha/year across selected sub-watersheds, and this variation is due to varying land cover and slope, which is also influenced by rainfall patterns and soil erodibility [5,15]. In general, the study suggested that the local government should implement the best watershed management practices to reduce soil erosion in the study basin.

Author Contributions

Conceptualization, M.A. and A.M.M.; methodology, M.A.; software, M.A.; validation, M.A.; formal analysis, M.A.; investigation, M.A.; resources, M.A.; data curation, M.A.; writing—original draft preparation, M.A.; writing—review and editing, M.A., G.T., A.M.M., G.T. and B.A.; visualization, M.A.; supervision, A.M.M. and B.A.; project administration, M.A., A.M.M., G.T. and B.A.; funding acquisition, M.A. All authors have read and agreed to the published version of the manuscript.

Funding

The first author recognizes the fund provided by the Ministry of Education (MoE) of Ethiopia for the doctoral research.

Data Availability Statement

Data can be obtained on the request of the corresponding author.

Acknowledgments

The authors would like to thank the data providers, the Ministry of Water and Energy (MWE), the Abbay Basin Authority for their assistance (ABA), and the National Meteorological Agency (NAMA). The authors express their sincere thanks to reviewers and the editor for their comments to improve publication quality.

Conflicts of Interest

The authors declare that there have no known competing financial interests or personal relationships that could have appeared to influence the work reported in this paper.

References

  1. Bewket, W.; Teferi, E. Assessment of soil erosion hazard and prioritization for treatment at the watershed level: Case study in the Chemoga watershed, Blue Nile basin, Ethiopia. Land Degrad. Dev. 2009, 20, 609–622. [Google Scholar] [CrossRef]
  2. Prokop, P.; Poreba, G.J. Soil erosion associated with an upland farming system under population pressure in northeast india. Land Degrad. Dev. 2012, 23, 310–321. [Google Scholar] [CrossRef]
  3. Tamene, L.; Park, S.J.; Dikau, R.; Vlek, P.L.G. Reservoir siltation in the semi-arid highlands of Northern Ethiopia: Sediment yield—catchment area relationship and a semi-quantitative approach for predicting sediment yield. Earth Surf. Process. Landforms 2006, 31, 1364–1383. [Google Scholar] [CrossRef]
  4. De Araújo, J.C.; Güntner, A.; Bronstert, A. Loss of reservoir volume by sediment deposition and its impact on water availability in semiarid Brazil. Hydrol. Sci. J. 2006, 51, 157–170. [Google Scholar] [CrossRef]
  5. Getahun, M.M. Sustaining Reservoir Use through Sediment Trapping in NW Ethiopia; Wageningen University: Wageningen, The Netherlands, 2016; ISBN 9789462579101. [Google Scholar]
  6. Schleiss, A.J.; Franca, M.J.; Juez, C.; De Cesare, G. Reservoir sedimentation. J. Hydraul. Res. 2016, 54, 595–614. [Google Scholar] [CrossRef]
  7. Haregeweyn, N.; Melesse, B.; Tsunekawa, A.; Tsubo, M.; Meshesha, D.; Balana, B.B. Reservoir sedimentation and its mitigating strategies: A case study of Angereb reservoir (NW Ethiopia). J. Soils Sediments 2012, 12, 291–305. [Google Scholar] [CrossRef]
  8. Haregeweyn, N.; Tsunekawa, A.; Tsubo, M.; Meshesha, D.; Poesen, J.; Nyssen, J.; Deckers, J. Reservoir Sedimentation and Its Mitigation Strategies: A Case Study of the Ethiopian Highlands. Available online: https://www.semanticscholar.org/paper/Reservoir-sedimentation-and-its-mitigation-%3A-a-case-Haregeweyn-Tsunekawa/63afffe1d8d0be3b7cf62b786e221ad4b13fdae6 (accessed on 19 October 2022).
  9. Alemaw, D.; Ayana, E.K.; Legesse, E.S.; Moges, M.M.; Tilahun, S.A.; Moges, M.A. Estimating reservoir sedimentation using bathymetric differencing and hydrologic modeling in data scarce Koga watershed, Upper Blue Nile, Ethiopia. J. Agric. Environ. Int. Dev. 2016, 110, 413–427. [Google Scholar] [CrossRef]
  10. Sharma, T. Scientific Paper on Sedimentation Challenges in Hydro-Power Storage Projects (Reservoir) and it’s Mitigation Measures. Int. J. Innov. Sci. Res. Technol. 2020, 5, 1240–1249. [Google Scholar] [CrossRef]
  11. Tsegaye, L.; Bharti, R. Soil erosion and sediment yield assessment using RUSLE and GIS-based approach in Anjeb watershed, Northwest Ethiopia. SN Appl. Sci. 2021, 3, 1–19. [Google Scholar] [CrossRef]
  12. Ayele, G.T.; Kuriqi, A.; Jemberrie, M.A.; Saia, S.M.; Seka, A.M.; Teshale, E.Z.; Daba, M.H.; Ahmad Bhat, S.; Demissie, S.S.; Jeong, J.; et al. Sediment Yield and Reservoir Sedimentation in Highly Dynamic Watersheds: The Case of Koga Reservoir, Ethiopia. Water 2021, 13, 3374. [Google Scholar] [CrossRef]
  13. Annandale, G.W.; Randle, T.J.; Langendoen, E.J.; Hotchkiss, R.H. Reservoir Sedimentation Management: A Sustainable Development Challenge. Hydrolink 2018, 3, 72–75. [Google Scholar]
  14. Bolsenkötter, L.; Küppers, J.; Lothmann, R. Sustainable dams in vital river systems—relevance of sediment balance. In Sustainable and Safe Dams Around the World; CRC Press: Boca Raton, FL, USA, 2019. [Google Scholar]
  15. Ebabu, K.; Tsunekawa, A.; Haregeweyn, N.; Adgo, E.; Meshesha, D.T.; Aklog, D.; Masunaga, T.; Tsubo, M.; Sultan, D.; Fenta, A.A.; et al. Analyzing the variability of sediment yield: A case study from paired watersheds in the Upper Blue Nile basin, Ethiopia. Geomorphology 2018, 303, 446–455. [Google Scholar] [CrossRef]
  16. Ouri, A.E.; Golshan, M.; Janizadeh, S.; Cerdà, A.; Melesse, A.M. Soil Erosion Susceptibility Mapping in Kozetopraghi Catchment, Iran: A Mixed Approach Using Rainfall Simulator and Data Mining Techniques. Land 2020, 9, 368. [Google Scholar] [CrossRef]
  17. Setegn, S.G.; Srinivasan, R.; Dargahi, B.; Melesse, A.M. Spatial delineation of soil erosion vulnerability in the Lake Tana Basin, Ethiopia. Hydrol. Process. 2009, 23, 3738–3750. [Google Scholar] [CrossRef]
  18. Mekonnen, M.; Melesse, A.M. Soil Erosion Mapping and Hotspot Area Identification Using GIS and Remote Sensing in Northwest Ethiopian Highlands, Near Lake Tana. In Nile River Basin; Springer: Berlin/Heidelberg, Germany, 2011. [Google Scholar]
  19. Admas, B.F.; Gashaw, T.; Adem, A.A.; Worqlul, A.W.; Dile, Y.T.; Molla, E. Identification of soil erosion hot-spot areas for prioritization of conservation measures using the SWAT model in Ribb watershed, Ethiopia. Resour. Environ. Sustain. 2022, 8, 100059. [Google Scholar] [CrossRef]
  20. Andualem, T.G.; Hagos, Y.G.; Kefale, A.; Zelalem, B. Soil erosion-prone area identification using multi-criteria decision analysis in Ethiopian highlands. Model. Earth Syst. Environ. 2020, 6, 1407–1418. [Google Scholar] [CrossRef]
  21. Negash, D.A.; Moisa, M.B.; Merga, B.B.; Sedeta, F.; Gemeda, D.O. Soil erosion risk assessment for prioritization of sub-watershed: The case of Chogo Watershed, Horo Guduru Wollega, Ethiopia. Environ. Earth Sci. 2021, 80, 1–11. [Google Scholar] [CrossRef]
  22. Gilbert, N.; Riveros, L.C. Assessment of soil erosion of Burundi using remote sensing and GIS by RUSLE model. Вестник Рoссийскoгo университета дружбы нарoдoв 2019, 27, 17–28. [Google Scholar] [CrossRef]
  23. Betela, B.; Wolka, K. Evaluating soil erosion and factors determining farmers’ adoption and management of physical soil and water conservation measures in Bachire watershed, southwest Ethiopia. Environ. Chall. 2021, 5, 100348. [Google Scholar] [CrossRef]
  24. Porto, P.; Walling, D.E. Use of 7Be measurements to estimate rates of soil loss from cultivated land: Testing a new approach applicable to individual storm events occurring during an extended period. Water Resour. Res. 2014, 50, 8300–8313. [Google Scholar] [CrossRef]
  25. Weggel, J.R.; Rustom, R. Soil erosion by rainfall and runoff-state of the art. Geotext. Geomembr. 1992, 11, 551–572. [Google Scholar] [CrossRef]
  26. Liu, G.; Yang, M.Y.; Warrington, D.N.; Liu, P.L.; Tian, J.L. Using beryllium-7 to monitor the relative proportions of interrill and rill erosion from loessal soil slopes in a single rainfall event. Earth Surf. Process. Landforms 2010, 36, 439–448. [Google Scholar] [CrossRef]
  27. Goulet, M.; Gallichand, J.; Duchemin, M.; Giroux, M. Measured and computed phosphorus losses by runoff and subsurface drainage in eastern Canada. Appl. Eng. Agric. 2006, 22, 203–213. [Google Scholar] [CrossRef]
  28. Ferreira, C.S.S.; Seifollahi-Aghmiuni, S.; Destouni, G.; Ghajarnia, N.; Kalantari, Z. Soil degradation in the European Mediterranean region: Processes, status and consequences. Sci. Total Environ. 2022, 805, 150106. [Google Scholar] [CrossRef]
  29. Kastridis, A.; Stathis, D.; Sapountzis, M.; Theodosiou, G. Insect Outbreak and Long-Term Post-Fire Effects on Soil Erosion in Mediterranean Suburban Forest. Land 2022, 11, 911. [Google Scholar] [CrossRef]
  30. Yibeltal, M.; Tsunekawa, A.; Haregeweyn, N.; Adgo, E.; Meshesha, D.T.; Aklog, D.; Masunaga, T.; Tsubo, M.; Billi, P.; Vanmaercke, M.; et al. Analysis of long-term gully dynamics in different agro-ecology settings. Catena 2019, 179, 160–174. [Google Scholar] [CrossRef]
  31. Fulajtár, E. Identification of Severely Eroded Soils from Remote Sensing Data Tested in Rišňovce, Slovakia. In Proceedings of the 10th International Soil Conservation Organization Meeting, West Lafayette, IN, USA, 24–29 May 1999. [Google Scholar]
  32. Shahin, M.M.A. An overview of reservoir sedimentation in some African river basins. IAHS Publ. 1993, 93–100. [Google Scholar]
  33. Margiorou, S.; Kastridis, A.; Sapountzis, M. Pre/Post-Fire Soil Erosion and Evaluation of Check-Dams Effectiveness in Mediterranean Suburban Catchments Based on Field Measurements and Modeling. Land 2022, 11, 1705. [Google Scholar] [CrossRef]
  34. Sinshaw, B.G.; Belete, A.M.; Mekeonen, B.M.; Wubetu, T.G.; Lakew, T.; Dessie, W.; Atinkut, H.B.; Adugna, A.; Bilkew, T.; Tefera, A.K.; et al. Watershed-based soil erosion and sediment yield modeling in the Rib watershed of the Upper Blue Nile Basin, Ethiopia. Energy Nexus 2021, 3, 100023. [Google Scholar] [CrossRef]
  35. Yesuf, H.M.; Assen, M.; Alamirew, T.; Melesse, A.M. Catena Modeling of sediment yield in Maybar gauged watershed using SWAT, northeast Ethiopia. CATENA 2015, 127, 191–205. [Google Scholar] [CrossRef]
  36. Wang, Z.; Hu, C. Strategies for managing reservoir sedimentation. Int. J. Sediment Res. 2010, 24, 369–384. [Google Scholar] [CrossRef]
  37. Bezak, N.; Mikoš, M.; Borrelli, P.; Alewell, C.; Alvarez, P.; Anache, J.A.A.; Baartman, J.; Ballabio, C.; Biddoccu, M.; Cerdà, A.; et al. Soil erosion modelling: A bibliometric analysis. Environ. Res. 2021, 197, 111087. [Google Scholar] [CrossRef] [PubMed]
  38. Pandey, A.; Himanshu, S.K.; Mishra, S.K.; Singh, V.P. Physically based soil erosion and sediment yield models revisited. Catena 2016, 147, 595–620. [Google Scholar] [CrossRef]
  39. Zhang, L.; O’Neill, A.L.; Lacey, S. Modelling approaches to the prediction of soil erosion in catchments. Environ. Softw. 1996, 11, 123–133. [Google Scholar] [CrossRef]
  40. Hajigholizadeh, M.; Melesse, A.M.; Fuentes, H.R. Erosion and sediment transport modelling in shallowwaters: A review on approaches, models and applications. Int. J. Environ. Res. Public Health 2018, 15, 518. [Google Scholar] [CrossRef] [Green Version]
  41. Borrelli, P.; Alewell, C.; Alvarez, P.; Anache, J.A.A.; Baartman, J.; Ballabio, C.; Bezak, N.; Biddoccu, M.; Cerdà, A.; Chalise, D.; et al. Soil erosion modelling: A global review and statistical analysis. Sci. Total Environ. 2021, 780, 146494. [Google Scholar] [CrossRef]
  42. Benavidez, R.; Bethanna, J.; Deborah, M.; Kevin, N. A review of the (Revised) Universal Soil Loss Equation ((R)USLE): With a view to increasing its global applicability and improving soil loss estimates. Hydrol. Earth Syst. Sci. 2018, 22, 6059–6086. [Google Scholar] [CrossRef] [Green Version]
  43. Igwe, P.U.; Onuigbo, A.A.; Chinedu, O.C.; Ezeaku, I.I.; Muoneke, M.M. Soil Erosion: A Review of Models and Applications. Int. J. Adv. Eng. Res. Sci. 2017, 4, 138–150. [Google Scholar] [CrossRef]
  44. Defersha, M.B.; Melesse, A.M.; McClain, M.E. Watershed scale application of WEPP and EROSION 3D models for assessment of potential sediment source areas and runoff flux in the Mara River Basin, Kenya. Catena 2012, 95, 63–72. [Google Scholar] [CrossRef]
  45. Defersha, M.B.; Melesse, A.M. Catena Field-scale investigation of the effect of land use on sediment yield and runoff using runoff plot data and models in the Mara River basin, Kenya. Catena 2012, 89, 54–64. [Google Scholar] [CrossRef]
  46. Han, F.; Ren, L.; Zhang, X.; Li, Z. The WEPP Model Application in a Small Watershed in the Loess Plateau. PLoS ONE 2016, 11, e0148445. [Google Scholar] [CrossRef] [PubMed] [Green Version]
  47. Hu, Y.; Gao, M. Batunacun Evaluations of water yield and soil erosion in the Shaanxi-Gansu Loess Plateau under different land use and climate change scenarios. Environ. Dev. 2020, 34, 100488. [Google Scholar] [CrossRef]
  48. Singh, R.K.; Panda, R.K.; Satapathy, K.K.; Ngachan, S.V. Simulation of runoff and sediment yield from a hilly watershed in the eastern Himalaya, India using the WEPP model. J. Hydrol. 2011, 405, 261–276. [Google Scholar] [CrossRef]
  49. Amaru, K.; Hotta, N. Application of GeoWEPP for Evaluating Sediment Yield in a Mountain Area: Agatsuma Watershed, Japan. Int. J. Eros. Control Eng. 2018, 11, 1–14. [Google Scholar] [CrossRef] [Green Version]
  50. Meinen, B.U.; Robinson, D.T. Agricultural erosion modelling: Evaluating USLE and WEPP field-scale erosion estimates using UAV time-series data. Environ. Model. Softw. 2021, 137, 104962. [Google Scholar] [CrossRef]
  51. Tiwari, A.K.; Risse, L.M.; Nearing, M.A. Evaluation of WEPP and its comparison with USLE and RUSLE. Trans. Am. Soc. Agric. Eng. 2000, 43, 1129–1135. [Google Scholar] [CrossRef]
  52. Amore, E.; Modica, C.; Nearing, M.A.; Santoro, V.C. Scale effect in USLE and WEPP application for soil erosion computation from three Sicilian basins. J. Hydrol. 2004, 293, 100–114. [Google Scholar] [CrossRef]
  53. Shen, Z.Y.; Gong, Y.W.; Li, Y.H.; Hong, Q.; Xu, L.; Liu, R.M. A comparison of WEPP and SWAT for modeling soil erosion of the Zhangjiachong Watershed in the Three Gorges Reservoir Area. Agric. Water Manag. 2009, 96, 1435–1442. [Google Scholar] [CrossRef]
  54. Afshar, A.A.; Hassanzadeh, Y. Determination of monthly hydrological erosion severity and runoff in torogh dam watershed basin using SWAT and WEPP Models. Iran. J. Sci. Technol.-Trans. Civ. Eng. 2017, 41, 221–228. [Google Scholar] [CrossRef]
  55. Ogwo, V.; Ogbu, K.N.; Okoye, C.J.; Okechukwu, M.E.; Mbajiorgu, C.C. Comparison of soil erosion models for application in the humid tropics. Hydrol. Disaster Manag. 2012, 266–278. [Google Scholar]
  56. Flanagan, D.C.; Nearing, M.A. USDA Water Erosion Prediction Project: Hillslope Profile and Watershed Model Documentation. In USDA-ARS National Soil Erosion Laboratory Report No. 10; United States Department of Agriculture: Washington, DC, USA, 1995. [Google Scholar]
  57. Flanagan, D.; Frankenberger, J. Ascough II, WEPP: Model use, calibration, and validation. Trans. ASABE 2012, 55, 1463–1477. [Google Scholar] [CrossRef]
  58. Foster, G.R.; Lane, L.J. User Requirements: USDA Water Erosion Prediction Project (WEPP); NSERL Report No. 1; USDA-ARS National Soil Erosion Research Laboratory: West Lafayette, IN, USA, 1987.
  59. Renschler, C.S.; Flanagan, D.C.; Engel, B.A.; Frankenberger, J.R. GeoWEPP—The Geo-spatial interface for the Water Erosion Prediction Project. In Proceedings of the 2002 ASAE Annual Meeting, Chicago, IL, USA, 18–31 July 2002; American Society of Agricultural and Biological Engineers: St. Joseph, MI, USA, 2002. [Google Scholar] [CrossRef] [Green Version]
  60. Renschler, C.S. Designing geo-spatial interfaces to scale process models: The GeoWEPP approach. Hydrol. Process. 2003, 17, 1005–1017. [Google Scholar] [CrossRef]
  61. Flanagan, D.C.; Frankenberger, J.R.; Cochrane, T.A.; Renschler, C.S.; Elliot, W.J. Geospatial application of the water erosion prediction project (WEPP) model. Trans. ASABE 2013, 56, 591–601. [Google Scholar] [CrossRef] [Green Version]
  62. Xiong, H.; Goergen, J.; Yasumiishi, M.; Renschler, C.S. GeoWEPP for ArcGIS 10.x Version Overview Manual. Available online: http://geowepp.geog.buffalo.edu/wp-content/uploads/2014/01/GeoWEPP_ArcGIS10_Overview.pdf (accessed on 18 January 2021).
  63. Melaku, N.D.; Renschler, C.S.; Flagler, J.; Bayu, W.; Klik, A. Integrated impact assessment of soil and water conservation structures on runoff and sediment yield through measurements and modeling in the Northern Ethiopian highlands. Catena 2018, 169, 140–150. [Google Scholar] [CrossRef]
  64. Reis, M.; Altun Aladag, I.; Bolat, N.; Dutal, H. Using Geowepp Model to Determine Sediment Yield and Runoff in the Keklik Watershed in Kahramanmaras, Turkey. Šumarski List. 2017, 116, 563–569. [Google Scholar] [CrossRef]
  65. Daly, C.; Neilson, R.P.; Phillips, D.L. A statistical-topographic model for mapping climatological precipitation over mountainous terrain. J. Appl. Meteorol. 1994, 33, 140–158. [Google Scholar] [CrossRef]
  66. Moriasi, D.N.; Arnold, J.G.; van Liew, M.W.; Bingner, R.L.; Harmel, R.D.; Veith, T.L. Model Evaluation Guidelines for Systematic Quantification of Accuracy in Watershed Simulations. Trans. ASABE 2007, 50, 885–900. [Google Scholar] [CrossRef]
  67. Al-Mukhtar, M.; Dunger, V.; Merkel, B. Runoff and sediment yield modeling by means of WEPP in the Bautzen dam catchment, Germany. Environ. Earth Sci. 2014, 72, 2051–2063. [Google Scholar] [CrossRef]
  68. Pandey, A.; Chowdary, V.M.; Mal, B.C.; Billib, M. Runoff and sediment yield modeling from a small agricultural watershed in India using the WEPP model. J. Hydrol. 2008, 348, 305–319. [Google Scholar] [CrossRef]
  69. Flanagan, D.C.; Livingston, S.J. WEPP User Summary: USDA-Water Erosion Prediction Project (WEPP); NSERL Report No. 11; USDA-ARS National Soil Erosion Research Laboratory: West Lafayette, IN, USA, 1995.
  70. Yousuf, A.; Bhardwaj, A.; Tiwari, A.K.; Bhatt, V.K. Simulation of runoff and sediment yield from a forest micro watershed in Shivalik foothills using WEPP Model. Indian J. Soil Conserv. 2017, 45, 21–27. [Google Scholar]
  71. Gray, J.R.; Simões, F.J.M.; Introduction, D. Estimating Sediment Discharge. Sediment. Eng.–Process. Meas. Model. Pract. 2008, 110, 1065–1086. [Google Scholar]
  72. Ali, Y.S.A.; Crosato, A.; Mohamed, Y.A.; Abdalla, S.H.; Wright, N.G. Sediment balances in the Blue Nile River Basin. Int. J. Sediment Res. 2014, 29, 316–328. [Google Scholar] [CrossRef]
  73. Moges, M.M.; Abay, D.; Engidayehu, H. Investigating reservoir sedimentation and its implications to watershed sediment yield: The case of two small dams in data-scarce upper Blue Nile Basin, Ethiopia. Lakes Reserv. Res. Manag. 2018, 23, 217–229. [Google Scholar] [CrossRef]
  74. Assfaw, A.T. Calibration, Validation and Performance Evaluation of Swat Model for Sediment Yield Modelling in Megech Reservoir Catchment, Ethiopia. J. Environ. Geogr. 2019, 12, 21–31. [Google Scholar] [CrossRef]
  75. Assfaw, A.T. Modeling Impact of Land Use Dynamics on Hydrology and Sedimentation of Megech Dam Watershed, Ethiopia. Sci. World J. 2020, 2020, 6530278. [Google Scholar] [CrossRef]
  76. Water Works Design and Supervision Enterprize (WWDSE) Megech Dam Detail Design Document. Addis Abeba, Ethiopia 2009, VI. Available online: https://addisbiz.com/business-directory/11316-water-works-design-supervision-enterprise-wwdse (accessed on 20 March 2020).
  77. Balabathina, V.N.; Raju, R.P.; Mulualem, W.; Tadele, G. Estimation of soil loss using remote sensing and GIS-based universal soil loss equation in northern catchment of Lake Tana Sub-basin, Upper Blue Nile Basin, Northwest Ethiopia. Environ. Syst. Res. 2020, 9, 1–32. [Google Scholar] [CrossRef]
  78. Zeleke, T.; Moussa, A.M.; El-manadely, M.S. Prediction of sediment inflows to Angereb dam reservoir using the SRH-1D sediment transport model. Sci. Policy Manag. Sustain. Use 2013, 18, 366–371. [Google Scholar] [CrossRef]
  79. Poeppl, R.E.; Dilly, L.A.; Haselberger, S.; Renschler, C.S.; Baartman, J.E.M. Combining Soil Erosion Modeling with Connectivity Analyses to Assess Lateral Fine Sediment Input into Agricultural Streams. Water 2019, 11, 1793. [Google Scholar] [CrossRef] [Green Version]
  80. Klein, L.R.; Hendrix, W.G.; Lohr, V.I.; Kaytes, J.B.; Sayler, R.D.; Swanson, M.E.; Elliot, W.J.; Reganold, J.P. Linking ecology and aesthetics in sustainable agricultural landscapes: Lessons from the Palouse region of Washington, U.S.A. Landsc. Urban Plan. 2015, 134, 195–209. [Google Scholar] [CrossRef]
  81. Singh, A.K.; Kumar, S.; Naithani, S. Modelling runoff and sediment yield using GeoWEPP: A study in a watershed of lesser Himalayan landscape, India. Model. Earth Syst. Environ. 2021, 7, 2089–2100. [Google Scholar] [CrossRef]
  82. Dutal, H.; Reis, M. Identification of priority areas for sediment yield reduction by using a GeoWEPP-based prioritization approach. Dutal, H.; Reis, M. Identification of priority areas for sediment yield reduction by using a GeoWEPP-based prioritization approach. Arab. J. Geosci. 2020, 13, 1–11. [Google Scholar] [CrossRef]
  83. Pandey, A.; Chowdary, V.M.; Mal, B.C.; Billib, M. Application of the WEPP model for prioritization and evaluation of best management practices in an Indian watershed. Hydrol. Process. 2009, 23, 2997–3005. [Google Scholar] [CrossRef]
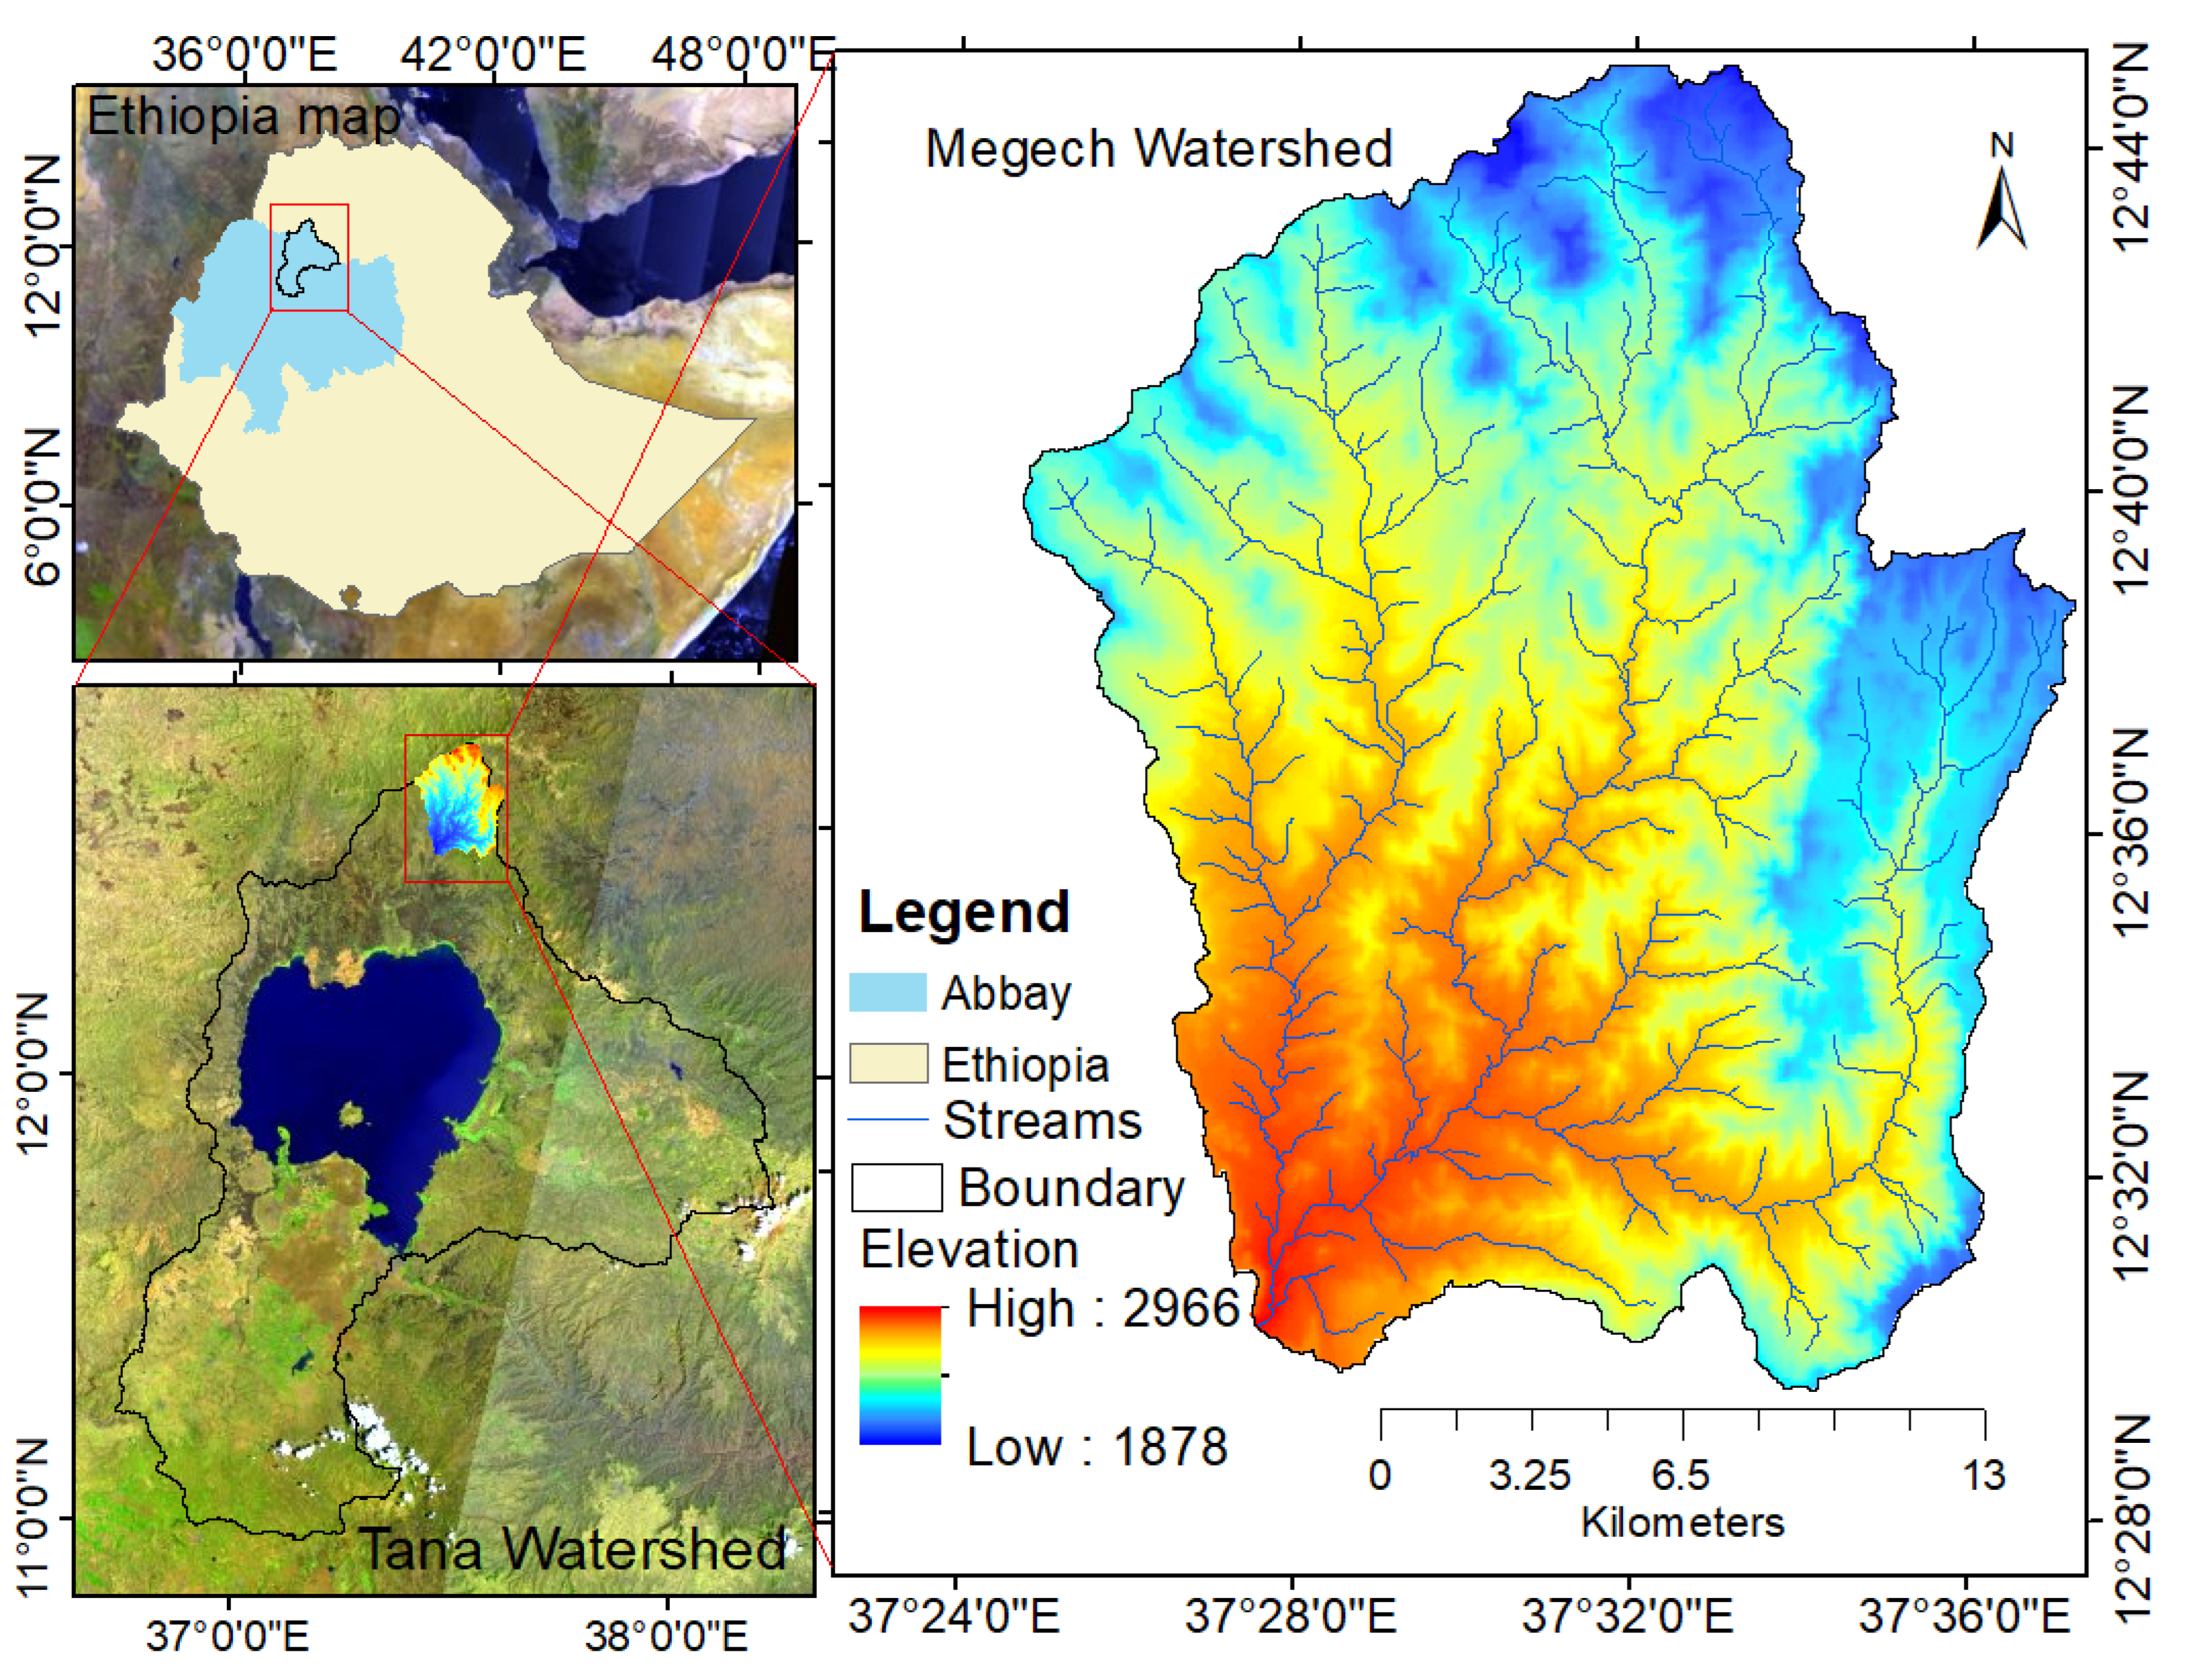
Figure 1. Study area map.
Hydrology 09 00208 g001
Figure 2. Methodology flow chart and descriptions of the CSA-Critical Source Area, MSCL-Minimum Source Channel Length, and CLIGEN-Climate Generator.
Hydrology 09 00208 g002
Figure 3. Land use land cover map for the Megech watershed.
Hydrology 09 00208 g003
Figure 4. Soil map.
Figure 4. Soil map.
Hydrology 09 00208 g004
Figure 5. Runoff calibration period (2000–2002). (a) Observed versus simulated runoff; (b) Mean monthly runoff depth.
Hydrology 09 00208 g005
Figure 6. Model validation runoff (2003–2004). (a) Observed versus simulated runoff; (b) Mean monthly observed and simulated runoff depths.
Hydrology 09 00208 g006
Figure 7. Rating curve for the Angereb sub-watershed.
Hydrology 09 00208 g007
Figure 8. Calibration period (2000–2002). (a) Observed versus simulated sediment yield, and (b) Monthly sediment yield.
Hydrology 09 00208 g008
Figure 9. Validation period (2003–2004). (a) Observed versus simulated sediment yield; (b) Observed and simulated monthly sediment delivery rates.
Hydrology 09 00208 g009
Figure 10. Offsite (watershed) method of the GeoWEPP model simulation for ten selected sub-watersheds (sediment yield map) relative to tolerable (T) value.
Hydrology 09 00208 g010
Figure 11. Onsite (flow path) method of the GeoWEPP model simulation annual soil loss and deposition rates relative to the tolerable (T = 10 t/ha/year.) soil loss rates for 10 sub-watersheds.
Hydrology 09 00208 g011
Table 1. Slope classes as per FAO 2002.
Slope (%)CharacteristicsArea (Km2)Percent Distribution (%)Sensitivity Index
0–2Flat2.700.64%0
2–5Gentle undulating19.194.52%4
5–10Undulating58.2813.73%8
10–15Rolling57.1013.45%12
15–30Moderately steep125.3129.52%16
>30Steep161.9638.15%20
Table 2. Sensitivity ratio for the Angereb sub-watershed by soil types.
Soil TypeFAO SoilEutric Leptosol (90.9%)Lithic Leptosol (7.2%)Eutric Cambisol
Soil TextureClay Loam (Coarse)Loam to Clay Loam (Fine)Light Clay Silt Loam
RunoffKe (mm/h)−0.3487−0.3785−1.7263
τc (pa)000
Kr (s/m)000
Ki (kg·s/m4)000
Soil lossKe (mm/h)−0.4487−0.4894−1.5901
τc (pa)−0.1271−0.1766−0.0875
Kr (s/m)0.60820.60980.6119
Ki (kg·s/m4)0.0250.01090.0173
Sediment yieldKe (mm/h)−0.4549−0.4887−1.6060
τc (pa)−0.127−0.1767−0.0876
Kr (s/m)0.60790.60960.6119
Ki (kg·s/m4)0.02530.01040.0172
Table 3. Calibrated soil parameters.
Soil Types Eutric Leptosol (90.9%)Lithic Leptosol (7.2%)Eutric Cambisol (1.9%)
Calibrated ParametersKe (mm/h)5.558
τc (pa)2.52.21.5
Kr (s/m)0.0010.00150.002
Ki (kg·s/m4)1 × 1061.2 × 1061.2 × 106
Table 4. Summary of previous studies in and nearby of the study area.
Document Information(Reference)Models for AnalysisStudy Site NameRate of Mean Sediment Yield (t/ha/year)
[73]RUSLEShina reservoir24.99
[73]RUSLESelamko reservoir43.336
[74]SWATMegech dam watershed12.33
[75]SWATMegech dam watershed12.6
[76]Sediment rating curveMegech dam watershed11.7
[17]SWATMegech30–65
[7]Bathymetric survey measurements (1997, 2005, 2007)Angereb reservoir17.89 to 33.54
[77]RUSLEMegech watershed40.9
[78]1-D numerical modeling methodAngereb42.02 t/ha/year
Table 5. Onsite GeoWEPP model simulation results for the 10 sub-watersheds and their percentage distribution by soil loss rates.
Annual Soil Loss (t/ha/year)Sub Watersheds
12345678910
Deposition > 106.344.673.555.881.315.245.194.593.704.99
Deposition < 103.837.703.822.233.283.755.755.134.105.50
0 ≤ Soil Loss < 2.514.4543.0418.7512.2728.0224.6137.7934.5943.7135.07
2.5 T ≤ Soil Loss < 52.9510.798.455.5714.7712.7910.4112.1610.8610.48
5≤ Soil Loss < 7.51.956.076.913.698.758.896.797.116.456.26
7.5 ≤ Soil Loss < 102.764.266.282.876.046.894.354.573.984.70
10 ≤ Soil Loss < 2014.208.5315.459.6512.9614.979.179.797.8310.84
20 ≤ Soil Loss < 308.103.7511.606.927.427.113.654.363.874.79
30 ≤ Soil Loss < 407.292.337.975.756.183.782.573.203.113.32
Soil Loss ≥4038.138.8517.2245.1711.2511.9714.3314.5112.3814.04
Table 6. Summary of the offsite GeoWEPP model simulation for ten selected sub-watersheds.
Sub-WatershedsArea (ha)Annual SY Rate (t/ha/year)Sediment Delivery Ratio
116254.80.338
22339.9435.40.395
31772.9526.90.164
44902.232.690.155
51259.9910.30.146
61671.6714.50.284
7684.9551.70.397
8480.3327.80.278
9380.7836.50.443
101453.9422.10.267
Publisher’s Note: MDPI stays neutral with regard to jurisdictional claims in published maps and institutional affiliations.