Article

Establishing Coupled Models for Estimating Daily Dew Point Temperature Using Nature-Inspired Optimization Algorithms

1
Water Engineering Department, Urmia University, Urmia 5756151818, Iran
2
Department of Physical Geography and Ecosystem Science, Lund University, Sölvegatan 12, SE-223 62 Lund, Sweden
3
Department of Hydrology & Water Resources Engineering, Shahid Chamran University of Ahvaz, Ahvaz 6135783151, Iran
*
Author to whom correspondence should be addressed.
Hydrology 2022, 9(1), 9; https://doi.org/10.3390/hydrology9010009
Submission received: 2 December 2021 / Revised: 29 December 2021 / Accepted: 30 December 2021 / Published: 1 January 2022

Abstract

:
Potential of a classic adaptive neuro-fuzzy inference system (ANFIS) was evaluated in the current study for estimating the daily dew point temperature (Tdew). The study area consists of two stations located in Iran, namely the Rasht and Urmia. The daily Tdew time series of the studied stations were modeled through the other effective variables comprising minimum air temperature (Tmin), extraterrestrial radiation (Ra), vapor pressure deficit (VPD), sunshine duration (n), and relative humidity (RH). The correlation coefficients between the input and output parameters were utilized to determine the most effective inputs. Furthermore, novel hybrid models were proposed in this study in order to increase the estimation accuracy of Tdew. For this purpose, two optimization algorithms named bee colony optimization (BCO) and dragonfly algorithm (DFA) were coupled on the classic ANFIS. It was concluded that the hybrid models (i.e., ANFIS-BCO and ANFIS-DFA) demonstrated better performances compared to the classic ANFIS. The full-input pattern of the coupled models, specifically the ANFIS-DFA, was found to present the most accurate results for both the selected stations. Therefore, the developed hybrid models can be proposed as alternatives to the classic ANFIS to accurately estimate the daily Tdew.

1. Introduction

Dew point temperature (Tdew) as a weather parameter can be described as a temperature in which the air is saturated with water. In other words, the air is cooled under constant pressure to become saturated [1]. Tdew, along with relative humidity, can be considered as an index to recognize the content of air moisture [2]. The knowledge and availability of Tdew with reliable precision plays remarkable roles in various research areas such as agriculture, climatology, hydrology, and agronomy [3,4,5,6].
Tdew is an essential parameter for the estimation of evaporation and evapotranspiration [7]. Dew is an important factor for plant survival, specifically in arid regions with infrequent amounts of precipitation [8]. Tdew and wet-bulb temperature could be applied to compute the ambient temperature, which makes it possible to protect crops against frosts in which plants may acquire damage [9,10,11,12]. Climate change in each area can also be recognized by assessing Tdew trends over time [11].
Unlike weather parameters such as air temperature, relative humidity, precipitation, etc. that are usually recorded at many meteorological stations, Tdew information may not be measured and is therefore unavailable. Hence, alternative approaches should be taken into consideration to estimate reliable Tdew data. The use of artificial intelligence (AI)-based models has recently attracted attention in estimating Tdew, of which some are briefly reviewed below.
The hourly Tdew data of 20 stations located in Georgia, United States of America, were estimated by Shank et al. [10] through artificial neural networks (ANN). Other weather variables were used as inputs to feed into the ANN. It was concluded that it could be considered as a dependable technique if Tdew data are not available. Zounemat-Kermani [13] tested the potential of a multiple linear regression (MLR) and feed-forward type of ANN in hourly Tdew estimation of a station located in Ontario, Canada. It was reported that the feed-forward ANN showed superiority over the conventional MLR. Nadig et al. [14] evaluated the performance of ANN in the estimation of hourly air and dew temperatures in Georgia, USA. Mohammadi et al. [11] compared the accuracy of three AI-based models in the estimation of daily Tdew of two stations in Iran. An extreme learning machine (ELM) was the best-performing model at both stations when comparing its performance with a support vector machine (SVM) and ANN. Kim et al. [15] estimated the time series of daily Tdew of two stations located in California, USA, utilizing the generalized regression neural networks (GRNN) and multi-layer perceptron (MLP). They found that these models could be considered as promising techniques to accurately estimate daily Tdew. Baghban et al. [16] used a genetic algorithm (GA) for optimizing the ANFIS and least square support vector machine (LSSVM) parameters in estimating Tdew and concluded that the GA could increase the performance of classic models. The classic ANFIS was applied by Mohammadi et al. [1] to estimate the daily Tdew of two locations in Iran, using other available weather variables, and they reported the reliable capability of ANFIS. Amirmojahedi et al. [17] recommended a coupled method by hybridizing the wavelet transform (WT) and an ELM for estimating the daily Tdew of a station in Iran. Its performance was also compared with the classic SVM and ANN. The best estimates of the daily Tdew were observed via the hybrid WT-ELM. Mehdizadeh et al. [6] assessed the performance of gene expression programming (GEP) when estimating daily Tdew of two sites in Iran and reported its dependable potential for estimating Tdew by applying other available weather parameters. The AI-based models, including the GEP, SVM, and M5 model tree, were used by Qasem et al. [18] in the estimation of the daily Tdew of Tabriz site, Iran. The M5 model tree outperformed the other models used. Dong et al. [12] applied seven classic AI-based models and three hybrid models, including an ELM optimized by three optimization algorithms, namely Bat, particle swarm optimization (PSO), and GA. The Yangling station was considered as a case study. They verified the abilities of mentioned optimizers to increase the potential of ELM when estimating the daily Tdew. Besides, the overall results of other studies such as Bickici Arikan et al. [19], Golizadeh Akhlaghi et al. [20], and Alizamir et al. [21] verified the capabilities of AI-based approaches for estimating Tdew.
In recent years, many efforts have been made to propose and implement the hybrid models as alternatives to the classic AI models when modeling meteorological, hydrological, and environmental variables [22,23,24,25]. It has also been well documented that the hybrid models can outperform the classic AI ones in estimating the times series of the investigated target variables [26]. In recent years, bio-inspired optimizers have received remarkable attention to developing the coupled methods created via coupling the AI and bio-inspired optimization techniques. Optimization is a vital engineering issue, and hence, various algorithms have been introduced with metaheuristics that have recently had many applications in engineering sciences [27]. Lately, the application of nature-inspired optimization algorithms has proven to be a significant solution for reducing the complexity of hydrological modeling [28]. These hybrid metaheuristic models can automatically provide powerful parameter estimation of the artificial intelligence models and enhance hydrological modeling performance; various nature-inspired algorithms have been employed for overcoming the limitation of the machine learning models for hydrological forecasting tasks [29,30,31].
The current study applied two nature-inspired optimization algorithms (BCO and DFA) for changing the attributes of the ANFIS model, such as learning rate and weights, in order to have a capable training and to reduce the modeling error. In addition, the ability of coupled ANFIS-BCO and ANFIS-DFA approaches were compared with the classical ANFIS for simulating dew point temperature to reach an efficient simulated result. The proposed models reach the optimal conditions when a suitability occurs between weights of ANFIS and the BCO and DFA, or the maximum number of iterations satisfies. This study seeks to estimate daily Tdew of two sites in Iran, through the classic adaptive neuro-fuzzy inference system (ANFIS) and novel hybrid models via coupling the ANFIS with the bio-inspired optimization algorithms consisting of the bee colony optimization (BCO), and dragonfly algorithm (DFA). The chief purpose of the present study is to enhance the estimation performance of Tdew via hybrid models. The effective variables of Tdew were recognized utilizing the correlation analysis. There are several hybrid models in the literature on the hybridization of AI and bio-inspired optimizers to estimate Tdew. Additionally, no studies have been reported in previous studies on proposing and testing the efficiency of coupled ANFIS-BCO and ANFIS-DFA techniques when estimating Tdew. Hence, this study is the first attempt to develop the aforementioned hybrid models.

2. Materials and Methods

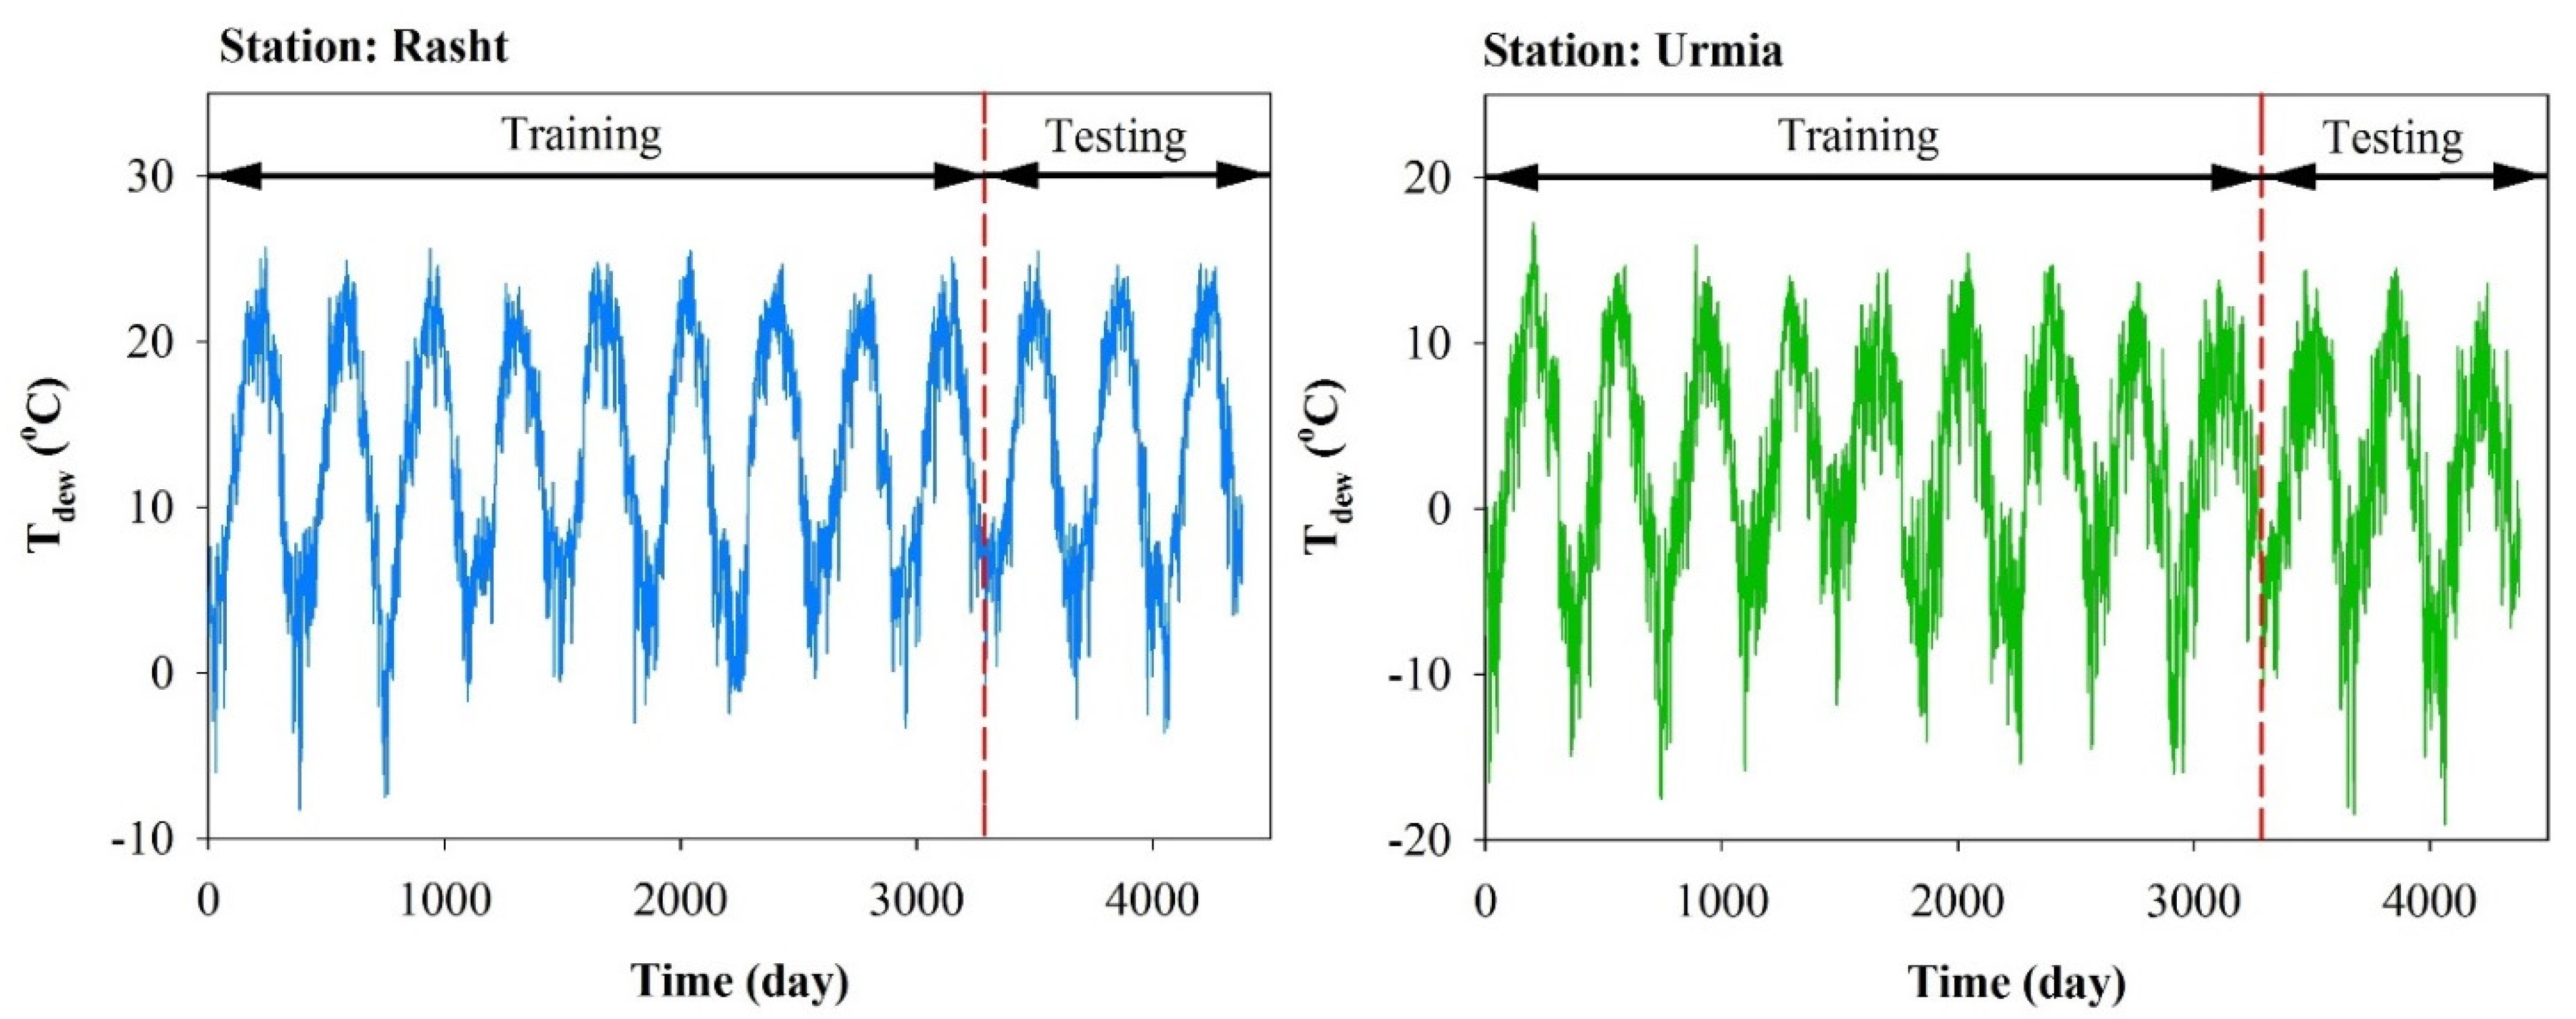
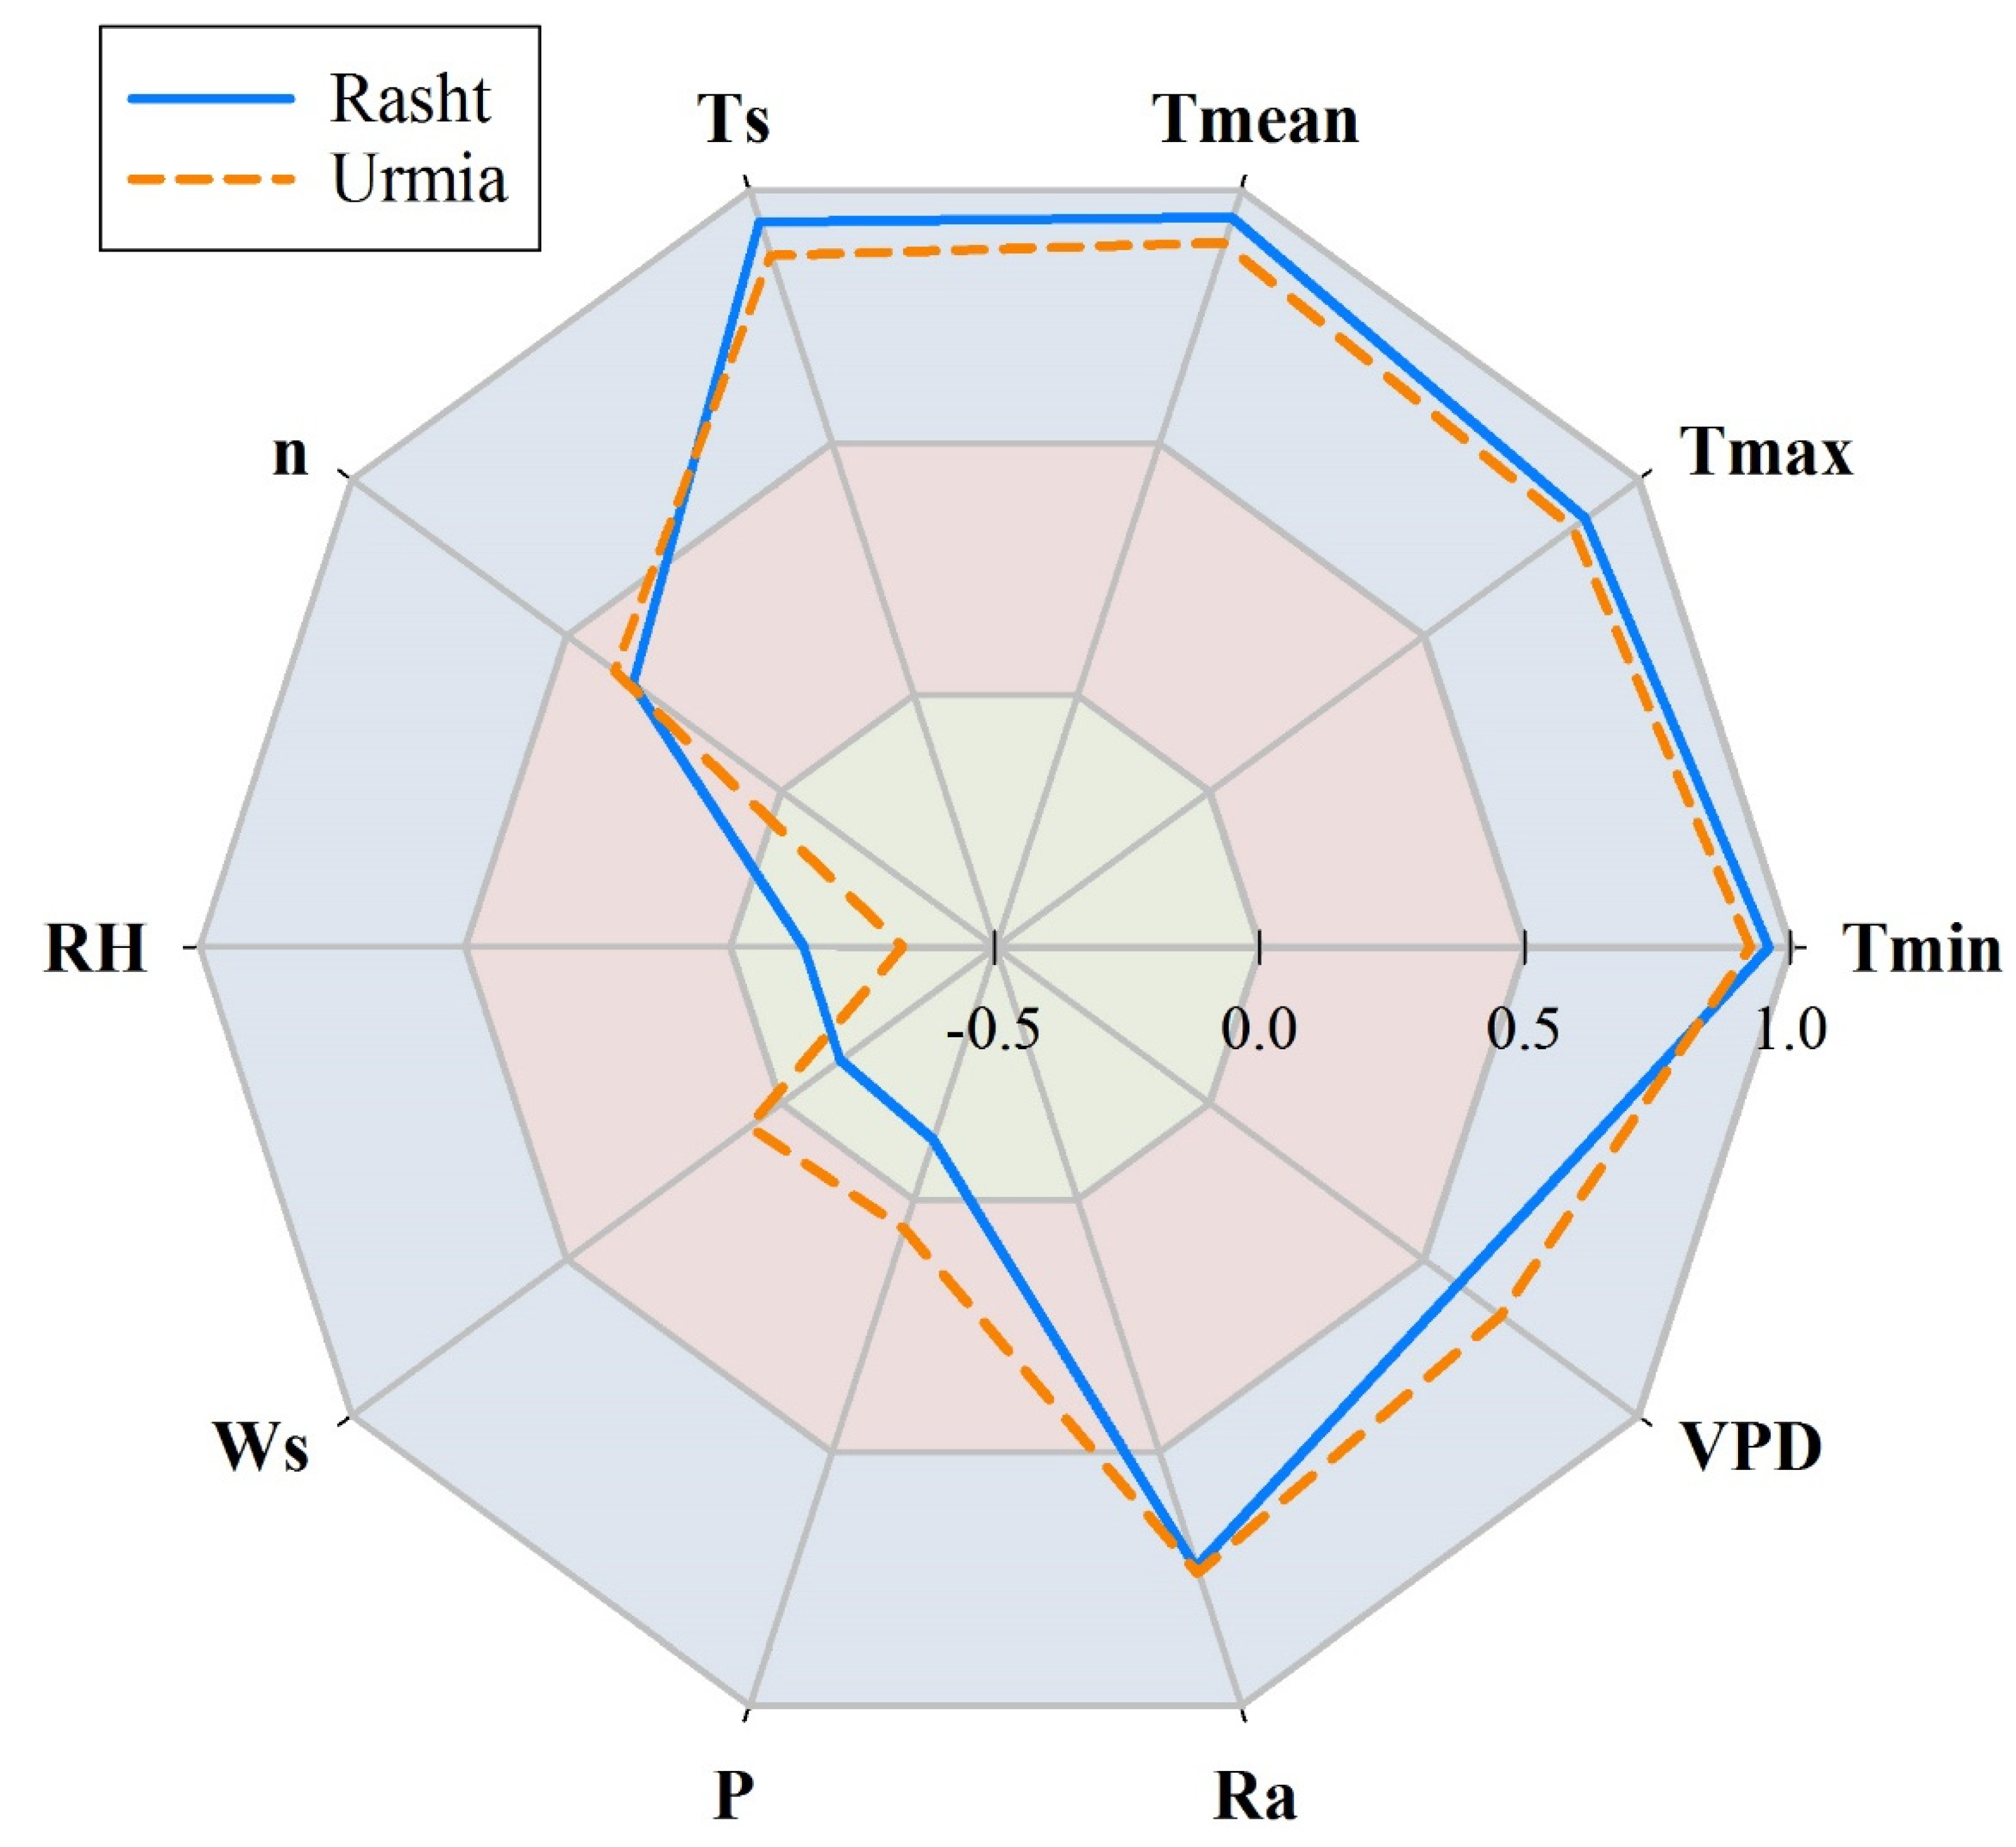
2.1. Study Region and Data Used

Two stations were selected in Iran, Rasht and Urmia, as the study regions to achieve the objectives of this study (i.e., estimating the daily Tdew via other available weather data). The Rasht station in northern Iran includes a humid climate classification, having a latitude of 37°19′ N, longitude of 49°37′ E, and an elevation of −8.6 m. Furthermore, the Urmia station, with a semi-arid climate, is located in northwestern Iran. Its latitude, longitude, and elevation are 37°40′ N, 45°03′ E, and 1328.0 m, respectively. Figure 1 illustrates the geographical locations of the study locations on the map of Iran.
The required data for this study consist of dew point temperature (Tdew), minimum air temperature (Tmin), maximum air temperature (Tmax), mean air temperature (Tmean), soil temperature at 5 cm depth (Ts), sunshine duration (n), relative humidity (RH), wind speed (Ws) and precipitation (P), which were collected from the Iran Meteorological Organization (IMO) during 2006–2017. Table 1 summarizes some of the statistical properties of the data used for both stations. Ra and VPD indicate the extraterrestrial radiation and vapor pressure deficit, respectively, which were calculated using the theoretical relationships proposed by Allen et al. [31]. The daily time series of Tdew for both the training and testing periods at the studied stations are demonstrated in Figure 2. As can be seen, there are approximately similar trends for the daily Tdew time series of both the training and testing periods for the study locations.
The data were split into training and testing datasets. The first nine-year data from 2006 to 2014 (i.e., 75% of the entire data) were applied when training models were developed. Moreover, the last three-year data between 2015 and 2017 (i.e., 25% of the entire data) were used for testing the models.

2.2. Models Used

2.2.1. Adaptive Neuro-Fuzzy Inference System (ANFIS)

ANFIS as a machine learning approach is used as the base model in the current study. ANFIS used is according to the Takagi-Sugeno fuzzy system method, and this technique was proposed in 1993 by Jang et al. [32]. Considering ANFIS as an integrated neural network and fuzzy logic concept, it can take advantage of both of them in a single frame. The appropriate structure of the ANFIS technique is selected according to the input data, membership degree, input and output membership functions. During the training stage, input values can be closer to measured values by adjusting membership degree parameters according to the acceptable error rate. The ANFIS approach utilizes neural network learning algorithms and fuzzy logic for handling the nonlinear relationship between input and output values, and it has excellent potential in time series simulation and classification issues [33]. Numerical information can be extracted from a formally formulated rule according to the advantages of fuzzy rules, and the ANFIS can simply analyze the complex transformation of human intelligence into fuzzy systems. Its inference system is in accordance with the set of fuzzy if-then laws that can be learned to approximate nonlinear functions. Therefore, ANFIS is considered as a popular estimator tool in engineering fields. In this study, Fuzzy Cluster Means (FCM) method was used for fuzzy clustering based on the k-means clustering algorithm and the Backpropagation method was used for finding the best optimization method in classic ANFIS [34]. The fuzzy c-means (FCM) clustering by extracting a set of rules used for generating the fuzzy inference system (FIS) was applied in the current study for implementing the ANFIS model, and the optimal parameters of the ANFIS model are provided in Table 2.

2.2.2. Bee Colony Optimization (BCO)

The BCO was recently introduced as an optimization technique that simulates the behavior of a bee colony [35]. A bee colony, a swarm of birds, or bees are simple examples of a demographic system. Another example is the collective intelligence of the bee colony around the hive. The BCO is an optimization algorithm based on the intelligent behavior of the bee population. In this mathematical model, artificial bee colonies have three kinds of bees. By the effort of worker bees, food-collecting occurs, and they bring it to the apiary from another food source. Determining the value of a resource of food is part of the duty of observer bees, and they patrol between worker bees to understand the worth of each food source. The food source can be considered as a state in the search space for a solution to the optimization problem in the BCO algorithm, and at the beginning, the number of food sources are considered as the number of bees in the apiary. The value of the objective function can determine the quality of food resources at each level of the algorithm running according to the amount of fitness [36].

2.2.3. Dragonfly Algorithm (DFA)

A new bio-inspired optimization technique is proposed, called the Dragonfly algorithm, as introduced by Mirjalili [37]. The basic idea of the DFA is inspired by the behavior of dragonflies in the nature. There are two basic stages in optimization: exploration, and exploitation. They are modeled on (teamwork) leading, searching for food, and avoiding enemies in the static and dynamic modes. The basic concepts of the Dragonfly algorithm include: (i) Separation: refers to avoiding one person dealing with other neighbors. (ii) Alignment: indicates the speed adjustment of people concerning other neighbors. (iii) Cohesion: refers to the tendency of individuals toward the center of neighborly imitation. The main goal of every mass and group is to maintain survival; thus, everyone must be attracted to food sources and distracted from enemies [37].

2.3. Models’ Development

In the current study, BCO and DFA approaches were employed for enhancing the precision of the ordinary ANFIS model by optimizing its parameters. In the ordinary ANFIS model, parameters are nominated by a trial-and-error method, and sometimes this mentioned traditional method cannot select real optimal parameters of ANFIS. This is a reason for having more errors in the modeling process by ordinary ANFIS (because the ordinary ANFIS in some complex conditions cannot find optimal values by a traditional trial-and-error method). By hybridizing the nature-inspired optimization algorithms with an ordinary ANFIS model, the new proposed boosted hybrid models (namely ANFIS-BCO and ANFIS-DFA) can find the optimal values better than standalone ANFIS. The BCO and DFA algorithms were applied for this goal, and they try to find optimal parameters and then establish their updated membership functions based on the minimum error in Tdew estimation. Substantially, the suggested method can upgrade the abilities of the ordinary ANFIS model for time series prediction as well daily Tdew simulations. Then, the weight of the ANFIS model can be updated according to the gained values from the nature-inspired algorithms. The maximum number of iterations for running both optimization algorithms were considered as 500, and the number of search agents was considered as 40 in DFA. In addition, for running BCO, population size (colony size), number of decision variables, and acceleration coefficient upper bound were all considered as 100, 5, and 1, respectively. Figure 3 shows the schematic diagram of the modeling process by the classic ANFIS and hybrid models in this research.

3. Error Metrics Used to Evaluate the Models’ Performance

Four statistical measures, namely root mean square error (RMSE), relative RMSE (RRMSE), mean absolute error (MAE), and coefficient of determination (R2), were utilized in the current work to evaluate the models’ performances in estimating the daily Tdew of the studied sites. They can be formulated as the following equations [38,39]:
R M S E = i = 1 N ( T m , i T e , i ) 2 N
R R M S E = i = 1 N ( T m , i T e , i ) 2 N T m ¯
M A E = i = 1 N | T m , i T e , i | N
R 2 = [ i = 1 N ( T m , i T m ¯ ) ( T e , i T e ¯ ) i = 1 N ( T m , i T m ¯ ) 2 i = 1 N ( T e , i T e ¯ ) 2 ] 2
where T m , i and T e , i indicate the ith daily measured and estimated Tdew, respectively, T m ¯ and T e ¯ denote the mean of measured and estimated values of daily Tdew, respectively, and N is the total number of measured data used to train and test the models separately.
It is obvious that lower values achieved for the RMSE, RRMSE, and MAE, and higher values for the R2, illustrate a better potential of each model in estimating daily Tdew.

4. Results and Discussions

The values of daily Tdew for two locations selected in Iran were first estimated through the classic ANFIS. To determine the significance level of the weather variables on Tdew estimation, correlation coefficients existing among the input predictors and output variables were taken into consideration. The hybrid models were then proposed to improve the daily Tdew estimation using the hybridization of classic ANFIS with two types of bio-inspired optimization algorithms consisting of BCO and DFA.

4.1. Performance Investigation of the Classic and Hybrid Models Proposed

To better feed the models developed in this study, correlation coefficients of the inputs and target variables were calculated as graphically illustrated in Figure 4. According to this radar graph, temperature components (i.e., Tmin, Tmax, Tmean, and Ts) illustrate the highest correlations with Tdew. Among them, Tmin followed by Tmean relatively show higher correlations than those of the Ts and Tmax. After the temperature parameters, the highest correlations are related to Ra and VPD for both the Rasht and Urmia stations. After the variables mentioned above, n is a high-correlated variable with Tdew. In addition, there exist weakest correlations for Tdew with the Ws and P variables. High-correlated variables with the Tdew were applied to define the input combinations when estimating the daily Tdew. In this context, Tmin from the temperature-based components, and Ra, VPD, n, and RH were utilized as effective variables. The input combinations considered to implement the classic and hybrid models are tabulated in Table 3. As is apparent, the first five models represent the sole-input combinations.
The statistical results of the classic ANFIS, including the RMSE, RRMSE, MAE, and R2 metrics at the Rasht and Urmia stations are provided in the first parts of Table 4 and Table 5, respectively. As expected, Tmin had the best accuracy of Tdew estimation at both stations. Ra followed by VPD demonstrated higher performances than the n and RH variables. It can be therefore said that the input variables with the higher correlation coefficients with the target variable (i.e., Tdew in this study) could provide reasonable estimation accuracy. The high-performance variable, i.e., Tmin was assumed as a fixed variable, and other variables were added into Tmin for defining the input combinations with more inputs. For example, the second-best performing variable (Ra) was added to Tmin to develop the input combination with two inputs. Besides, the last models in Table 3 illustrate the full-input combination. The accuracy of ANFIS6 models at both stations is somewhat similar to that of the ANFIS1 models, which means that adding Ra to the Tmin in ANFIS6 could not improve the performance of ANFIS1. However, considering the Tmin, Ra, and VPD in the ANFIS7 model of Urmia station considerably increased the accuracy of Tdew estimation, while no significant difference was observed in the performance of ANFIS6 and ANFIS7 models developed at the Rasht station. Finally, the ANFIS8 (four-input) and ANFIS9 (full-input) models performed better than the models with fewer inputs at both the studied locations; however, the ANFIS9 was the best-performing classic ANFIS with the highest degree of accuracy (Rasht station; RMSE = 1.221 °C, RRMSE = 0.094, MAE = 0.927, R2 = 0.969 during the training period, and RMSE = 1.465 °C, RRMSE = 0.110, MAE = 1.073, R2 = 0.954 during the testing period. Urmia station; RMSE = 1.419 °C, RRMSE = 0.502, MAE = 1.099, R2 = 0.957 during the training period, and RMSE = 1.763 °C, RRMSE = 0.977, MAE = 1.358, R2 = 0.933 during the testing period).
As already mentioned, the main purpose of this study is to increase the estimation accuracy of daily Tdew via the novel hybrid models. In doing so, two different types of optimization techniques, including BCO and DFA, were applied to develop and propose the hybrid ANFIS-BCO and ANFIS-DFA models. Error statistics of hybrid models are given in the second and third sections of Table 4 and Table 5. The same outcomes achieved for the classic ANFIS were also obtained for the coupled techniques implemented, i.e., the better estimation accuracy of the Tdew at both the stations through the Tmin followed by Ra and VPD compared to the n and RH variables, improving the performance of all the hybrid ANFIS1-BCO and ANFIS1-DFA models with the inclusion of other effective variables (i.e., Ra, VPD, n, RH) when estimating the Tdew and the most accurate Tdew estimates considering the full-input combination.
The full-input combination considers the other weather variables such as Tmin, Ra, VPD, n, and RH to estimate the target variable (Tdew). Among these variables, Tmin, n, and RH are usually recorded at most weather stations. Furthermore, Ra and VPD are calculated by the other available parameters. Ra is computed by the Julian day and latitude of the station, while the Tmin, Tmax, Tmean, and RH are needed to calculate the VPD. It can therefore be concluded that all the hybrid models proposed in this study, especially the ANFIS-DFA, can be used for estimating the daily Tdew by utilizing the predictors as mentioned above with a dependable degree of precision.

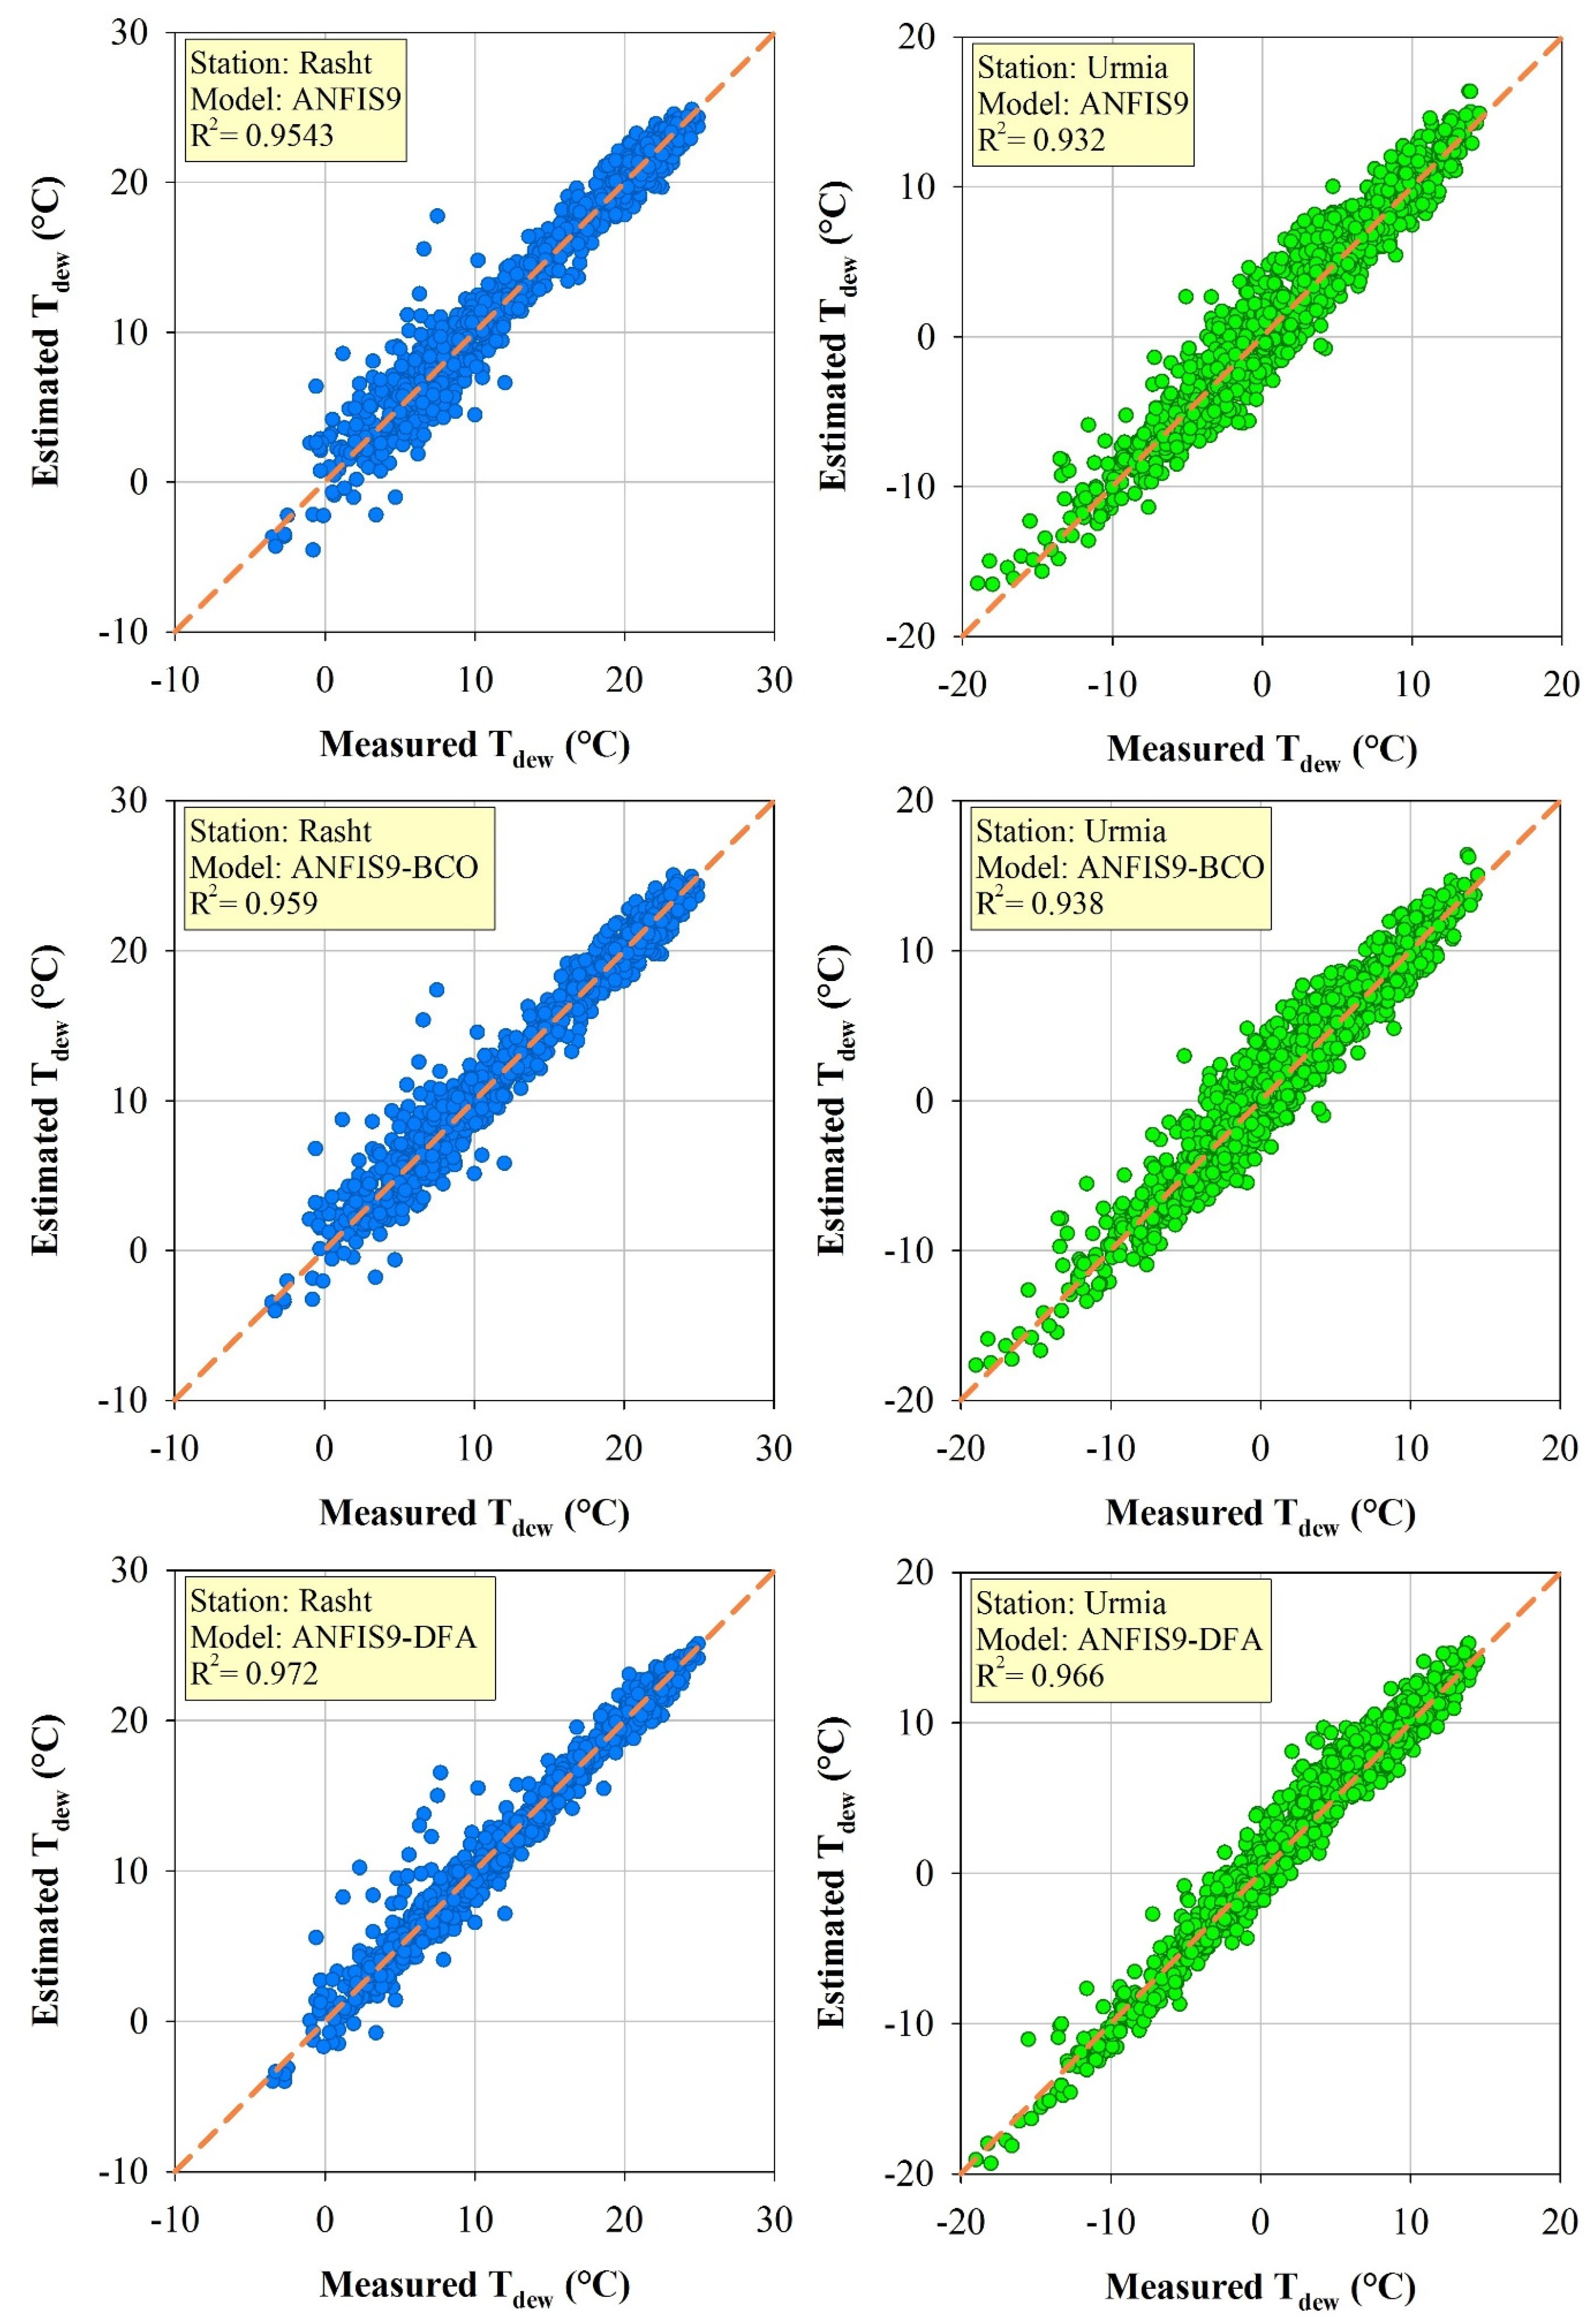
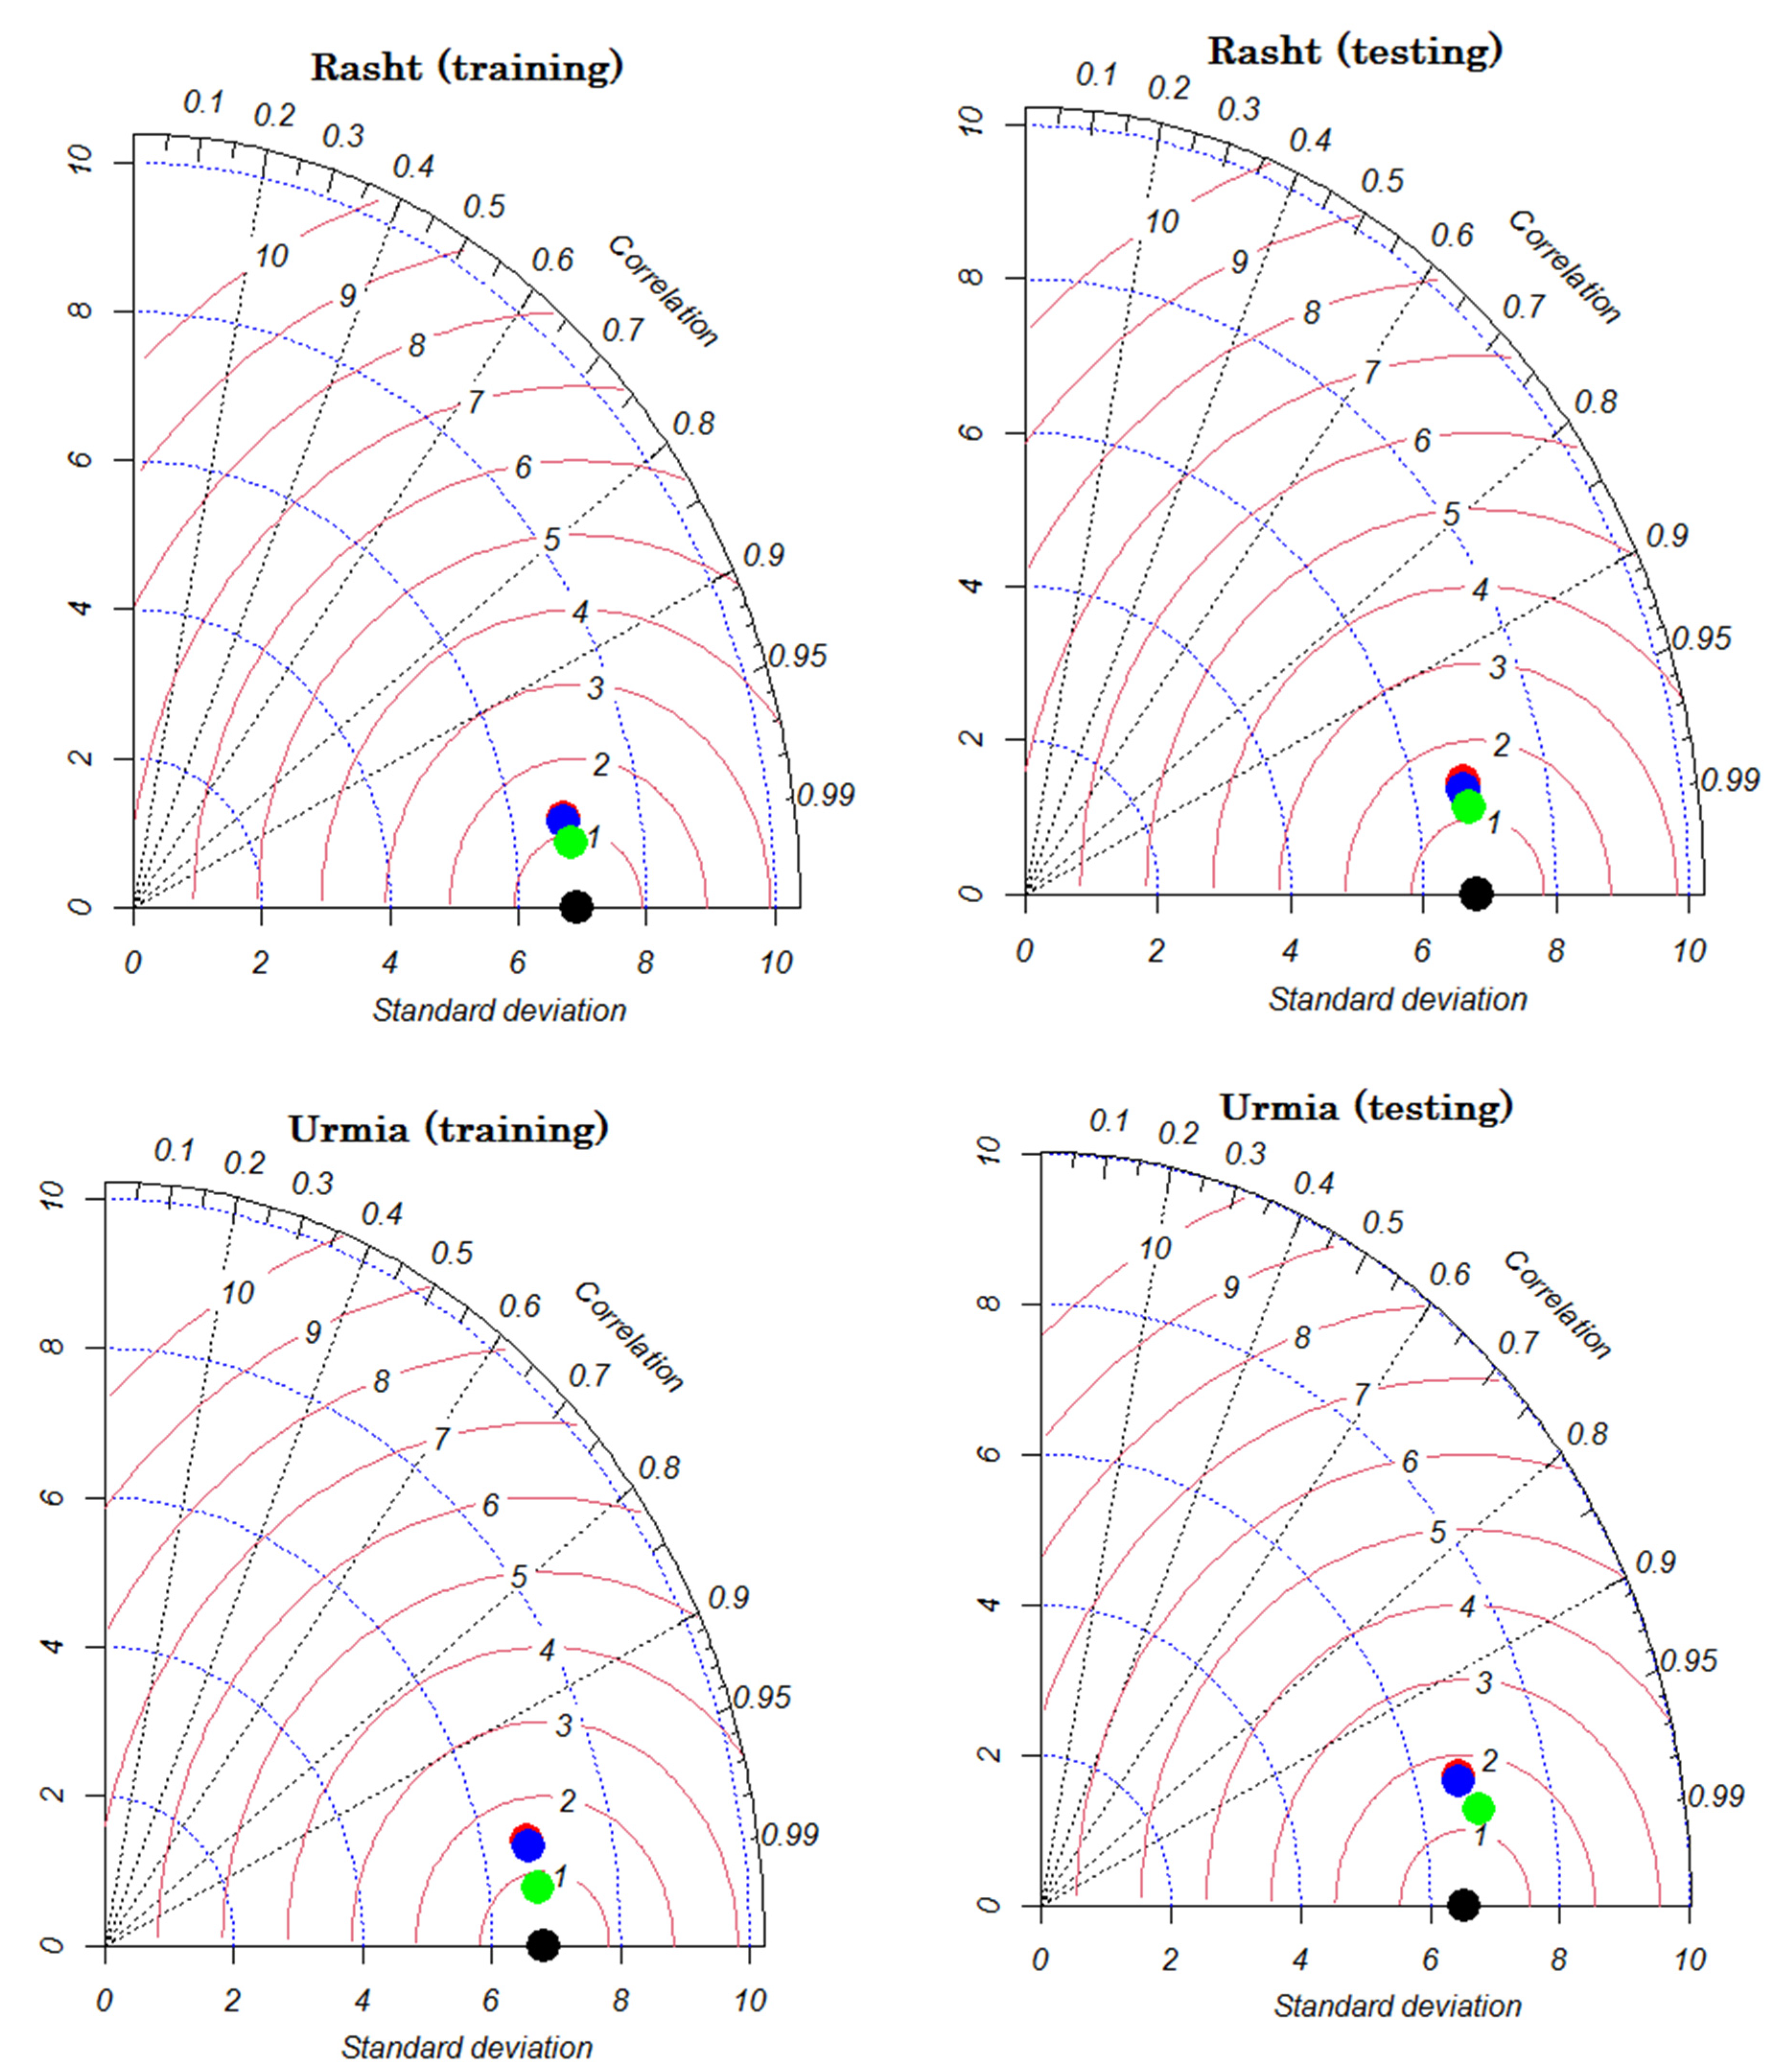
4.2. Performance Comparison of Classic and Coupled Models Proposed

A performance evaluation of the classic ANFIS and hybrid models developed in the current study focusing on error metrics of RMSE, RRMSE, MAE, and R2, tabulated in Table 4 and Table 5, clearly illustrates that the novel coupled methods outperformed the classic ANFIS to estimate the daily Tdew time series of the study sites due to the lower values for the RMSE, RRMSE, and MAE, and higher values for the R2 criterion. This can be verified, taking into consideration the ability of the new hybrid models in Tdew estimation. This study shows that the optimization method can help to solve engineering problems, especially BCO and DFA, which can improve the ability of ANFIS as an estimator tool for estimating Tdew at different climates by different input variables.
Regarding the capabilities of all the models developed for estimating daily Tdew at both locations with different climates, it can be apparently observed that all the classic and coupled approaches present better accuracies in the Urmia station than those of the Rasht station under sole-input combinations. Conversely, input combinations with more inputs, from two to five, in all the classic and coupled models show superior outcomes at the Rasht station compared to the Urmia station. Different climates can therefore produce different results for the models. Climate difference at the two stations studied has affected the results of the models. The Rasht station has a humid climate due to its proximity to the world’s largest lake (Caspian Sea), and this climatic complexity has made the estimation models at this station require more input variables.
Generally, among the hybrid models, the hybrid ANFIS-BCO under all the defined input combinations presented lower estimation accuracy. Meanwhile, the hybrid ANFIS-DFA performed better than the ANFIS and ANFIS-BCO and is therefore the best-performing hybrid model to accurately estimate the daily Tdew at both the Rasht and Urmia stations. It can be justified considering the point of the reliable capability of the DFA algorithm to find the optimal parameters of the ANFIS model. Also, the ability of DFA for finding any possible optimal solution helped to have a better performance in Tdew estimation. The results demonstrate DFA’s applicability and robustness to solving real problems with unknown search spaces, and these results are consistent with the results of Mirjalili [37]. The most accurate Tdew estimates were obtained through the ANFIS9-DFA at both stations (Rasht station; RMSE = 0.877 °C, RRMSE = 0.067, MAE = 0.645, R2 = 0.984 during the training period, and RMSE = 1.146 °C, RRMSE = 0.086, MAE = 0.747, R2 = 0.972 during the testing period. Urmia station; RMSE = 0.778 °C, RRMSE = 0.275, MAE = 0.604, R2 = 0.987 during the training period, and RMSE = 1.329 °C, RRMSE = 0.736, MAE = 1.002, R2 = 0.966 during the testing period).
To schematically investigate the estimation potential of classic ANFIS and proposed hybrid techniques, scatter graphs for the measured and estimated Tdew data via any of the models were prepared and are shown in Figure 5 for the studied stations. To this, the best-performing classic ANFIS (i.e., ANFIS9) and hybrid models (i.e., ANFIS9-BCO and ANFIS9-DFA) were employed during the testing period. The dashed lines in the scatter plots indicate the 1:1 exact line. In general, the values of R2 are closer to 1 in the hybrid models, specifically the hybrid ANFIS-DFA, than those of the classic ANFIS, which denotes the dependable performance of the hybrid approaches when estimating daily Tdew.
Besides the scatter plots, Taylor diagrams were also depicted for the superior classic and hybrid models (i.e., ANFIS9, ANFIS9-DFA, and ANFIS9-BCO) at both the studied locations, as shown in Figure 6. This diagram is made up of two semicircles, one for negative correlations and the other for positive correlations. Three statistics comprising the standard deviation, correlation coefficient, and centered RMSE can easily be observed in these diagrams. The measured point (i.e., black point) is defined, taking into account the standard deviation, which is depicted on the horizontal axis. The shorter distance related to each model with the measured point indicates the better performance of that model. In this context, ANFIS9-DFA (i.e., green points in Figure 6) is the best-performing model.

5. Conclusions

This study estimated the daily Tdew time series of Rasht and Urmia stations located in Iran by the classic ANFIS and its hybridized form with two bio-inspired optimization techniques, namely BCO and DFA. Other available weather variables were used as the predictors to feed the models developed. The impact of considered variables on Tdew was investigated via correlation analysis. The weather variables, including Tmin, Ra, VPD, n, and RH were used as inputs, and therefore nine different input combinations were defined. Based on the outcomes achieved, Tmin followed by Ra were the most effective variables to accurately estimate daily Tdew. Moreover, the n and RH variables showed the least impact on Tdew. Accordingly, all the classic and hybrid models under sole-input combinations presented the highest and lowest accuracy regarding the application of Tmin and RH, respectively. The performance of the methods developed in the present study was improved with the inclusion of more inputs such that the ANFIS9, ANFIS9-BCO, and ANFIS9-DFA with full inputs illustrated the best performance in each class of classic and hybrid models. For both the studied stations, the hybrid models led to better estimates of the daily Tdew in comparison to the classic ANFIS; however, the ANFIS-DFA was the best hybrid paradigm. It was concluded that the coupled methods surpassed the classic model used in this study (i.e., ANFIS) for the estimation of daily Tdew. There are some advantages in the optimization of the proposed methods, such as searching in response to global and local spaces and checking all possible responses around a potential, optimal candidate. In addition, such metaheuristic algorithms are capable, and small numbers of iterations are needed for solving the problem. Then, finding an optimal response using a strong search can make sure the ANFIS is trained by a capable method and that a minimum error occurs during the Tdew simulation process. It is therefore suggested that more hybrid models could be proposed through the hybridization of other classic models, such as SVR, MLP, etc., with different types of bio-inspired optimization techniques, including evolution-based algorithms, ecology-based algorithms, and swarm-intelligence-based algorithms for the precise estimation of a Tdew time series. Besides, the estimation accuracy of hybrid models implemented could be tested by estimating other temperature variables consisting of air temperature and soil temperature, as well as other hydrological and agro-meteorological variables such as evaporation, evapotranspiration, precipitation, and so on.

Author Contributions

Conceptualization, S.M., B.M. and F.A.; methodology, S.M. and B.M.; software, B.M.; validation, S.M., B.M. and F.A.; formal analysis, B.M.; investigation, S.M. and B.M.; resources, S.M.; data curation, S.M. and F.A.; writing—original draft preparation, S.M. and B.M.; writing—review and editing, S.M., B.M. and F.A.; visualization, S.M., B.M. and F.A.; project administration, B.M. All authors have read and agreed to the published version of the manuscript.

Funding

This research received no external funding.

Data Availability Statement

Data will be available upon request.

Conflicts of Interest

The authors declare no conflict of interest.

References

  1. Mohammadi, K.; Shamshirband, S.; Petković, D.; Yee, P.L.; Mansor, Z. Using ANFIS for selection of more relevant parameters to predict dew point temperature. Appl. Therm. Eng. 2016, 96, 311–319. [Google Scholar] [CrossRef]
  2. Lawrence, M.G. The relationship between relative humidity and the dewpoint temperature in moist air: A simple conversion and applications. Bull. Am. Meteorol. Soc. 2005, 86, 225–234. [Google Scholar] [CrossRef]
  3. Emmel, C.; Knippertz, P.; Schulz, O. Climatology of convective density currents in the southern foothills of the Atlas Mountains. J. Geophys. Res. Atmos. 2010, 115. [Google Scholar] [CrossRef]
  4. Katul, G.G.; Oren, R.; Manzoni, S.; Higgins, C.; Parlange, M.B. Evapotranspiration: A process driving mass transport and energy exchange in the soil-plant-atmosphere-climate system. Rev. Geophys. 2012, 50. [Google Scholar] [CrossRef] [Green Version]
  5. Feld, S.I.; Cristea, N.C.; Lundquist, J.D. Representing atmospheric moisture content along mountain slopes: Examination using distributed sensors in the Sierra Nevada, California. Water Resour. Res. 2013, 49, 4424–4441. [Google Scholar] [CrossRef]
  6. Mehdizadeh, S.; Behmanesh, J.; Khalili, K. Application of gene expression programming to predict daily dew point temperature. Appl. Therm. Eng. 2017, 112, 1091–1107. [Google Scholar] [CrossRef]
  7. Hubbard, K.G.; Mahmood, R.; Carlson, C. Estimating daily dew point temperature for the northern Great Plains using maximum and minimum temperature. Agron. J. 2003, 95, 323–328. [Google Scholar] [CrossRef]
  8. Agam, N.; Berliner, P.R. Dew formation and water vapor adsorption in semi-arid environments—A review. J. Arid Environ. 2006, 65, 572–590. [Google Scholar] [CrossRef]
  9. Drezner, T.D. An analysis of winter temperature and dew point under the canopy of a common Sonoran Desert nurse and the implications for positive plant interactions. J. Arid Environ. 2007, 69, 554–568. [Google Scholar] [CrossRef]
  10. Shank, D.B.; Hoogenboom, G.; McClendon, R.W. Dewpoint temperature prediction using artificial neural networks. J. Appl. Meteorol. Climatol. 2008, 47, 1757–1769. [Google Scholar] [CrossRef]
  11. Mohammadi, K.; Shamshirband, S.; Motamedi, S.; Petković, D.; Hashim, R.; Gocic, M. Extreme learning machine based prediction of daily dew point temperature. Comput. Electron. Agric. 2015, 117, 214–225. [Google Scholar] [CrossRef]
  12. Dong, J.; Wu, L.; Liu, X.; Li, Z.; Gao, Y.; Zhang, Y.; Yang, Q. Estimation of daily dew point temperature by using bat algorithm optimization based extreme learning machine. Appl. Therm. Eng. 2020, 165, 114569. [Google Scholar] [CrossRef]
  13. Zounemat-Kermani, M. Hourly predictive Levenberg-Marquardt ANN and multi linear regression models for predicting of dew point temperature. Meteorol. Atmos. Phys. 2012, 117, 181–192. [Google Scholar] [CrossRef]
  14. Nadig, K.; Potter, W.; Hoogenboom, G.; McClendon, R. Comparison of individual and combined ANN models for prediction of air and dew point temperature. Appl. Intell. 2013, 39, 354–366. [Google Scholar] [CrossRef]
  15. Kim, S.; Singh, V.P.; Lee, C.J.; Seo, Y. Modeling the physical dynamics of daily dew point temperature using soft computing techniques. KSCE J. Civ. Eng. 2015, 19, 1930–1940. [Google Scholar] [CrossRef]
  16. Baghban, A.; Bahadori, M.; Rozyn, J.; Lee, M.; Abbas, A.; Bahadori, A.; Rahimali, A. Estimation of air dew point temperature using computational intelligence schemes. Appl. Therm. Eng. 2016, 93, 1043–1052. [Google Scholar] [CrossRef]
  17. Amirmojahedi, M.; Mohammadi, K.; Shamshirband, S.; Seyed Danesh, A.; Mostafaeipour, A.; Kamsin, A. A hybrid computational intelligence method for predicting dew point temperature. Environ. Earth Sci. 2016, 75, 415. [Google Scholar] [CrossRef]
  18. Qasem, S.N.; Samadianfard, S.; Nahand, H.S.; Mosavi, A.; Shamshirband, S.; Chau, K.W. Estimating daily dew point temperature using machine learning algorithms. Water 2019, 11, 582. [Google Scholar] [CrossRef] [Green Version]
  19. Arikan, B.B.; Jiechen, L.; Sabbah, I.I.D.; Ewees, A.; Homsi, R.; Sulaiman, S.O. Dew Point Time Series Forecasting at the North Dakota. Knowledge-Based Eng. Sci. 2021, 2, 24–34. [Google Scholar] [CrossRef]
  20. Golizadeh Akhlaghi, Y.; Aslansefat, K.; Zhao, X.; Sadati, S.; Badiei, A.; Xiao, X.; Shittu, S.; Fan, Y.; Ma, X. Hourly performance forecast of a dew point cooler using explainable Artificial Intelligence and evolutionary optimisations by 2050. Appl. Energy 2021, 281, 116062. [Google Scholar] [CrossRef]
  21. Alizamir, M.; Kim, S.; Kisi, O.; Zounemat-Kermani, M. Deep echo state network: A novel machine learning approach to model dew point temperature using meteorological variables. Hydrol. Sci. J. 2020, 65, 1173–1190. [Google Scholar] [CrossRef]
  22. Mehr, A.D.; Tur, R.; Çalışkan, C.; Tas, E. A Novel Fuzzy Random Forest Model for Meteorological Drought Classification and Prediction in Ungauged Catchments. Pure Appl. Geophys. 2020, 177, 5993–6006. [Google Scholar] [CrossRef]
  23. Noori, R.; Safavi, S.; Nateghi Shahrokni, S.A. A reduced-order adaptive neuro-fuzzy inference system model as a software sensor for rapid estimation of five-day biochemical oxygen demand. J. Hydrol. 2013, 495, 175–185. [Google Scholar] [CrossRef]
  24. Noori, R.; Karbassi, A.; Farokhnia, A.; Dehghani, M. Predicting the longitudinal dispersion coefficient using support vector machine and adaptive neuro-fuzzy inference system techniques. Environ. Eng. Sci. 2009, 26, 1503–1510. [Google Scholar] [CrossRef]
  25. Noori, R.; Deng, Z.; Kiaghadi, A.; Kachoosangi, F.T. How Reliable Are ANN, ANFIS, and SVM Techniques for Predicting Longitudinal Dispersion Coefficient in Natural Rivers? J. Hydraul. Eng. 2016, 142, 04015039. [Google Scholar] [CrossRef]
  26. Hanoon, M.S.; Ahmed, A.N.; Zaini, N.; Razzaq, A.; Kumar, P.; Sherif, M.; Sefelnasr, A.; El-Shafie, A. Developing machine learning algorithms for meteorological temperature and humidity forecasting at Terengganu state in Malaysia. Sci. Rep. 2021, 11, 18935. [Google Scholar] [CrossRef] [PubMed]
  27. Emamgholizadeh, S.; Mohammadi, B. New hybrid nature-based algorithm to integration support vector machine for prediction of soil cation exchange capacity. Soft Comput. 2021, 25, 13451–13464. [Google Scholar] [CrossRef]
  28. Mohammadi, B.; Guan, Y.; Moazenzadeh, R.; Safari, M.J.S. Implementation of hybrid particle swarm optimization-differential evolution algorithms coupled with multi-layer perceptron for suspended sediment load estimation. Catena 2021, 198, 105024. [Google Scholar] [CrossRef]
  29. Aghelpour, P.; Mohammadi, B.; Mehdizadeh, S.; Bahrami-Pichaghchi, H.; Duan, Z. A novel hybrid dragonfly optimization algorithm for agricultural drought prediction. Stoch. Environ. Res. Risk Assess. 2021, 35, 2459–2477. [Google Scholar] [CrossRef]
  30. Ahmadi, F.; Mehdizadeh, S.; Mohammadi, B. Development of Bio-Inspired and Wavelet-Based Hybrid Models for Reconnaissance Drought Index Modeling. Water Resour. Manag. 2021, 35, 4127–4147. [Google Scholar] [CrossRef]
  31. Mohammadi, B.; Guan, Y.; Aghelpour, P.; Emamgholizadeh, S.; Zolá, R.P.; Zhang, D. Simulation of Titicaca Lake Water Level Fluctuations Using Hybrid Machine Learning Technique Integrated with Grey Wolf Optimizer Algorithm. Water 2020, 12, 3015. [Google Scholar] [CrossRef]
  32. Jang, J.S.R. ANFIS: Adaptive-Network-Based Fuzzy Inference System. IEEE Trans. Syst. Man Cybern. 1993, 23, 665–685. [Google Scholar] [CrossRef]
  33. Kisi, O.; Demir, V.; Kim, S. Estimation of Long-Term Monthly Temperatures by Three Different Adaptive Neuro-Fuzzy Approaches Using Geographical Inputs. J. Irrig. Drain. Eng. 2017, 143, 105024. [Google Scholar] [CrossRef]
  34. Azad, A.; Farzin, S.; Kashi, H.; Sanikhani, H.; Karami, H.; Kisi, O. Prediction of river flow using hybrid neuro-fuzzy models. Arab. J. Geosci. 2018, 11, 718. [Google Scholar] [CrossRef]
  35. Akay, B.; Karaboga, D. A modified Artificial Bee Colony algorithm for real-parameter optimization. Inf. Sci. 2012, 192, 120–142. [Google Scholar] [CrossRef]
  36. Seeley, T.D. The Wisdom of the Hive: The Social Physiology of Honey Bee Colonies; Harvard University Press: Cambridge, MA, USA, 2009; Volume 277, p. 291. [Google Scholar]
  37. Mirjalili, S. Dragonfly algorithm: A new meta-heuristic optimization technique for solving single-objective, discrete, and multi-objective problems. Neural Comput. Appl. 2016, 27, 1053–1073. [Google Scholar] [CrossRef]
  38. Mehdizadeh, S. Assessing the potential of data-driven models for estimation of long-term monthly temperatures. Comput. Electron. Agric. 2018, 144, 114–125. [Google Scholar] [CrossRef]
  39. Mehdizadeh, S. Using AR, MA, and ARMA Time Series Models to Improve the Performance of MARS and KNN Approaches in Monthly Precipitation Modeling under Limited Climatic Data. Water Resour. Manag. 2020, 34, 263–282. [Google Scholar] [CrossRef]
Figure 1. Geographical locations of the studied stations.
Hydrology 09 00009 g001
Figure 2. Time series graphs of the measured daily Tdew data for the studied locations during the training and testing periods.
Hydrology 09 00009 g002
Figure 3. Schematic diagram of modeling process.
Hydrology 09 00009 g003
Figure 4. The radar graph of correlation coefficients of the Tdew and weather variables at the studied stations.
Hydrology 09 00009 g004
Figure 5. Scatter graphs of the measured and estimated Tdew through the best-performing classical and hybrid models at the studied stations during the testing period.
Hydrology 09 00009 g005
Figure 6. Taylor diagram of the measured and estimated Tdew through the best-performing classical and hybrid models at the Rasht and Urmia station during the training and testing periods (black point: measured values; green points: ANFIS9-DFA; red points: ANFIS9-BCO; blue points: ANFIS9).
Hydrology 09 00009 g006
Table 1. Daily statistical parameters of the weather variables for the studied stations during 2006–2017.
StationVariablesMinimumMaximumMeanStandard Deviation
RashtTdew (°C)−8.225.513.16.9
Tmin (°C)−12.827.612.87.5
Tmax (°C)−1.438.621.28.4
Tmean (°C)−5.232.117.07.7
Ts (°C)0.040.218.98.9
n (hrs)0.013.44.84.2
RH (%)16.0100.081.49.8
Ws (m s−1)0.09.01.61.0
P (mm)0.0136.03.410.4
Ra (MJ m−2 day−1)15.241.829.29.5
VPD (KPa)0.02.50.50.4
UrmiaTdew (°C)−19.017.12.66.8
Tmin (°C)−18.223.75.18.4
Tmax (°C)−7.239.918.810.7
Tmean (°C)−12.429.312.09.4
Ts (°C)−7.739.015.211.7
n (hrs)0.014.58.13.9
RH (%)22.099.558.615.5
Ws (m s−1)0.18.42.70.9
P (mm)0.055.00.83.4
Ra (MJ m−2 day−1)15.041.829.19.6
VPD (KPa)0.03.10.90.7
Table 2. Parameter settings for ANFIS model.
ParameterValues
Epoch1000
Initial step size0.01
Step size decrease0.9
Step size increase1.1
Error goal0
Table 3. Input combinations defined to develop the classical and hybrid models.
ModelsInputsOutput
ANFIS1, ANFIS1-BCO, ANFIS1-DFATminTdew
ANFIS2, ANFIS2-BCO, ANFIS2-DFARaTdew
ANFIS3, ANFIS3-BCO, ANFIS3-DFAVPDTdew
ANFIS4, ANFIS4-BCO, ANFIS4-DFAnTdew
ANFIS5, ANFIS5-BCO, ANFIS5-DFARHTdew
ANFIS6, ANFIS6-BCO, ANFIS6-DFATmin, RaTdew
ANFIS7, ANFIS7-BCO, ANFIS7-DFATmin, Ra, VPDTdew
ANFIS8, ANFIS8-BCO, ANFIS8-DFATmin, Ra, VPD, nTdew
ANFIS9, ANFIS9-BCO, ANFIS9-DFATmin, Ra, VPD, n, RHTdew
Table 4. Statistical metrics of the RMSE, RRMSE, MAE, and R2 for the classical and hybrid models developed at the Rasht station.
ModelsTraining Testing
RMSE (°C)RRMSEMAE (°C)R2RMSE (°C)RRMSEMAE (°C)R2
ANFIS11.8880.1451.3470.9261.9120.1441.4060.922
ANFIS24.7870.3674.0140.5224.5710.3433.8140.553
ANFIS35.3070.4073.9880.4135.0660.3803.8580.449
ANFIS46.3850.4895.3350.1506.1850.4645.1540.179
ANFIS56.7840.5205.7350.0456.6180.4975.6800.060
ANFIS61.8880.1451.3460.9261.9110.1431.4050.923
ANFIS71.8160.1391.3550.9311.9200.1441.4860.922
ANFIS81.6060.1231.1830.9461.6980.1271.2960.939
ANFIS91.2210.0940.9270.9691.4650.1101.0730.954
ANFIS1-BCO1.8560.1421.3090.9281.8900.1421.3680.924
ANFIS2-BCO4.7810.3664.0100.5244.5680.3433.8150.553
ANFIS3-BCO5.2750.4043.9660.4205.0370.3783.8250.455
ANFIS4-BCO6.3690.4885.3110.1556.1690.4635.1410.183
ANFIS5-BCO6.6170.5075.6080.0886.4680.4865.5280.102
ANFIS6-BCO1.8220.1401.2900.9311.8490.1391.3540.927
ANFIS7-BCO1.6890.1291.2210.9411.7860.1341.3360.932
ANFIS8-BCO1.5620.1201.1420.9491.6580.1241.2520.942
ANFIS9-BCO1.1580.0890.8690.9721.3870.1041.0030.959
ANFIS1-DFA1.8480.1421.2980.9291.8770.1411.3520.925
ANFIS2-DFA4.7730.3664.0050.5254.5640.3433.8160.554
ANFIS3-DFA5.2120.4003.9280.4345.0020.3763.7940.463
ANFIS4-DFA6.3520.4875.2840.1596.1650.4635.1320.184
ANFIS5-DFA6.4520.4955.4640.1326.3580.4775.4040.132
ANFIS6-DFA1.6900.1301.2310.9401.6880.1271.2850.939
ANFIS7-DFA1.6030.1231.1880.9461.7520.1321.3290.935
ANFIS8-DFA1.4100.1081.0600.9591.5900.1191.1830.947
ANFIS9-DFA0.8770.0670.6450.9841.1460.0860.7470.972
Table 5. Statistical metrics of the RMSE, RRMSE, MAE, R2 for the classical and hybrid models developed at the Urmia station.
ModelsTraining Testing
RMSE (°C)RRMSEMAE (°C)R2RMSE (°C)RRMSEMAE (°C)R2
ANFIS12.4240.8571.9050.8742.8531.5802.2230.840
ANFIS24.5631.6133.7030.5534.5692.5303.6400.538
ANFIS34.6051.6283.6980.5444.5902.5423.6180.555
ANFIS45.8602.0724.6770.2625.7663.1934.5560.256
ANFIS56.4342.2755.3280.1126.3313.5065.0660.128
ANFIS62.4130.8531.8950.8752.8461.5762.2140.840
ANFIS72.0600.7281.5750.9092.3221.2861.7500.883
ANFIS82.0350.7191.5570.9112.2901.2681.7470.886
ANFIS91.4190.5021.0990.9571.7630.9771.3580.933
ANFIS1-BCO2.4190.8551.8960.8742.8471.5762.2160.841
ANFIS2-BCO4.5441.6073.6940.5564.5652.5283.6390.538
ANFIS3-BCO4.5911.6233.7040.5474.5682.5303.6080.559
ANFIS4-BCO5.8072.0534.6040.2755.7353.1764.5120.267
ANFIS5-BCO6.3022.2285.1730.1476.2303.4504.9520.135
ANFIS6-BCO2.3770.8401.8530.8792.8341.5692.1830.841
ANFIS7-BCO2.0440.7231.5580.9102.3071.2781.7420.885
ANFIS8-BCO1.9960.7061.5190.9142.2781.2611.7220.888
ANFIS9-BCO1.3600.4811.0330.9601.6810.9311.2890.938
ANFIS1-DFA2.4130.8531.8910.8752.8461.5762.2150.840
ANFIS2-DFA4.5231.5993.6860.5604.5442.5163.6380.543
ANFIS3-DFA4.5581.6123.6690.5544.5462.5173.5820.558
ANFIS4-DFA5.7662.0394.5690.2865.7353.1764.5120.269
ANFIS5-DFA6.2602.2145.1300.1586.2013.4344.9170.136
ANFIS6-DFA2.3540.8321.8440.8812.8401.5732.1970.841
ANFIS7-DFA1.9070.6741.4480.9222.2151.2271.6720.892
ANFIS8-DFA1.8270.6461.3860.9282.1521.1921.6230.899
ANFIS9-DFA0.7780.2750.6040.9871.3290.7361.0020.966
Publisher’s Note: MDPI stays neutral with regard to jurisdictional claims in published maps and institutional affiliations.

