Article

Land-Based Impact of Nutrient Loads and Eutrophication on an Ancient Mediterranean Natural Lake

by
Bachisio Mario Padedda
1,
Antonella Lugliè
1,
Giuseppina Grazia Lai
1,
Filippo Giadrossich
2,
Cecilia Teodora Satta
1,* and
Silvia Pulina
1
1
Department of Architecture, Design and Urban Planning, University of Sassari, Via Piandanna 4, 07100 Sassari, Italy
2
Department of Agricultural Sciences, University of Sassari, Viale Italia 39, 07100 Sassari, Italy
*
Author to whom correspondence should be addressed.
Hydrology 2022, 9(1), 7; https://doi.org/10.3390/hydrology9010007
Submission received: 19 October 2021 / Revised: 24 December 2021 / Accepted: 25 December 2021 / Published: 29 December 2021
(This article belongs to the Special Issue Aquatic Ecosystems and Water Resources)

Abstract

:
In water management plans, all human impacts on the aquatic environment are quantified and evaluated. For this purpose, lake-related assessment methods of watersheds are needed. The aim of this study is to present the environmental condition along the watershed–lake continuum of Lake Baratz, located in the northeastern part of Sardinia. We provide a method to evaluate the impact of a small watershed area on the trophic state of this ancient Mediterranean natural lake. This study demonstrates the potentialities of coupling simple land structure-based models with empirical ones, allowing one to hierarchize, interpret, and predict the relationships among the watershed ecological unity and lake trophic conditions at multiple spatial and temporal scales. It also demonstrates how the impact of single and interacting nutrient stressors can have a different impact on the trophic status which, in particular, applies to autotrophs, constituting a key response in the ecosystem. We suggest that the stressor hierarchy should be considered as a way of prioritizing actions in the cost-effective implementation of conservation and management plans.

1. Introduction

Eutrophication has widely increased in inland waters worldwide over the past 50 years. Anthropogenic nutrient enrichment has been identified as the major cause for both observed elevated inorganic or organic nutrient concentrations and modified nutrient ratios [1,2].
The main sources are the discharge of point wastewaters from urban, industrial, and zootechnical agglomeration and non-point pollution from intensive agricultural practices [3]. As an intermediate category causing nutrient pollution, overflows from urban septic and wastewater treatment plant systems and road or track runoff can be named [4]. Especially during recurring floods, the latter constitutes an uncontrolled and poorly investigated nutrient source that is greatly expanding due to intensified soil sealing, particularly in urbanized areas [5].
The quantity and quality of nutrient inputs for a water body can have profound effects upon an ecosystem’s processes and structure, ultimately altering the water quality and influencing its biodiversity. More specifically, bioavailable loads of phosphorus and nitrogen in inland waters can lead to unbalanced positive feedback in the system gradually moving it away from equilibrium. The first observable effect concerns a significant increase in primary productivity and hence autotrophic biomass that cannot be efficiently controlled by consumers. The excess organic substance therefore enters the detritus pathway, in which bacterial remineralization leads to oxygen depletion. This process feeds itself when, in addition to anoxic stress, toxic secondary products such as ammonia and hydrogen sulphide are generated, which further impair heterotrophs in the entire trophic web, generating anomalous changes in abundance and a reduction in diversity [2,6,7]. One of the most detrimental effects associated with eutrophication is the increasing presence of harmful organisms. Among these, cyanobacteria are most often responsible for the production and release of toxins following extensive blooms and hence are of great concern [8].
Once a water body is eutrophied, it can lose its fundamental ecosystem services and subsequently negatively influence the sustainable development of the local economy and society in direct and indirect ways [9]. Economic costs can arise from the loss of supporting functions (habitat refugia), provisioning functions (filtering, retention, and storage of drinking water), regulating functions (removal, breakdown, or pollutant abatement) and cultural functions (recreation, fishing, and boating).
Therefore, the solutions nowadays for combating eutrophication and allowing recovery of the multiple functions of the aquatic system have become environmental key issues. Various approaches have been proposed for preliminary assessment of the trophic status of aquatic ecosystems [10] and predicting the quality of water bodies in relation to nutrient loads from watersheds [11]. These approaches are the starting point for formulating proposals to subsequent “structural” interventions based on large territorial planning or in the use of faster (but less resolving) “symptomatic” palliative in-lake techniques.
Examples of effective and easily reached eutrophication control include sharp reductions in the point source inputs of nutrients [12,13,14]. On the contrary, the success of non-point nutrient source controls is less effective (e.g., [15,16,17]) because they are affected by a complex continuum of processes from rural land use to the receiving waterbody (i.e., by the biogeochemical processes altering the bioavailability of nutrients during passage through the landscape and the role of other random factors, e.g., floods, drought and fires).
However, if the goal is to manage land-based activities to maintain or improve a lake’s water quality, the link between the assessment of land nutrient loading to in-lake nutrients must be stressed [1].
In this sense, the coupling of models based on nutrient export coefficients [17] coupled with robust predictive models (e.g., Vollenwider’s model proposed for OECD [18]) is a useful and essential way to calculate the mass balance of N and P, linking their external inputs to water body concentrations in relation to the morphometric and hydrodynamic characteristics of the lake. Model approaches are relevant not only to guiding environmental quality assessments and subsequent development of restoration plans [19] but are also a key feature in predicting future trends, particularly to face the worsening of eutrophication resulting from the effect of rapid climate change [20,21].
In this paper, we evaluated the hypothesis of how the deterioration of the water quality and ecological integrity in the ancient Mediterranean natural Lake Baratz due to eutrophication is the result of watershed degradation from land use intensification. The specific objectives of this study were to (1) estimate the entity of eutrophying nutrient loads from the watershed by means of a territorial analysis, (2) experimentally assess the in-lake conditions with a 1-year monitoring program, (3) verify the effect of external nutrient loads on the lake’s water quality through the use of Vollenweider regression models, and (4) provide a basis for management policies suggesting how to address the mitigating of nutrient losses in a small watershed. Scenarios of trophic state reduction are then proposed by proven manipulations of the nutrient inputs in order to improve the lacustrine water quality.
Shallow lakes are considered to be among the more sensitive aquatic ecosystems compared with deep lakes due to their own specific ecologies and the speed with which they respond to external solicitations [22]. From a global point of view, these lake ecosystems can be used as good sentinels to understand the consequences of environmental changes. Our study case can be an example to be followed and a further contribution to the review of the international literature, specifically for protecting the ecological integrity (or restoration) of the described freshwater ecosystems.

2. Materials and Methods

2.1. Study Area

Lake Baratz is the only natural lake in Sardinia. It is located in the municipality of Sassari just over one kilometer from the seashore of Porto Ferro (Figure 1). The lake derives from the natural damming of the river valley of the Rio dei Giunchi by a sandy dune. The lake has a surface area of 0.6 km2, a coastal length of 4 km, a maximum depth of 10 m, and an average depth of 5 m. The calculated volume is about 1.8 × 10⁶ m3. Despite having no emissaries, the maximum depth of the lake does not grow beyond the current level due to the permeability of the sand dune [23]. Over the years, the depth of the lake varied considerably from the maximum in the 1960s (14 m) to the minimum in the early 2000s (4 m) due to water withdrawals for agriculture [24]. Currently, the level of the lake is of particular concern due to the scarcity of rainfall in recent years.
The watershed area of Lake Baratz extends for 12 km2. It is almost flat, with hilly reliefs up to a maximum altitude of 120 MASL. Over the years, the watershed under examination has undergone changes due to intensive agricultural development, with consequent qualitative degradation of the runoff water supplies, negatively affecting the wetlands present (tributaries of the lake and the lake itself). The increase in the load of nutrients, aggravated by the lack of emissary streams, has generated processes of accelerated eutrophication, which have led to extensive dystrophic crises in the warmer seasons (e.g., high temperatures, wind absence, and poor water exchange), with consequences that are reflected in the entire ecosystem. A few studies have described the ecological features of the lake in the past. The first study in 1978 [23] delineated the eutrophic conditions of the lake, considering the trophic descriptors (total phosphorus of 55 mg P m−3; chlorophyll a of 40 mg m−3) and relating the dominant phytoplankton taxa (Microcystis, Anabaena, and Aphanizomenon). The eutrophic conditions were confirmed in 1994, with almost the same values for the total phosphorus and chlorophyll a (60 mg P m−3 and 40 mg m−3, respectively) and the presence of Prymnesium parvum N.Carter, Sphaerospermopsis aphanizomenoides (Forti) Zapomělová, Jezberová, Hrouzek, Hisem, Řeháková & Komárková, and Chaetoceros muelleri Lemmermann [25]. The most recent assessments were made in 2011 and 2012 within the LIFE+ InHabit project, where contrasting values were detected due to a high concentration of the total phosphorus (140 mg P m−3) and nitrogen (1345 mg N m−3) but very low concentration for chlorophyll a (7 mg m−3). The most abundant taxa were Lyngbia sp., Prymnesium sp., Monoraphidium convolutum (Corda) Komárková-Legnerová, and S. aphanizomenoides. According to the European Habitat Directive, the area is included in SIC ITB011155 “Lago Baratz—Porto Ferro”.

2.2. Sampling Strategy and Analyses

The surveys covered one annual cycle during 2016–2017, with monthly samplings from April to March (only in December 2016 was sampling not possible due to the adverse weather conditions). War devices from the Second World War were identified on the bottom of the lake, hindering the sampling activities and the ecological study of the lake. At present, the sampling was restricted to a single station around a reclaimed area where a small platform is anchored at the point of the maximum depth, identified in agreement with the requirements of the institutional sampling protocol [26]. Water samples were collected at fixed depths using a Niskin bottle (volume 2.5 L) along a vertical profile from the surface and at intervals from 1 m to 1 m off the bottom.
The water temperature (TEM), conductivity (CON), pH (pH), and dissolved oxygen (DO) were measured in situ using a multiparametric probe (YSI model 6600 V2, Yellow Springs, OH, USA). Water transparency was assessed by means of a Secchi disk (SD).
The water samples were stored in cold and dark conditions before laboratory analyses, which were performed within 24 h from sampling. The nutrient concentrations were analyzed for ammonium (NH4), nitrate (NO3), nitrite (NO2), total nitrogen (TN), orthophosphate (RP), and total phosphorus (TP) according to [27]. Chlorophyll a (CHLa) was analyzed as described by Goltermann et al. [28]. The dissolved inorganic nitrogen (DIN) was reported as the sum of NH4, NO3, and NO2.
Samples for phytoplankton analyses were collected at the same depths as for the physical and chemical parameters. The phytoplankton samples were fixed with Lugol’s iodine solution and analyzed after the sedimentation of variable water volumes (5–10 mL), depending on the phytoplankton cell density, using an inverted microscope (Zeiss, Axiovert 25 [29]). Cell counts were conducted at 200× magnification for the entire bottom of the sedimentation chamber for the larger and more easily identifiable species and replicated at 400× on a selected number of fields for the smaller cells. The species were determined using several taxonomic guides as reported in Mariani et al. [30,31]. Unidentified cells of sizes 5–10 µm were categorized to be in the dimensional group of nanoplankton [32] and indicated as “n.a.”.

2.3. Nutrient Load Calculations

The calculation of nutrient loads was estimated by means of a theoretical statistical methodology following the export coefficient modeling approach (ECMA) [17]. The amount of nutrient load was calculated by multiplying the entity dimension of each nutrient source (obtained as described in detail in the following paragraphs) for a specific export coefficient (Table 1).
Nutrient sources belong to two main categories: point and non-point sources. For the point sources, three subcategories were considered: wastewaters from urban (UW), industrial (IW), and livestock (LW) activities. Non-point sources are ascribed to runoff from three macro-classes: urban (UA), agricultural (AA), and natural and seminatural areas (NsNA). The selection of export coefficients for this study was derived from the literature. Coefficients were quantified and made available for Italy through various empirical studies (see references in Table 1) and successfully used and validated in the Sardinian regional context by previous studies [33,34,35,36]. In general, for each source, coefficients express the rate at which the total nitrogen and phosphorus are exported. For UA, AA, and NsNA, releases are calculated from the land use type in the catchment, while for LW, the amount released depends on the animal weight and its origin from stock houses and grazing land (taking into account the time each livestock type will spend in stock housing), and for UW and IW, wastes depend on the use of detergents and dietary factors in the local population and industrial employees, adjusted to take account of any treatment of the wastes before discharge to a water body [17].

2.3.1. Point Sources

The watershed of Lake Baratz, being of a small size, hosts a negligible presence of urban (UW) and no industrial (IW) settlements, which generate reduced nutritional loads that can impact the lake system. Data for these sources were derived from the annual national demographic census [37] and from the 9th National Industrial Census [38]. Data for livestock activities were derived from the database of the National Registry for Animal Husbandry (BDN) established by the Italian Ministry of Health [39].

2.3.2. Non-Point Sources

To explore the land uses of the drainage basin (i.e., to identify the extension of UA, AA, and NsNA areas), spatial data processing was performed with the support of a geographic information system (GIS). The analysis focused on evaluation of the land cover, using techniques of classification to generate polygons by clipping the shape of the most recent land use map [40], which was obtained by automatic classification of digital images of a medium spatial resolution (1:25,000). Each segmentation analysis was measured to obtain objects in accordance with the Corine Land Cover 2000 system’s nomenclature [41]. To accomplish the nutrient load calculations, the watershed areas were aggregated into the three homogeneous macro-classes (UA, AA, and NsNA) in accordance with the 4th hierarchical level (Table 1).
Table 1. Nutrient load export coefficients and category descriptions.
TypeGroup 1DescriptionReferencesUnitsExport Coefficients
TPTN
PointUWPermanent residents[42,43]kg × inhabitant y−10.332.25
PointUWFloating population3/12 (3 months per year) the coefficient of permanent residentskg × inhabitant y−10.08280.5544
PointIW [33]kg × employee y−10.450002.24840
PointLSSheep[44]
adjusted as in [33]
kg × unit y−10.010000.06125
PointLSCowskg × unit y−10.092500.68750
PointLSHorseskg × unit y−10.108750.77500
PointLSPigskg × unit y−10.047500.14125
PointLSPoultrykg × unit y−10.007300.02555
Non-PointUAAll areas identified in the preceding subdivision 1 (artificial surfaces) of the 4th-level CORINE LC[43,45]Kg × ha y−10.207.00
Non-PointAAAll areas identified in category 2 (used agricultural surfaces), except category 244 (agroforestry areas) of the 4th level CORINE LCkg × ha y−10.6016.00
Non-PointNsNAAll areas identified in category 3 (forests and semi-natural areas) except the category 3315 (beds of streams wider than 25 m) + category 244 (agroforestry areas) of the 4th-level CORINE LCkg × ha y−10.102.00
1 Abbreviations in the text.

2.4. Predictive Modeling

To verify the causes of lake productivity and trophic responses to nutrient loads, the OECD predictive model in the variant for shallow lakes and reservoirs [18] was applied. This model, already proficiently tested in various regional contexts of Sardinian lakes, provides a robust tool to assess the impact of the watershed structure on lakes [33,34,35,36,46,47]. The model was limited to P, which is the most important key nutrient in controlling the primary production in Sardinian reservoirs [8,48,49] and for which this modeling tool can be confidently used. This model synthesizes the standard OECD equations for the relations between the average phosphorus inflow concentration (Pi) and the expected phosphorus lake concentration (Pexp) and chlorophyll a (CHLexp) as a function of the average water residence time (tw), as calculated by two equations:
Pexp = 1.22 × [Pin/(1 + √tw)]0.87
CHLexp = 0.18 × [Pexp]1.09
The Pi concentration was determined considering the sum of the phosphorus loads, calculated as in Section 2.3 (i.e., multiplying the quantity entity of each nutrient source present in the watershed by a specific source export coefficient), reported as the value of the multiannual average of the water in-flow into the lake (as estimated in a previous study by Giadrossich et al. [50], considering the years from 2009 to 2014).
Again, using the data reported by Giadrossich et al. [50], the multiannual average value of the water residence time (tw) was calculated considering the years from 2009 to 2014.
If the concentration of the in-lake total phosphorus (TP) measured during the monitoring year turned out to be significantly similar (Δ < 5%) to the expected phosphorus lake concentration (Pexp) by the OECD model, then a hypothesis of nutrient loading reduction was performed in order to propose management strategies to guide lake restoration. We evaluated the theoretical variation of the trophic states of Lake Baratz, resulting from a selective reduction in the phosphorus load (Pi) from the different sources. The resulting theoretical trophic state was evaluated according to OECD Probability Distribution Diagrams (OECD, 1982).

3. Results

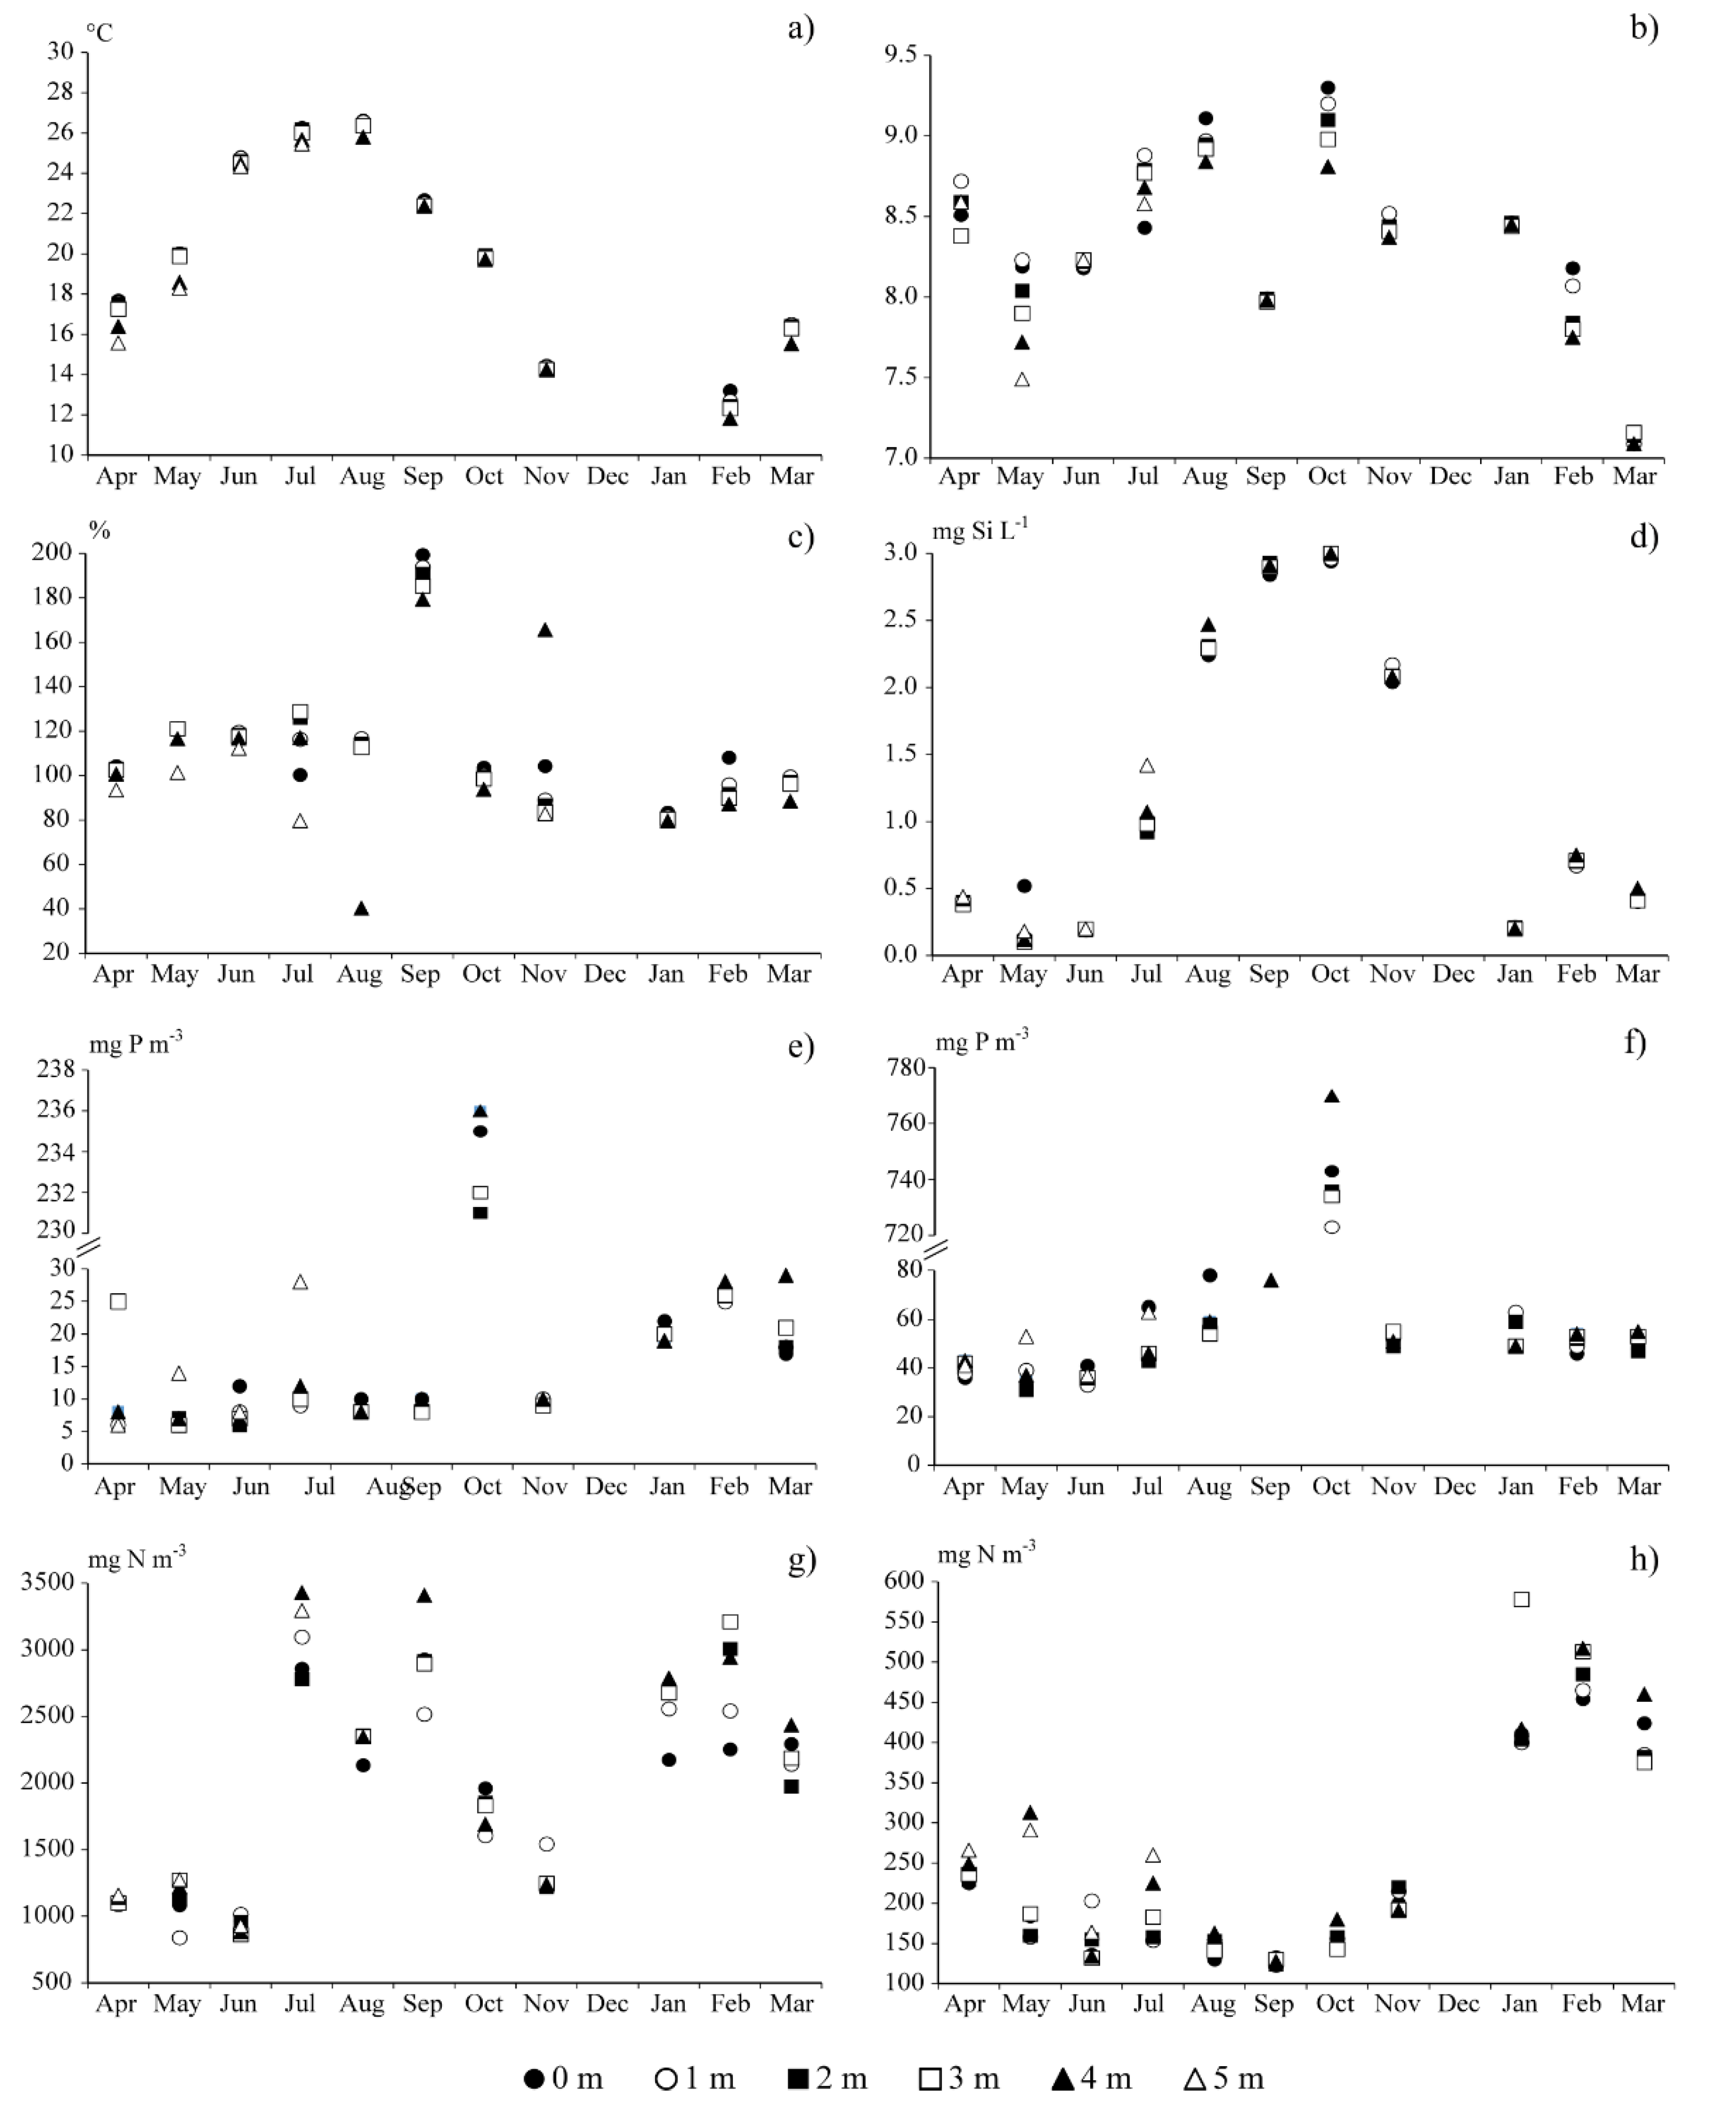
3.1. Environmental Conditions

The annual average TEM in the water column was 18.9 °C. The values varied between a minimum of 9.1 °C (January) and a maximum of 26.6 °C (August) (Figure 2a). Due to the reduced bathymetry, the water column presented uniform values typical of complete mixing, with a maximum variation from 9.23 °C on the surface to 9.13 °C at the bottom in January and from 26.62 °C on the surface to 25.80 °C at the bottom in August.
The pH was high and equal to a mean of 8.3 units, typical of a condition of sustained productivity (Figure 2b).
The DO was generally above saturation, and no evident anoxia events were found except sporadically near the bottom (40.3% in August). The average saturation was equal to 109%. This condition, in agreement with the pH values, indicates a system strongly under the control of the autotrophic component (Figure 2c). As for the temperature, the DO values were found to comply with a mixing condition with a maximum variation from 199% on the surface to 179% at the bottom in September and from 108% on the surface to 87% at the bottom in February.
The TP, as the main trophic descriptor, showed an average value of about 118 mg P m−3 and a sporadic but pronounced peak of 770 mg P m−3 (in October) (Figure 2e). RP represented about 28.5% of the TP (average concentration of 33 mg P m−3) (Figure 2f). The TN showed an average value of 2018 mg N m−3, ranging from a minimum of 839 mg N m−3 (May) to a maximum of 3429 mg N m−3 (July) (Figure 2g).
Dissolved inorganic nitrogen (DIN) represented a small share of the TN, being about 13.8% on average (Figure 2h). Consequently, the TN was almost all organic N. In the DIN composition, NO3 prevailed, with an average value of 146.8 mg N m−3.

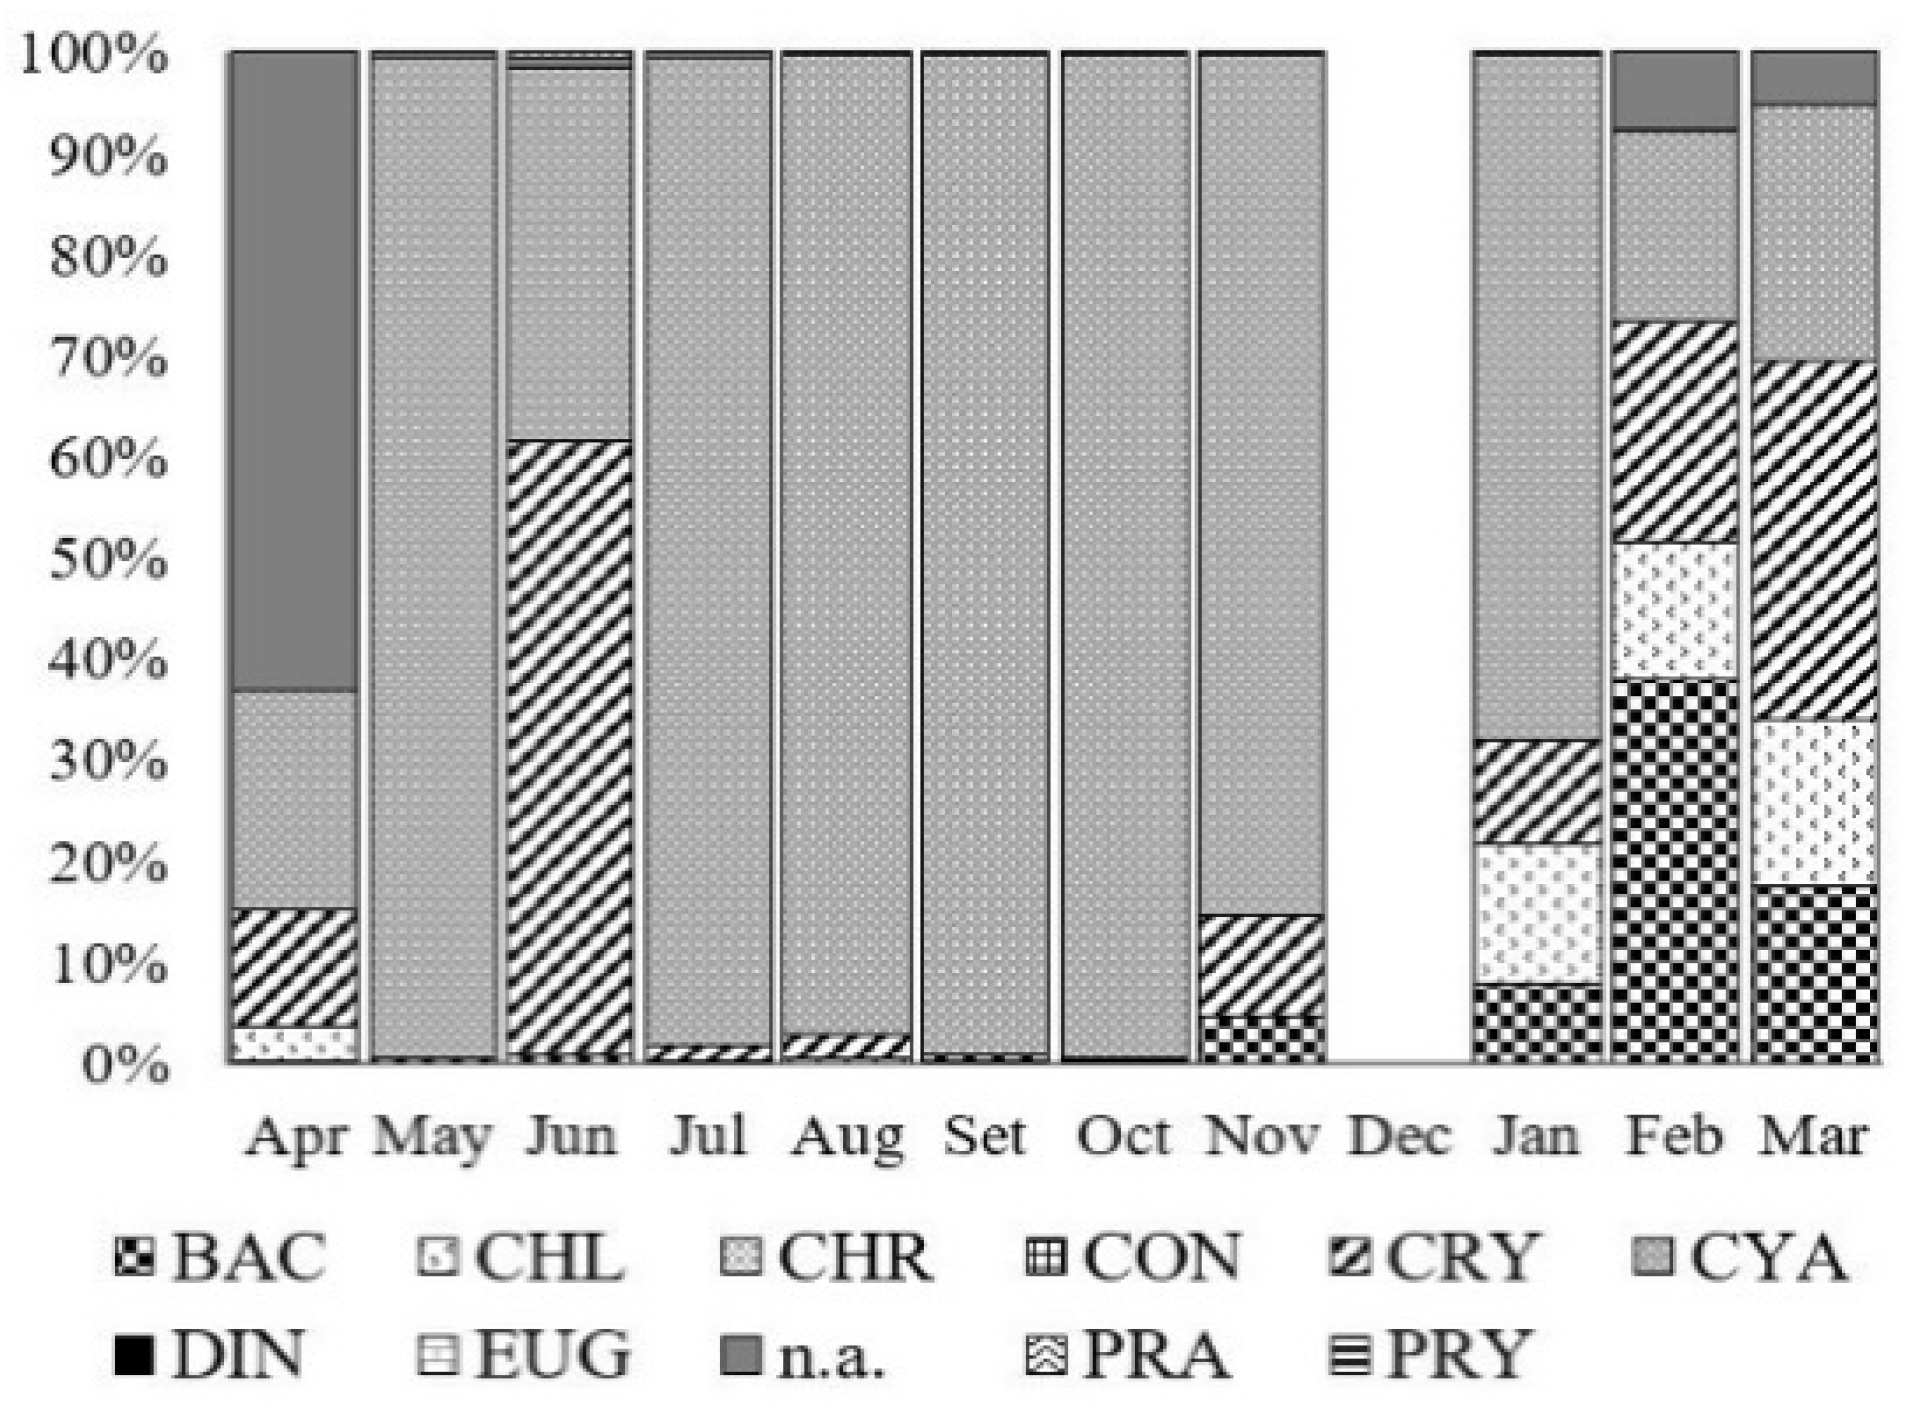
3.2. Chlorophyll and Phytoplankton

Regarding the autotrophic component, the seasonal dynamics of CHLa and the total phytoplankton density (TPD) were almost synchronous and hence correlated (Pearson r = 0.675; p < 0.05) (Figure 3). The mean annual value of CHLa was 5.5 mg m−3, with a maximum peak of 18.9 mg m−3 in September. The mean annual value of the TDP was 24 × 106 cells L−1, with a first maximum peak of 99 × 106 cells L−1 in May and a second one of 73 × 106 cells L−1 in September, coinciding with the CHLa peak. Cyanophyceae were the class that contributed most to the TPD throughout the study period, especially in the summer seasons, when the percentages exceeded 90% (Figure 4). This class was mainly represented by Microcystis flos-aquae (Wittrock) Kirchner and Sphaerospermopsis aphanizomenoides and in a sub-order by Pseudanabaena sp. An important contribution to the TDP was also given by the class of Bacillariophyceae with Cyclotella spp., by Cryptophyceae with the species Plagioselmis lacustris (Pascher & Ruttner) Javornicky, and by Chlorophyceae with Ankira sp. and Carteria sp. in the winter–spring period. In this period, the Cryptophyceae class contributed between 5 and 50% to the TDP, the Bacillariophyceae class contributed between 5 and 40%, and the Chlorophyceae class contributed between 10 and 20%.

3.3. Trophic State

The trophic classification, evaluated according to Vollenweider [51], confirmed that Lake Baratz expressed a highly variable trophic condition (Table 2). According to the OECD Probability Distribution Diagrams, the lake showed a probability of 55% to express a whole eutrophic-hypereutrophic condition and of 40% to reflect a mesotrophic state. Using TSI, the average value of the different metrics (TP, CHL, and SD), was 54, indicating a reliable meso-eutrophic condition. As we observed, the TSI indices based on CHLa and SD were close together, but both fell below the phosphorus value (TSI(TP) > TSI(CHL) = TSI(SD)). As proposed by Carlson [52], this might suggest that intense zooplankton grazing, for example, may have caused the CHLa and SD indices to fall below the TP index as zooplankton can remove algal cells from the water, and the SD index may fall below the CHLa index if the grazers selectively eliminate the smaller cells.

3.4. Nutrient Loads

Generally, the nutrient load modeling showed that the point sources were of minor importance compared with the non-point sources for the nutrient load transported into the lake (Table 3).
The greater part of the point sources load could, however, be attributed to the LS, which annually produced on average 0.033 t P y−1 and 0.185 t N y−1. The UW load was of lesser impact, being 0.005 t P y−1 and 0.034 t N y−1. Among the non-point sources in particular, the AA added up on average to a load of 0.365 t P y−1 and 9.527 t N y−1. The NsNA provided a load of 0.058 t P y−1 and 1.186 t N y−1 on average. The export from the UA was negligible and equal to 0.002 t P y−1 and 0.060 t N y−1. The total sum of the average annual nutrient loads therefore equaled 0.455 t P y−1 and 10.992 t N y−1.

3.5. Phosphorus Mass Balance and Predictive Modeling

In a subsequent step, the nutrient load model was coupled to the OECD predictive model in order to estimate the expected TP concentration in the lake. The application of the model required information on the morphometric and hydrodynamic features of the lake system. In the 6 years prior to this study, on average, the lake volume was about 1.789 × 10⁶ m3, with an inflow of 1.129 × 10⁶ m3 and a water residence time of 1.811 years (661 days). From the final calibration of the predictive model, an expected nutrient concentration of 122 mg m−3 for TPexp and 33 mg m−3 for CHLexp was estimated in the lake. As for the TP, the data detected by modeling were close to the measured concentration (118 mg P m−3), with a difference of only 3.3%. The modeled CHLa values, however, differed considerably from the measured in-lake concentration of 5.5 mg m−3 (difference of 22%).
This coupled model set-up can provide simulations to propose a measure of recovery of the system, such as to bring the system back at least close to a threshold of mesotrophy, working primarily on the containment of the TP load and on the hydraulic levers (i.e., ensuring an adequate water input).
It is therefore a question of calibrating the variables of the predictive model so that the expected result is lower than a better tolerable threshold below the class limit that marks the transition towards eutrophy (i.e., <35 mg P m−3 for the TP and <8 mg m−3 for CHLa) [51].
One of the possible scenarios resulting from manipulation should bring the quota of the TP loads to 0.204 t P y−1, which is a reduction of the AA non-point sources by 70% and LS by 50%. The hydrological input must be such that it ensures a lake volume of 2.5–3 × 10⁶ m3 and a water residence time of 1.1 y−1.
According to this modeling set-up, the lake could be brought back to a concentration of TPexp at 33 mg P m−3 and a CHLexp of 8 mg m−3, leading to the transition of the lake from a eutrophic state to at least a mesotrophic one, with the consequent recovery and improvement in water quality.
Any further lowering of the nutrient loads or speeding up of the water residence time leads to a further possible lowering of the expected concentrations.

4. Discussion

The picture that emerges from the monitoring survey reported in this study highlights an ongoing trend in which a high nutrient input in combination with a reduced water supply results in a high nutrient concentration, which severely limits the quality of the system.
In fact, by means of the trophic status evaluation models, we were able to validate the attribution of the lake as eutrophic. In correlation with the eutrophic state, high photo-synthesis activity as a result of phytoplankton blooms during the spring and summer was assessed, leading to oxygen oversaturation in the surface waters and depletion in the deep waters. It has long been argued how autotrophs have a key role in reflecting the state of the ecosystem and how the phytoplankton abundance and structure is closely associated with the water quality. As was assessed, the nutrient concentrations exceeded the amount required for phytoplankton’s maximum growth. The concentrations of the bioavailable N and P in Lake Baratz averaged 250 mg N m−3 for the DIN and 32 mg P m−3 for RP. The explosive growth of phytoplankton and especially of cyanobacteria in the spring and summer is one of the most dangerous effects of eutrophication [53,54]. In Lake Baratz, this is becoming evident, with Cyanobacteria exceeding 90% of the total phytoplankton density with peaks over 280 × 106 cells L−1. The concentration of chlorophyll a was lower in average terms if compared with the nutrient availability and the average density of phytoplankton. The coupling of the phytoplankton density and chlorophyll a concentration was quite evident and sustained in conjunction with the late summer and autumn peak periods, while the response of both autotrophic descriptors with respect to the nutrients seemed to apparently be obscured in the other seasons, where productivity was less abundant. This may be due to several factors, but it is plausible that internal nutrient recycling and release from sediment in the late summer period is a boost to phytoplankton that reduces nutrient dependence in the water column [55].
Clearly, the high availability of nutrients was the main causal factor for the evolution of eutrophic processes in the lake. It was substantially derived from the high loads, as is discussed in the following.
In the catchment area, the presence of human settlements is scarce. Almost all the eutrophicating loads derive from non-point sources and, to a lesser extent, animal husbandry. The territory results were equally divided between the AA (5.95 km2) and NsNA (5.92 km2). The livestock consistency was also low; at the time of the analysis, 78 cattle, 2227 sheep, 74 pigs, and 9 horses were identified.
This structure of the watershed can generate a theoretical total load of 0.471 t P y−1 and 10.992 t N a−1 almost completely attributable to non-point sources (91.9–98%). The coupled application of the OECD management model [18] to predict in-lake TP concentrations on the basis of theoretical loads and the residence time in the lake provided an estimate of the concentration equal to the experimentally measured value. The model therefore simulates the processes leading to eutrophication very well by considering the interrelationships in the river basin–lake continuum. As such, the coupled model approach is a validated tool for proposing management strategies. In fact, it is possible to advance possible corrective scenarios of the trophic state conditions by simulating, for example, the contingency of the different sources (where possible) or by varying the hydrodynamic data.
As phosphorus is generally recognized as being a key nutrient in controlling primary production [22], the regulation of P export by the sources contributing the most is the prerogative to mitigating eutrophication. In particular, mitigation actions should immediately focus on reducing the exports from agricultural and animal husbandry areas as much as possible. We evaluated that a reduction of 70% from AA and 50% from LS is essential to bring the lake back to at least a condition of mesotrophy.
Among the measures that can be implemented in agricultural areas are improvements in fertilizer management, association with measures to reduce soil erosion, transitioning to species requiring fewer fertilizers and pesticides, and adoption of organic farming. Compared with the point sources, the implementation of animal husbandries should be discouraged because they are responsible for the majority of the amount of soluble P that enters the lake system [56,57]. Other strategies combined with the previous measures include modifying the P and N paths in the drainage basin by building small wetland systems and restoring large ribbons of riparian vegetation along the tributaries, which can be an effective filter for nutrient runoff in the lake and provide other ecological services locally. Some of those interventions can fall in the field of the green-blue infrastructures, also called “Nature-Based Solutions” (NBS). NBS is an umbrella definition that indicates all-natural solutions aimed at generating ecosystem benefits, generally of multiple types. Several reports in 2020 on evidence of NBS in different European projects demonstrated the high potential of this field [58].
In the agricultural context, and as such applying to the example presented here, we can consider three suitable NBS approaches: (1) phytoremediation, (2) re-vegetation of drainage ditches, and (3) buffer strips.
Phytoremediation consists of constructed wetlands that have significantly lower operating costs than conventional technological systems, such as wastewater treatment plants [59]. Constructed wetlands, thanks to various physical, physiological, and biological processes that are specific to each type of pollutant, offer significant potential to control and optimize the desired removal performances [60]. The downside is the exploitation of an extensive system area. Innovative phytoremediation systems such as Forced Bed Aeration (FBA™) and French Reed Beds (FRBs) can reduce the system area by 4–5 times. These recent plant solutions, in addition to guaranteeing good purification yields and being characterized by management simplicity and low construction and management costs, are particularly advantageous because they reduce the surfaces required and energy consumption and have a greater regulation capacity compared with conventional activated sludge systems, which allow coping with very significant increases and fluctuations in load [61,62].
Re-vegetation of drainage ditches yields low retention capacities, being conceived as a free-flow constructed wetland, but among their benefits is that of significantly increasing the self-purification capacity of rivers [63,64]. This practice is often opposed by citizens who do not look favorably on the presence of vegetation within the watercourse, believing that this can represent a risk in the case of floods.
Regarding buffer strips, in 20 years of studies, it has been understood how different configurations of vegetation, varying from simple grass to combinations of grass, trees, and shrubs, can significantly reduce surface flow and suspended solids, nitrates, and phosphates originating from agricultural run-off. With this approach, even 2–4-m strips are enough to intercept more than 70–80% of nutrients. Buffer strips must, in any case, be designed to maximize the purification yields, paying attention, for example, to the riverbed to intercept groundwater, intercept any bypasses, integrate with small wetlands to smooth the flow, and eventually place stages with high phosphorus absorption capacities. Other advantages of buffer strips include the possibility of retaining and treating up to 60% of pesticides used in agriculture and integrating with short-rotation forestry systems for the production of biomass [65,66].
Those types of NBS also lend themselves to the involvement of the main stakeholders (i.e., farmers) who, thanks to a “land–steward” partnership, can actively take care of the riparian areas around their territorial plots [67].
Another necessary action is the maintenance of adequate water inputs to minimize the hydraulic residence time, with the constraint of the endorheic peculiarity of the lake. In fact, in recent years, Lake Baratz has undergone serious water crises that are more identifiable in the upstream water abstraction as well as by the evident superimposed effect of the climate changes underway in the Mediterranean area [68,69]. As in the case of Lake Baratz, the increase in summer temperatures and the decrease in rainfall, in fact, are translating into desertification processes linked to the decrease in soil moisture and to the increase in evapotranspiration rates, further aggravated by an intensification of the use of groundwater for agricultural purposes. In addition to the significant supply of nutrients, the trophic state conditions are further altered due to a hydrological imbalance of the system. In relation to the recurring water level changes, the lake as a whole tends to behave almost like an artificial lake. The lowering of the lake level induced by the increase in air temperatures and subsequent increase in evapotranspiration rates can interfere with the thermal zoning of the water body and, in extreme cases, cause the premature breakdown of the thermocline and “out of season” water circulation. Moreover, the high summer temperatures can establish phenomena of atelomysis (daily stratification) with the creation of an ephemeral and shallow thermocline but, in the most productive lakes, sufficient to generate phenomena of hypolimnetic anoxia, with the consequent mobilization of phosphorus from the sediments. The thermocline generally forms, in the absence of wind, during the hottest hours of the day and lasts until late afternoon. These few hours are sufficient to consume the hypolimnetic oxygen and to establish reducing conditions that release the phosphorus trapped in the sediments [70].
These factors, if not adequately contained, will further negatively affect the quality of the water and surrounding area. The control of pollution sources must go hand in hand with the adoption of solutions for the renaturation of terrestrial systems such as those suggested. A monitoring program must also be envisaged to verify the success of the interventions and the maintenance of the environmental standards proposed [71] to preserve a unique ecosystem in the Mediterranean area.

5. Conclusions

This study shows the importance of incorporating the regulating factors for eutrophication along the entire watershed–lake continuum in order to come up with predictive management plans to mitigate the unfavorable ecosystem state. The strength of the ecosystem’s functional responses varies between its different compartments in patterns that cannot be explained by analyzing the different ecosystem compartments. In the specific context of the Baratz system, the results of the lake, even if small in size, are profoundly altered by a complex, artificially modified and very climate-sensitive drainage basin. The implementation of coordinated and unified recovery actions, such as those based on Nature-Based Solutions, is the best strategy to improve the trophic state condition of the lake in a lasting perspective.

Author Contributions

Conceptualization, B.M.P. and A.L.; methodology, B.M.P.; validation, A.L., C.T.S., G.G.L., F.G. and S.P.; formal analysis, B.M.P.; investigation, B.M.P., C.T.S., F.G., G.G.L. and S.P.; resources, B.M.P. and F.G.; data curation, B.M.P. and S.P.; writing—original draft preparation, B.M.P.; writing—review and editing, B.M.P., A.L., G.G.L., F.G., S.P. and C.T.S.; supervision, B.M.P. and A.L.; project administration, B.M.P.; funding acquisition, B.M.P. All authors have read and agreed to the published version of the manuscript.

Funding

Funding for this research was provided by the “Climate and land-use changes on the lake water balance in semi-arid Mediterranean Environment” project founded by the Fondazione di Sardegna 2015 call proposal (implementing body University of Sassari, rep. 2539, prot. 23907, 05/10/2015). The activities of Antonella Lugliè and Bachisio Mario Padedda were supported by a research fund from the University of Sassari (Fondo di Ateneo per la Ricerca 2020).

Institutional Review Board Statement

Not applicable.

Informed Consent Statement

Not applicable.

Data Availability Statement

The data presented in this study are available on request from the corresponding author.

Acknowledgments

We gratefully acknowledge all the staff at the Laboratory of Aquatic Ecology of the University of Sassari for the analysis of water samples. We are also thankful to Birte Matthiessen for the linguistic revision of the manuscript and for the precious suggestions to improve it.

Conflicts of Interest

The authors declare no conflict of interest. The funders had no role in the design of the study; in the collection, analyses, or interpretation of data; in the writing of the manuscript, or in the decision to publish the results.

References

  1. Le Moal, M.; Gascuel-Odoux, C.; Ménesguen, A.; Souchon, Y.; Étrillard, C.; Levain, A.; Moatar, F.; Pannard, A.; Souchu, P.; Lefebvre, A.; et al. Eutrophication: A New Wine in an Old Bottle? Sci. Total Environ. 2019, 651, 1–11. [Google Scholar] [CrossRef] [Green Version]
  2. Smith, V.H.; Tilman, G.D.; Nekola, J.C. Eutrophication: Impacts of Excess Nutrient Inputs on Freshwater, Marine, and Terrestrial Ecosystems. Environ. Pollut. 1999, 100, 179–196. [Google Scholar] [CrossRef]
  3. Weigelhofer, G.; Hein, T.; Bondar-Kunze, E. Phosphorus and Nitrogen Dynamics in Riverine Systems: Human Impacts and Management Options. In Riverine Ecosystem Management. Aquatic Ecology Series; Schmutz, S., Sendzimir, J., Eds.; Springer: Cham, Switzerland, 2018; Volume 8, pp. 187–202. [Google Scholar] [CrossRef]
  4. Edwards, A.C.; Withers, P.J.A. Transport and Delivery of Suspended Solids, Nitrogen and Phosphorus from Various Sources to Freshwaters in the UK. J. Hydrol. 2008, 350, 144–153. [Google Scholar] [CrossRef]
  5. Bradford, A.; Denich, C. Rainwater Management to Mitigate the Effects of Development on the Urban Hydrologic Cycle. J. Green Build. 2007, 2, 37–52. [Google Scholar] [CrossRef]
  6. Karpowicz, M.; Ejsmont-Karabin, J.; Kozłowska, J.; Feniova, I.; Dzialowski, A.R. Zooplankton Community Responses to Oxygen Stress. Water 2020, 12, 706. [Google Scholar] [CrossRef] [Green Version]
  7. Fadda, A.; Marková, S.; Kotlík, P.; Lugliè, A.; Padedda, B.; Buscarinu, P.; Sechi, N.; Manca, M. First Record of Planktonic Crustaceans in Sardinian Reservoirs. Biologia 2011, 66, 856–865. [Google Scholar] [CrossRef]
  8. Mariani, M.A.; Padedda, B.M.; Kaštovský, J.; Buscarinu, P.; Sechi, N.; Virdis, T.; Lugliè, A. Effects of Trophic Status on Microcystin Production and the Dominance of Cyanobacteria in the Phytoplankton Assemblage of Mediterranean Reservoirs. Sci. Rep. 2015, 5, 17964. [Google Scholar] [CrossRef] [Green Version]
  9. Grizzetti, B.; Liquete, C.; Pistocchi, A.; Vigiak, O.; Zulian, G.; Bouraoui, F.; de Roo, A.; Cardoso, A.C. Relationship between Ecological Condition and Ecosystem Services in European Rivers, Lakes and Coastal Waters. Sci. Total Environ. 2019, 671, 452–465. [Google Scholar] [CrossRef] [PubMed]
  10. Zhang, Y.; Li, M.; Dong, J.; Yang, H.; van Zwieten, L.; Lu, H.; Alshameri, A.; Zhan, Z.; Chen, X.; Jiang, X.; et al. A Critical Review of Methods for Analyzing Freshwater Eutrophication. Water 2021, 13, 225. [Google Scholar] [CrossRef]
  11. Woelmer, W.M.; Kao, Y.-C.; Bunnell, D.B.; Deines, A.M.; Bennion, D.H.; Rogers, M.W.; Brooks, C.N.; Sayers, M.J.; Banach, D.M.; Grimm, A.G.; et al. Assessing the Influence of Watershed Characteristics on Chlorophyll a in Waterbodies at Global and Regional Scales. Inland Waters 2016, 6, 379–392. [Google Scholar] [CrossRef]
  12. Hasan, M.N.; Altaf, M.M.; Khan, N.A.; Khan, A.H.; Khan, A.A.; Ahmed, S.; Kumar, P.S.; Naushad, M.; Rajapaksha, A.U.; Iqbal, J.; et al. Recent Technologies for Nutrient Removal and Recovery from Wastewaters: A Review. Chemosphere 2021, 277, 130328. [Google Scholar] [CrossRef]
  13. Rout, P.R.; Shahid, M.K.; Dash, R.R.; Bhunia, P.; Liu, D.; Varjani, S.; Zhang, T.C.; Surampalli, R.Y. Nutrient Removal from Domestic Wastewater: A Comprehensive Review on Conventional and Advanced Technologies. J. Environ. Manag. 2021, 296, 113246. [Google Scholar] [CrossRef] [PubMed]
  14. Bol, R.; Gruau, G.; Mellander, P.-E.; Dupas, R.; Bechmann, M.; Skarbøvik, E.; Bieroza, M.; Djodjic, F.; Glendell, M.; Jordan, P.; et al. Challenges of Reducing Phosphorus Based Water Eutrophication in the Agricultural Landscapes of Northwest Europe. Front. Mar. Sci. 2018, 5, 276. [Google Scholar] [CrossRef] [Green Version]
  15. Meissner, R.; Seeger, J.; Rupp, H.; Balla, H. Assessing the Impact of Agricultural Land Use Changes on Water Quality. Water Sci. Technol. 1999, 40, 1–10. [Google Scholar] [CrossRef]
  16. Sharpley, A.N.; Gburek, W.J.; Folmar, G.; Pionke, H.B. Sources of Phosphorus Exported from an Agricultural Watershed in Pennsylvania. Agric. Water Manag. 1999, 41, 77–89. [Google Scholar] [CrossRef]
  17. Johnes, P.J. Evaluation and Management of the Impact of Land Use Change on the Nitrogen and Phosphorus Load Delivered to Surface Waters: The Export Coefficient Modelling Approach. J. Hydrol. 1996, 183, 323–349. [Google Scholar] [CrossRef]
  18. Caspers, H. OECD: Eutrophication of Waters. Monitoring, Assessment and Control.—154 Pp. Paris: Organisation for Economic Co-Operation and Development 1982. (Publié En Français Sous Le Titre »Eutrophication Des Eaux. Méthodes de Surveillance, d’Evaluation et de Lutte). Int. Rev. Gesamten Hydrobiol. Hydrogr. 1984, 69, 200. [Google Scholar] [CrossRef]
  19. Padedda, B.M.; Lugliè, A.; Ceccherelli, G.; Trebini, F.; Sechi, N. Nutrient-Flux Evaluation by the LOICZ Biogeochemical Model in Mediterranean Lagoons: The Case of Cabras Lagoon (Central-Western Sardinia). Chem. Ecol. 2010, 26, 147–162. [Google Scholar] [CrossRef]
  20. Jeppesen, E.; Moss, B.; Bennion, H.; Carvalho, L.; DeMeester, L.; Feuchtmayr, H.; Friberg, N.; Gessner, M.O.; Hefting, M.; Lauridsen, T.L.; et al. Interaction of Climate Change and Eutrophication. In Climate Change Impacts on Freshwater Ecosystems, 1st ed.; Kernan, M., Battarbee, R.W., Moss, B., Eds.; Blackwell Publishing Ltd.: Chichester, UK, 2010; pp. 119–151. [Google Scholar] [CrossRef] [Green Version]
  21. Dokulil, M.T.; Teubner, K. Eutrophication and Climate Change: Present Situation and Future Scenarios. In Eutrophication: Causes, Consequences and Control; Springer: Dordrecht, The Netherlands, 2010; pp. 1–16. [Google Scholar] [CrossRef]
  22. Scheffer, M. Ecology of Shallow Lakes; Springer: Dordrecht, The Netherlands, 2004. [Google Scholar] [CrossRef]
  23. Sechi, N.; Cossu, A. Note Preliminari Sull’ecologia Del Lago Baratz. In Proceedings of the Atti del 3° Congresso A.I.O.L., Sorrento, Italy, 1–3 December 1980. [Google Scholar]
  24. Lugliè, A. Indagine Preliminare Sulle Diatomee Sedimentarie Come Indicatrici Della Dinamica Ambientale Recente Del Lago Baratz (Sardegna Settentrionale). In Proceedings of the Atti del 7° Congresso A.I.O.L., Trieste, Italy, 11–14 June 1986; pp. 367–372. [Google Scholar]
  25. Sechi, N.; Lugliè, A. Phytoplankton in Sardinian Reservoirs. G. Bot. Ital. 1996, 130, 977–994. [Google Scholar] [CrossRef]
  26. Sollazzo, C.; Scanu, G.; Aste, F.; Belli, M.; Balzamo, S.; Martone, C.; Cadoni, F.; Bernabei, S.; Tartari, G.; Buraschi, E.; et al. Protocollo per Il Campionamento Dei Parametri Chimico-Fisici a Sostegno Degli Elementi Biologici in Ambiente Lacustre; APAT: Rome, Italy, 2008. [Google Scholar]
  27. American Water Works Association. Standard Methods for the Examination of Water and Wastewater; AWWA: Denver, CO, USA, 2017; pp. 185–192. [Google Scholar]
  28. Golterman, H.L.; Clymo, R.S.; Ohnstadt, M.A.M. Methods for Physical and Chemical Analysis of Freshwaters, 2nd ed.; Blackwell Scientific Publications: London, UK, 1978. [Google Scholar]
  29. Utermhöl, H. Zur Vervollkhung Der Quantitativen Phytoplanktonmethodik. Mitt. Int. Ver. Theor. Angew. Limnol. 1958, 9, 1–38. [Google Scholar]
  30. Mariani, M.A.; Lai, G.G.; Padedda, B.M.; Pulina, S.; Sechi, N.; Virdis, T.; Lugliè, A. Long-Term Ecological Studies on Phytoplankton in Mediterranean Reservoirs: A Case Study from Sardinia (Italy). Inland Waters 2015, 5, 339–354. [Google Scholar] [CrossRef]
  31. Lai, G.G.; Padedda, B.M.; Wetzel, C.E.; Lugliè, A.; Sechi, N.; Ector, L. Epilithic Diatom Assemblages and Environmental Quality of the Su Gologone Karst Spring (Centraleastern Sardinia, Italy). Acta Bot. Croat. 2016, 75, 129–143. [Google Scholar] [CrossRef] [Green Version]
  32. Pulina, S.; Satta, C.T.; Padedda, B.M.; Sechi, N.; Lugliè, A. Seasonal Variations of Phytoplankton Size Structure in Relation to Environmental Variables in Three Mediterranean Shallow Coastal Lagoons. Estuar. Coast. Shelf Sci. 2018, 212, 95–104. [Google Scholar] [CrossRef]
  33. Sechi, N.; Botti, P.; Vacca, S.; Mosello, R. Deflusso e Rilascio Di Nutrienti Nel Bacino Del Rio Uvini (Sardegna Centro-Meridionale). In Proceedings of the Atti del III° Seminario Della Seconda Sezione Tecnica AIGR Insediamenti Zootecnici e Protezione dell’ambiente, Udine, Italy, 25–27 September 1991; pp. 609–616. [Google Scholar]
  34. Mosello, R.; Sechi, N.; Cossu, A. Il Carico Chimico Veicolato al Lago Oschiri. In Proceedings of the Qualità dell’acqua in Sardegna, Cagliari, Italy, 1989. [Google Scholar]
  35. Sechi, N.; Mosello, R. Nutrient Budget and Trophic Level of Lake Oschiri (Sardinia. Italy). Mem. Dell’istituto Ital. Di Idrobiol. 1985, 43, 55–75. [Google Scholar]
  36. Padedda, B.M.; Sechi, N.; Lai, G.G.; Mariani, M.A.; Pulina, S.; Satta, C.T.; Bazzoni, A.M.; Virdis, T.; Buscarinu, P.; Lugliè, A. A Fast-Response Methodological Approach to Assessing and Managing Nutrient Loads in Eutrophic Mediterranean Reservoirs. Ecol. Eng. 2015, 85, 47–55. [Google Scholar] [CrossRef]
  37. Istituto Nazionale di Statistica. Censimento Permanente Della Popolazione e Delle Abitazioni. Available online: http://dati-censimentopopolazione.istat.it/Index.aspx (accessed on 10 January 2020).
  38. Istituto Nazionale di Statistica. 9° Censimento Dell’industria e Dei Servizi e Censimento Delle Istituzioni Non Profit. Available online: http://dati.istat.it/Index.aspx?DataSetCode=DICA_ASIAULP (accessed on 10 January 2020).
  39. Banca Dati Nazionale Dell’Anagrafe Zootecnica. Available online: https://www.vetinfo.it/j6_statistiche/#/ (accessed on 1 May 2019).
  40. Sardegna Geoportale. Carta Dell’Uso Del Suolo in Scala 1:25,000—Edizione 2008 (Strati Poligonali). Regione Autonoma della Sardegna, Cagliari. 2008. Available online: http://dati.regione.sardegna.it/en/dataset/carta-delluso-del-suolo-in-scala-1-25-000-elementi-poligonali-2008 (accessed on 10 January 2020).
  41. CORINE Land Cover Technical Guide—Addendum 2000—European Environment Agency. Available online: https://www.eea.europa.eu/publications/tech40add (accessed on 8 October 2021).
  42. Tartari, G.; Marchetto, A.; Buzzi, F.; Pagnotta, R.; Barbiero, G. Notiziario dei Metodi Analitici; IRSA CNR: Roma, Italy, 2008. [Google Scholar]
  43. Marchetti, R.; Gerletti, M.; Clamari, D.; Chiaudani, G. Elementi e Criteri per La Definizione Del Livello Di Accettabilità Delle Acque Di Scarico. Quad. IRSA 1973, 24, 255. [Google Scholar]
  44. Chiaudani, G.; Gerletti, M.; Marchetti, R.; Provini, A.; Vighi, M. Il Problema Dell’Eutrofizzazione in Italia. Quad. IRSA 1978, 42, 93. [Google Scholar]
  45. Marchetti, R.; Verna, N. Quantification of the Phosphorus and Nitrogen Loads in the Minor Rivers of the Emilia-Romagna Coast (Italy). A Methodological Study on the Use of Theoretical Coefficients in Calculating the Loads. In Marine Coastal Eutrophication, Proceedings of the International Conference, Bologna, Italy, 21–24 March 1990; Elsevier: Amsterdam, The Netherlands; pp. 315–336. [CrossRef]
  46. Marchetti, R.; Barone, R.; Calvo, S.; Lugliè, A.; Naselli-Flores, L.; Sechi, N. Studies on Italian Reservoirs. Mem. Dell’istituto Ital. Di Idrobiol. 1992, 50, 337–363. [Google Scholar]
  47. Sechi, N. Le Problematiche Legate al Fitoplancton Nelle Acque Lacustri Destinate Ad Uso Potabile. G. Bot. Ital. 1992, 126, 237–251. [Google Scholar] [CrossRef] [Green Version]
  48. Marchetto, A.; Padedda, B.M.; Mariani, M.A.; Lugliè, A.; Sechi, N. A Numerical Index for Evaluating Phytoplankton Response to Changes in Nutrient Levels in Deep Mediterranean Reservoirs. J. Limnol. 2009, 68, 106–121. [Google Scholar] [CrossRef] [Green Version]
  49. Padedda, B.M.; Sechi, N.; Lai, G.G.; Mariani, M.A.; Pulina, S.; Sarria, M.; Satta, C.T.; Virdis, T.; Buscarinu, P.; Lugliè, A. Consequences of Eutrophication in the Management of Water Resources in Mediterranean Reservoirs: A Case Study of Lake Cedrino (Sardinia, Italy). Glob. Ecol. Conserv. 2017, 12, 21–35. [Google Scholar] [CrossRef]
  50. Giadrossich, F.; Niedda, M.; Cohen, D.; Pirastru, M. Evaporation in a Mediterranean Environment by Energy Budget and Penman Methods, Lake Baratz, Sardinia, Italy. Hydrol. Earth Syst. Sci. 2015, 19, 2451–2468. [Google Scholar] [CrossRef] [Green Version]
  51. Vollenweider, R.A.; Kerekes, J. Eutrophication of Waters. Monitoring, Assessment and Control; OECD Cooperative Programme on Monitoring of Inland Waters (Eutrophication Control): Paris, France, 1982. [Google Scholar]
  52. Carlson, R.E. A Trophic State Index for Lakes. Limnol. Oceanogr. 1977, 22, 361–369. [Google Scholar] [CrossRef] [Green Version]
  53. Padedda, B.M.; Sechi, N. Condizioni Del Lago Cedrino e Relazioni Con Il Suo Bacino Versante. Nat. Sard. 2008, 30, 42–49. [Google Scholar]
  54. Messineo, V.; Bogialli, S.; Melchiorre, S.; Sechi, N.; Lugliè, A.; Casiddu, P.; Mariani, M.A.; Padedda, B.M.; di Corcia, A.; Mazza, R.; et al. Cyanobacterial Toxins in Italian Freshwaters. Limnol. Ecol. Manag. Inland Waters 2009, 39, 95–106. [Google Scholar] [CrossRef]
  55. Wetzel, R.G. Microcommunities and Microgradients: Linking Nutrient Regeneration, Microbial Mutualism, and High Sustained Aquatic Primary Production. Neth. J. Aquat. Ecol. 1993, 27, 3–9. [Google Scholar] [CrossRef]
  56. Leip, A.; Billen, G.; Garnier, J.; Grizzetti, B.; Lassaletta, L.; Reis, S.; Simpson, D.; Sutton, M.A.; de Vries, W.; Weiss, F.; et al. Impacts of European Livestock Production: Nitrogen, Sulphur, Phosphorus and Greenhouse Gas Emissions, Land-Use, Water Eutrophication and Biodiversity. Environ. Res. Lett. 2015, 10, 115004. [Google Scholar] [CrossRef]
  57. Schipanski, M.E.; Bennett, E.M. The Influence of Agricultural Trade and Livestock Production on the Global Phosphorus Cycle. Ecosystems 2011, 15, 256–268. [Google Scholar] [CrossRef]
  58. Nature-Based Solutions Improving Water Quality & Waterbody Conditions—Publications Office of the EU. Available online: https://op.europa.eu/it/publication-detail/-/publication/d6efaeeb-d530-11ea-adf7-01aa75ed71a1/language-en (accessed on 8 October 2021).
  59. Riggio, V.A.; Ruffino, B.; Campo, G.; Comino, E.; Comoglio, C.; Zanetti, M. Constructed Wetlands for the Reuse of Industrial Wastewater: A Case-Study. J. Clean. Prod. 2018, 171, 723–732. [Google Scholar] [CrossRef]
  60. Stefanakis, A.I. The Role of ConstructedWetlands as Green Infrastructure for Sustainable Urban Water Management. Sustainability 2019, 11, 6981. [Google Scholar] [CrossRef] [Green Version]
  61. Nivala, J.; Murphy, C.; Freeman, A. Recent Advances in the Application, Design, and Operations & Maintenance of Aerated Treatment Wetlands. Water 2020, 12, 1188. [Google Scholar] [CrossRef] [Green Version]
  62. Rizzo, A.; Bresciani, R.; Martinuzzi, N.; Masi, F. French Reed Bed as a Solution to Minimize the Operational and Maintenance Costs of Wastewater Treatment from a Small Settlement: An Italian Example. Water 2018, 10, 156. [Google Scholar] [CrossRef] [Green Version]
  63. Virsta, A. Floodplain Revegetation and River Basin Restoration. Environ. Eng. Manag. J. 2007, 6, 275–280. [Google Scholar] [CrossRef]
  64. Carreira, J.A.; Viñegla, B.; García-Ruiz, R.; Ochoa, V.; Hinojosa, M.B. Recovery of Biochemical Functionality in Polluted Flood-Plain Soils: The Role of Microhabitat Differentiation through Revegetation and Rehabilitation of the River Dynamics. Soil Biol. Biochem. 2008, 40, 2088–2097. [Google Scholar] [CrossRef]
  65. Haddaway, N.R.; Brown, C.; Eales, J.; Eggers, S.; Josefsson, J.; Kronvang, B.; Randall, N.P.; Uusi-Kämppä, J. The Multifunctional Roles of Vegetated Strips around and within Agricultural Fields. Environ. Evid. 2018, 7, 1–43. [Google Scholar] [CrossRef] [Green Version]
  66. Prosser, R.S.; Hoekstra, P.F.; Gene, S.; Truman, C.; White, M.; Hanson, M.L. A Review of the Effectiveness of Vegetated Buffers to Mitigate Pesticide and Nutrient Transport into Surface Waters from Agricultural Areas. J. Environ. Manag. 2020, 261, 110210. [Google Scholar] [CrossRef] [PubMed]
  67. Ferreira, V.; Barreira, A.P.; Loures, L.; Antunes, D.; Panagopoulos, T. Stakeholders’ Engagement on Nature-Based Solutions: A Systematic Literature Review. Sustainability 2020, 12, 640. [Google Scholar] [CrossRef] [Green Version]
  68. Giorgi, F.; Lionello, P. Climate Change Projections for the Mediterranean Region. Glob. Planet. Change 2008, 63, 90–104. [Google Scholar] [CrossRef]
  69. Gao, X.; Giorgi, F. Increased Aridity in the Mediterranean Region under Greenhouse Gas Forcing Estimated from High Resolution Simulations with a Regional Climate Model. Glob. Planet. Change 2008, 62, 195–209. [Google Scholar] [CrossRef]
  70. Naselli-Flores, L. Man-Made Lakes in Mediterranean Semi-Arid Climate: The Strange Case of Dr Deep Lake and Mr Shallow Lake. Hydrobiologia 2003, 506–509, 13–21. [Google Scholar] [CrossRef]
  71. Padedda, B.M.; Pulina, S.; Magni, P.; Sechi, N.; Lugliè, A. Phytoplankton Dynamics in Relation to Environmental Changes in a Phytoplankton-Dominated Mediterranean Lagoon (Cabras Lagoon, Italy). Ital. Assoc. Oceanogr. Limnol. 2012, 3, 147–169. [Google Scholar] [CrossRef]
Figure 1. Location of Lake Baratz (a) and its watershed (b).
Hydrology 09 00007 g001
Figure 2. Temporal and water column trend for (a) TEM, (b) pH, (c) DO, (d) RSi, (e) TP, (f) RP, (g) TN, and (h) DIN during the years 2016–2017.
Hydrology 09 00007 g002
Figure 3. Temporal and water column trend for (a) CHLa and (b) TPD.
Hydrology 09 00007 g003
Figure 4. Percentage of phytoplankton class composition during the years 2016–2017.
Hydrology 09 00007 g004
Table 2. Results of OECD and TSI trophic classification.
OECD ModelTrophic ClassesMed TPMed CHLaMax CHLaSDMean
118 mg P m−36 µg L−121 µg L−13.4 m
hyper-eutrophy60%1%10%8%20%
eutrophic37%24%35%44%35%
mesotrophic3%61%54%42%40%
oligotrophic0%14%1%6%5%
ultra-oligotrophic0%0%0%0%0%
TSI7347-4254
Table 3. Nutrient loads from the Lake Baratz watershed for P and N.
TypeGroupP
(t y−1)
N
(t y−1)
P
(%)
N
(%)
PointUW0.0050.0341.10.3
LS0.0330.1857.21.7
IW0.0000.0000.00.0
subtotal0.0380.2198.42.0
Non-pointUA0.0020.0600.40,5
AA0.3569.52778.486,7
NsNA0.0581.18612.810,8
subtotal0.41710.77391.698.0
Total0.45510.992100100
Publisher’s Note: MDPI stays neutral with regard to jurisdictional claims in published maps and institutional affiliations.

