Article

Service Accessibility Risk (SAR) Assessment for Pluvial and Fluvial Floods in an Urban Context

1
Department of Sciences, Technologies and Society, Scuola Universitaria Superiore IUSS Pavia, 27100 Pavia, Italy
2
Department of Civil and Environmental Engineering, Università degli studi di Firenze, 50121 Firenze, Italy
*
Author to whom correspondence should be addressed.
Hydrology 2021, 8(3), 142; https://doi.org/10.3390/hydrology8030142
Submission received: 30 August 2021 / Revised: 14 September 2021 / Accepted: 16 September 2021 / Published: 21 September 2021

Abstract

:
The development of strategies to adapt to and mitigate the potential adverse consequences of natural hazards requires support from risk assessment studies that quantify the impacts of hazardous events on our society. A comprehensive analysis of risk commonly evaluates the elements exposed to the hazard probabilistic scenarios and their vulnerabilities. However, while significant advances have been made in the assessment of direct losses, indirect impacts are less frequently examined. This work assesses the indirect consequences of two hydrologic hazards, i.e., pluvial and fluvial floods, in an urban context from a system perspective. It presents a methodology to estimate the services accessibility risk (SAR) that considers the accessibility of roads and the connection between providers and users of services in a city. The feasibility of the proposed approach is illustrated by an application to a pilot study in Monza city (northern Italy) considering pluvial and fluvial flood hazard with different return periods. The results in terms of the social and economic impacts are analyzed considering features of age, disability, and the different economic sectors.

1. Introduction

Future sustainable cities will have to adapt to and mitigate the potential adverse consequences of natural hazards. Urban areas can be considered “systems of systems” [1,2] where socio-economic and cultural spheres rely on critical infrastructure networks. Floods are among the costliest natural hazards affecting urban environments. Floods might occur after heavy rainfall with insufficient drainage capacity, i.e., pluvial floods, or in case of river overland flows, i.e., riverine floods. Pluvial floods appear on small spatial scales without any direct relation to the river network, due to the strong dependence on the micro topography and the drainage pathways [3]. Despite hydrologic differences, both riverine and pluvial floods have impacts on buildings, with pluvial events mostly affecting basements and ground floors, and on road infrastructures. Existing literature mostly describes risk assessment methods and applications to case studies focusing on one of the two hazards. River flooding and its economic consequences are frequently studied from the urban to the global scale [4,5,6,7,8]. In the last decade, pluvial flood risk has also emerged as a research topic [9,10,11,12]. Recent work started focusing on compound events [13,14,15,16] establishing multi-hazard risk assessment frameworks.
A comprehensive analysis of risk commonly evaluates the elements exposed to the hazard probabilistic scenarios and their vulnerabilities. However, while significant advances have been made in the assessment of direct losses [17,18,19,20,21], i.e., those caused by physical contact with floodwaters, indirect impacts are less frequently examined [22,23]. Indirect impacts are more difficult to assess because they require ad hoc simulation of interdependencies between assets potentially located far from the flooded area in space and time [24]. Interdependencies can be described by different modeling approaches categorized into six groups: empirical, agent-based, system dynamics-based, economic-theory based, network-based, and others [25]. These models are capable of propagating cascade impacts [26,27,28] or analyzing the systemic properties of the exposed elements [29].
Studies about the indirect impacts on critical infrastructures demonstrate that, in addition to monetary losses, the social impacts related to the reduction of availability and accessibility of basic services might affect the population much more than the direct impacts of the flood [24,30,31]. Moreover, flooded roads are particularly dangerous for vehicles and pedestrians as shown by fatality reports [32]. Mobility disruption can also delay rescue activities or prevent reaching a hospital in a timely manner [33], with health consequences. Social impacts related to the interruption of service accessibility, e.g., education or health facilities, are hardly monetizable but play a crucial role in flood resilience.
A service becomes unavailable for users when at least one of the following applies: (i) the provider is flooded, (ii) the user is flooded, and/or (iii) the road infrastructure connecting user and provider is interrupted. The third condition might be neglected in a standard risk analysis, where only direct impacts are accounted for. Capturing this aspect requires a systemic approach where node interconnections are considered.
In this context, modeling might provide risk scenarios useful for decision makers, planners, and civil protection [34].
A change in the perspective of urban flood risk analysis should switch from single to multi-hazard, from silo-to systemic analysis, from monetary to social impact understanding.
The overarching objective of this work is to deepen the understanding of the indirect consequences of two hydrologic hazards, i.e., pluvial and fluvial floods, in an urban context with a system perspective. The three specific objectives are:
  • to define a methodology for estimating the services accessibility risk (SAR) that considers the accessibility of roads and the connection between providers and users of services in a city;
  • to demonstrate the applicability of the methodology to pluvial and fluvial flood hazard with different return periods for the case study of Monza (northern Italy); and
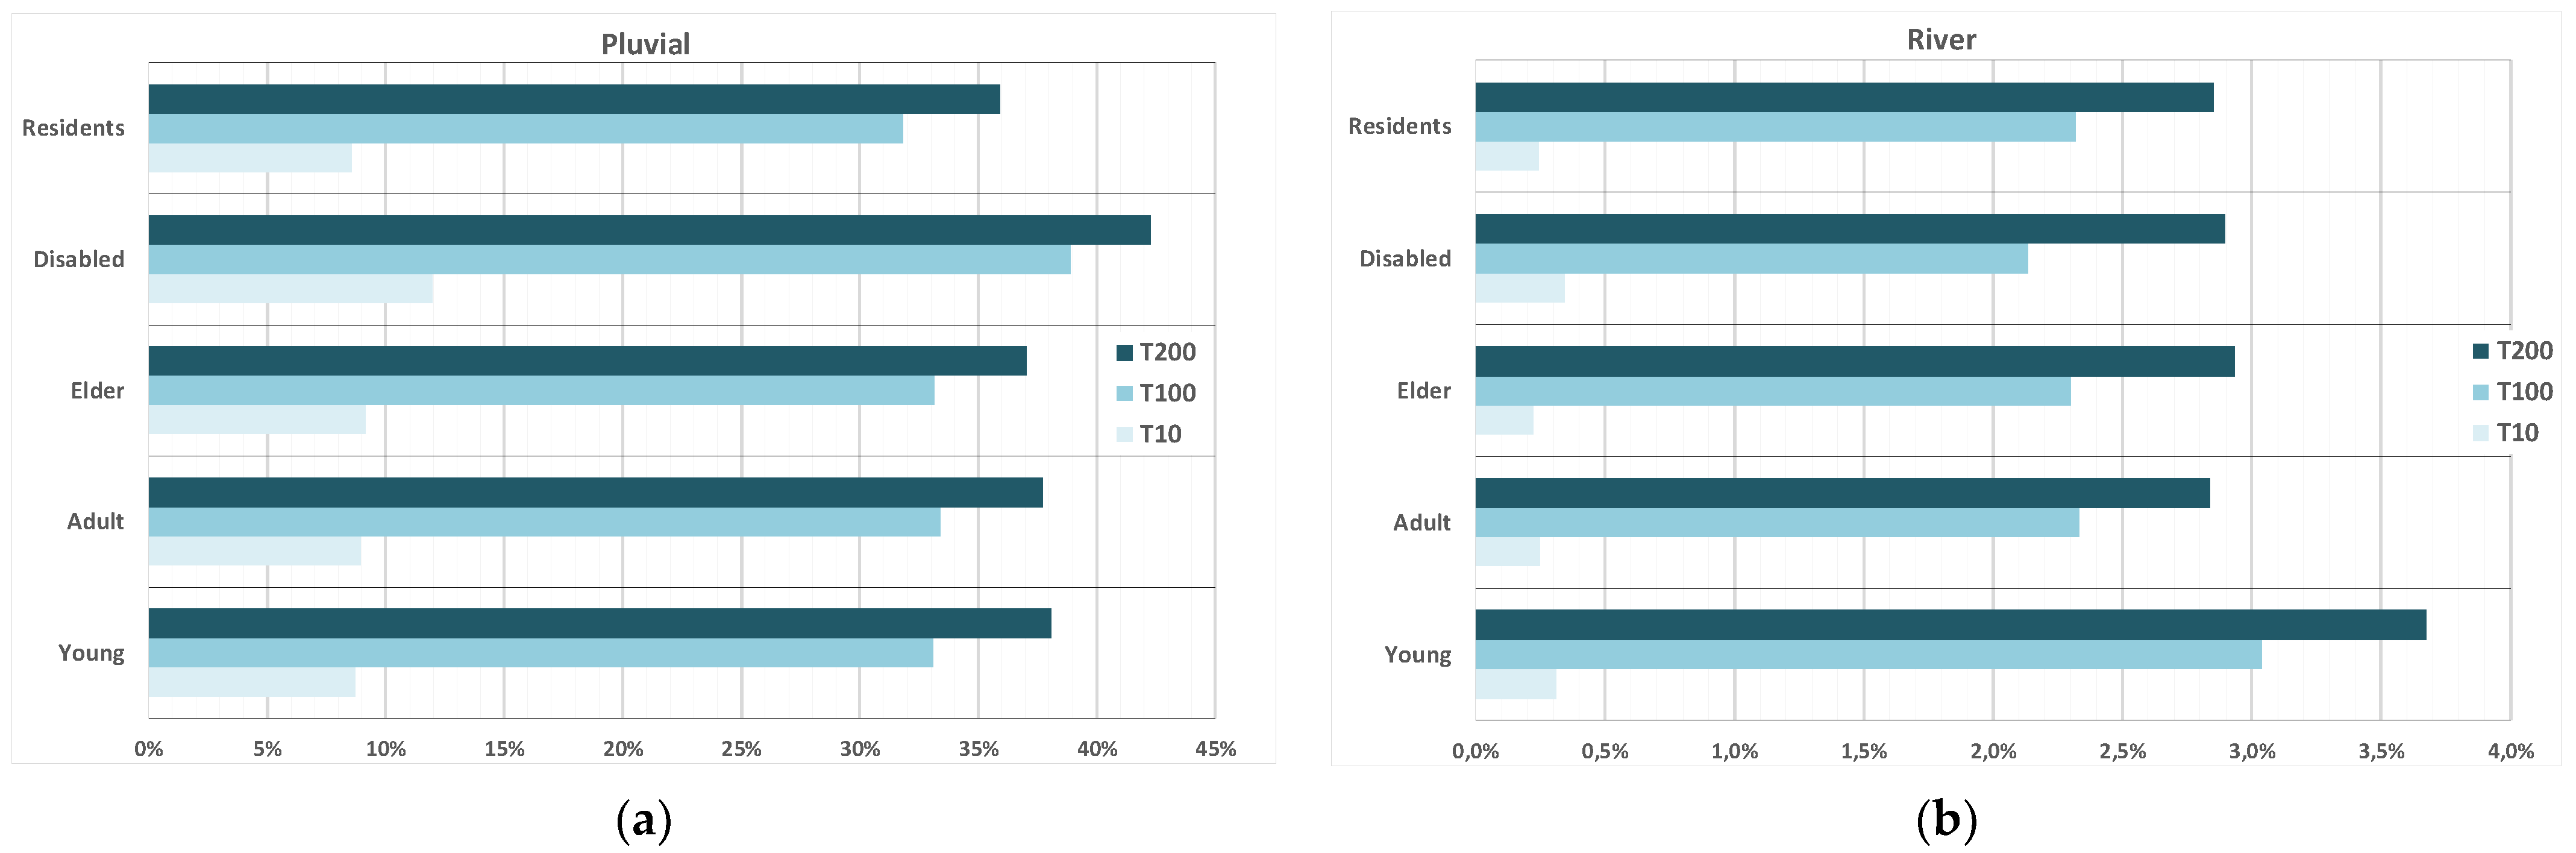
  • to analyze social impacts considering aspects of age, disability, and the different economic sectors.

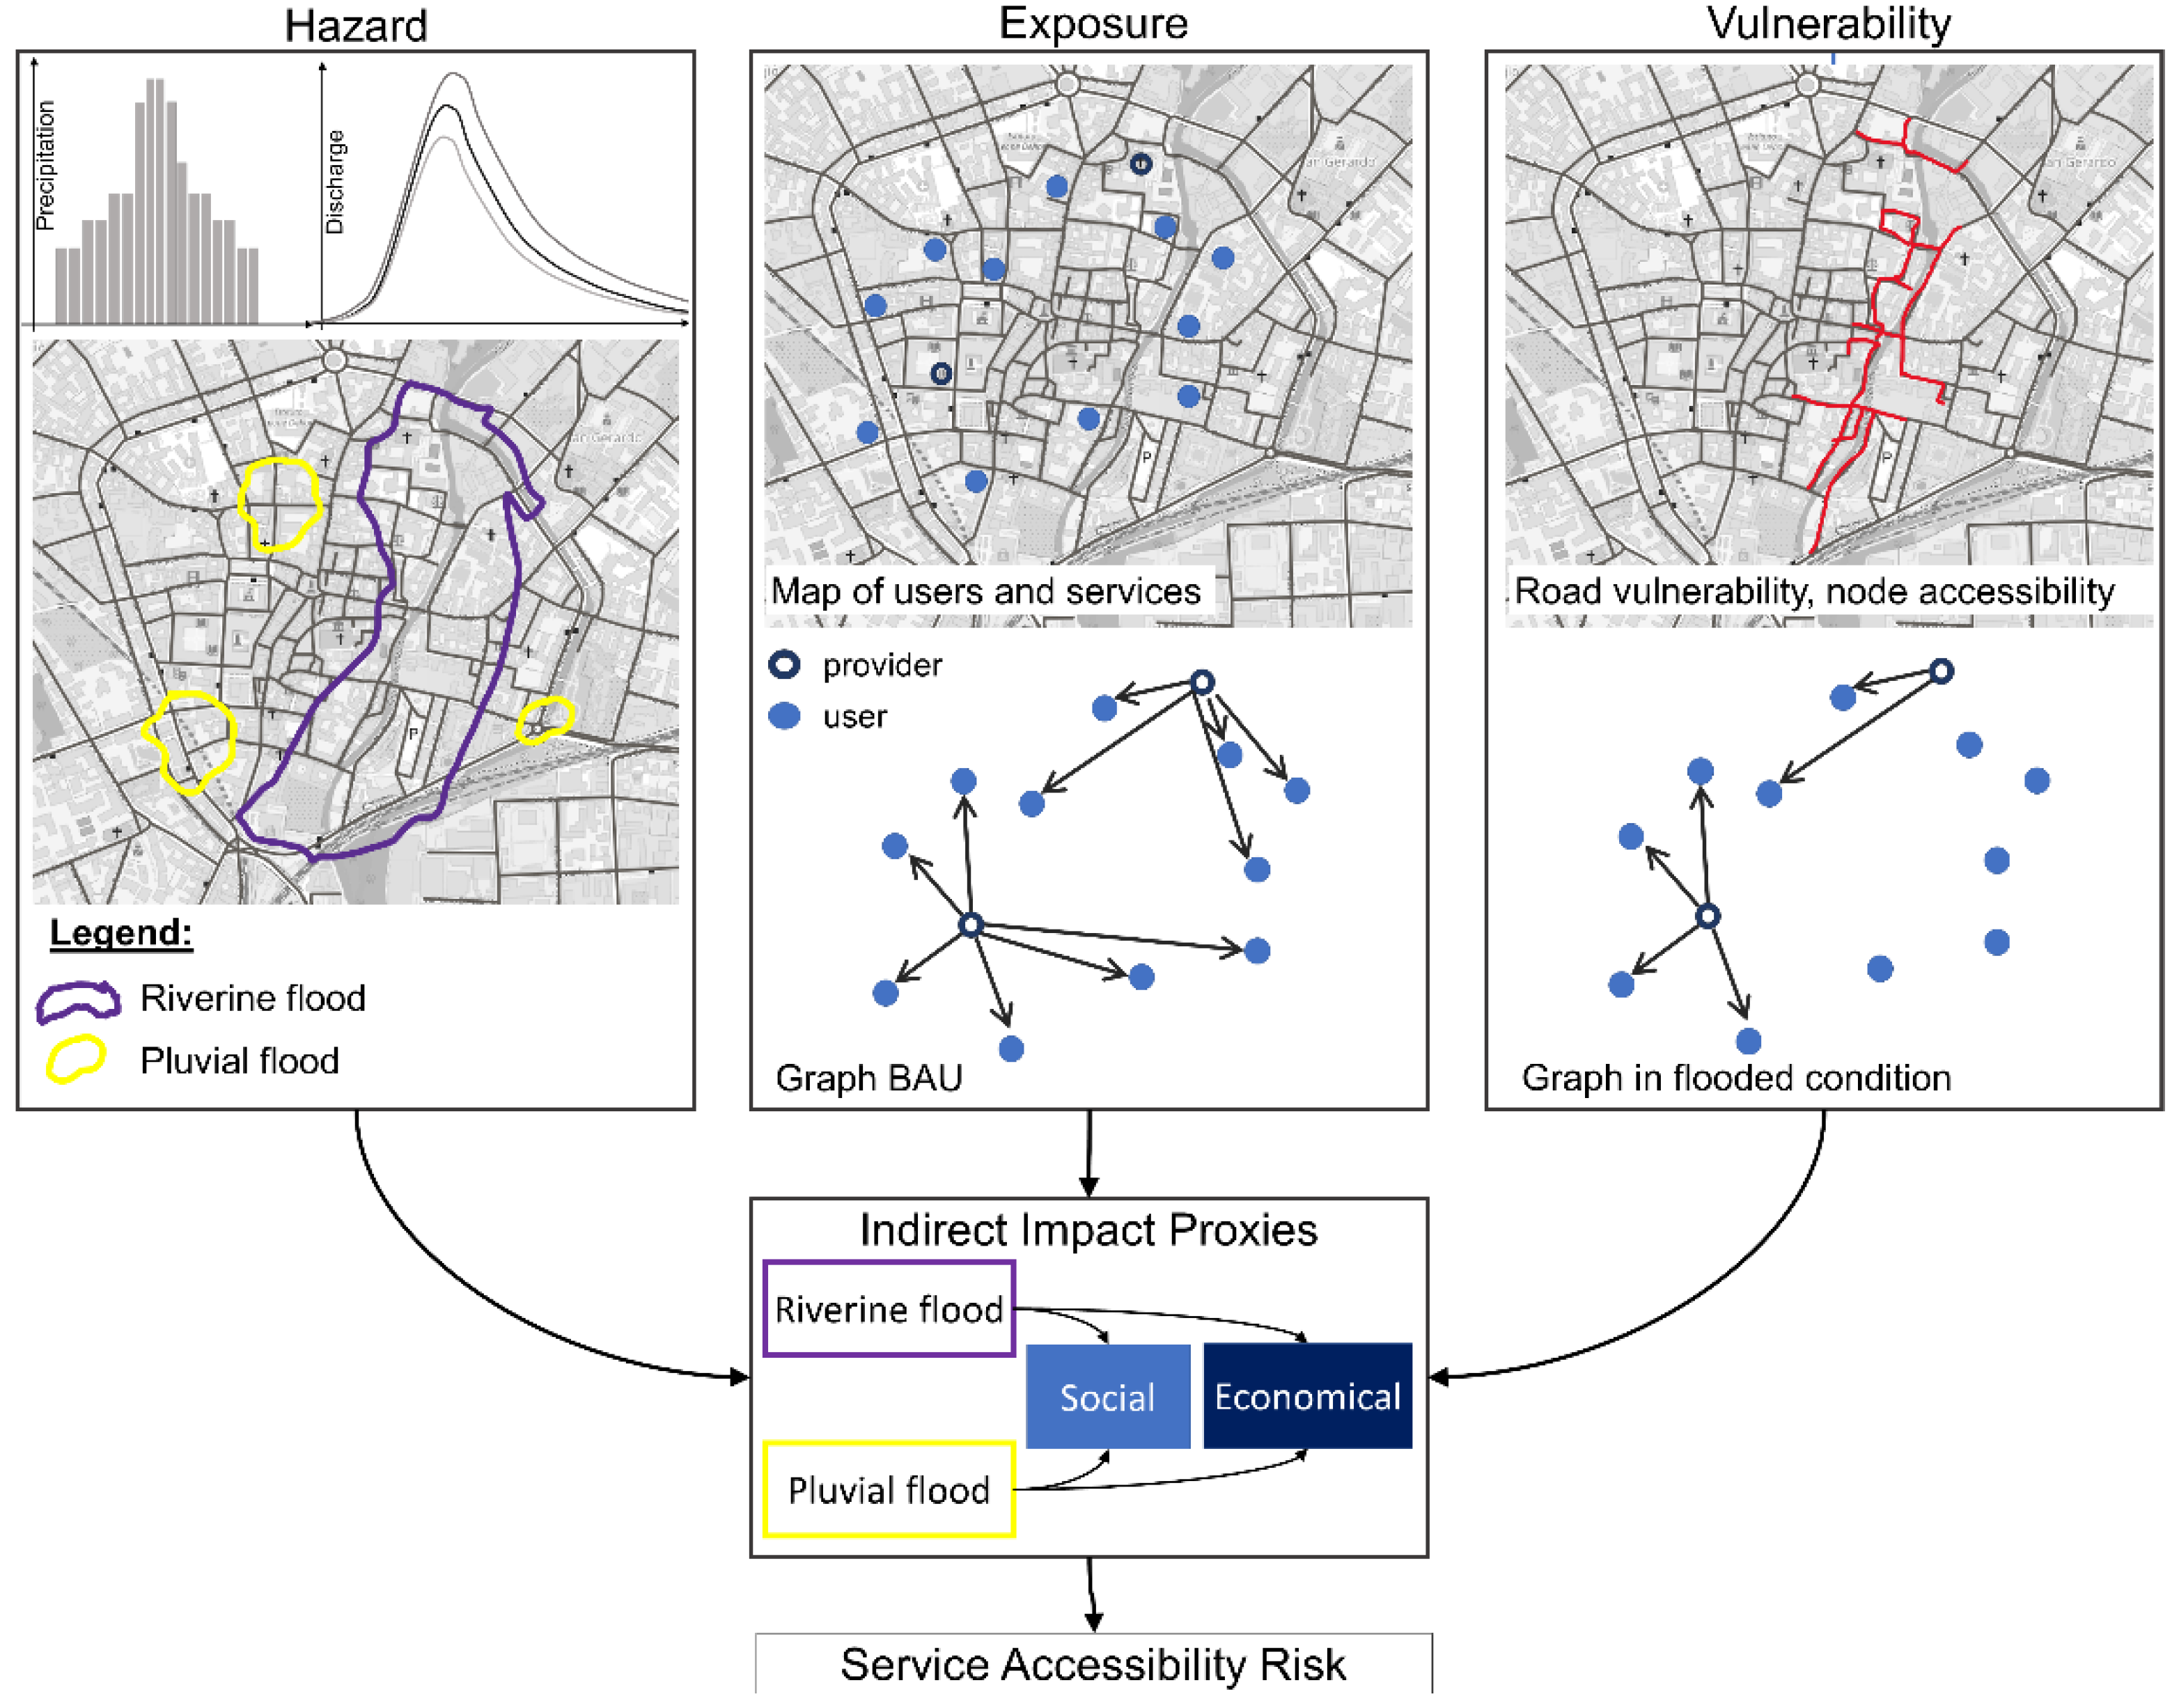
2. Materials and Methods

The methodology to estimate the SAR follows the three traditional risk components as reported in Figure 1: hazard, exposure, and vulnerability.
The hazard component uses as input the hyetograph and the hydrograph to estimate pluvial and fluvial flood maps, respectively. The maps provide flood extension and intensity, i.e., depth and velocity, for the different return periods. The second component requires a change of paradigm from a silo to systemic exposure, in which each exposed element is connected to other nodes according to the exchange of services. The exposed system is represented by a graph in which there are nodes that provide services (i.e., providers) to nodes that receive those services (i.e., users). The road vulnerability estimates accessibility based on the physical stability of vehicles and pedestrians in flood conditions (i.e., water depth and velocity).
By integrating the information of the three components, it is possible to estimate how many services in the exposed systems are lost under different hazard scenarios and by defining proper proxies, it is also possible to differentiate the impacts between different sectors: economic and social. Finally, the SAR can be computed associating the estimated impacts to the probability of occurrence of different scenarios.

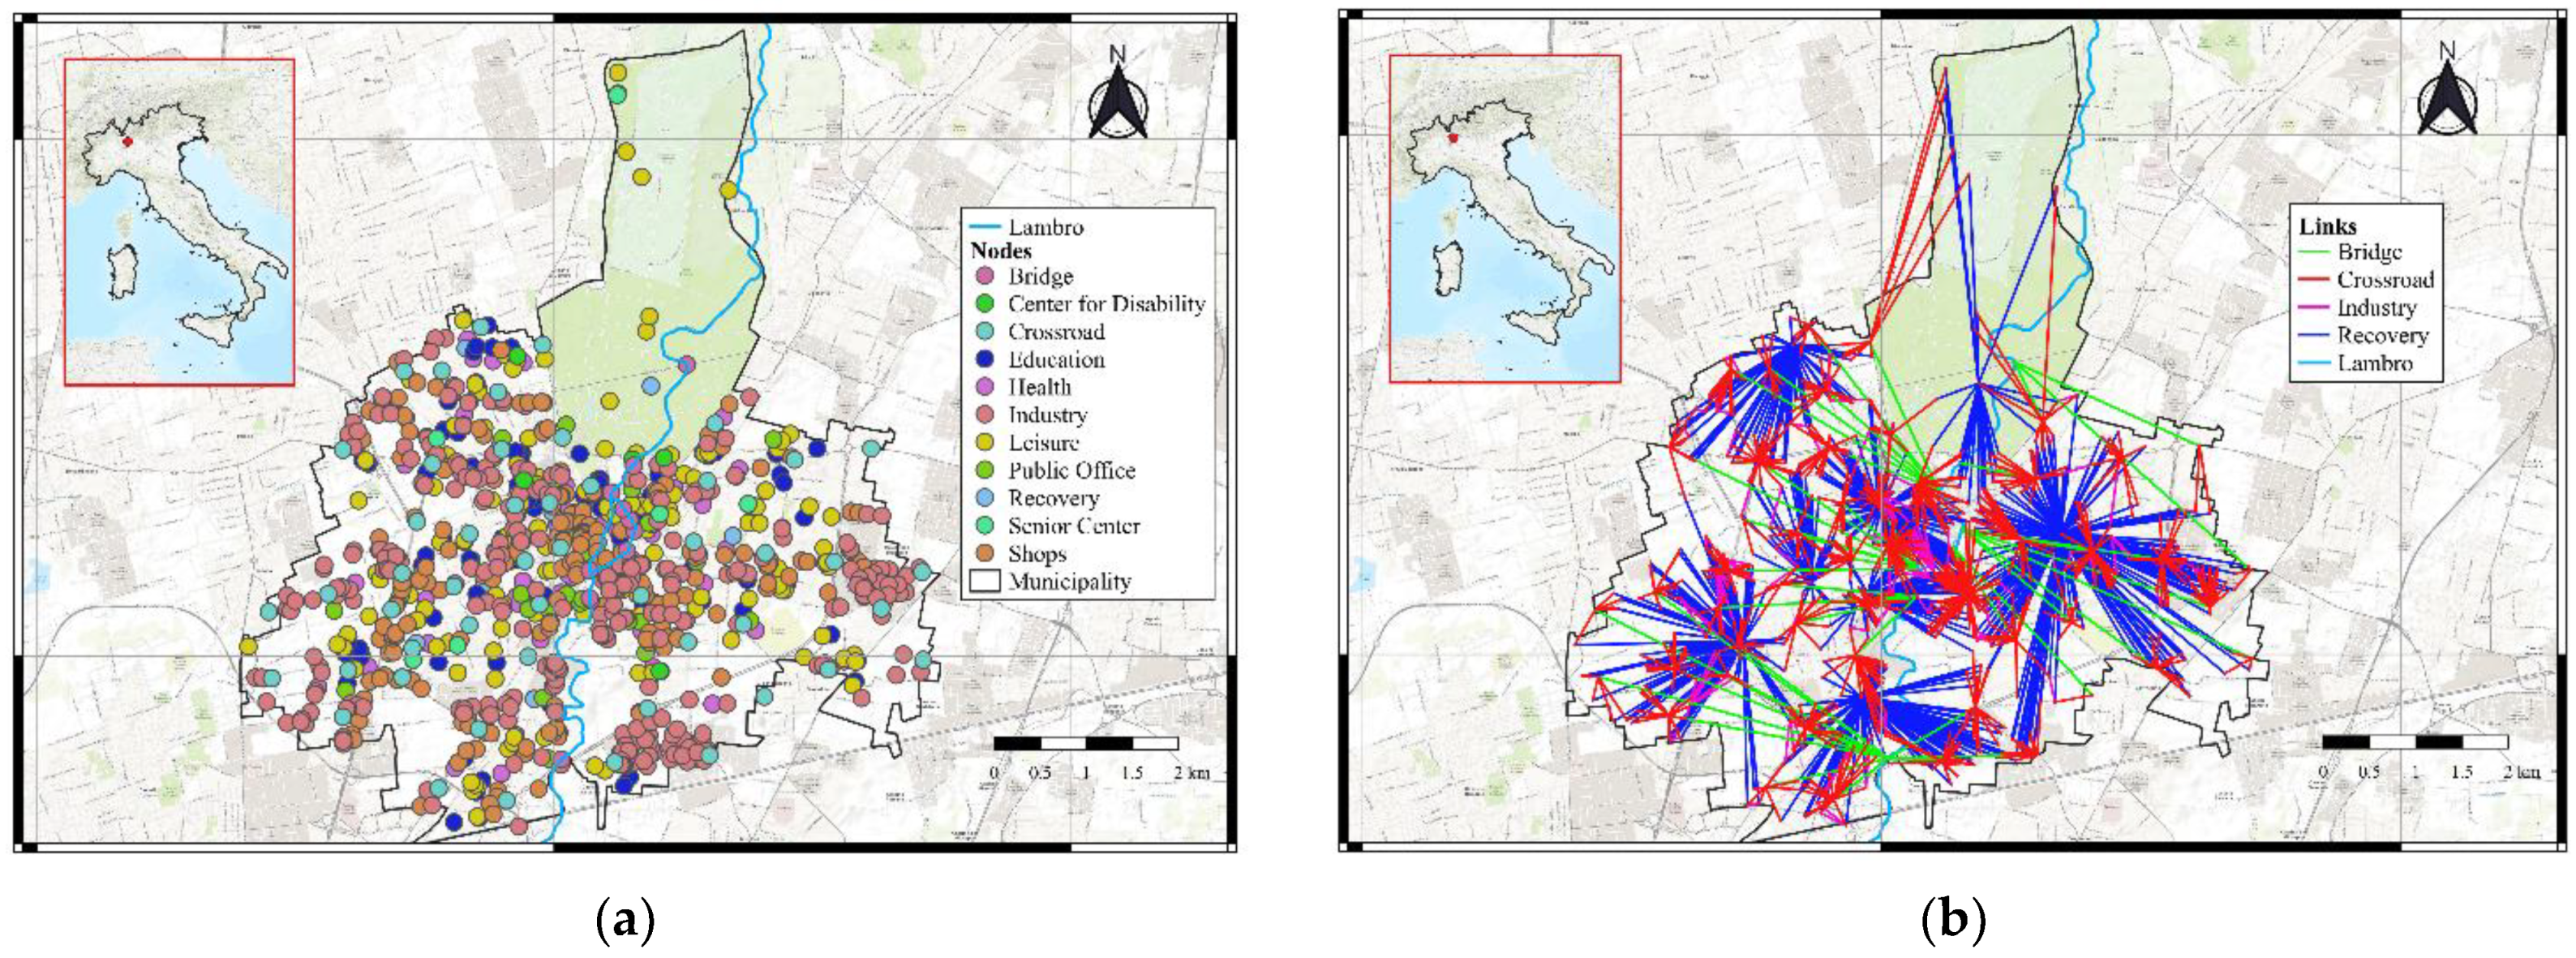
2.1. Exposed System: Building the Graph

The proposed methodology adopts a system structure which represents the entire exposed system properties by means of a graph. The graph is constructed by identifying the two main objects, i.e., nodes and links, and their characteristics. Each node can provide or receive service to or from others (links). Links can be of different types according to the nature of the connection: physical, geographical, cyber, or logical [35].
Once the terms of the connections between the different node categories are defined, it is crucial to establish the rules to determine if two nodes belonging to different categories should be linked. The set of rules proposed to create the links is based on a distance criterion that allows users to accept multiple providers per service, introducing redundancy into the network [23].
In order to reproduce the complex interconnection and heterogeneity of an urban city, the graph must be redundant and weighted. The graph is redundant when each node does not receive the service only from the closest provider [23,36], but from many. In a weighted graph, each edge has attached an attribute as a numerical value functioning as a weight. The attachment of the weight changes depending on the application. In this case study, each provider-receiver link is weighted by the number of people that use the service.
Once the nodes and the rules to link the various services are laid out, the graph is built, and the relevant graph attributes can be computed and assigned to its nodes or links. Finally, the graph is used to simulate the number of economic and social services impacted under flood conditions, along the road segments vulnerable for drivers and/or pedestrians.

2.2. Vulnerability Road Ranking

Flooded roads might cause injuries and fatalities when people attempt to move by car or on foot [37,38]. Therefore, here, the vulnerability of road segments does not refer to potential direct impacts on the road itself (e.g., new asphalt resurfacing), but to the indirect impacts potentially caused to drivers and pedestrians that might lose their stability under certain combinations of flood parameters such as water depth and velocity.
The vulnerability of pedestrians is assessed by means of an equilibrium equation (Equation (1)) dependent on flood depth H (m), Froude number Fr (-), and height of the target subject HP (m), here assumed as an average Italian adult (HP = 1.75 m). The two regression coefficients are obtained from experimental data on human stability in floodwaters [33]
H c r , P = H P · 0.29 0.24 · F r
Equation (1) identifies a threshold critical condition for pedestrians Hcr,P (m) which allows a vulnerability ranking according to the following
v u l n e r a b i l i t y = { h i g h ,     H H c r , P 1 m e d i u m ,     0.5 H H c r , P < 1 l o w ,     H H c r , P < 0.5
The maximum vulnerability for driving vehicles is reached when flood depth equals or exceeds the threshold Hcr,V = 0.3 m, the depth at which a standard saloon or estate car is unable to operate, and roads are considered impassable [39]. Equation (3) identifies the degree of vulnerability according to the following
v u l n e r a b i l i t y = { h i g h ,     H H c r , V 1 m e d i u m ,     0.5 H H c r , V < 1 l o w ,     H H c r , V < 0.5
H and Fr are obtained by 2D flood modeling [40] and associated to each road segment through a raster zonal statistic. As a conservative hypothesis, the maximum H in the road segment is considered for vulnerability ranking. A road segment with high vulnerability (for pedestrians or traveling vehicles) should therefore be considered closed; medium vulnerability roads should be used with prudence.

2.3. Multi-Sectoral Impact and Risk Assessment

The road accessibility, obtained from the spatial intensity information of the hazard (i.e., water depth and velocity) and the road vulnerability, together with the system exposure allows to estimate the indirect impacts across different sectors: social and economic. Table 1 describes the quantitative proxies adopted to estimate the impacts for the two sectors.
The sum of all the proxy values obtained in the flooded roads represents the impact in the city for that sector for a specific scenario. Considering different scenarios and their probability of occurrence, it is possible to assess the service accessibility risk (SAR) of the city. Differently from the traditional risk curves which are commonly obtained by considering the cost of the reconstruction of buildings, the SAR assessment replaces the reconstruction cost with the number of services lost for the inaccessibility of roads. While traditionally the common indicator of risk is the annual average loss, in SAR, it is the annual average number of services lost.

2.4. Case Study

The methodology proposed in this paper was applied to the case study of Monza. The city and its municipality, hosting more than 120,000 residents, is situated in northern Italy in the Lombardy region, where it ranks third amid the most populated metropolitan areas in the region behind Milan and Brescia. The city is densely populated and is split in half by the Lambro River, which passes right through the city’s historical center touching downstream Milan before delving into the Po river. In recent years, several flooding events have occurred, threatening the heterogeneous fabric of the city. Moreover, severe rainfall events highlighted the drainage system’s incapacity to cope with extreme events, thus provoking pluvial flooding and providing an additional hazard to the city by spatial and temporal resolution [41]. The dimension of the city allowed us to study the urban system and its interdependencies at high resolution.
As part of the NEWFRAME project (www.newframe.it, accessed on 20 September 2021), Monza municipality provided us with a catalogue of all the buildings and their features. The characteristics of the building could be divided into two categories: (1) properties related to the geometry (i.e., area and height) and the georeferencing (i.e., addresses) of the building and (2) those related to its use and function. The latter features of the building were used to classify the network nodes into the categories reported in Table 2, along with their numerosity and the type of nodes they serve. Each node is associated with a real physical element (e.g., a building or a major intersection), although this association is not univocal. The directed and weighted link represents the services that are exchanged, within a certain distance, in an urban area like Monza, where the direction denotes the nature of the relationship between the vertices and the weight the importance of the links. The first column of Table 2 reports the typology of nodes defined for the study case based on the data provided by the municipality, while the column ‘Receiver’ indicates the orientation of the edge (i.e., the vertices belonging to the category indicated in column 1 provide a service to the vertices belonging to the category indicated in column 4).
Regarding the categories, the following assumptions were adopted. The recovery nodes provide first aid, such as hospitals, firefighters, and police stations on call 24/7 and grant rescue to all the other categories. Industrial nodes provide a service both to residential nodes in the form of job opportunities and to the shops as suppliers. Lastly, there are categories of nodes that directly offer various services to the citizens or part of it. This group comprises services like health facilities (e.g., pharmacy, private practice), shops, public office (e.g., postal office), and leisure (e.g., cinema, arcade), which are intended for the entire population. Senior centers are intended for the elderly, the centers for disability are aimed at people with some sort of handicap and educational services are provided to the younger portion of the population. The residential typology does not provide any service but acts just as a receiver. Each building was represented as a residential node with a number of residents as provided by the municipality and with the age distribution (split into three groups: 0–15, 16–64, 65+) equal to that of the parent census area as provided by the National Institute of Statistics (ISTAT). The municipality also provided data on the fraction of the disabled people. The population feature, age distribution, and disability attached to the buildings were used to refine the weights of the links between certain nodes. The weights are represented by the number of users that the link serves in total. For example, a link connecting a shop to a residential building where ten people reside is assigned a weight value of 10. A link connecting the industrial provider that replenishes the aforementioned shop would have a weight that is equal to the sum of the weights of all the links of which that shop is the provider. The weights underwent a log-transformation to overcome the wide range of values that this procedure would return.
Table 3 reports the area used to establish the connections between provider and receiver according to their type: (1) the entire city for recovery nodes (i.e., all the nodes in the city are linked to all the recovery nodes), (2) parallel bands for bridges (i.e., the study area are separated into overlapping parallel strips from west to east where each strip is centered around and parallel to a bridge), and (3) radial area for the remaining connections (i.e., each receiver is connected to all the providers, for a given category, within a certain distance called radius).
As a result of the above assumptions, we represented Monza as a directed, weighted graph with 6007 nodes and almost 1.3 million links that can represent well a system’s complexity of an urban city. Figure 2 shows the node providers and the services exchange between themselves.

3. Results

This section shows the results obtained from road accessibility analysis, followed by the estimation of the services accessibility risk (SAR).
The road accessibility was obtained using the flood hazard information of both pluvial and river floods for three different return periods (i.e., T10, T100, and T200) together with the vulnerability information of vehicles and pedestrians.
The service accessibility risk was obtained adding to the road accessibility (i.e., hazard and vulnerability) the information of the services exposed to those inaccessible roads provided by the graph analysis.

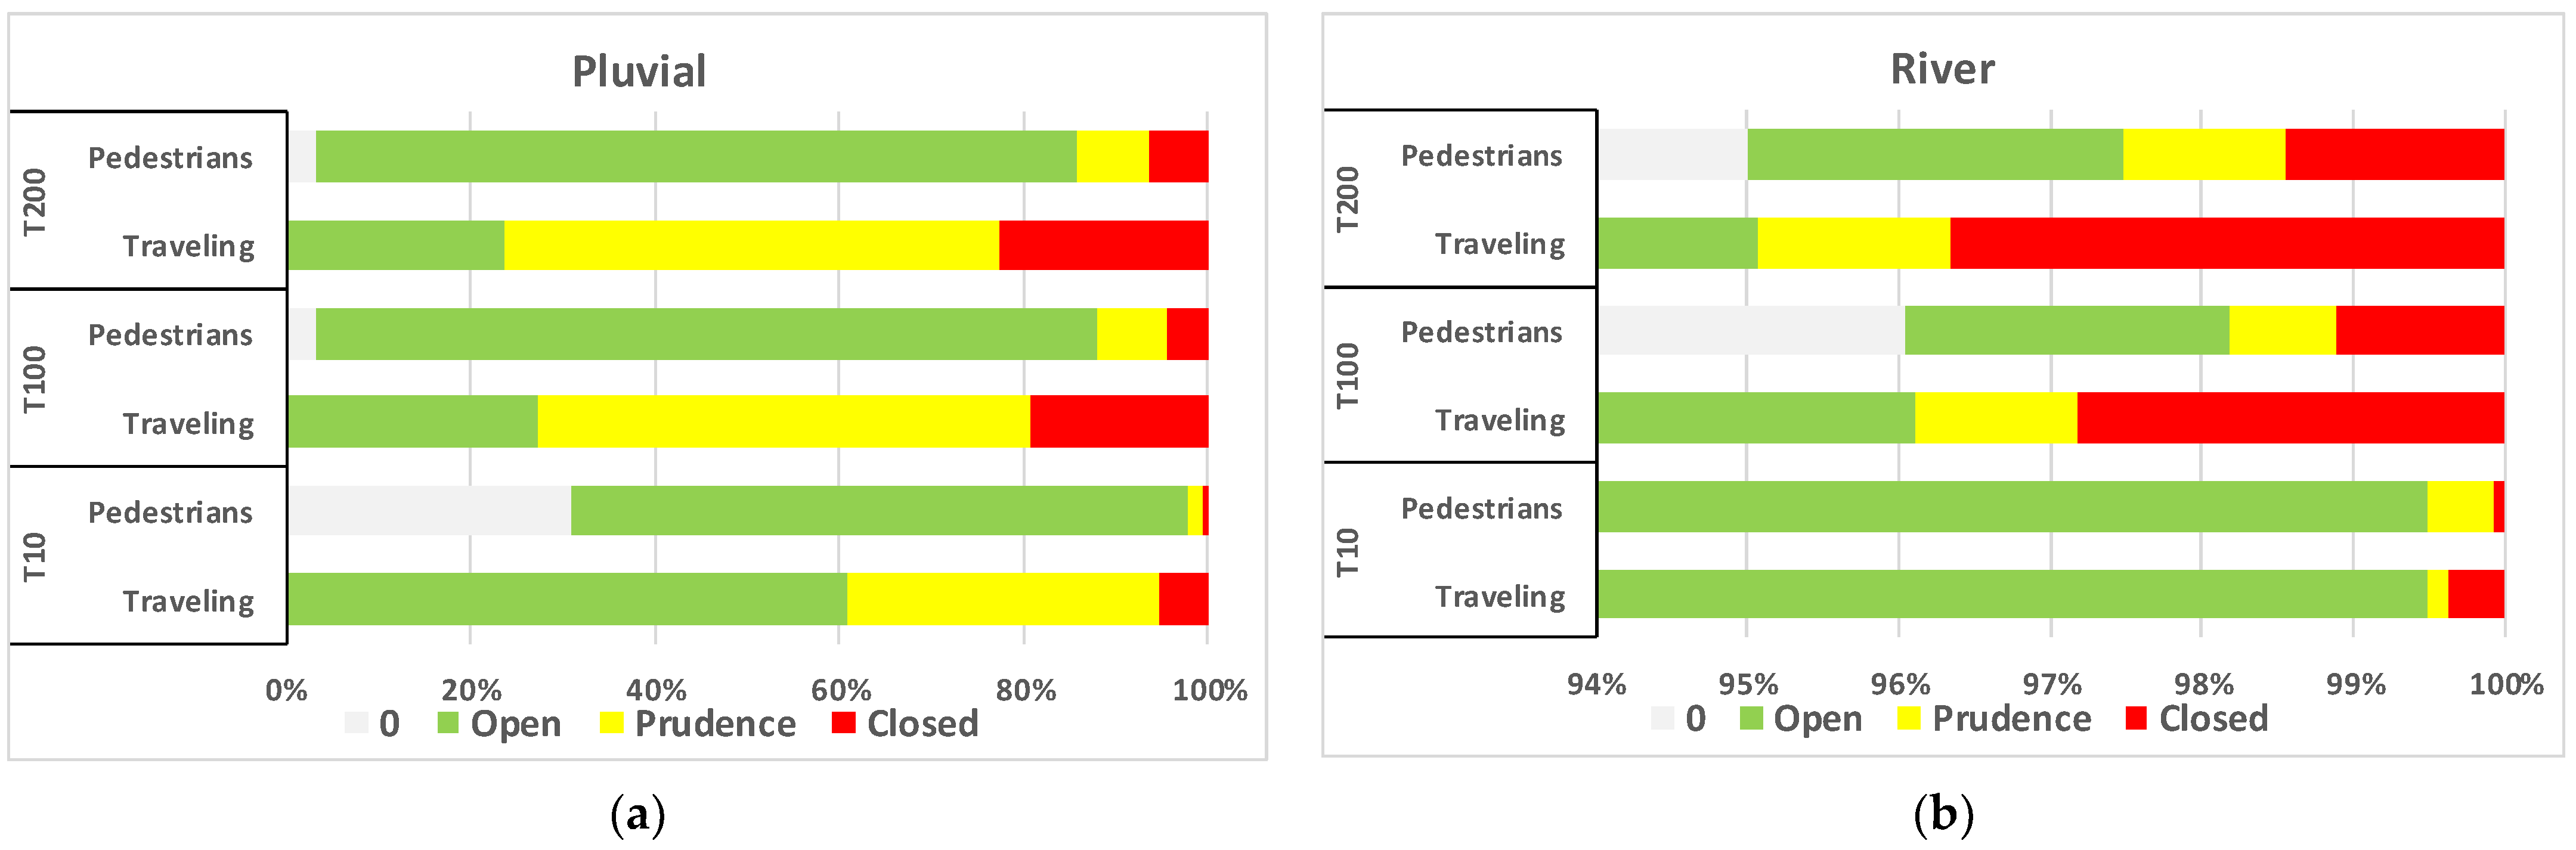
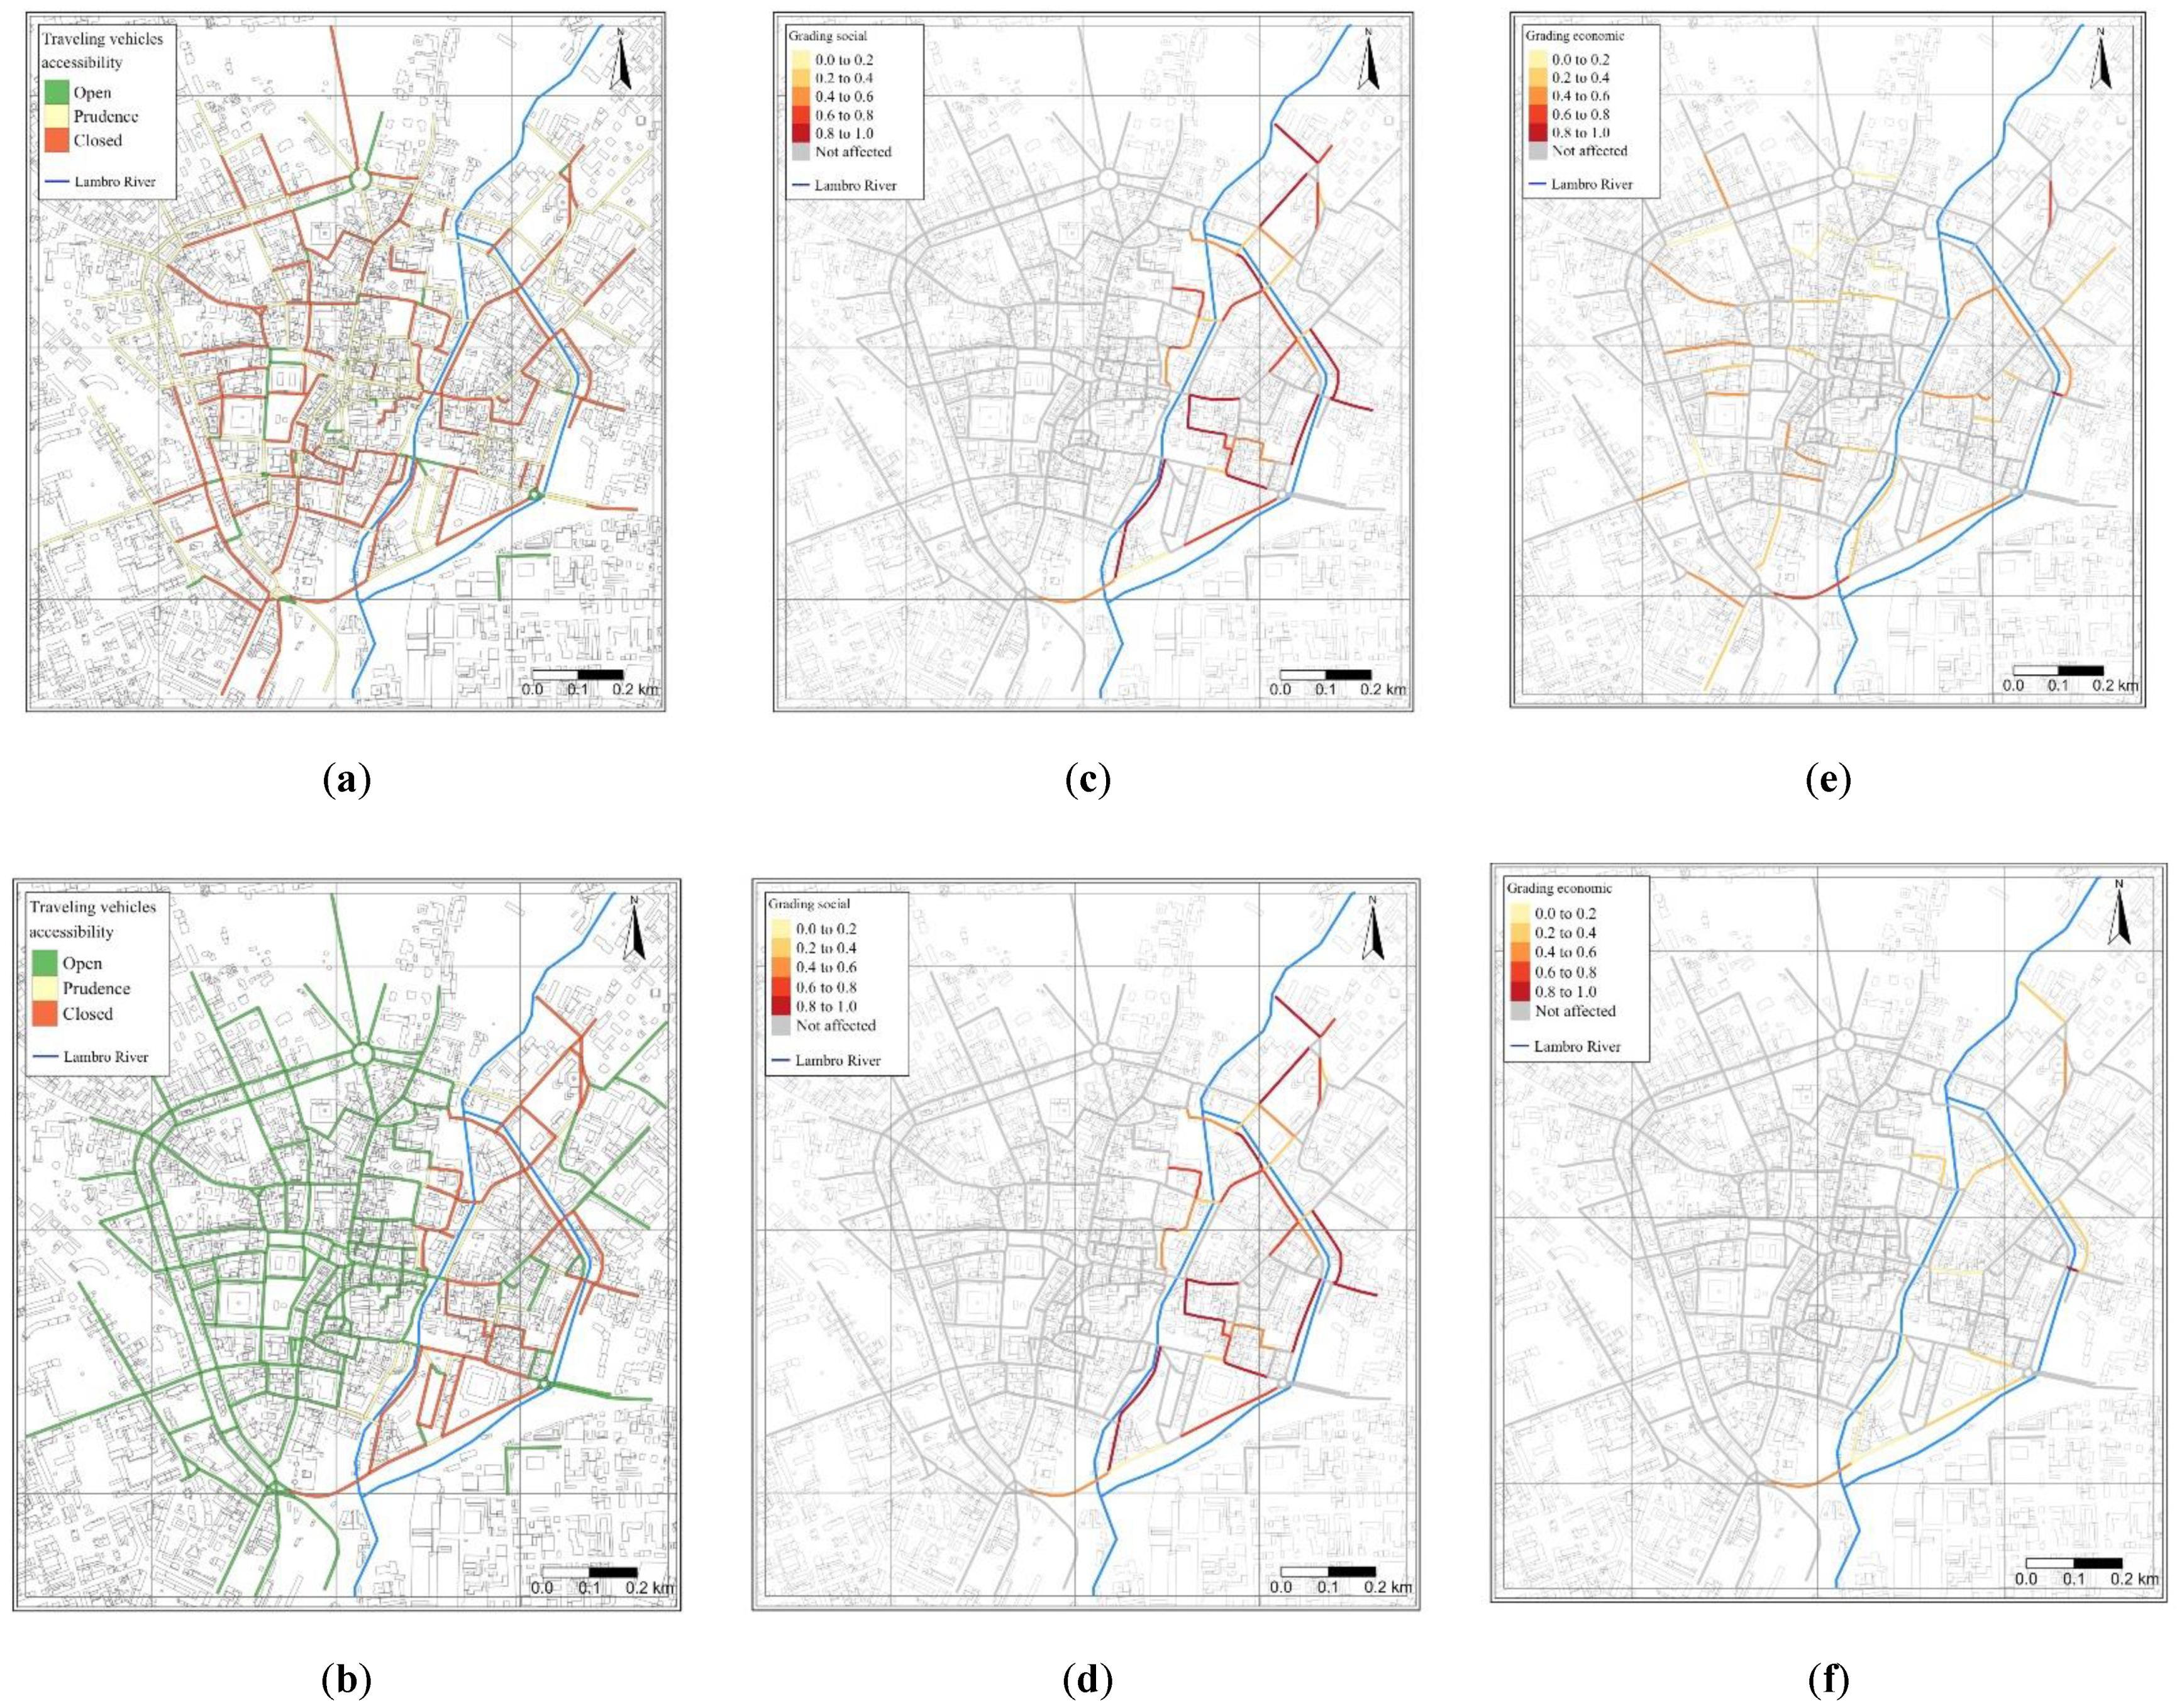
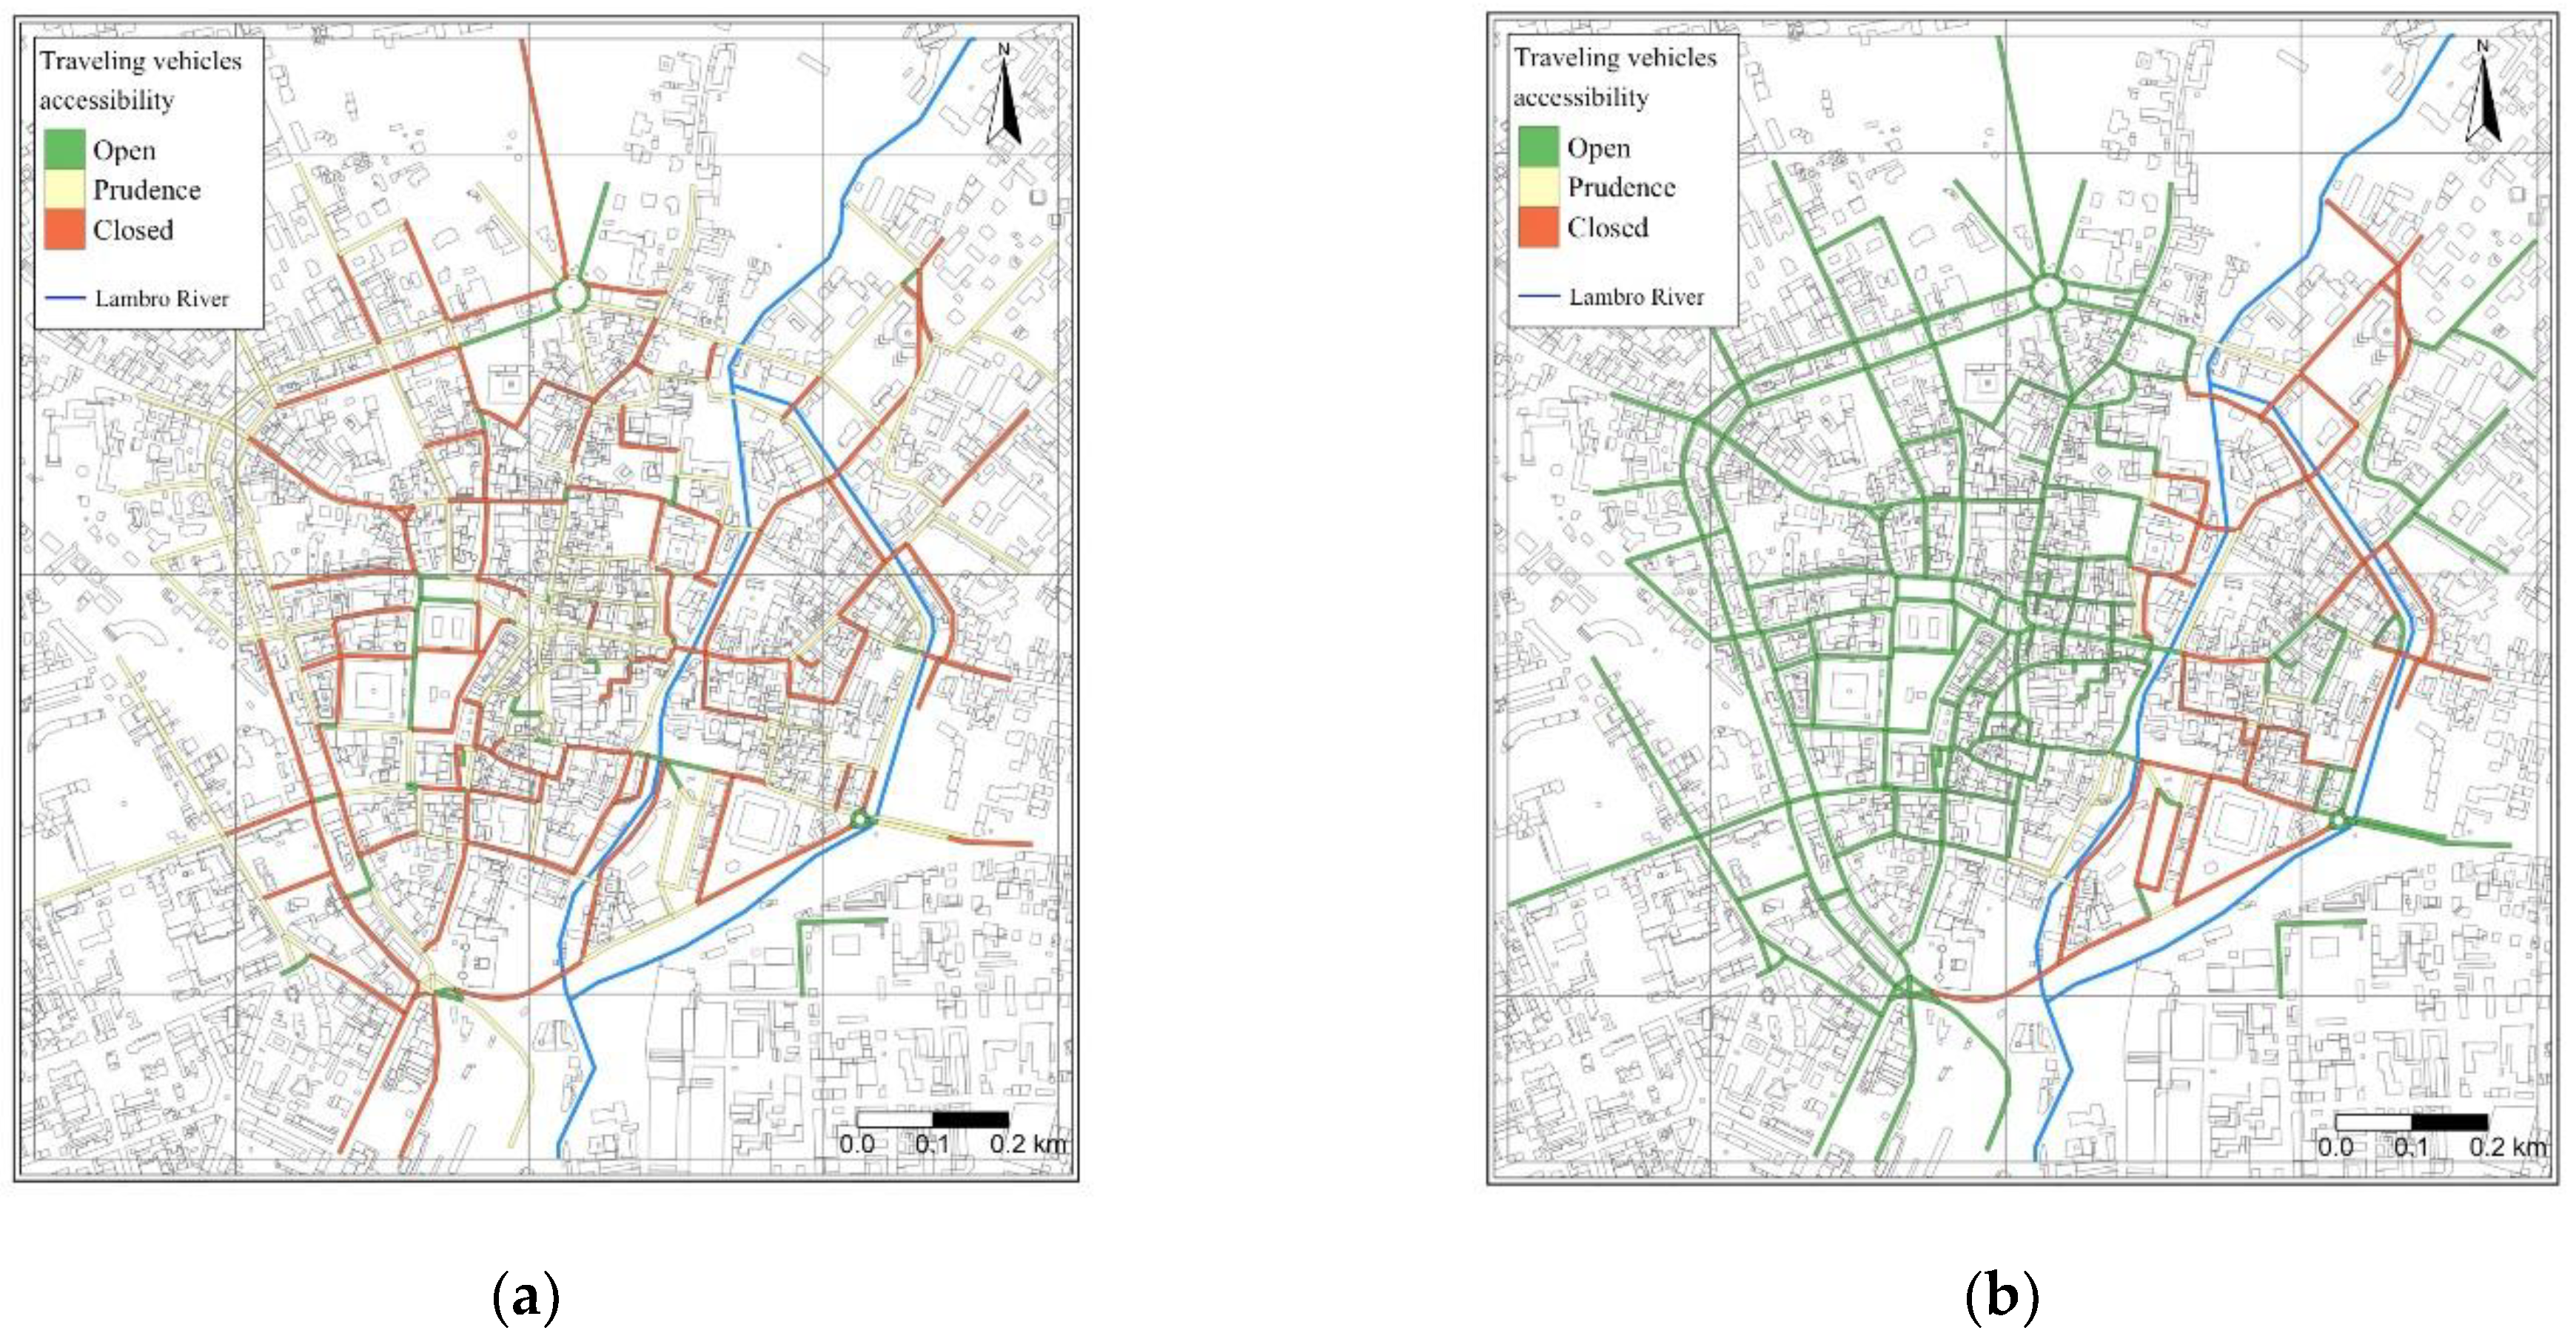
3.1. Road Accessibility

Figure 3 compares the road accessibility for vehicles in the city center of Monza between pluvial and river floods at the 100 years return period. The green segments indicate roads that are accessible, the yellow segments indicate roads with a reduced traveling speed, and finally the red segments indicate roads closed since the stability of the vehicles is not guaranteed. The maps show a notable difference between the two types of floods: the segments affected by pluvial flood have homogeneous geographical distribution across the city; instead, river floods intensely affect only the road segments along the river.
Figure 4 shows the percentages of road accessibility over the entire network of the city for both hazards, for three different return periods and according to the flood vulnerability of pedestrians and traveling vehicles.
The results confirm an increasing percentage of segments where vehicles need to drive with prudence and closed roads for higher return periods for all three different vulnerabilities conditions. Furthermore, the results show that the percentages of segments closed for vehicles are always greater with respect to pedestrians, and in particular the vehicles in transit are the most vulnerable for any return period and both types of floods. Finally, the results confirm a much higher percentage of closed roads in case of pluvial floods compared to the river floods.

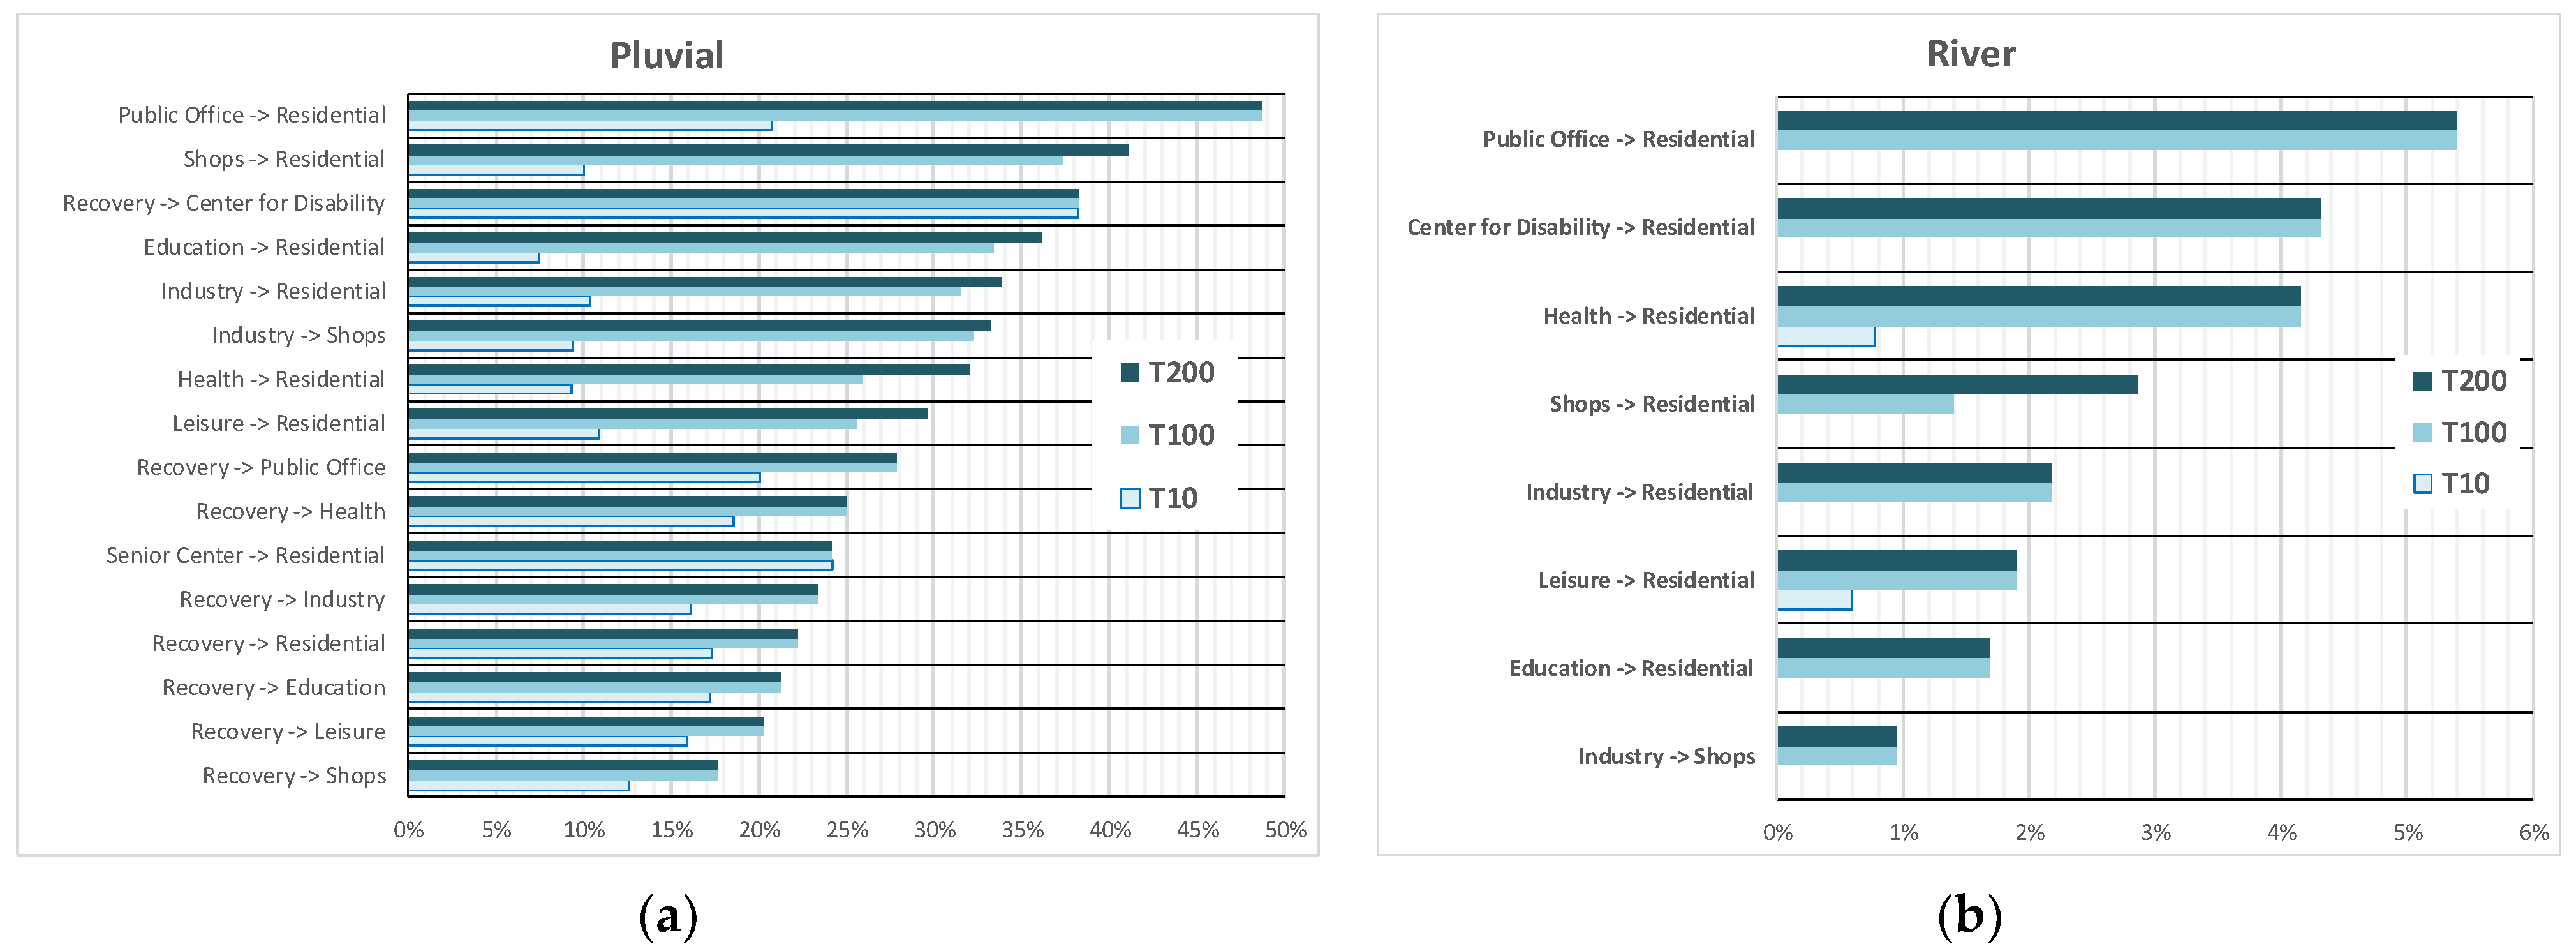
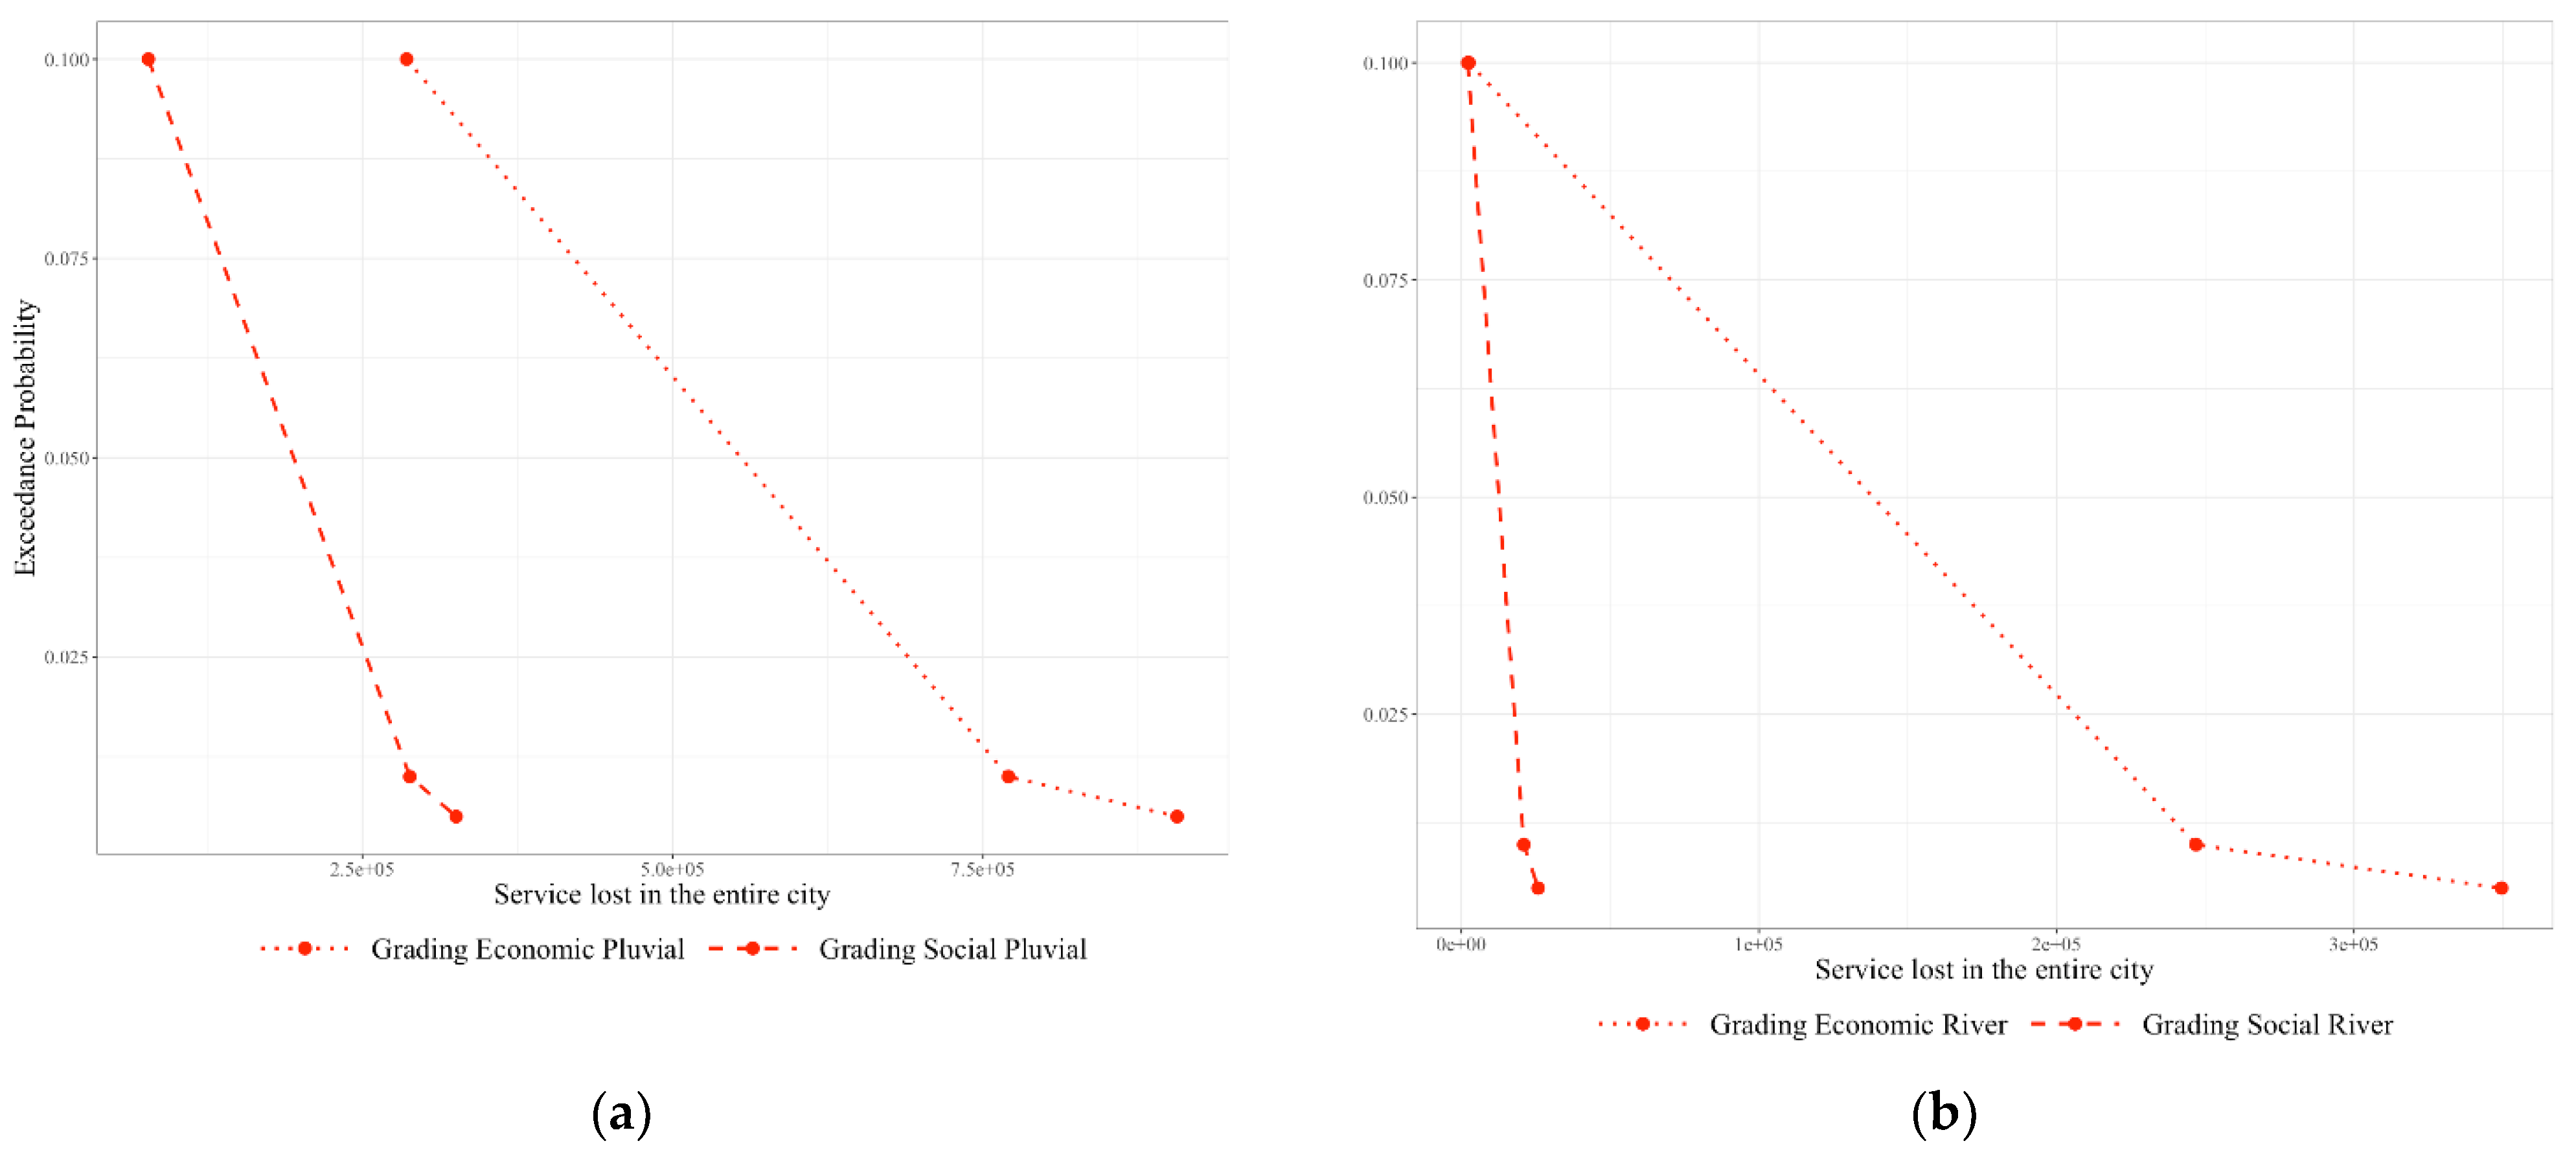
3.2. Services Accessibility Risk (SAR)

The road accessibility and the graph properties are the required pieces of information to estimate the SAR. The hazard and vulnerability assessments shown in the previous figures were integrated with the information on the exposure of services providers and users.
Figure 5 compares the same portion of the Monza road network with three different gradings: (Figure 5a,b) vehicles road accessibility; (Figure 5c,d) social service accessibility impacted; and (Figure 5e,f) economic service accessibility impacted. The maps show that although some roads are dangerous for traveling vehicles, since they have fewer services, they have a lower grading in the service accessibility or vice versa. Furthermore, according to the type of service, social or economic, the roads have different grading: for example, we can observe that the city center is characterized by a greater importance for the social service with respect to the economic service.
Figure 6 shows how the social services are impacted by the three different return periods and how the impact is distributed across the age and people with disability. In particular, in the case study, it is evident that for pluvial hazards, disabled people are relatively more impacted while for river floods, young people are relatively more impacted.
Figure 7 shows how the economic accessibility is distributed across different typologies of services. In both hazards, the public office, health, education, and industry are the most impacted. In case of pluvial flood, the recovery services are the most impacted for the low return period of 10 years, an aspect that does not happen in the case of river flood. Furthermore, river flood has a higher impact for the services provided to disabled people compared to the pluvial one that has a higher impact for services to elder people.
Finally, Figure 8 shows the number of services lost at the different probabilities of occurrence of the events to represent the traditional risk curve. The results show that for both hazards, the loss of economic services is higher compared to the loss of social services.

4. Discussion

The SAR methodology developed in this work estimates the loss of social and economic services due to the reduction of accessibility. The methodology is based on two main steps: (1) construction of a graph that represents the services that the exposed elements exchange within the city; and (2) ranking of the road vulnerability in order to identify non accessible roads after an event.
The weighted directional graph simulates the number of services lost because of the non-accessibility of a road segment, both to incoming (social impact: service not received) and to outgoing nodes (economic impact: service not provided). The graph constructed considering different types of service and the different attributes of the population also allows to calculate the losses for each type of service provided and for the different categories of population that cannot receive the service (e.g., gender, age disabled).
Although the proposed methodology allows us to move toward the direction of a systemic assessment of losses, it still has several limits. First, although the estimate of the impact is quantitative, it is based only on the number of services lost without weighing differently the type of services, the supplier providing it, and not even the receiver. Second, the estimate of indirect damage is obtained by considering only the first order lost services, that is, no simulations of the cascade effects that could be generated due to the missing services have been made. Third, the proposed method neglects the effects of the flood duration on the estimate of service losses, an aspect that for some types of service may be relevant. Finally, the lack of post-event data does not allow for validating the method, whose results were only qualitatively assessed based on stakeholders’ experience.
The applicability of the proposed methodology has been demonstrated through a case study by simulating two types of flooding in the urban center of the city of Monza: pluvial flood due to heavy rainfall in the urban area and fluvial flood due the Lambro river that crosses the city. The scenarios for which the impacts were calculated considered three different return periods: T10, T100, and T200. The vulnerability assessment of the individual road segment was computed using the maximum value of water depth and velocity within the segment for each scenario. This assumption, based on precautionary purposes, generates an overestimation in those segments where only a small part of the road is flooded, typically for pluvial flooding, thus generating an excess estimate of the economic and social impacts.
The complexity of the city system exposed to the two flooding phenomena was obtained by creating a graph, consisting of over 6000 nodes and nearly 1.3 million links, based on the exchange of services between the elements considered most relevant in the urban area of study. The constructed graph does not constitute the actual exchange of services between the elements, as this information is not currently available in any database, therefore the reasonable hypothesis of associating suppliers and users based on logic of geographical proximity has been adopted. Furthermore, the population was considered only as a receiver of services and the service offered as a workforce with other exposed elements (e.g., doctors working in hospitals) was not considered.
The accessibility results obtained from the case study for the two hazards and three return times shows in all cases a greater number of roads closed for vehicles in transit compared to pedestrians. On the other hand, the comparison between hazard type shows that the roads closed due to pluvial flooding are greater than the river floods in which the closed roads are located along the axis of the river. The case study also shows the effectiveness of the methodology in identifying and distinguishing the loss between economic and social services. In particular, the city center is characterized by a greater loss of social service relative to the economic service in both hazards. Comparing the different return times, one can observe the great jump between the impacts obtained for T10 and T100, while the difference between T100 and T200 is much smaller; this aspect should make one reflect on the importance of considering more frequent flooding. The graph constructed considering the information on the social distribution of the Monza population, age and disability, allowed to analyze the distribution of losses in the social fabric. In particular, in the scenarios considered, it was observed that disabled people are most affected in the case of pluvial flood, while young people in the case of river flood. Regarding the economic fabric, the results show that the highest impacts are in the public office, health, education, and industry sector. Furthermore, in the case of a pluvial flood, there are greater losses in the services offered to the elders, while in the case of a river flood, there is greater damage to the services provided for the disabled.
Finally, the case study demonstrates that this methodology can be used both to compute the impact for each single scenario but also to develop the traditional risk assessment based on the number of services lost versus the probability of occurrence. The understanding of indirect loss of services due to floods might change the perspective of urban planning, which currently focuses on assets directly exposed to inundations. Within a service accessibility risk framework, more relevance is attributed to indirect social impacts occurring outside flooded areas, which are usually less frequently examined by standard risk assessments. The reduction of lost services could be obtained by increasing spatial redundancies of some services instead of centralizing them or by constructing floodproof infrastructures to ensure access to critical services, such as health facilities, provided that environmental and legislative constraints make this possible. Moreover, the reduction of lost services can also be effectively addressed by preparedness plans which, for example, identify elderly or disabled people requiring specific assistance in case the roads are not safe for common passenger vehicles.

5. Conclusions

In the introduction of this article, we highlighted that it is no longer sufficient to assess risk based on the estimation of the potential direct losses that a natural hazard could cause, but rather it is necessary to study the indirect effects. Therefore, we proposed and applied a methodology to estimate proxies of indirect economic and social services lost due to inaccessible flooded roads.
The existing methodologies are well advanced in assessing risk based on the estimation of direct losses caused by physical contact with floodwaters, and typically these methods use physical vulnerability functions of the elements and the economic cost to estimate the magnitude of the losses. Instead, in this work, we investigated the indirect impacts across the system due to the interdependency between assets and we considered the number of economic and social services to estimate the magnitude of the losses. In particular, we evaluated the road accessibility in order to estimate which services between providers and users, according to the directed weighted graph built, could not be delivered due to the flood.
This methodology allows to investigate the impact not only within the flooded area but also outside of it. In fact, the construction of the graph allows to propagate the impacts across the city. This new information could be useful to promote new strategies and territory plans, which will not need to only focus on the hazard extension but rather on the total impact that an event can generate in the territory. Further research should be pursued to overpass the hypothesis of geographical proximity to build a more accurate connection between providers and users, and also to assess the efficacy of the adopted proxies compared to others.

Author Contributions

Conceptualization, methodology, and formal analysis, M.A. and C.A.; data curation, M.A. and L.C.; writing—review and editing, M.A. and C.A.; visualization, M.A., C.A., and L.C.; supervision, M.L.V.M. All authors have read and agreed to the published version of the manuscript.

Funding

This research was funded by the project “Dipartimenti di Eccellenza” at IUSS Pavia, funded by the Italian Ministry of Education, University and Research.

Institutional Review Board Statement

Not applicable.

Informed Consent Statement

Not applicable.

Data Availability Statement

Restrictions apply to the availability of these data. Data were obtained from Comune di Monza and are not publicly available due to privacy reason.

Acknowledgments

This research was supported by Fondazione Cariplo under the project “NEWFRAME: NEtWorkbased Flood Risk Assessment and Management of Emergencies”.

Conflicts of Interest

The authors declare no conflict of interest. The funders had no role in the design of the study; in the collection, analyses, or interpretation of data; in the writing of the manuscript, or in the decision to publish the results.

References

  1. Gardner, G. The City: A System of Systems. In State of the World: Can a City Be Sustainable; Island Press/Center for Resource Economics: Washington, DC, USA, 2016; pp. 27–44. [Google Scholar]
  2. Falco, G.J. City Resilience through Data Analytics: A Human-centric Approach. Procedia Eng. 2015, 118, 1008–1014. [Google Scholar] [CrossRef] [Green Version]
  3. Schanze, J. Pluvial flood risk management: An evolving and specific field. J. Flood Risk Manag. 2018, 11, 227–229. [Google Scholar] [CrossRef]
  4. Meyer, V.; Haase, D.; Scheuer, S. Flood risk assessment in European river basins-concept, methods, and challenges exemplified at the Mulde river. Integr. Environ. Assess. Manag. 2009, 5, 17–26. [Google Scholar] [CrossRef] [PubMed]
  5. Ward, P.J.; Jongman, B.; Weiland, F.S.; Bouwman, A.; van Beek, R.; Bierkens, M.F.P.; Ligtvoet, W.; Winsemius, H.C. Assessing flood risk at the global scale: Model setup, results, and sensitivity. Environ. Res. Lett. 2013, 8, 44019. [Google Scholar] [CrossRef]
  6. Winsemius, H.C.; Van Beek, L.P.H.; Jongman, B.; Ward, P.J.; Bouwman, A. A framework for global river flood risk assessments. Hydrol. Earth Syst. Sci. 2013, 17, 1871–1892. [Google Scholar] [CrossRef] [Green Version]
  7. Armenakis, C.; Du, E.X.; Natesan, S.; Persad, R.A.; Zhang, Y. Flood risk assessment in urban areas based on spatial analytics and social factors. Geosciences 2017, 7, 123. [Google Scholar] [CrossRef] [Green Version]
  8. Al Baky, M.A.; Islam, M.; Paul, S. Flood Hazard, Vulnerability and Risk Assessment for Different Land Use Classes Using a Flow Model. Earth Syst. Environ. 2020, 4, 225–244. [Google Scholar] [CrossRef] [Green Version]
  9. Mobini, S.; Nilsson, E.; Persson, A.; Becker, P.; Larsson, R. Analysis of pluvial flood damage costs in residential buildings—A case study in Malmö. Int. J. Disaster Risk Reduct. 2021, 62, 102407. [Google Scholar] [CrossRef]
  10. Sörensen, J.; Mobini, S. Pluvial, urban flood mechanisms and characteristics—Assessment based on insurance claims. J. Hydrol. 2017, 555, 51–67. [Google Scholar] [CrossRef]
  11. Szewrański, S.; Chrusćinśki, J.; Kazak, J.; Swíader, M.; Tokarczyk-Dorociak, K.; Zmuda, R. Pluvial Flood Risk Assessment Tool (PFRA) for rainwater management and adaptation to climate change in newly urbanised areas. Water 2018, 10, 386. [Google Scholar] [CrossRef] [Green Version]
  12. Rözer, V.; Müller, M.; Bubeck, P.; Kienzler, S.; Thieken, A.; Pech, I.; Schröter, K.; Buchholz, O.; Kreibich, H. Coping with pluvial floods by private households. Water 2016, 8, 304. [Google Scholar] [CrossRef] [Green Version]
  13. Tiepolo, M.; Belcore, E.; Braccio, S.; Issa, S.; Massazza, G.; Rosso, M.; Tarchiani, V. Method for fluvial and pluvial flood risk assessment in rural settlements. MethodsX 2021, 8, 101463. [Google Scholar] [CrossRef] [PubMed]
  14. Apel, H.; Martínez Trepat, O.; Hung, N.N.; Chinh, D.T.; Merz, B.; Dung, N.V. Combined fluvial and pluvial urban flood hazard analysis: Concept development and application to Can Tho city, Mekong Delta, Vietnam. Nat. Hazards Earth Syst. Sci. 2016, 16, 941–961. [Google Scholar] [CrossRef] [Green Version]
  15. Jian, W.; Li, S.; Lai, C.; Wang, Z.; Cheng, X.; Lo, E.Y.M.; Pan, T.C. Evaluating pluvial flood hazard for highly urbanised cities: A case study of the Pearl River Delta Region in China. Nat. Hazards 2021, 105, 1691–1719. [Google Scholar] [CrossRef]
  16. Tanir, T.; Sumi, S.J.; Lima, A.D.S.D.; Coelho, G.D.A.; Uzun, S.; Cassalho, F.; Ferreira, C.M. Multi-scale comparison of urban socio-economic vulnerability in the Washington, DC metropolitan region resulting from compound flooding. Int. J. Disaster Risk Reduct. 2021, 61, 102362. [Google Scholar] [CrossRef]
  17. Brémond, P.; Grelot, F. Review Article: Economic evaluation of flood damage to agriculture—Review and analysis of existing methods. Nat. Hazards Earth Syst. Sci. 2013, 13, 2493–2512. [Google Scholar] [CrossRef]
  18. Meyer, V.; Becker, N.; Markantonis, V.; Schwarze, R.; Van Den Bergh, J.C.J.M.; Bouwer, L.M.; Bubeck, P.; Ciavola, P.; Genovese, E.; Green, C.; et al. Review article: Assessing the costs of natural hazards-state of the art and knowledge gaps. Nat. Hazards Earth Syst. Sci. 2013, 13, 1351–1373. [Google Scholar] [CrossRef]
  19. Oubennaceur, K.; Chokmani, K.; Nastev, M.; Lhissou, R.; El Alem, A. Flood risk mapping for direct damage to residential buildings in Quebec, Canada. Int. J. Disaster Risk Reduct. 2019, 33, 44–54. [Google Scholar] [CrossRef]
  20. Paprotny, D.; Kreibich, H.; Morales-Nápoles, O.; Wagenaar, D.; Castellarin, A.; Carisi, F.; Bertin, X.; Merz, B.; Schröter, K. A Probabilistic Approach to Estimating Residential Losses from Different Flood Types; Springer: Dordrecht, The Netherlands, 2021. [Google Scholar]
  21. Molinari, D.; Scorzini, A.R.; Arrighi, C.; Carisi, F.; Castelli, F.; Domeneghetti, A.; Gallazzi, A.; Galliani, M.; Grelot, F.; Kellermann, P.; et al. Are flood damage models converging to reality? Lessons learnt from a blind test. NHESS 2020, 20, 2997–3017. [Google Scholar] [CrossRef]
  22. Gil, J.; Steinbach, P. From flood risk to indirect flood impact: Evaluation of street network performance for effective management, response and repair. WIT Trans. Ecol. Environ. 2008, 118, 335–344. [Google Scholar] [CrossRef] [Green Version]
  23. Arosio, M.; Martina, M.L.V.; Creaco, E.; Figueiredo, R. Indirect Impact Assessment of Pluvial Flooding in Urban Areas Using a Graph-Based Approach: The Mexico City Case Study. Water 2020, 12, 1753. [Google Scholar] [CrossRef]
  24. Arrighi, C.; Pregnolato, M.; Castelli, F. Indirect flood impacts and cascade risk across interdependent linear infrastructures. Nat. Hazards Earth Syst. Sci. 2021, 21, 1955–1969. [Google Scholar] [CrossRef]
  25. Ouyang, M. Review on modeling and simulation of interdependent critical infrastructure systems. Reliab. Eng. Syst. Saf. 2014, 121, 43–60. [Google Scholar] [CrossRef]
  26. Hilly, G.; Vojinovic, Z.; Weesakul, S.; Sanchez, A.; Hoang, D.N.; Djordjevic, S.; Chen, A.S.; Evans, B. Methodological framework for analysing cascading effects fromflood events: The case of Sukhumvit area, Bangkok, Thailand. Water 2018, 10, 81. [Google Scholar] [CrossRef] [Green Version]
  27. Trucco, P.; Cagno, E.; De Ambroggi, M. Dynamic functional modelling of vulnerability and interoperability of Critical Infrastructures. Reliab. Eng. Syst. Saf. 2012, 105, 51–63. [Google Scholar] [CrossRef]
  28. Pant, R.; Thacker, S.; Hall, J.W.; Alderson, D.; Barr, S. Critical infrastructure impact assessment due to flood exposure. J. Flood Risk Manag. 2018, 11, 22–33. [Google Scholar] [CrossRef]
  29. Arosio, M.; Martina, M.L.V.; Figueiredo, R. The whole is greater than the sum of its parts: A holistic graph-based assessment approach for natural hazard risk of complex systems. Nat. Hazards Earth Syst. Sci. 2020, 20, 521–547. [Google Scholar] [CrossRef] [Green Version]
  30. De Bruijn, K.M.; Maran, C.; Zygnerski, M.; Jurado, J.; Burzel, A.; Jeuken, C.; Obeysekera, J. Flood resilience of critical infrastructure: Approach and method applied to Fort Lauderdale, Florida. Water 2019, 11, 517. [Google Scholar] [CrossRef] [Green Version]
  31. Tarani, F.; Arrighi, C.; Carnevali, L.; Castelli, F.; Vicario, E. Flood Resilience of a Water Distribution System. In Advanced Sciences and Technologies for Security Applications; Springer International Publishing AG: Cham, Switzerland, 2019; ISBN 978-3-319-95596-4. [Google Scholar] [CrossRef]
  32. Salvati, P.; Petrucci, O.; Rossi, M.; Bianchi, C.; Pasqua, A.A.; Guzzetti, F. Science of the Total Environment Gender, age and circumstances analysis of fl ood and landslide fatalities in Italy. Sci. Total Environ. 2018, 610, 867–879. [Google Scholar] [CrossRef] [PubMed]
  33. Arrighi, C.; Pregnolato, M.; Dawson, R.J.; Castelli, F. Preparedness against mobility disruption by floods. Sci. Total Environ. 2019, 654, 1010–1022. [Google Scholar] [CrossRef] [PubMed]
  34. Rosenzweig, B.R.; Herreros Cantis, P.; Kim, Y.; Cohn, A.; Grove, K.; Brock, J.; Yesuf, J.; Mistry, P.; Welty, C.; McPhearson, T.; et al. The Value of Urban Flood Modeling. Earth’s Future 2021, 9, e2020EF001739. [Google Scholar] [CrossRef]
  35. Rinaldi, S.M.; Peerenboom, J.P.; Kelly, T.K. Identifying, understanding, and analyzing critical infrastructure interdependencies. IEEE Control Syst. Mag. 2001, 21, 11–25. [Google Scholar] [CrossRef]
  36. Arosio, M.; Cesarini, L.; Martina, L.V.M. Assessment of the disaster resilience to flood of complex systems: The case of the flood resilience of a densely populated city. Water. under review.
  37. Ashley, S.T.; Ashley, W.S. Flood fatalities in the United States. J. Appl. Meteorol. Climatol. 2008, 47, 805–818. [Google Scholar] [CrossRef]
  38. Fitzgerald, G.; Du, W.; Jamal, A.; Clark, M.; Hou, X.Y. Flood fatalities in contemporary Australia (1997–2008): Disaster medicine. EMA—Emerg. Med. Australas. 2010, 22, 180–186. [Google Scholar] [CrossRef]
  39. Pregnolato, M.; Ford, A.; Wilkinson, S.M.; Dawson, R.J. The impact of flooding on road transport: A depth-disruption function. Transp. Res. Part D 2017, 55, 67–81. [Google Scholar] [CrossRef]
  40. O’Brien, J.S.; Julien, P.Y.; Fullerton, W.T. Two-dimensional Water Flood and Mudflow Simulation. J. Hydraul. Eng. 1993, 119, 244–261. [Google Scholar] [CrossRef]
  41. Galuppini, G.; Quintilliani, C.; Arosio, M.; Barbero, G.; Ghilardi, P.; Manenti, S.; Petaccia, G.; Todeschini, S.; Ciaponi, C.; Martina, M.L.V.; et al. A unified framework for the assessment of multiple source urban flash flood hazard: The case study of Monza, Italy. Urban Water J. 2020, 17, 65–77. [Google Scholar] [CrossRef]
Figure 1. SAR methodological framework.
Hydrology 08 00142 g001
Figure 2. Map of providers and services exchange, the connections from providers to residential are removed for readability: (a) nodes and (b) links.
Hydrology 08 00142 g002
Figure 3. Maps of road accessibility at T = 100 y: (a) pluvial and (b) river hazard.
Hydrology 08 00142 g003
Figure 4. Distribution of road accessibility for vehicles and pedestrian across different T: (a) pluvial flood; (b) river flood.
Hydrology 08 00142 g004
Figure 5. Comparison between pluvial (a,c,d) and fluvial (b,d,f) hazards at T = 100yy scenario: (a,b) traveling vehicles accessibility; (c,d) social service impact; (e,f) economic service impact.
Hydrology 08 00142 g005
Figure 6. Social service accessibility impact: (a) pluvial flood; (b) river flood.
Hydrology 08 00142 g006
Figure 7. Economic service accessibility impact: (a) pluvial flood; (b) river flood.
Hydrology 08 00142 g007
Figure 8. Risk curves for economic and social impacts: (a) pluvial, (b) river.
Hydrology 08 00142 g008
Table 1. Proxy for social and economic impacts.
Sector ProxyComputation
SocialServices not delivered because receivers are in closed roads Sum of the weights of the inbound links to residential nodes located in a road closed to the traffic. The value can be analyzed by gender, age, and disability.
EconomicServices not delivered because providers are in closed roadsSum of the weights of the outgoing links from provider nodes that are located in a road closed to the traffic. The value can be analyzed by service typologies.
Table 2. List of node types.
CategoryCategory’s DescriptionNumerosityReceiver
BridgeThe 10 bridges that cross the Lambro and Lambretto river inside the municipality of Monza. These bridges are the way to pass from west to east of the town and are closed in case of river flood.10Crossroad
Center for Disability All the facilities that offer services aimed at disabled people as indicated in the data provided by the municipality.6Residential
CrossroadFifty major intersections inside the municipality of Monza.50All typology
EducationPrimary, middle, and high school and university as reported in the data provided by the municipality.136Residential
HealthStructures that provide services related to human beings’ health that do not require first aid (e.g., nursing home, general practitioner).80Residential
IndustryAll the establishments that are involved in activities falling within the secondary sector scope according to the data provided by the municipality.331Residential, shops
LeisureStructures that offer opportunity for social gathering or recreational activities (e.g., community centers, volunteer offices).143Residential
Public OfficePublic administration offices and postal offices.28Residential
Recovery The structures in charge of providing first aid 24/7 (e.g., hospitals, fire fighters).10All typology except for bridge and crossroad
Senior CenterStructures that offer social services and assistance to the elderly.6Residential
Shops All the establishments that are involved in activity falling within the tertiary sector scope according to the data provided by the municipality.214Residential
ResidentialThe buildings where at least one person resides according to the data provided by the municipality.4990 -
Table 3. Spatial ranges employed for establishing connections.
ProviderReceiverSpatial Range
BridgeCrossroadParallel bands
Center for DisabilityResidentialRadial area
CrossroadAll typologyRadial area
EducationResidentialRadial area
HealthResidentialRadial area
IndustryResidential, shopsRadial area
LeisureResidentialRadial area
Public OfficeResidentialRadial area
RecoveryAll typology except for bridge and crossroadEntire city
Senior CenterResidentialRadial area
ShopsResidentialRadial area
Publisher’s Note: MDPI stays neutral with regard to jurisdictional claims in published maps and institutional affiliations.

