Abstract
Understanding the interconnections between oceanic-atmospheric climate variables and regional streamflow of the conterminous United States may aid in improving regional long lead-time streamflow forecasting. The current research evaluates the time-lagged relationship between streamflow of six geographical regions defined from National Climate Assessment and sea surface temperature (SST), 500-mbar geopotential height (Z500), 500-mbar specific humidity (SH500), and 500-mbar east-west wind (U500) of the Pacific and the Atlantic Ocean using singular value decomposition (SVD). The spatio-temporal correlation between streamflow and SST was developed first from SVD and thus obtained correlation was later associated with Z500, SH500, and U500 separately to evaluate the coupled interconnections between the climate variables. Furthermore, the associations between regional streamflow and the El Niño Southern Oscillation (ENSO), Pacific Decadal Oscillation, and Atlantic Multidecadal Oscillation were evaluated using the derivatives of continuous wavelet transform. Regional SVD analysis revealed significant teleconnection between several regions and climate variables. The warm phase of equatorial SST had shown a stronger correlation with the majority of streamflow. Both SVD and wavelet analyses concluded that the streamflow variability of the regions in close proximity to the Pacific Ocean was strongly associated with the ENSO. Improved knowledge of teleconnection of climate variables with regional streamflow variability may help in regional water management and streamflow prediction studies.
1. Introduction
According to the Intergovernmental Panel on Climate Change [], recent climate change has affected human and natural systems all over the world. A few of the observed effects of climate change include increasing global temperature, diminishing snow and ice cover, and rising sea level. Alteration of the regional hydrological cycle and subsequent effect on quality and quantity of water resources are some of the major ramifications of changing climate []. The magnitude, frequency, and intensity of precipitation are changing across the globe. The availability of water is also becoming uncertain in response to climate change over the years []. Variation in timing and magnitude of streamflow, change in groundwater flow and natural reservoirs can affect water resources planning and management. The effects of climatic variability on streamflow have important implications on water management system and the knowledge of such variability may support water management decisions []. Since streamflow is a major component of the water cycle, streamflow variability can indicate an overall variation of water cycle within a region []. The interrelationship between streamflow and climate change is pivotal for reliable prediction of several hydrologic processes and mitigating climate change induced disasters.
Previous research efforts have shown that streamflow variability is linked with large-scale circulation patterns of the oceanic-atmospheric system [,,]. Several teleconnection patterns are known to influence the hydrologic variability on a local as well as global scale [,,]. These teleconnection patterns varying both spatially and temporally are found to influence the variability of the atmospheric circulation throughout the United States. The major oceanic-atmospheric oscillations that have an influence on the hydrology of U.S. include El Niño Southern Oscillation (ENSO), North Atlantic Oscillation, Arctic Oscillation, Pacific-North American pattern, Pacific Decadal Oscillation (PDO), and Atlantic Multidecadal Oscillation (AMO). The ENSO effect has shown strong predictive ability and its global influence on hydro-climatic anomalies is also evident [,]. The stronger association of U.S. hydrology with ENSO has been understood and studied extensively [,]. For PDO, the period of oscillation and the area of influence is bigger than ENSO []. The AMO has a periodicity of 60–80 years and it primarily affects air temperature and rainfall pattern across the northern hemisphere []. The PDO in conjunction with AMO is found to be associated with the majority of multidecadal drought patterns in the United States []. Even though these major oceanic-atmospheric oscillations have widespread effects on the climate system, they may not explain the hydrologic variability in every watershed and offer limited predictive information []. Consideration of the entire oceanic region in the analysis reduces spatial biases and provides a wider scope of possible teleconnections [].
Several researchers have identified the influence of different climate variables that drive the hydrological cycle of a region. Among the variables sea surface temperature (SST), atmospheric pressure, humidity, and wind speed directly influence the mechanism of the hydrological cycle. Heating of the ocean, evaporation of water, the formation of clouds, movement of clouds, and final precipitation are driven by the abovementioned hydro-climatological variables. Streamflow variability can be attributed to any change in temperature, pressure, wind speed or humidity within the hydrological cycle. To understand the physical mechanism governing the hydrologic variability, a composite analysis using SST, pressure level, zonal wind speed, and humidity is preferred. Several documented works have shown strong relationships between the U.S. streamflow and the Pacific/Atlantic SST variability [,]. Another important oceanic-atmospheric variable, which has a strong coupled relationship with streamflow variability is atmospheric pressure level. The atmospheric pressure is expressed in terms of equivalent height at specific pressure level termed as geopotential height in the current study. Many studies have shown the existence of a strong correlation between the geopotential height at 500-mbar pressure level (Z500) and climate variability [,,]. Wallace and Gutzler [] pointed out that the teleconnection pattern at 500 mbar pressure level is stronger than other levels. Two additional climate variables utilized by the research are zonal east-west wind speed (U500) and specific humidity (SH500), both measured at 500-mbar pressure level. Pathak et al. [] used U500 to find the teleconnection between snow water equivalents of the western United States and the Pacific and the Atlantic Ocean. The objective behind the selection of these variables is to evaluate the interconnection of SST, Z500, SH500, and U500 in driving the streamflow variability. Furthermore, all these climate variables are interconnected and dependent on one another in driving the hydrological cycle. For example, the variation of SST may cause wind speed or specific humidity to change, which may eventually affect the precipitation patterns of the affected watershed. In addition, the inclusion of these variables may broaden the scope of the analysis.
Several techniques such as principal component analysis, factor analysis, canonical correlation analysis, singular value decomposition (SVD), and combined principal component analysis are available to find the interrelationship and dependency for multivariate analysis []. SVD is a data mining technique that involves reduction of data dimensionality, and is primarily used to explain mutual dependence and variance of huge series of data []. Among other statistical tools, mentioned earlier, SVD is considered a simple, precise, and robust method for revealing the correlation between two fields []. Wallace et al. [] also concluded that SVD extracts the most significant modes of variability in comparison to other statistical techniques. From the viewpoint of linear algebra, SVD is related to the Eigen decomposition and it is useful in analyzing rectangular matrices []. It is well known for its stability and convergence even for ill-conditioned problems []. SVD has been extensively used to find the correlation between streamflow and various climate data [,,]. Serial correlation analysis, Fourier transform, and wavelet transform are some of the commonly used techniques to analyze time series data []. Compared to these traditional methods, the wavelet transform is considered a powerful technique for its wide applicability and practicability []. It has been used to evaluate variance and isolate important information from nonlinear and non-stationary hydroclimatic data with complex periodicities []. Continuous wavelet transform (CWT) is a type of wavelet transform used to determine the variability in data, while cross wavelet transform (CWT) and wavelet coherency (WTC) are employed for evaluation of the correlation between two different time series data. Interested readers may also refer to Coulibaly and Baldwin [], and Labat [] for detail descriptions of wavelets in hydro-climatic data analyses.
The motivation behind this research was to evaluate the hydrologic responses in each of the geographic regions of the conterminous U.S. defined from 2014 National Climate Assessment (NCA) under changing climate conditions. Previous studies [,] have used SVD to find the coupled relationship between streamflow and climatic variability of the conterminous United States. However, the studies have not focused the variability on regional level separately. In addition, consideration of the interlinkage between the climate variables has not received much attention in previous studies. The primary objectives of this research were to evaluate:
- The association between conterminous U.S. streamflow and climate variables of the Pacific and Atlantic Oceans and to analyze the driving mechanism of streamflow variability due to these climate variables.
- The correlation between regional streamflow and three important predefined indices, namely, the ENSO, PDO, and AMO.
Utilization of principal predefined indices together may explain the majority of the streamflow variability of the region. The combination of both the SVD and wavelet approach for the comprehensive study of the U.S. streamflow with respect to climate variables aims to investigate the interdependency of streamflow with climate variability and change at regional level.
2. Study Area and Data
2.1. Study Area
The conterminous U.S. is geographically distinguished into six major regions, i.e., Great Plains, Midwest, Northeast, Northwest, Southeast, and Southwest region from NCA. The detail description and map of the regions can be viewed from NCA website (https://nca2014.globalchange.gov/). Table 1 illustrates the NCA regions and constituent states. Figure 1 illustrates the map of all the NCA regions and the analyzed streamflow stations.

Table 1.
NCA regions and the constituent states.
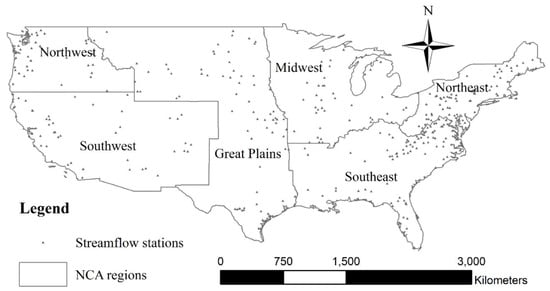
Figure 1.
Map showing NCA regions and streamflow stations.
2.2. Data
The dataset for the analysis is comprised of the streamflow dataset from 350 unimpaired streamflow stations and the climate dataset represented by SST, Z500, SH500, and U500 of the Pacific and Atlantic Oceans along with ENSO, PDO, and AMO climate indices.
2.2.1. Streamflow Data
Unimpaired streamflow data are used such that the variability of streamflow could only be attributed to climate change effects. United States Geological Survey (USGS) Hydro-Climate Data Network 2009 (HCDN-2009) provided the streamflow dataset for 743 unimpaired streamflow stations throughout the country []. Based on the spatial distribution of stations and availability of continuous data, streamflow data with different time range were selected for each region. Selection was intended to cover the maximum number of streamflow stations that can have potential to show wide variability within a region. Even though the starting years of the streamflow data were different, the ending year of the dataset was kept at 2015 for all the regions. The covered data range varied from 55 to 65 years. Out of the 743 stations, 350 streamflow stations were considered (Table 2). The mean monthly streamflow data from April to August were extracted from USGS website (http://www.usgs.gov/) and summed for the analysis.

Table 2.
The number of stations, data range, and the total percentage of variance explained by the first principal component (FPC) in each of the NCA regions.
2.2.2. Climate Variability Data
The climate data were composed of mean monthly values of SST, Z500, SH500, and U500 of the Pacific and the Atlantic Ocean. The SST data were extracted from the National Oceanic and Atmospheric Administration (NOAA) Physical Sciences Division (http://www.esrl.noaa.gov/). These datasets are available in Network Common Data Form file format. After extraction, the datasets were processed in MATLAB software and the standardization of data was done prior to the analysis. The mean monthly SST data, which is an extended and reconstructed dataset, was extracted from 2° × 2° grid cells and the spatial extent of SST data in the Pacific Ocean was 100° E to 80° W longitude and 30° S to 70° N latitude []. The extent for the Atlantic Ocean was 80° W to 20° W longitude and 30° S to 70° N latitude. Seasonal analysis of streamflow with climate variability is preferred to water-year analysis because water-year analysis does not effectively capture the seasonal interaction of streamflow and climatic indicators []. It is also observed that winter climatic variability is more active in driving the U.S. streamflow. This research, therefore, considered one winter variability and one fall variability. The division of climate data into two periods, i.e., fall and winter, makes it possible to evaluate the time-lagged relationship of climate variability that might affect incoming spring-summer streamflow. The two-seasonal analysis can be compared and differentiated to understand the possible interaction of same streamflow with climate variability of two different periods.
NOAA Physical Science Center (http://www.esrl.noaa.gov/) provided the mean monthly Z500, U500, and SH500 data. These datasets are the product of National Centers for Environmental Prediction/National Center for Atmospheric Research Reanalysis project []. These data were obtained from 2.5° × 2.5° grid cells for both the oceans, and the spatial extent was kept the same as that of SST data. In order to evaluate the correlation between regional streamflow and climate variables, only streamflow data at the regional level were discretized. We did not discretize the climate dataset in regional level. We considered the single dataset for each regional analysis. For example, we correlated the single Z500 dataset with the Great Plains streamflow dataset coming from 69 streamflow stations. In addition, the same Z500 dataset was correlated with Midwest streamflow dataset coming from 45 streamflow stations. The utilization of the entire dataset thus eliminates the need for differentiation of that dataset for individual rivers or individual regions.
In the research, a lead-time approach was presented to understand the time-lagged relationship of climate variability and streamflow. Lead-time in the current study is defined as the time lag from the last month of SST/Z500/SH500/U500 period to the first month of streamflow period. The mean monthly climate data were divided into two periods: September to November of the previous year and December of the previous year to February of the current year. For example, if streamflow was analyzed for April–August of 2005, monthly average SST data for September to November of 2004, and December 2004 to February 2005 were used for the analysis. This division created two lead-time cases, i.e., 1-month lead-time and 4-month lead-time. Since each region had a different range of streamflow data, all the climate data were utilized accordingly to develop the above-mentioned time-lagged relationship.
The monthly indices of ENSO (December–February average) and AMO (annual average) were extracted from the NOAA (https://www.esrl.noaa.gov/) online databases for their respective indices. The online database of Joint Institute for the Study of the Atmosphere and Ocean (http://www.jisao.washington.edu/) provided the monthly PDO (December-February average) indices.
3. Methodology
In the current research, SVD was applied between the April–August streamflow of each of the NCA regions and the September–November and December–February SST data of both the oceans. The SVD-SST relation was then correlated with Z500, SH500, and U500 data separately. Moreover, a wavelet approach was also proposed to study the correlation between U.S. streamflow and ENSO, PDO, and AMO separately. In summary, the methodology is divided into two sections: (a) SVD analysis to find the spatio-temporal correlation between regional streamflow and SST/Z500/SH500/U500 of the Pacific and Atlantic Oceans; (b) CWT analysis to determine the correlation between regional streamflow and the ENSO, PDO, and AMO indices across multiple timescale bands. All the analyses were conducted using the programming platform MATLAB version 2017a.
3.1. Singular Value Decomposition
The use of SVD for the research is briefly described below. First, the standardized SST anomalies matrix and standardized streamflow matrix were developed and SVD was applied to the cross-covariance matrix. Consider A is the cross-covariance matrix developed by multiplying SST matrix with the transpose of streamflow (QT) matrix and divided by the number of years (N).
SVD of the cross-covariance matrix generates three matrices as:
U and VT are an orthogonal matrix in which the columns of U are termed as left singular vectors while the rows of VT are termed as a right singular vector. S is a diagonal matrix with non-negative diagonal elements, which are square roots of eigenvalues of U or VT, arranged in descending order termed as singular values. The singular values contain very valuable information about the properties of the matrix. Isolation of the most important modes of data is calculated based on squared covariance fraction (SCF):
where, C signifies each of the singular values for i-th mode. The SCF values more than 10% only were considered for the analysis. Similar to SCF, normalized squared covariance (NSC) is defined as:
where C2 is the sum of singular values and NS is the number of grid points while NZ is the number of stream gage stations. The NSC value ranges from 0 to 1 with maximum value for perfect correlation between two variables. Then the left temporal expansion series (LTES) was obtained by multiplying the left singular vector (L) with SST matrix, and an identical procedure was followed for right temporal expansion series (RTES).
Finally, heterogeneous correlation map of left (right) field was developed by correlating SST (streamflow) matrix with RTES (LTES) at 95% significance level. The SST temporal expansion series was then correlated individually with standardized Z500, SH500, and U500 data and respective heterogeneous correlation maps were generated. Correlating TES of SST with other climate variables helped in retaining the initial relationship of SST with streamflow. This approach, therefore, allowed evaluating the interconnection of streamflow variability with hydro-climate variables in conjunction with SST influence.
3.2. Continuous Wavelet Transform and its Derivatives
Application of CWT and its derivatives used in this study were based on the steps suggested by Torrence and Compo [], Torrence and Webster [], and Labat []. Rectification of bias was also considered, as suggested by Liu et al. []; however, the results were found to be quite similar with or without the bias rectification. The variance of the time-series data, known as the high power in the wavelet spectrum, was detected across continuous timescale bands using CWT from Foufoula-Georgiou and Kumar []. For each region, a principal component analysis (PCA) was conducted among all the streamflow stations and the first principal components (FPC) were selected to be the representatives of the regional streamflow patterns. Table 2 provides the number of stations and the variance from FPC for each region obtained from the PCA. According to Percival and Walden [], the Morlet function is the most fitting mother wavelet function in dealing with hydro-climatic data; hence, it was chosen in the study as the wavelet function.
To determine the association between two time series data across multiple timescale bands, two derivatives of CWT—namely, cross wavelet transform (XWT) and wavelet coherency (WTC) analyses—were used. XWT and WTC determine the covariance and correlation, respectively, between the two time series. Besides the association between the data, XWT and WTC also provide information regarding the relative phase relationship, i.e., in-phase, anti-phase, lagged response, and simultaneous response, across the various bands along the study period [,]. Using the Monte Carlo simulation approach [], WTC is also capable of quantifying the correlation between two time series even at lower common power (lower association). Hence, the current study presented the results obtained from the WTC analyses only. The wavelet significance was at 5% against the red noise [].
4. Results and Discussion
The results and discussion section are also separated into two sections each for SVD and CWT analyses.
4.1. SVD Analysis
The results of the SVD analysis are presented in this section. Figure 2, Figure 3, Figure 4, Figure 5, Figure 6 and Figure 7 show the heterogeneous correlation map developed for each region along with significantly correlated streamflow stations. The heterogeneous correlation maps developed from the SVD analysis show significant regions for SST, Z500, SH500, and U500 of both Pacific and the Atlantic Ocean for two different lead-time cases. For clarity, each significant region was given a name and number. For example, SST-1, Z-2, SH-3, U-4 and so on. First-mode SVD results were considered, as they explained most of the variability. Table 3 presents the SCF and NSC value for both lead-time cases.
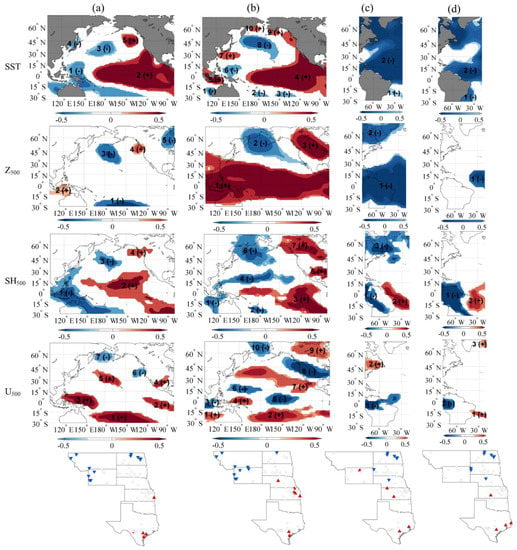
Figure 2.
Heterogeneous correlation map developed for (a) Pacific September–November; (b) Pacific December–February; (c) Atlantic September–November; (d) Atlantic December–February SST, Z500, SH500, and U500 with Great Plains April–August streamflow. Significant regions with positive (negative) correlations are represented by red (blue). Significant streamflow stations are represented by red upward (blue downward) triangles.
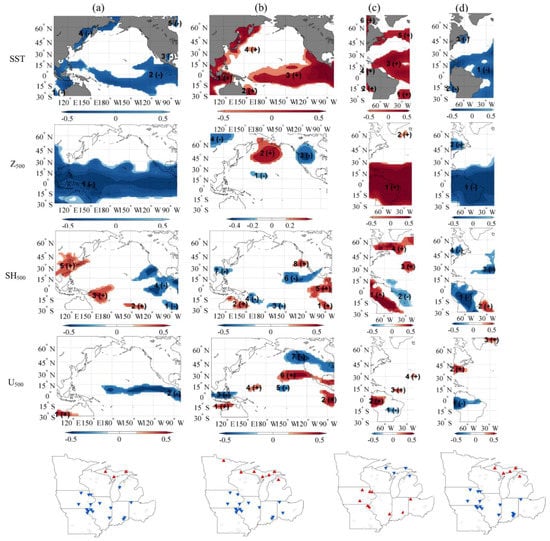
Figure 3.
Heterogeneous correlation map developed for (a) Pacific September–November; (b) Pacific December–February; (c) Atlantic September–November; (d) Atlantic December–February SST, Z500, SH500, and U500 with Midwest April–August streamflow. Significant regions with positive (negative) correlations are represented by red (blue). Significant streamflow stations are represented by red upward (blue downward) triangles.
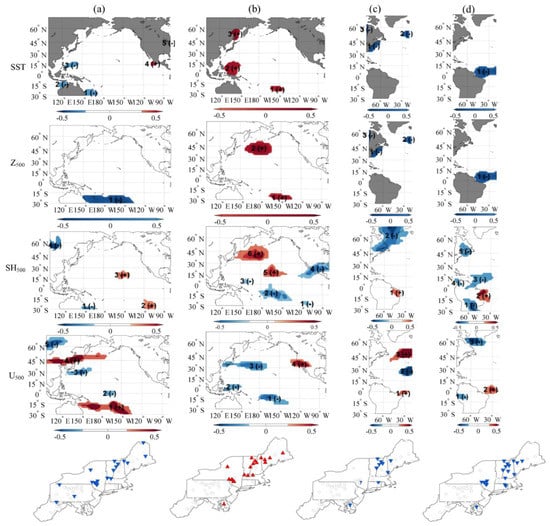
Figure 4.
Heterogeneous correlation map developed for (a) Pacific September–November; (b) Pacific December–February; (c) Atlantic September–November; (d) Atlantic December–February SST, Z500, SH500, and U500 with Northeast April–August streamflow. Significant regions with positive (negative) correlations are represented by red (blue). Significant streamflow stations are represented by red upward (blue downward) triangles.
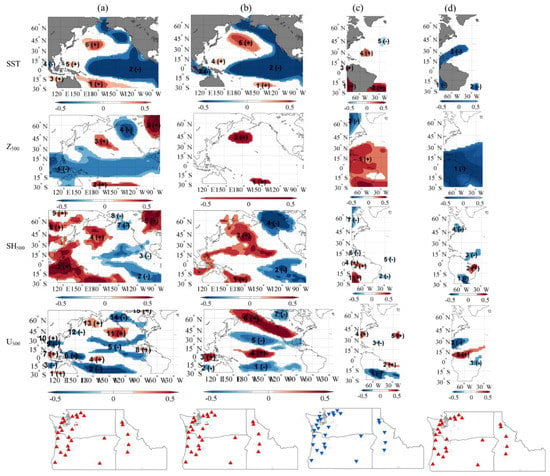
Figure 5.
Heterogeneous correlation map developed for (a) Pacific September–November; (b) Pacific December–February; (c) Atlantic September–November; (d) Atlantic December–February SST, Z500, SH500, and U500 with Northwest April–August streamflow. Significant regions with positive (negative) correlations are represented by red (blue). Significant streamflow stations are represented by red upward (blue downward) triangles.
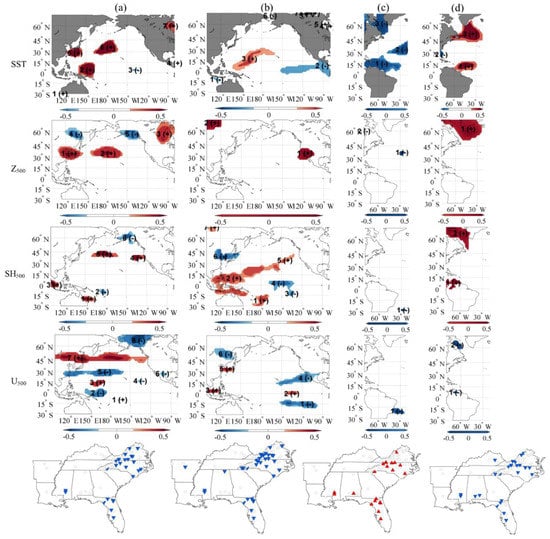
Figure 6.
Heterogeneous correlation map developed for (a) Pacific September–November; (b) Pacific December–February; (c) Atlantic September–November; (d) Atlantic December–February SST, Z500, SH500, and U500 with Southeast April–August streamflow. Significant regions with positive (negative) correlations are represented by red (blue). Significant streamflow stations are represented by red upward (blue downward) triangles.
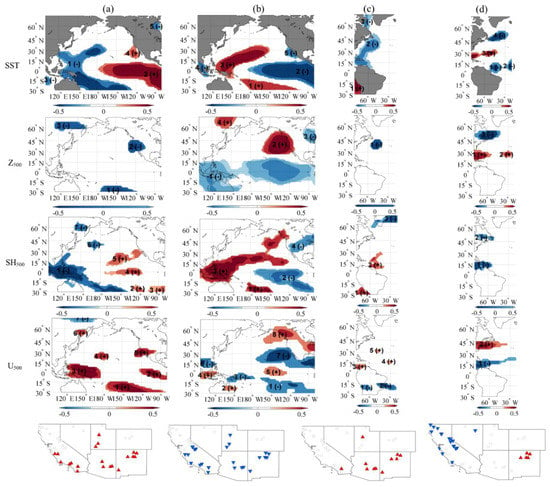
Figure 7.
Heterogeneous correlation map developed for (a) Pacific September–November; (b) Pacific December–February; (c) Atlantic September–November; (d) Atlantic December–February SST, Z500, SH500, and U500 with Southwest April–August streamflow. Significant regions with positive (negative) correlations are represented by red (blue). Significant streamflow stations are represented by red upward (blue downward) triangles.

Table 3.
SCF and NSC values obtained from SVD analysis for different lead-time cases.
4.1.1. Great Plains
For both the 4-month lead-time and 1-month lead-time cases, a large SST region was identified in the ENSO region. The region bounded in between 5° N–5° S and 170° E–120° W has been reported as a typical ENSO region []. The increase in SST in the SST-2 region was accompanied by an increase in the pressure zone near the northwestern U.S. states and the south Asian region shown in Z-4 and Z-2 region, respectively. The increase in the SST and pressure increased the specific humidity around the equatorial region and ENSO region shown by SH-2. This overall increase in the pressure and specific humidity strengthened the wind circulation over the study area represented by U-4 region and caused increased streamflow in southernmost stations. Figure 2b suggests that the decrease in the lag time from 4-month to 1-month resulted in an increase of significant regions. Furthermore, the spatial extent of the positively correlated regions was also bigger as compared to the 4-month lead-time case. Both scenarios showed consistent SST regions that were teleconnected with the streamflow stations of the Great Plain.
Only one significant Atlantic SST region was found throughout the Atlantic Ocean (Figure 2c). The SST cooling phase had a positive correlation in stations of North and South Dakota and vice-versa. Two significant Z500 regions were detected within the South America and mid-Atlantic regions, while SH-3 and SH-1 regions were found to be significant and positively correlated with streamflow stations. The significant teleconnected U500 region was a band-like area across the Northern part of South America, while U-2 region above east coast of Canada showed a negative correlation with the streamflow stations. The overall connection of these climate variables resulted in a decrease of streamflow in Texas, Kansas, and Wyoming, while increased streamflow was observed in Nebraska, South Dakota, and North Dakota. Similar to the 4-month lead-time, the response to streamflow variation was alike for the 1-month lead-time case. The spatial extent of the significant regions of each climate variable was found to be similar in this scenario (Figure 2d).
The warming (cooling) phase of SST in the ENSO region was found to be the most important phenomenon in affecting the streamflow variability in the Great Plains. This consistent SST region has also been identified by several researchers as the probable driver of the hydrological cycle in the United States [,]. Both positive and negative correlations were obtained by Tootle and Piechota [] when SVD was applied for Pacific SST streamflow of Great Plains stations. According to Dunnell et al. [], Northern Great Plains has received increasing precipitation in winter, while the Southern region has received decreasing rainfall in recent times, which further supports the results, as the warming trend of the Pacific SST was linked to the decreasing trend of streamflow in the northern parts of the Great Plains, while an increase of streamflow was observed for the southernmost regions. However, Atlantic climate variables showed a positive correlation with streamflow in the northern part and negative correlation in southern regions.
4.1.2. Midwest
The cooling SST phase was linked to decreasing of pressure throughout the Pacific Ocean, as shown in Z-1 region. A similar drop of specific humidity region was observed near to the west coast of the United States. However, two specific humidity regions showed opposite correlation with most of the streamflow stations. A band of U-wind region was identified along the mid equatorial Pacific region that also showed a positive correlation with most of the streamflow stations in the Midwest region. Opposite to the 4-month lead-time case, the 1-month lead-time case identified SST regions which had a negative correlation with the streamflow in the Midwest region (Figure 3b). The cooling SST phase was linked to increasing of streamflow in the southern part while it was linked to decreasing of streamflow in the northern part of the region.
The significant SST regions in the Atlantic region were found near to the east coast of Canada and the northeast coast of Brazil (Figure 3c). These regions were positively correlated with the streamflow of the Midwest, except the stations in Michigan. For 4-month lead-time, the warming phase of SST was also linked to increasing pressure throughout the identified Z500 regions, and the majority of the SH500 regions also showed a positive correlation with streamflow. Smaller pockets of U500 regions were found to be positively correlated with streamflow in the southern stations, while northern stations showed a negative correlation. Both 4-month and 1-month lead-time cases showed significant Atlantic SST regions that were correlated with streamflow stations in a similar way (Figure 3c,d). The spatial extent and position of the significant regions for other climate variables also looked identical for these two lead-time cases.
Similar to the Great Plains, Midwest regions showed both positive and negative correlation with streamflow within the same region. The Pacific equatorial band was the primary significant region, and showed strong association with Midwest streamflow. This region, along with north Pacific region, was found to be influencing the climate of Asia and the western United States []. The north Pacific region acts as a passageway of jet streams, while lower-than-average SST can create a pressure difference and formation of cyclones, transporting saturated air toward the eastern U.S. region []. A consistent Atlantic SST region was found on the northern Brazil coast, previously identified by Chang et al. []. The increased precipitation over the great lakes area when SST was below average could be attributed to the polar jet stream. The storm track shifted towards the northern region and over the great lakes region and caused increased precipitation.
4.1.3. Northeast
The Pacific SST significant regions were sparsely located around the south-east Asian region (Figure 4a,b). The response of climate variables in affecting streamflow variability was limited for the Northeast region. The decrease in SST resulted in reduced streamflow throughout the Northeast region. The decreased SST region was related to a decrease in atmospheric pressure in Z-1 along with an increase in specific humidity represented as SH-2 and SH-3 with both increasing and decreasing wind stress in the different regions. Only the SST and Z500 regions had a strong positive correlation with streamflow in the Northeast region. Mixed signals were observed for both the SH500 and U500 regions. The overall connection of these climate variables resulted in a decrease of streamflow all over the Northeast regions. For the 1-month case, the significant regions and the respective signal of correlation with the streamflow stations remained the same, as compared with the 4-month lead-time case.
Based on the SCF and NSC value, the Atlantic Ocean had a pronounced effect on the variability of streamflow in the Northeast region, as compared to the Pacific Ocean. However, a smaller number of streamflow stations showed correlation with the climate variables. With the decrease of lead-time, the spatial extent and number of significantly correlated regions were higher. Both cases showed similar correlation patterns. For 1-month lead-time, one significant SST region was identified, which was located off the coast of South America, and a decrease of SST was associated with a decrease of pressure, but the observed significant region had a smaller spatial extent. Furthermore, the location of the reduced pressure area was on the southeastern coast of Brazil. The decrease of SST was related to decrease of specific humidity and wind stress near to the Northeast regions. The overall connection resulted in a decrease of streamflow in the region.
The Northeast region was little affected by the Pacific SST or Z500. The correlations of the Atlantic SH500 and U500 with the Northeast streamflow were stronger than that of Atlantic SST and Z500. This result was in agreement with Rajagopalan et al. [], where streamflow of the Northeast region showed limited correlation with climate variability in the Pacific Ocean.
4.1.4. Northwest
It can be seen that the Pacific SST-2 region had the largest spatial extent, occupying most of the equatorial mid-Pacific region (Figure 5a). The SST region showed a negative correlation with streamflow stations in the Northwest region. The cooling SST phase was linked to decreasing atmospheric pressure, while small pockets of increasing pressure zones were also present, i.e., Z-3 and Z-5 regions. However, SH500 significant regions showed a positive correlation with the streamflow. The wind stress over the northwest region also showed an increasing trend, while rest of the significant wind zones showed a decreasing trend. The overall connection of climate variables resulted in an increase of streamflow at all the stations. The SCF was the same, while the NSC value was greater in the 1-month lead-time case. The response of climate variables in both lead-time cases was similar.
Similar to the 4-month lead-time case, the 1-month lead-time Atlantic SST was negatively correlated with streamflow in the Northwest region. The cooling SST phase was linked with decreasing pressure zone (Z-1). Similar to the previous 4-month lead-time case, a smaller number of significant regions of specific humidity and U-wind were observed in the 1-month lead-time case (Figure 5c,d). The overall connection was increase of streamflow with decreasing SST in the Atlantic Ocean.
Several studies have shown the direct influence of climate variability of western Pacific on the hydrologic responses of the Northwest [,,]. It is commonly observed in the Northwest that the cooling phase of ENSO causes increased snowfall. The Asian/Pacific jet stream carries moisture during winter, and wind flow toward the northwestern region is associated with increased snowfall, leading to increased snowfall []. Redmond and Koch [] also observed increased precipitation in the Northwest region when SST in the ENSO-like region was below average. The SCF and NSC values were also significantly higher for the Northwest and the Southwest regions as compared to other regions, which indicated that SST variability and consequent streamflow response was direct in those regions. The influence of the Atlantic Ocean was found to be limited to streamflow variability in the Northwest region.
4.1.5. Southeast
The Pacific SST and Z500 showed limited correlation with Southeast streamflow. Figure 6a indicates that four different pockets of significant regions were identified in the eastern and mid-Pacific Ocean. The increased SST was associated with the majority of increased pressure zones. Significant regions of the specific humidity also exhibited a similar positive correlation with the streamflow. However, the maximum number of negatively correlated wind stress regions was observed throughout the Pacific Ocean. The negatively correlated wind stress might have caused a decrease in streamflow in the Southeast region. The spatial extent of U500 zones also had a wider spatial extent compared to the regions of other climate parameters. Figure 6b shows that the SST significant regions had shifted to different locations; one region of which (SST-2) showed similarity to ENSO. The ENSO-like region had the same signal with the streamflow stations, implying a positive correlation between Southeast streamflow and Pacific equatorial SST region.
Only three Atlantic SST significant regions were identified for the 4-month lead-time case. For the 1-month case, all the climate variables showed some correlation with the streamflow, even though the number and size of the significant zones were very limited. For both cases, the correlation pattern was similar, as the Atlantic variables showed a negative correlation with the Southeast streamflow.
Similar to the Northeast region, the Southeast streamflow was more correlated with the U-wind and specific humidity to the SST of the Pacific Ocean. A limited number of significant regions of SST and Z500 were identified for the Southeast. Only the northern Pacific region showed teleconnection with streamflow variability, similar to the observation of Wang and Ting []. The region bounded in between 150° E to 160° W longitude and 24° N to 34° N latitude is known as the Hondo region []. This region is related to the East Asian Jet Stream, which causes increased precipitation in the western United States []. A small region was also identified within the Hondo region that was negatively correlated with the Southeast streamflow. Different pressure gradients which drive the circulation were the primary factors affecting streamflow variability in the region.
4.1.6. Southwest
It can be noted that the SCF value was significantly higher for the Southwest region compared to other SVD regions. From Figure 7a, it can be seen that the SST-2 region was similar to the ENSO region. The SST-1 region was similar to the Hondo region, as identified by previous researchers [,]. This particular region, which had been found to influence the hydrology of western U.S. regions, provided important streamflow predicting ability. The heterogeneous correlation map showed that the increase of SST was related to the decrease of pressure in the western U.S. seen in Z-2 region. However, the magnitude of specific humidity and U-wind also increased. These connections influenced the increase in the streamflow in the Southwest region. The SST, U500, and SH500 were positively correlated, while Z500 were negatively correlated with the Southwest streamflow. The SCF and NSC values were slightly greater for the 1-month lead-time compared to the 4-month lead-time period. SST regions for this case were also found to be identical when compared to the longer lead-time case, even though the sign was reversed (Figure 7b). Compared to the 4-month lead-time case, the 1-month lead-time case explained slightly higher streamflow variability because SCF/NSC values were higher and the spatial extents of the significant regions were also greater.
A smaller number of significantly correlated regions of climate variables was obtained for the Atlantic Ocean. The SST-2 region was the dominant teleconnected region, showing a negative correlation with streamflow variability, and was linked to Z-1 region, which also showed the same sign (Figure 7c). It can be noted that the cooling of Atlantic SST favored higher streamflow in the region, unlike the cooling of Pacific SST, which was shown to favor lower streamflow in the Southwest region. As the lead-time decreased, a greater number of significantly correlated regions was identified. Furthermore, the spatial extent of these regions was larger than those of the longer lead-time case. From Figure 7d, it can be seen that three SST regions were positively correlated with streamflow in California, while being negatively correlated with streamflow in New Mexico.
Streamflow variability in the Southwest region was highly correlated with SST of the ENSO region. The warmer phase of SST was accompanied by an increase in humidity and U-wind in the west Pacific region, with increased streamflow throughout the region. The polar jet stream carrying moisture towards the southwestern U.S. is probably intercepted by high mountains, and increased precipitation is observed in the Southwest by an orographic process, leading to increased streamflow []. The direct influence of Pacific anomalies on the streamflow of the Southwest was possibly due to the close proximity of the region to ocean-atmospheric activities. Previous researchers have shown consistent results in which the El Nino phase brings increased precipitation over the southwest region [,]. Increase in SST led to increased surface atmospheric pressure and strong wind, leading to increased precipitation. However, Atlantic variables showed minimal effects in explaining the streamflow variability of the Southwest.
4.2. CWT Analysis
The variability of data explained by the CWTs of ENSO, PDO, and AMO are presented in Figure 8. Figure 9 contains the CWTs of each of the regional streamflow patterns, where the FPC obtained from the PCA represents the regional streamflow. The results revealed the inherent nature of variance and periodicity across multiple timescale bands over the study period in each of the indices and among the regional streamflow patterns. The association between the regional streamflow and the ENSO, PDO, and AMO indices obtained through the WTC of the involved CWTs are provided in Figure 10, Figure 11 and Figure 12, respectively. The wavelet coherency, scaled from 0 to 1, a measure of correlation, was calculated based on Torrence and Webster []. The cone of influence (COI), shown by the conical shades in the Figures, delineates the region of reliability. Outside the COI, the edge effects can be significant and thus cannot be ignored since wavelets are not completely localized in time. Hence, the results within the COI are more reliable than the results outside the COI. The effects of COI are prominent in the global wavelet spectrums of ENSO (Figure 8a) and the Northeast region (Figure 9b), as in both these instances, the significant regions outside or near the COI are found to exceed the 95% confidence line (red dashed line). More details of COI can be found in Grinsted et al. [].
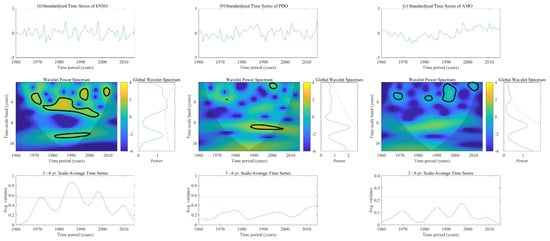
Figure 8.
Continuous wavelet transforms (CWT) along with the global wavelet spectrum and the 3- to 6-year scale average time series of (a) ENSO; (b) PDO, and (c) AMO. Warmer (yellow) color represents higher variance in data. Zones with significant variance against 5% red noise are delineated by black contour lines.
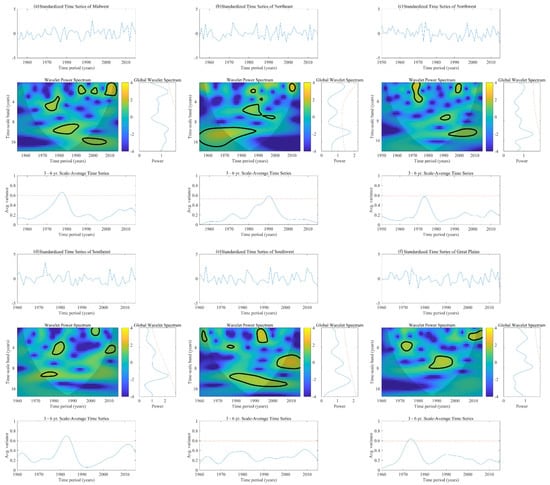
Figure 9.
Continuous wavelet transforms (CWT) along with the global wavelet spectrum and the 3- to 6-year scale average time series of (a) Midwest; (b) Northeast; (c) Northwest; (d) Southeast; (e) Southwest; and (f) Great Plains streamflow. Warmer (yellow) color represents higher variance in data. Zones with significant variance against 5% red noise are delineated by black contour lines.
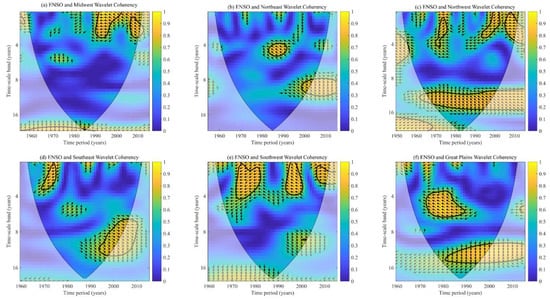
Figure 10.
Wavelet coherency (WTC) spectrums between ENSO and the regional streamflow of (a) Midwest; (b) Northeast; (c) Northwest; (d) Southeast; (e) Southwest; and (f) Great Plains. Warmer (yellow) color represents the higher correlation between the two time series. The arrows indicate the relative phase relationship within the significant zones of higher correlation.
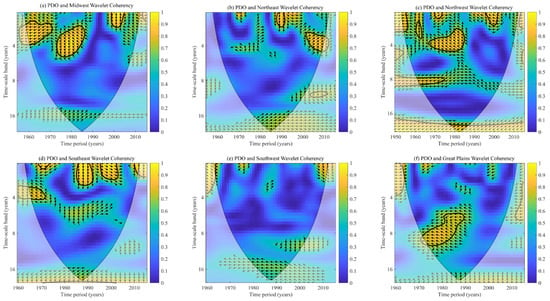
Figure 11.
Wavelet coherency (WTC) spectrums between PDO and the regional streamflow of (a) Midwest; (b) Northeast; (c) Northwest; (d) Southeast; (e) Southwest; and (f) Great Plains. Warmer (yellow) color represents a higher correlation between the two time series. The arrows indicate the relative phase relationship within the significant zones of higher correlation.
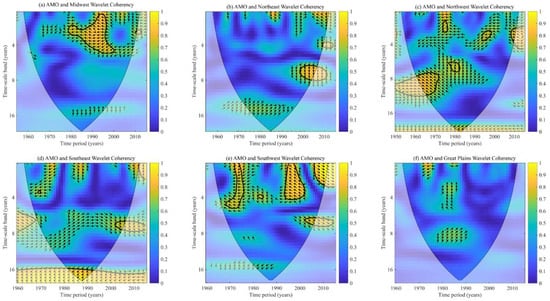
Figure 12.
Wavelet coherency (WTC) spectrums between AMO and the regional streamflow of (a) Midwest; (b) Northeast; (c) Northwest; (d) Southeast; (e) Southwest; and (f) Great Plains. Warmer (yellow) color represents a higher correlation between the two time series. The arrows indicate the relative phase relationship within the significant zones of higher correlation.
4.2.1. Correlation between ENSO and Regional Streamflow
Figure 10a shows the WTC between ENSO and the Midwest streamflow, which illustrates that these two time series were highly correlated beyond the 16-year band from 1955 to 1990 and below the 4-year band from 1990 to 2015. The majority of arrows indicated an anti-phase relationship between ENSO and the Midwest streamflow by pointing to the left. A tendency of arrows pointing upwards was also noticeable, especially at higher bands. Arrows pointing upwards indicate a lag of 90° (one-quarter of a cycle) between ENSO and the streamflow. The correlation between ENSO and the Northeast streamflow (Figure 10b) was found to be higher from 1995 to 2015 in the 8- to 12-year band and from 1980 to 1990 around the 4-year band. The arrows were observed to be pointing in the opposite directions in the two significant zones of higher correlation, which indicated that the relative phase relationship between ENSO and the Northeast streamflow were not uniform across the study period.
In comparison to any other regions, ENSO was found to be highly correlated with the Northwest streamflow (Figure 10c). Zones of significant correlation were found from 1950 to 1970 beyond the 16-year band, from 1960 to 2015 in the 8- to 16-year band, and at multiple occasions around and below the 4-year band across the study period. The arrows were pointing towards the left showing an anti-phase relationship between ENSO and the Northwest streamflow. The WTC of ENSO and the Southeast streamflow (Figure 10d) showed higher correlation from 1990 to 2010 in the 6- to 16-year band and on a few occasions of short durations below the 4-year band. The arrows in significant zones were observed to be pointing in different directions even in the same zone of higher correlation, which suggests that the phase relationships of ENSO and the Southeast streamflow were not uniform across the study period.
ENSO was strongly correlated with the Southwest streamflow (Figure 10e) in the lower timescale bands, i.e., the bands below 4-year, from 1970 to 1980, from 1990 to 2000, and from 2005 to 2015. The arrows representing relative phase relationships were found to be pointing in different directions across the study period, indicating a non-uniform phase relationship between ENSO and the Southwest streamflow. ENSO and the Great Plains streamflow (Figure 10f) showed a strong correlation in the 8- to 16-year band from 1980 to 2015 and in the 4- to 8-year band from 1970 to 1990. Higher correlation in the lower timescale bands was observed in few cases. The arrows representing the relative phase relationship were not found to be uniform across the different timescale bands, though their directions were uniform within a significant zone.
4.2.2. Correlation between PDO and Regional Streamflow
The WTC between PDO and the Midwest streamflow (Figure 11a) showed higher correlation only around or below the 4-year band. The significant zones with higher correlation were found from 1955 to 1985, from 2000 to 2005, and from 2010 to 2015. The relative phase relationship before 1990 showed an anti-phase relationship between PDO and the Midwest streamflow. From 2000 and onwards, the Midwest streamflow lagged PDO by 90° (one-quarter of a cycle). PDO showed a higher correlation with the Northeast streamflow (Figure 11b) at intermittent intervals around and below the 4-year timescale, especially from 1990 to 2015. A higher correlation was also observed from 2000 to 2015 in the 10- to 12-year band. Bands beyond the 16-year timescale also showed higher correlation but were not statistically significant. The arrows did not show any uniform pattern across the study period. However, the arrows beyond the 16-year band were mostly pointing to the right showing an in-phase association of PDO with the Northeast streamflow.
PDO was strongly correlated with Northwest streamflow (Figure 11c) in comparison to other regions. Higher correlations were observed across multiple timescale bands at various time intervals. A continuous zone of significant correlation expanding throughout the study period (from 1950 to 2015) was observed beyond the 16-year band. A higher correlation was also observed around the 8-year timescale from 1950 to 1980 and at multiple occasions around and below the 4-year band. Higher correlations at lower timescales were more dominant before the 1980s. The relative phase relationship suggested an anti-phase relationship in most of the significant zones. PDO was more highly correlated with the Southeast streamflow (Figure 11d) at timescales below the 4-year band at multiple intervals, especially after 1985, and at a timescale beyond the 16-year band from 1970 to 2000. The arrows did not show any uniform pattern across the study period, as they were found to be pointing in different directions even within the same timescale band.
PDO did not show much correlation with the Southwest streamflow (Figure 11e) across the study period. Higher correlations were only observed from 1960 to 1965 and from 2005 to 2015 below the 4-year timescale. A lagged in-phase relationship between PDO and the Southwest streamflow in the significant zones of higher correlation was observed. PDO showed a higher correlation with the Great Plains streamflow (Figure 11f) below the 4-year timescale from 1960 to 1965, in the 6- to 10-year band from 1970 to 1990, and in the 3- to 7-year band from 2010 to 2015. The arrows were pointing to different directions across the timescale bands with significant zones with higher correlation, which indicated that the relative phase relationship between PDO and the Great Plains streamflow was not uniform for the analyzed duration. For all regions, bands around and beyond the 16-year timescale indicated higher correlation with PDO. However, the bands were not found to be statistically significant. Even though certain regions showed significant correlation beyond the 16-year band, e.g., the Northwest region, the wavelet spectra implied the presence of higher correlation even at higher bands (possibly in the 16- to 32-year band).
4.2.3. Correlation between AMO and Regional Streamflow
AMO showed a higher correlation with the Midwest streamflow from 1980 to 2000 and from 2010 to 2015 around and below the 4-year band (Figure 12a). No presence of higher correlation was observed in the higher timescales. An anti-phase relationship was found between AMO and the Midwest streamflow in the zones with a significant correlation. The WTC between AMO and the Northeast streamflow showed the presence of higher correlation from 2000 to 2015 in the 6- to 10-year band and below and around the 4-year band at intermittent intervals after the 1980s to 2015 (Figure 12b). The relative phase relationships were found to be pointing in opposite directions in the two major zones of significant correlation; however, the arrows within a significant zone uniform in direction.
A significant correlation between AMO and the Northwest streamflow were observed from 1950 to 1970 in the 8- to 12-year band and from 2010 to 2015 around and below the 4-year band (Figure 12c). There was also the presence of significant correlation at intermittent intervals of shorter durations from 1970 to 2010 in the 4- to 8-year band. Presence of high correlation was also observed beyond the 16-year band. An anti-phase relationship between AMO and the Northwest streamflow was observed mostly. Among the regions, AMO showed the highest correlation with the Southeast streamflow (Figure 12d). A significant correlation was identified throughout the period, i.e., from 1960 to 2015 beyond the 16-year band. A strong correlation was also observed from 1960 to 1970 and from 2000 to 2015 in the 6- to 8-year band and at multiple intervals of shorter duration below the 4-year band. A non-uniform phase relationship was observed in the significant zones across the study period; however, the arrows in each significant zone were found to be pointing in the same direction.
The WTC between AMO and the Southwest streamflow showed higher correlation only at the lower timescale bands, i.e., around and below the 4-year band and in the 6- to 8-year band. The intervals with higher correlation were from 1970 to 1980 and from 1990 to 2015. No presence of higher correlation was observed in the higher timescale band. The arrows indicating the relative phase relationships were found to be pointing in different directions in the various significant zones indicating a non-uniform phase relationship between AMO and the Southwest streamflow across the study period. AMO did not show much correlation with the Great Plains streamflow across the study period. Among the regions, the Great Plains was the only region that did not show any zone of significance across the study period. There were a few instances of slightly high correlation before the 1990s below and around the 4-year and 8-year band, but none of them were found to be significant.
5. Conclusions
The interconnections of climate variabilities and the regional streamflow of the continental US were analyzed in this study. SVD analyses were implemented on April–August streamflow of six NCA regions with September–November and December–February climate variabilities represented by SST, Z500, SH500, and U500 of the Pacific and the Atlantic Oceans. The WTC analyses of ENSO/PDO/AMO and the regional streamflow patterns revealed the most significant timescale bands that affected their variation over the study period. The key findings of the analyses are given below:
- The warming phase of SST in the ENSO-like region was found to be positively correlated with the majority of streamflow variability in the Great Plains, Midwest, and Southwest regions, while the warming phase of SST in the ENSO-like region showed a negative correlation with the Northwest streamflow.
- Both the Pacific and the Atlantic SST, Z500, and SH500 did not show any distinct influence on the streamflow variability of the Northeast and the Southeast regions.
- The Northwest streamflow was highly correlated with both ENSO and PDO while the Southeast streamflow showed the highest correlation with AMO among the regions.
The major contributions of the current research are as follows:
- All the possible teleconnections of the climate variables with conterminous U.S. streamflow were presented. The consistently teleconnected regions could be utilized in developing long lead-time streamflow forecasting in the regional level.
- SST, Z500, SH500, and U500 were utilized together to find the coupled relationship with streamflow. SH500 and U500 data have received little research attention in the previous studies.
- A comprehensive analysis using both SVD and wavelet approach helped in understanding the time-lagged relationship between U.S. streamflow and entire Pacific/Atlantic climate variables along with predefined indices.
The obtained results might be affected by several uncertainties involved in the process due to the complex nature of hydrological cycle driven by changing climate. Future work should focus more on the physical aspects of the hydrological cycle. In addition, future work should look into evaluating the association between streamflow and PDO at higher timescale bands, since PDO showed a decadal to multi-decadal oscillatory cycle in the 20th century []. Use of a longer period of data may provide a wider scope of association of predefined indices with streamflow in higher timescale bands.
Author Contributions
A.K. and S.A. designed the research idea and the results were prepared by S.B. and K.T. All the authors analyzed the results and wrote the paper together.
Funding
This research is funded by the Office of the Vice Chancellor for Research at Southern Illinois University Carbondale.
Acknowledgments
The authors would like to thank Office of the Vice Chancellor for Research at Southern Illinois University Carbondale for providing support for the current research. The authors would also like to thank the Reviewers and the Assistant Editor for providing valuable comments that helped in improving the overall quality of the manuscript.
Conflicts of Interest
The authors declare no conflict of interest.
Abbreviations
The following abbreviations are used in the manuscript:
| NCA | National Climate Assessment |
| SST | Sea Surface Temperature |
| Z500 | Geopotential Height at 500 mbar pressure |
| SH500 | Specific Humidity at 500 mbar pressure |
| U500 | East-West Zonal Wind at 500 mbar pressure |
References
- Mach, K.; Mastrandrea, M. Climate Change 2014: Impacts, Adaptation, and Vulnerability; Field, C.B., Barros, V.R., Eds.; Cambridge University Press: Cambridge, UK, 2014. [Google Scholar]
- Gleick, P.H. Climate change, hydrology, and water resources. Rev. Geophys. 1989, 27, 329–344. [Google Scholar] [CrossRef]
- Middelkoop, H.; Daamen, K.; Gellens, D.; Grabs, W.; Kwadijk, J.C.; Lang, H.; Wilke, K. Impact of climate change on hydrological regimes and water resources management in the Rhine basin. Clim. Chang. 2001, 49, 105–128. [Google Scholar] [CrossRef]
- Miles, E.L.; Snover, A.K.; Hamlet, A.F.; Callahan, B.; Fluharty, D. Pacific Northwest regional assessment: The impacts of climate variability and climate change on the water resources of the Columbia River Basin. J. Am. Water Resour. Assoc. 2000, 36, 399–420. [Google Scholar] [CrossRef]
- Tamaddun, K.A.; Kalra, A.; Ahmad, S. Wavelet analyses of western US streamflow with ENSO and PDO. J. Water Clim. Chang. 2017, 8, 26–39. [Google Scholar] [CrossRef]
- Redmond, K.T.; Koch, R.W. Surface climate and streamflow variability in the western United States and their relationship to large-scale circulation indices. Water Resour. Res. 1991, 27, 2381–2399. [Google Scholar] [CrossRef]
- Cayan, D.R.; Webb, R.H. El Niño/southern oscillation and streamflow in the western United States. In El Niño, Historical and Paleoclimatic Aspects of the Southern Oscillation; Diaz, H.F., Markgraf, V., Eds.; Cambridge University Press: Cambridge, UK, 1992. [Google Scholar]
- Dettinger, M.D.; Diaz, H.F. Global characteristics of stream flow seasonality and variability. J. Hydrometeorol. 2000, 1, 289–310. [Google Scholar] [CrossRef]
- Wallace, J.M.; Gutzler, D.S. Teleconnections in the geopotential height field during the Northern Hemisphere winter. Mon. Weather. Rev. 1981, 109, 784–812. [Google Scholar] [CrossRef]
- Kahya, E.; Dracup, J.A. US streamflow patterns in relation to the El Niño/Southern Oscillation. Water Resour. Res. 1993, 29, 2491–2503. [Google Scholar] [CrossRef]
- Barlow, M.; Nigam, S.; Berbery, E.H. ENSO, Pacific decadal variability, and US summertime precipitation, drought, and stream flow. J. Clim. 2001, 14, 2105–2128. [Google Scholar] [CrossRef]
- Webster, P.J.; Magana, V.O.; Palmer, T.N.; Shukla, J.; Tomas, R.A.; Yanai, M.U.; Yasunari, T. Monsoons: Processes, predictability, and the prospects for prediction. J. Geophys. Res. Oceans 1998, 103, 14451–14510. [Google Scholar] [CrossRef]
- Ward, P.J.; Beets, W.; Bouwer, L.M.; Aerts, J.C.; Renssen, H. Sensitivity of river discharge to ENSO. Geophys. Res. Lett. 2010, 37. [Google Scholar] [CrossRef]
- Ropelewski, C.F.; Halpert, M.S. Global and regional scale precipitation patterns associated with the El Niño/Southern Oscillation. Mon. Weather Rev. 1987, 115, 1606–1626. [Google Scholar] [CrossRef]
- Trenberth, K.E.; Fasullo, J. Water and energy budgets of hurricanes and implications for climate change. J. Geophys. Res. Atmospheres, 2007, 112. [Google Scholar] [CrossRef]
- Enfield, D.B.; Mestas-Nuñez, A.M.; Trimble, P.J. The Atlantic multidecadal oscillation and its relation to rainfall and river flows in the continental US. Geophys. Res. Lett. 2001, 28, 2077–2080. [Google Scholar] [CrossRef]
- McCabe, G.J.; Palecki, M.A.; Betancourt, J.L. Pacific and Atlantic Ocean influences on multidecadal drought frequency in the United States. Proc. Natl. Acad. Sci. USA 2004, 101, 4136–4141. [Google Scholar] [CrossRef] [PubMed]
- Grantz, K.; Rajagopalan, B.; Clark, M.; Zagona, E. A technique for incorporating large-scale climate information in basin-scale ensemble streamflow forecasts. Water Resour. Res. 2005, 41. [Google Scholar] [CrossRef]
- Tootle, G.A.; Piechota, T.C. Relationships between Pacific and Atlantic ocean sea surface temperatures and US streamflow variability. Water Resour. Res. 2006, 42. [Google Scholar] [CrossRef]
- Pascolini-Campbell, M.; Seager, R.; Pinson, A.; Cook, B.I. Covariability of climate and streamflow in the Upper Rio Grande from interannual to interdecadal timescales. J. Hydrol. Reg. Stud. 2017, 13, 58–71. [Google Scholar] [CrossRef]
- Corte-Real, J.; Zhang, X.; Wang, X. Large-scale circulation regimes and surface climatic anomalies over the Mediterranean. Int. J. Climatol. 1995, 15, 1135–1150. [Google Scholar] [CrossRef]
- Pathak, P.; Kalra, A.; Lamb, K.W.; Miller, W.P.; Ahmad, S.; Amerineni, R.; Ponugoti, D.P. Climatic variability of the Pacific and Atlantic Oceans and western US snowpack. Int. J. Climatol. 2018, 38, 1257–1269. [Google Scholar] [CrossRef]
- Bretherton, C.S.; Smith, C.; Wallace, J.M. An intercomparison of methods for finding coupled patterns in climate data. J. Clim. 1992, 5, 541–560. [Google Scholar] [CrossRef]
- Praus, P. Water quality assessment using SVD-based principal component analysis of hydrological data. Water SA 2005, 31, 417–422. [Google Scholar] [CrossRef]
- Wallace, J.M.; Smith, C.; Bretherton, C.S. Singular value decomposition of wintertime sea surface temperature and 500-mb height anomalies. J. Clim. 1992, 5, 561–576. [Google Scholar] [CrossRef]
- Abdi, H. Singular value decomposition (SVD) and generalized singular value decomposition. In Encyclopedia of Measurement and Statistics; Salkind, N.J., Ed.; Sage: Thousand Oaks, CA, USA, 2007. [Google Scholar]
- Oubeidillah, A.A.; Tootle, G.A.; Moser, C.; Piechota, T.; Lamb, K. Upper Colorado River and Great Basin streamflow and snowpack forecasting using Pacific oceanic–atmospheric variability. J. Hydrol. 2011, 410, 169–177. [Google Scholar] [CrossRef]
- Sagarika, S.; Kalra, A.; Ahmad, S. Interconnections between oceanic–atmospheric indices and variability in the US streamflow. J. Hydrol. 2015, 525, 724–736. [Google Scholar] [CrossRef]
- Shams, M.S.; Anwar, A.F.; Lamb, K.W.; Bari, M. Relating ocean-atmospheric climate indices with Australian river streamflow. J. Hydrol. 2018, 556, 294–309. [Google Scholar] [CrossRef]
- Sang, Y.F. A review on the applications of wavelet transform in hydrology time series analysis. Atmos. Res. 2013, 122, 8–15. [Google Scholar] [CrossRef]
- Lau, K.M.; Weng, H. Climate signal detection using wavelet transform: How to make a time series sing. Bull. Am. Meteorol. Soc. 1995, 76, 2391–2402. [Google Scholar] [CrossRef]
- Tamaddun, K.A.; Kalra, A.; Bernardez, M.; Ahmad, S. Multi-scale correlation between the western US snow water equivalent and ENSO/PDO using wavelet analyses. Water Resour. Manag. 2017, 31, 2745–2759. [Google Scholar] [CrossRef]
- Coulibaly, P.; Baldwin, C.K. Nonstationary hydrological time series forecasting using nonlinear dynamic methods. J. Hydrol. 2005, 307, 164–174. [Google Scholar] [CrossRef]
- Labat, D. Cross wavelet analyses of annual continental freshwater discharge and selected climate indices. J. Hydrol. 2010, 385, 269–278. [Google Scholar] [CrossRef]
- Lins, H.F. USGS Hydro-Climatic Data Network 2009 (HCDN-2009): U.S. Geological Survey Fact Sheet 2012-3047; U.S. Geological Survey: Reston, VA, USA, 2012.
- Smith, T.M.; Reynolds, R.W.; Peterson, T.C.; Lawrimore, J. Improvements to NOAA’s historical merged land—Ocean surface temperature analysis (1880–2006). J. Clim. 2008, 21, 2283–2296. [Google Scholar] [CrossRef]
- Kalnay, E.; Kanamitsu, M.; Kistler, R.; Collins, W.; Deaven, D.; Gandin, L.; Iredell, M.; Saha, S.; White, G.; Woollen, J.; et al. The NCEP/NCAR 40-year reanalysis project. Bull. Am. Meteorol. Soc. 1996, 77, 437–471. [Google Scholar] [CrossRef]
- Torrence, C.; Compo, G.P. A practical guide to wavelet analysis. Bull. Am. Meteorol. Soc. 1998, 79, 61–78. [Google Scholar] [CrossRef]
- Torrence, C.; Webster, P.J. Interdecadal changes in the ENSO–monsoon system. J. Clim. 1999, 12, 2679–2690. [Google Scholar] [CrossRef]
- Labat, D. Recent advances in wavelet analyses: Part 1. A review of concepts. J. Hydrol. 2005, 314, 275–288. [Google Scholar] [CrossRef]
- Liu, Y.; Liang, S.X.; Weisberg, R.H. Rectification of the bias in the wavelet power spectrum. J. Atmos. Ocean. Tech. 2007, 24, 2093–2102. [Google Scholar] [CrossRef]
- Foufoula-Georgiou, E.; Kumar, P.; Mukerji, T.; Mavko, G. Wavelets in geophysics. Pure Appl. Geophys. 1995, 145, 374–375. [Google Scholar]
- Percival, D.B.; Walden, A.T. Wavelet Methods for Time Series Analysis; Cambridge University Press: Cambridge, UK, 2006. [Google Scholar]
- Jevrejeva, S.; Moore, J.C.; Grinsted, A. Influence of the Arctic Oscillation and El Niño-Southern Oscillation (ENSO) on ice conditions in the Baltic Sea: The wavelet approach. J. Geophys. Res. Atmos. 2003, 108. [Google Scholar] [CrossRef]
- Grinsted, A.; Moore, J.C.; Jevrejeva, S. Application of the cross wavelet transform and wavelet coherence to geophysical time series. Nonlinear Process. Geophys. 2004, 11, 561–566. [Google Scholar] [CrossRef]
- Wallace, J.M.; Zhang, Y.; Lau, K.H. Structure and seasonality of interannual and interdecadal variability of the geopotential height and temperature fields in the Northern Hemisphere troposphere. J. Clim. 1993, 6, 2063–2082. [Google Scholar] [CrossRef]
- Alexander, M.A.; Bladé, I.; Newman, M.; Lanzante, J.R.; Lau, N.C.; Scott, J.D. The atmospheric bridge: The influence of ENSO teleconnections on air–sea interaction over the global oceans. J. Clim. 2002, 15, 2205–2231. [Google Scholar] [CrossRef]
- Rajagopalan, B.; Cook, E.; Lall, U.; Ray, B.K. Spatiotemporal variability of ENSO and SST teleconnections to summer drought over the United States during the twentieth century. J. Clim. 2000, 13, 4244–4255. [Google Scholar] [CrossRef]
- Dunnell, K.L.; Travers, S.E. Shifts in the flowering phenology of the northern Great Plains: Patterns over 100 years. Am. J. Bot. 2011, 98, 935–945. [Google Scholar] [CrossRef] [PubMed]
- Wang, H.; Ting, M. Covariabilities of winter US precipitation and Pacific sea surface temperatures. J. Clim. 2000, 13, 3711–3719. [Google Scholar] [CrossRef]
- Zhang, Y.; Wallace, J.M.; Battisti, D.S. ENSO-like interdecadal variability: 1900–93. J. Clim. 1997, 10, 1004–1020. [Google Scholar] [CrossRef]
- Chang, P.; Ji, L.; Li, H. A decadal climate variation in the tropical Atlantic Ocean from thermodynamic air-sea interactions. Nature 1997, 385, 516–518. [Google Scholar] [CrossRef]
- Aziz, O.A.; Tootle, G.A.; Gray, S.T.; Piechota, T.C. Identification of Pacific Ocean sea surface temperature influences of Upper Colorado River Basin snowpack. Water Resour. Res. 2010, 46. [Google Scholar] [CrossRef]
- Hunter, T.; Tootle, G.; Piechota, T. Oceanic-atmospheric variability and western US snowfall. Geophys. Res. Lett. 2006, 33. [Google Scholar] [CrossRef]
- Lamb, K.W.; Piechota, T.C.; Aziz, O.A.; Tootle, G.A. Basis for extending long-term streamflow forecasts in the Colorado River basin. J. Hydrol. Eng. 2010, 16, 1000–1008. [Google Scholar] [CrossRef]
- Sagarika, S.; Kalra, A.; Ahmad, S. Pacific Ocean SST and Z500 climate variability and western US seasonal streamflow. Int. J. Climatol. 2016, 36, 1515–1533. [Google Scholar] [CrossRef]
© 2018 by the authors. Licensee MDPI, Basel, Switzerland. This article is an open access article distributed under the terms and conditions of the Creative Commons Attribution (CC BY) license (http://creativecommons.org/licenses/by/4.0/).