Impact of Land Use Change on Flow and Sediment Yields in the Khokana Outlet of the Bagmati River, Kathmandu, Nepal

Abstract
:1. Introduction
2. Methodology
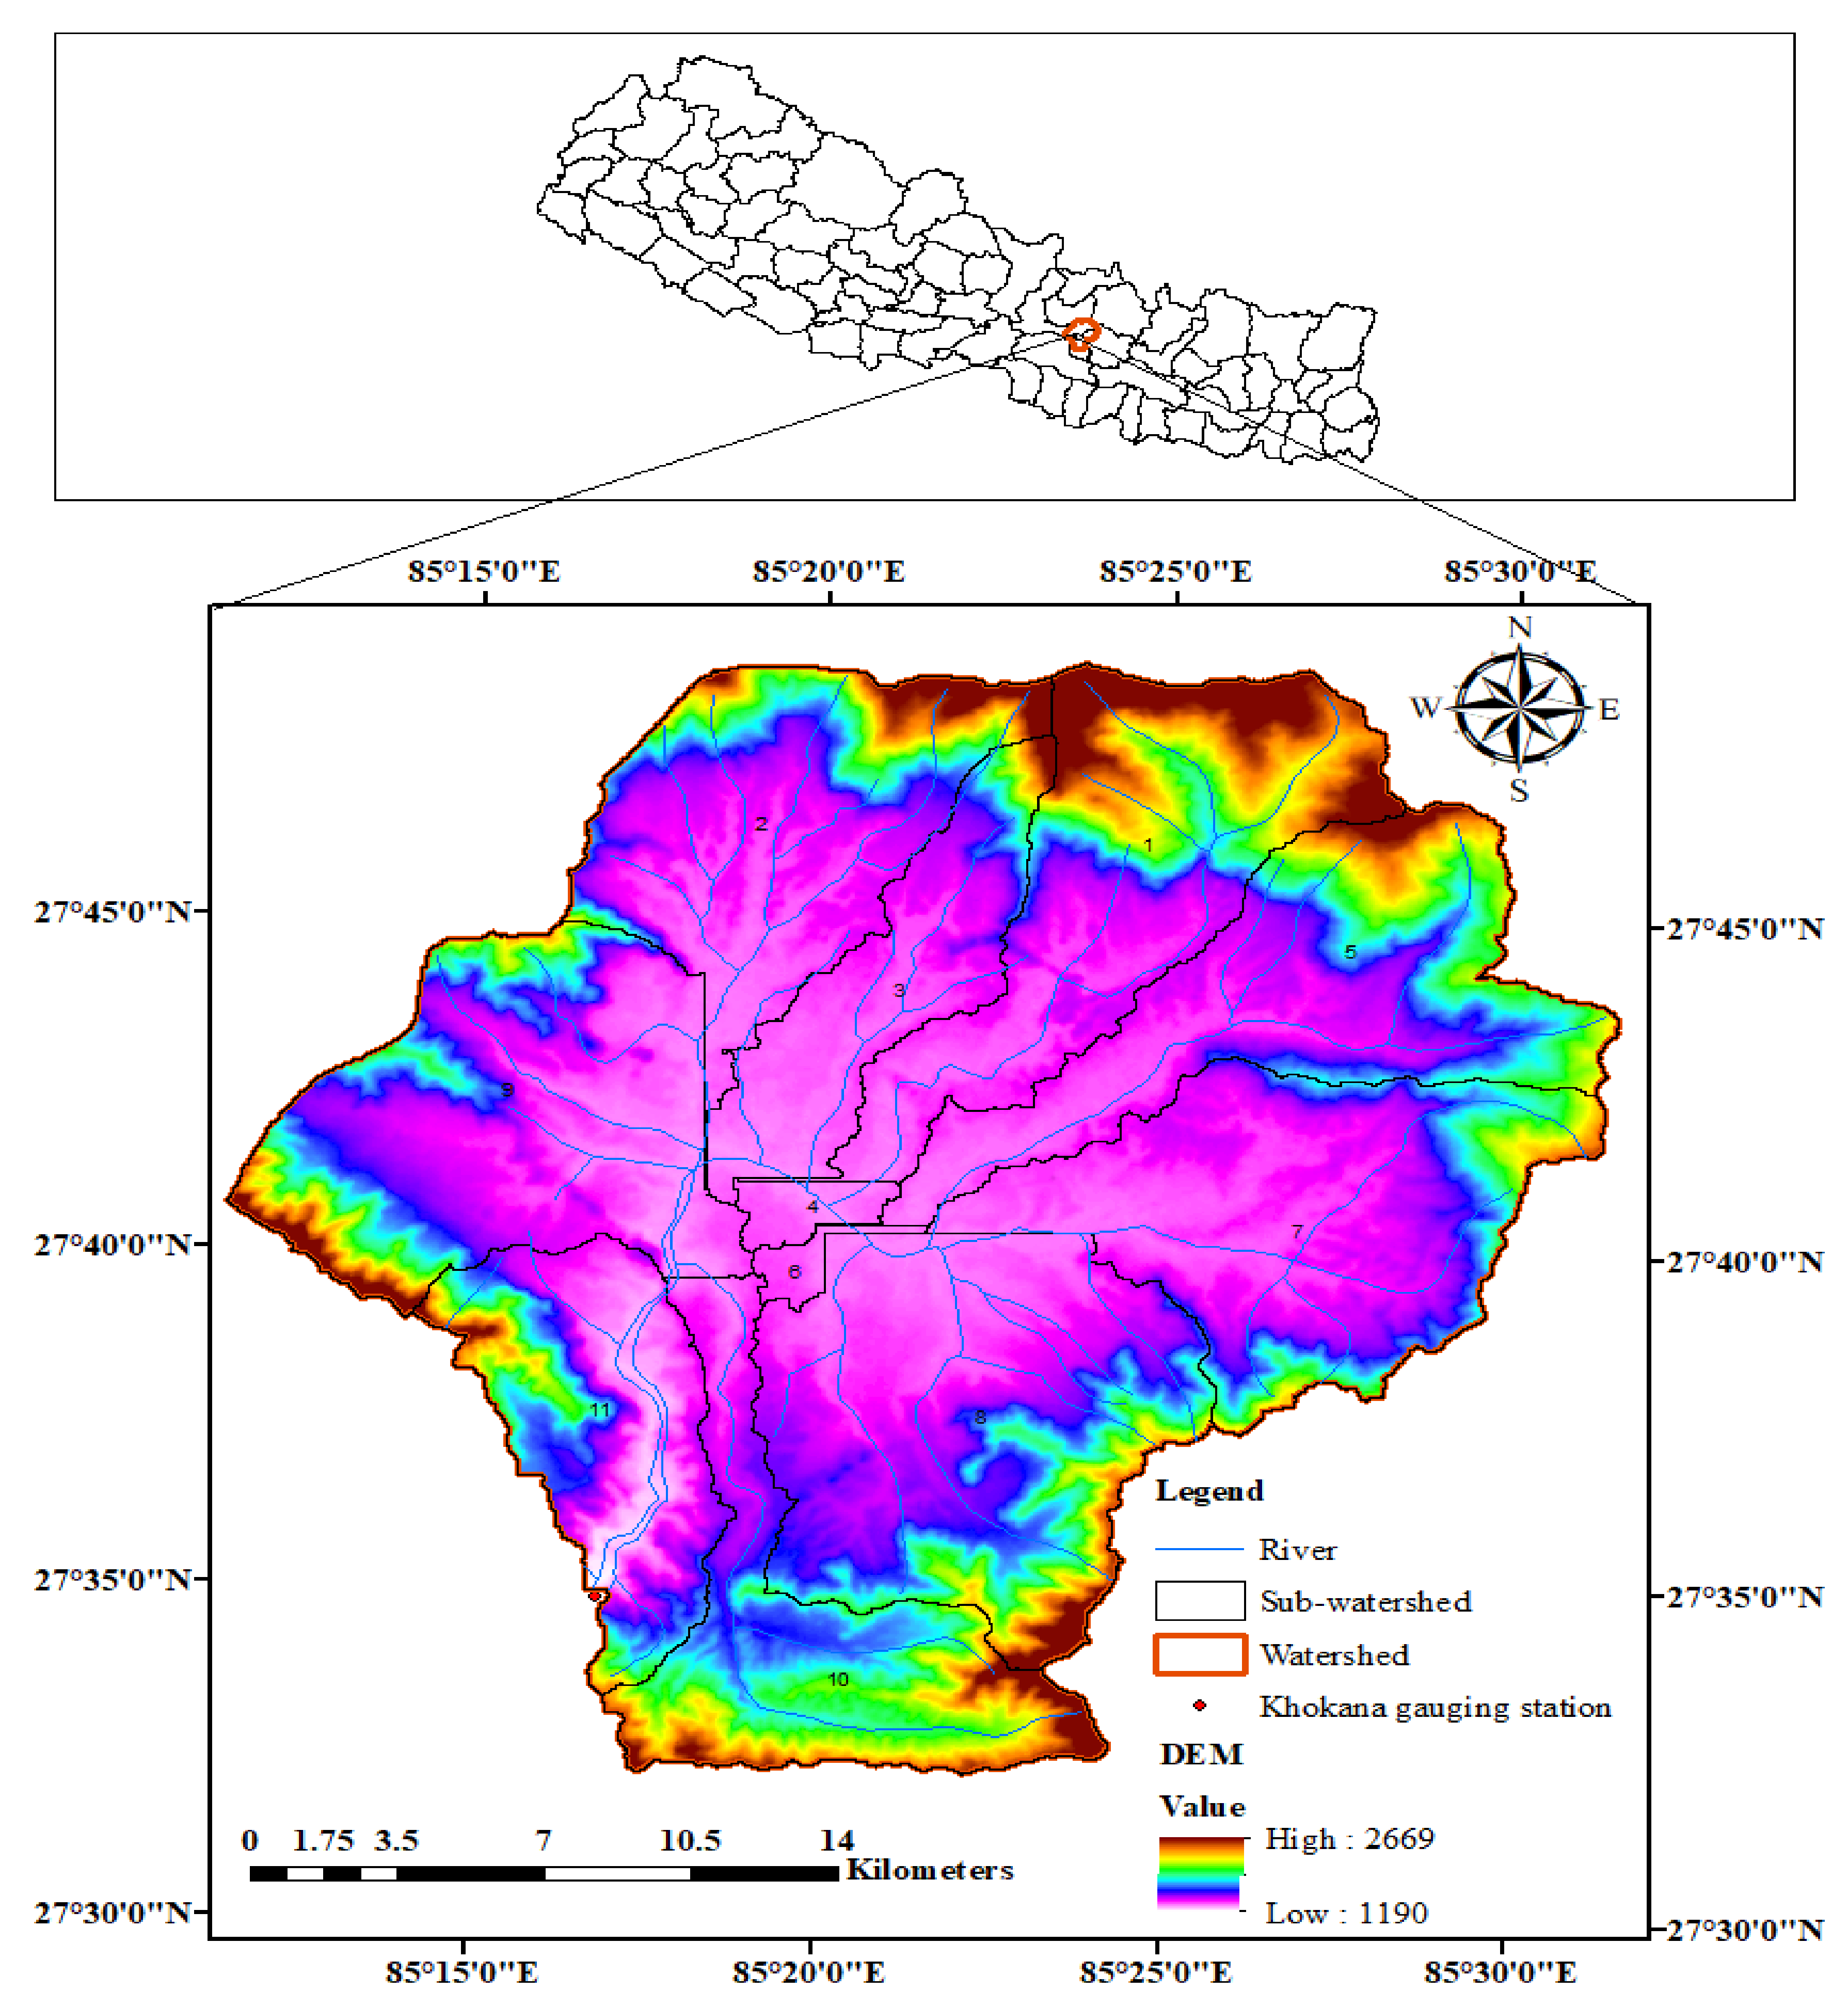
2.1. Study Area
2.2. SWAT Model
2.3. Model Setup
Data
2.4. Sensitivity Analysis
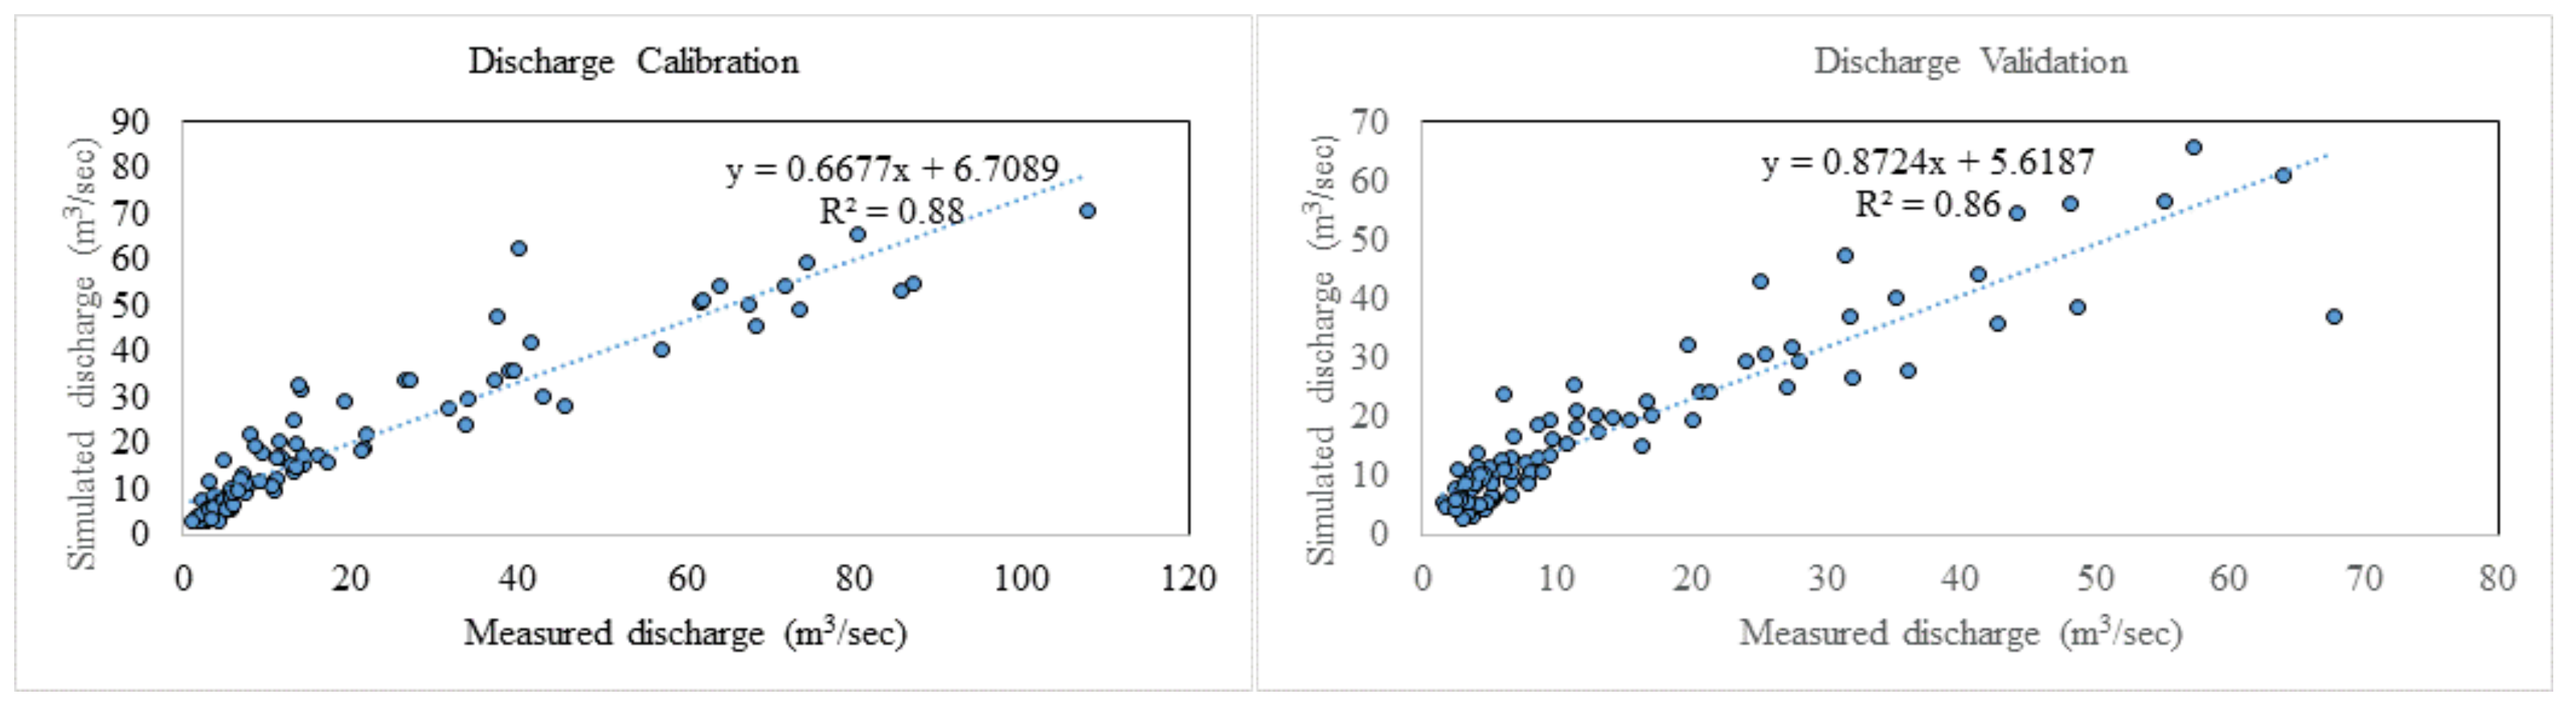
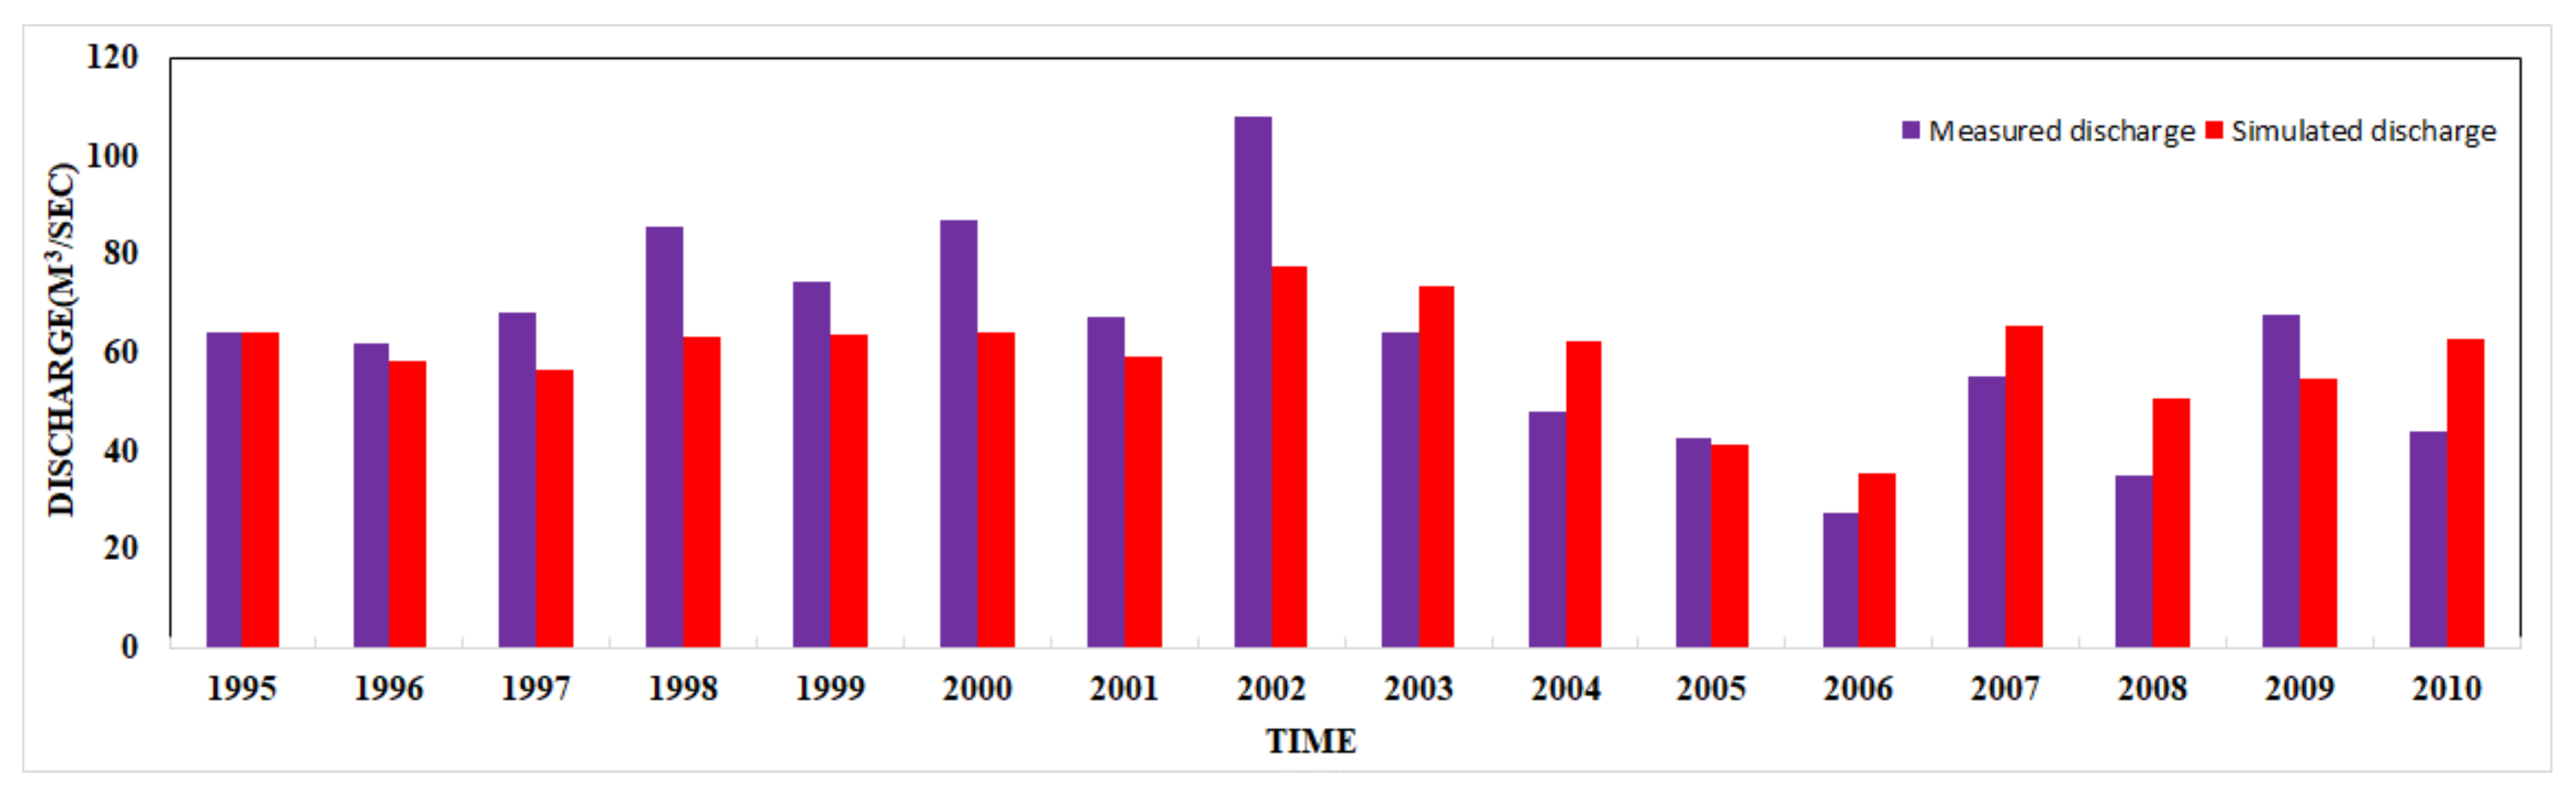
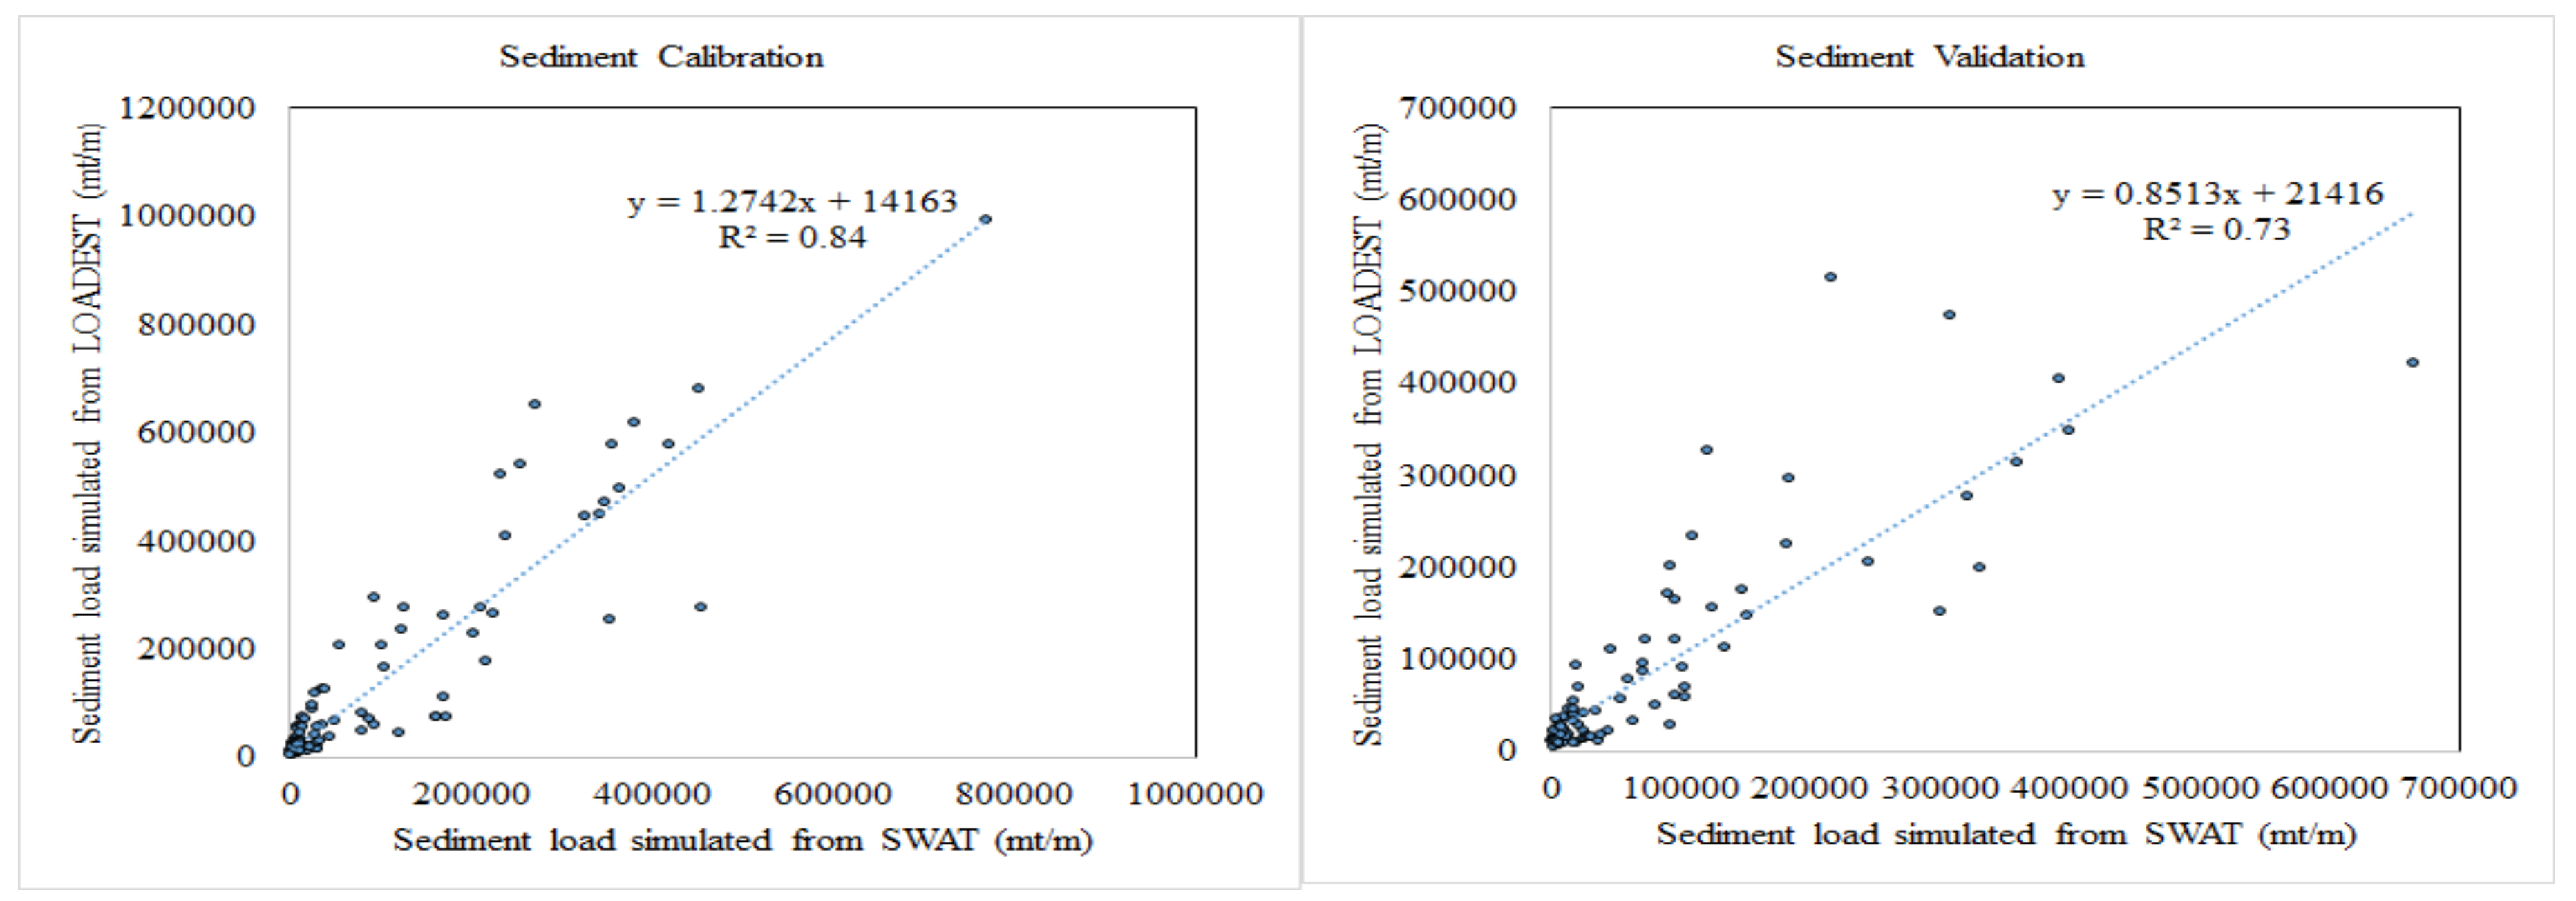
2.5. Model Calibration and Validation
3. Results and Discussion
4. Conclusions
Acknowledgments
Conflicts of Interest
References
- Ndulue, E.L.; Mbajiorgu, C.C.; Ugwu, S.N.; Ogwo, V.; Ogbu, K.N. Assessment of Land Use/cover Impacts on Runoff and Sediment Yield Using Hydrologic Models: A Review. J. Ecol. Nat. Environ. 2015, 7, 46–55. [Google Scholar] [CrossRef]
- Kashaigili, J.J. Impacts of land-use and land-cover changes on flow regimes of the Usangu Wetland and the Great Ruaha River, Tanzania. Phys. Chem. Earth Parts A/B/C 2008, 33, 640–647. [Google Scholar] [CrossRef]
- Tufa, D.F.; Abbulu, Y.; Srinivasarao, G.V.R. Watershed Hydrological Response to Changes in Land Use/Land Covers Patterns of River Basin: A Review. Int. J. Civ. Struct. Environ. Infrastruct. Eng. Res. Dev. 2014, 4, 157–170. [Google Scholar]
- Sahin, V.; Hall, M.J. The Effects of Afforestation and Deforestation on Water Yields. J. Hydrol. 1996, 178, 293–309. [Google Scholar] [CrossRef]
- Jokar Arsanjani, J.; Helbich, M.; Bakillah, M.; Hagenauer, J.; Zipf, A. Toward Mapping Land-Use Patterns from Volunteered Geographic Information. Int. J. Geogr. Inf. Sci. 2013, 27, 2264–2278. [Google Scholar] [CrossRef]
- Zhang, X.; Wenhong, C.; Qingchao, G.; Sihong, W. Effects of Landuse Change on Surface Runoff and Sediment Yield at Different Watershed Scales on the Loess Plateau. Int. J. Sediment Res. 2010, 25, 283–293. [Google Scholar] [CrossRef]
- Nearing, M.A.; Jetten, V.G.; Baffaut, C.; Cerdan, O.; Couturier, A.; Hernandez, M.; Le Bissonnais, Y.; Nichols, M.H.; Nunes, J.P.; Renschler, C.S.; et al. Modeling Response of Soil Erosion and Runoff to Changes in Precipitation and Cover. Catena 2005, 61, 131–154. [Google Scholar] [CrossRef]
- Setegn, S.G.; Srinivasan, R.; Dargahi, B. Hydrological Modelling in the Lake Tana Basin, Ethiopia Using SWAT Model. Open Hydrol. J. 2008, 2, 49–62. [Google Scholar] [CrossRef]
- Kirsch, K.; Kirsch, A.; Arnold, J.G. Predicting Sediment and Phosphorus Loads in the Rock River Basin Using SWAT. Forest 2002, 45, 1757–1769. [Google Scholar] [CrossRef]
- Spruill, C.A.; Workman, S.R.; Taraba, J.L. Simulation of Daily and Monthly Stream Discharge from Small Watersheds Using the SWAT Model. Trans. ASAE 2000, 43, 1431–1439. [Google Scholar] [CrossRef]
- Arnold, J.G.; Srinivasan, R.; Muttiah, R.S.; Williams, J.R. Large Area Hydrologic Modeling and Assessment Part II: Model Application. J. Am. Water Resour. Assoc. 1998, 34, 91–101. [Google Scholar] [CrossRef]
- Upadhyay, A.K.; Yoshida, H.; Rijal, H.B. Climate Responsive Building Design in the Kathmandu Valley. J. Asian Archit. Build. Eng. 2006, 5, 169–176. [Google Scholar] [CrossRef]
- Arnold, J.G.; Srinivasan, R.; Muttiah, R.S.; Williams, J.R. Large Area Hydrologic Modeling and Assessment Part I: Model Development. J. Am. Water Resour. Assoc. 1998, 34, 73–89. [Google Scholar] [CrossRef]
- Boughton, W.C. A Review of the USDA SCS Curve Number Method. Soil Res. 1989, 27, 511–523. [Google Scholar] [CrossRef]
- Zhang, H.; Huang, G.H.; Wang, D.; Zhang, X. Multi-Period Calibration of a Semi-Distributed Hydrological Model Based on Hydroclimatic Clustering. Adv. Water Resour. 2011, 34, 1292–1303. [Google Scholar] [CrossRef]
- Wu, K.; Xu, Y.J. Evaluation of the Applicability of the SWAT Model for Coastal Watersheds in Southeastern Louisiana. J. Am. Water Resour. Assoc. 2006, 42, 1247–1260. [Google Scholar] [CrossRef]
- Saleh, A.; Arnold, J.G.; Gassman, P.W.A.; Hauck, L.M.; Rosenthal, W.D.; Williams, J.R.; McFarland, A.M.S. Application of SWAT for the Upper North Bosque River Watershed. Trans. ASAE 2000, 43, 1077–1087. [Google Scholar] [CrossRef]
- Neitsch, S.L.; Arnold, J.G.; Kiniry, J.E.A.; Srinivasan, R.; Williams, J.R. Soil and Water Assessment Tool User’s Manual Version 2000; GSWRL Report 202(02-06); GSWRL: Temple, TX, USA, 2002. [Google Scholar]
- Rawls, W.J.; Brakensiek, D.L.; Saxtonn, K.E. Estimation of Soil Water Properties. Trans. ASAE 1982, 25, 1316–1320. [Google Scholar] [CrossRef]
- Chaplot, V. Impact of DEM Mesh Size and Soil Map Scale on SWAT Runoff, Sediment, and NO3–N Loads Predictions. J. Hydrol. 2005, 312, 207–222. [Google Scholar] [CrossRef]
- Smedema, L.K.; Rycroft, D.W. Land Drainage: Planning and Design of Agricultural Systems; Batsford Academic and Educational Ltd.: London, UK, 1983. [Google Scholar]
- Burba, G.G.; Verma, S.B. Seasonal and Interannual Variability in Evapotranspiration of Native Tallgrass Prairie and Cultivated Wheat Ecosystems. Agric. For. Meteorol. 2005, 135, 190–201. [Google Scholar] [CrossRef]
- Runkel, R.L.; Crawford, C.G.; Cohn, T.A. Load Estimator (LOADEST): A FORTRAN Program for Estimating Constituent Loads in Streams and Rivers; CreateSpace Independent Publishing Platform: New York, NY, USA, 2004. [Google Scholar]
- Arnold, J.G.; Moriasi, D.N.; Gassman, P.W.; Abbaspour, K.C.; White, M.J.; Srinivasan, R.; Santhi, C.; Harmel, R.D.; van Griensven, A.; van Liew, M.W.; et al. SWAT: Model Use, Calibration, and Validation. Trans. ASABE 2012, 55, 1491–1508. [Google Scholar] [CrossRef]
- Betrie, G.D.; Mohamed, Y.A.; van Griensven, A.; Srinivasan, R. Sediment Management Modelling in the Blue Nile Basin Using SWAT Model. Hydrol. Earth Syst. Sci. 2011, 15, 807–818. [Google Scholar] [CrossRef]
- Fukunaga, D.C.; Cecílio, R.A.; Zanetti, S.S.; Oliveira, L.T.; Caiado, M.A.C. Application of the SWAT Hydrologic Model to a Tropical Watershed at Brazil. Catena 2015, 125, 206–213. [Google Scholar] [CrossRef]
- Moriasi, D.N.; Arnold, J.G.; Van Liew, M.W.; Bingner, R.L.; Harmel, R.D.; Veith, T.L. Model Evaluation Guidelines for Systematic Quantification of Accuracy in Watershed Simulations. Trans. ASABE 2007, 50, 885–900. [Google Scholar] [CrossRef]
- Van Liew, M.W.; Arnold, J.G.; Garbrecht, J.D. Hydrologic Simulation on Agricultural Watersheds: Choosing between Two Models. Trans. ASAE 2003, 46, 1539–1551. [Google Scholar] [CrossRef]
- Santhi, C.; Arnold, J.G.; Williams, J.R.; Dugas, W.A.; Srinivasan, R.; Hauck, L.M. Validation of the Swat Model on a Large Rwer Basin with Point and Nonpoint Sources. J. Am. Water Resour. Assoc. 2011, 37, 1169–1188. [Google Scholar] [CrossRef]
- Singh, J.; Knapp, H.V.; Arnold, J.G.; Demissie, M. Hydrological Modeling of the Iroquois River Watershed Using HSPF and SWAT. J. Am. Water Resour. Assoc. 2005, 41, 343–360. [Google Scholar] [CrossRef]
- Vazquez-Amábile, G.G.; Engel, B.A. Use of SWAT to Compute Groundwater Table Depth and Streamflow in the Muscatatuck River Watershed. Trans. ASAE 2005, 48, 991–1003. [Google Scholar] [CrossRef]
- Gupta, H.V.; Sorooshian, S.; Yapo, P.O. Status of Automatic Calibration for Hydrologic Models: Comparison with Multilevel Expert Calibration. J. Hydrol. Eng. 1999, 4, 135–143. [Google Scholar] [CrossRef]
- Nie, W.; Yuan, Y.; Kepner, W.; Nash, M.S.; Jackson, M.; Erickson, C. Assessing Impacts of Landuse and Landcover Changes on Hydrology for the Upper San Pedro Watershed. J. Hydrol. 2011, 407, 105–114. [Google Scholar] [CrossRef]
- Tang, Z.; Engel, B.A.; Pijanowski, B.C.; Lim, K.J. Forecasting Land Use Change and Its Environmental Impact at a Watershed Scale. J. Environ. Manag. 2005, 76, 35–45. [Google Scholar] [CrossRef] [PubMed]
- Wolman, M.G. A Cycle of Sedimentation and Erosion in Urban River Channels. Geogr. Ann. Ser. A Phys. Geogr. 1967, 49, 385–395. [Google Scholar] [CrossRef]


| Land Use | ||||||
|---|---|---|---|---|---|---|
| 2000 | 2010 | Difference | ||||
| Area (km2) | % | Area (km2) | % | km2 | % | |
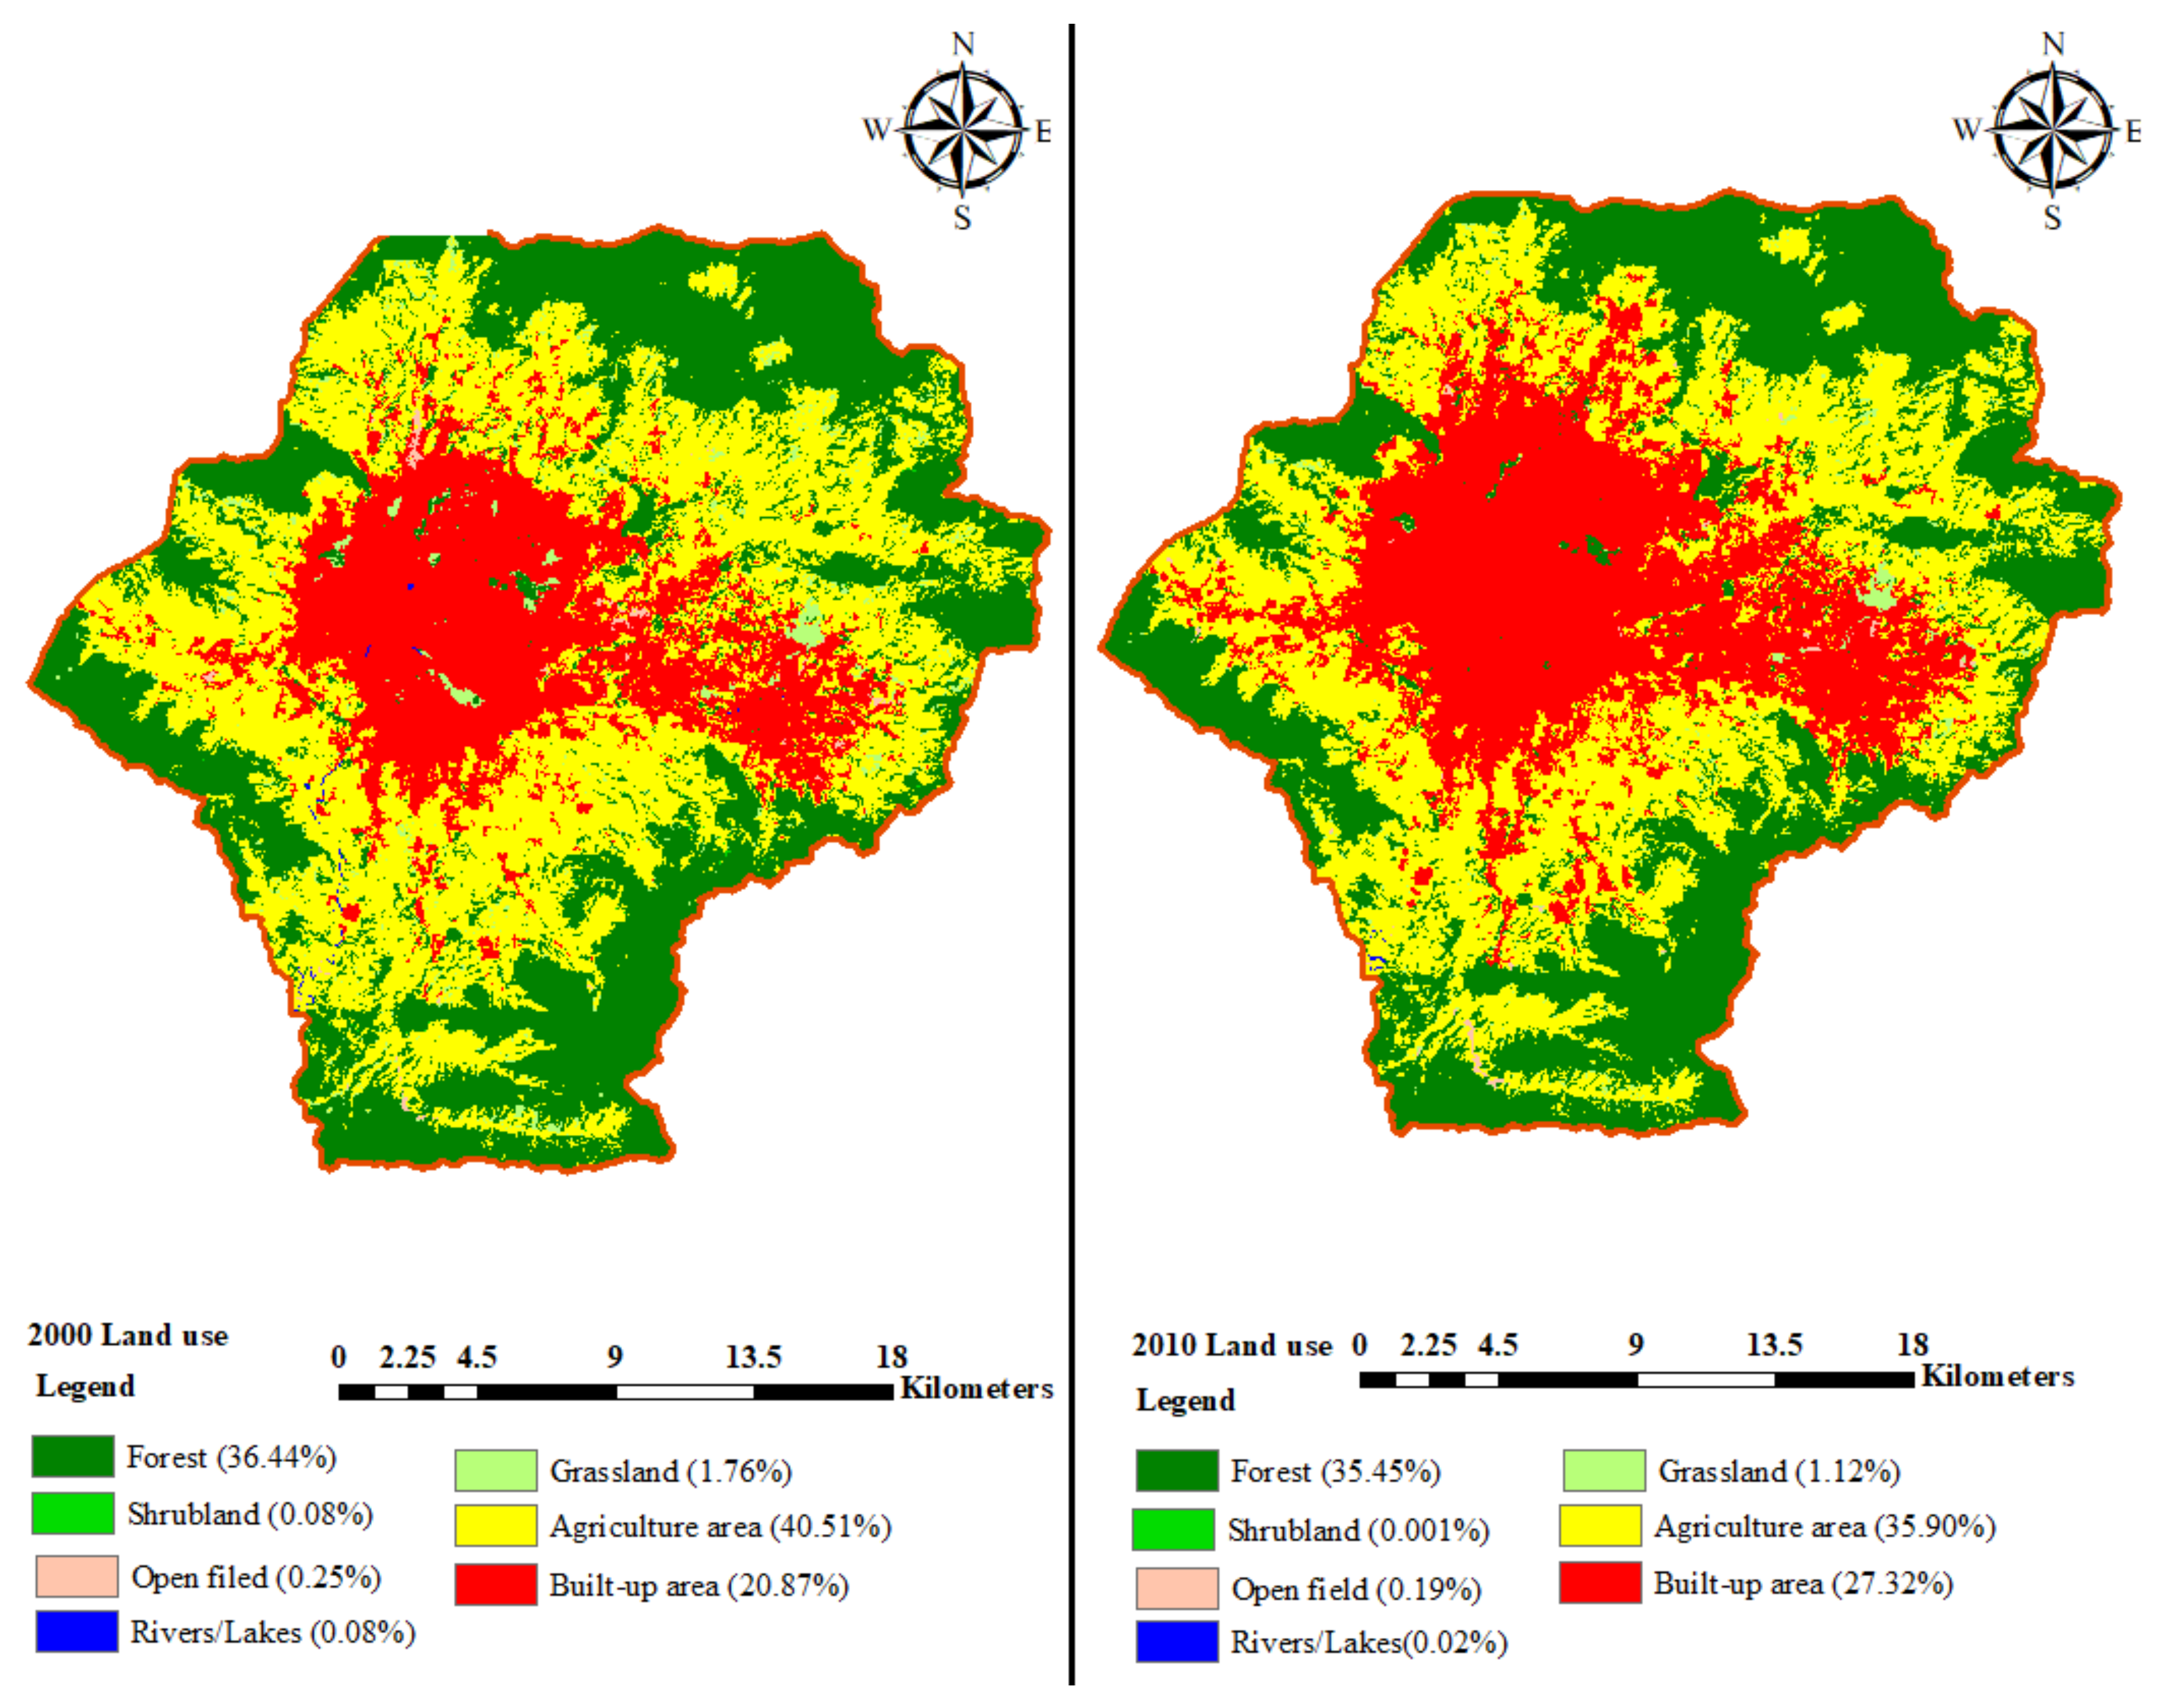
| Forest | 229.23 | 36.44 | 223.00 | 35.45 | −6.23 | −0.99 |
| Shrubland | 0.53 | 0.08 | 0.005 | 0.001 | −0.53 | −0.08 |
| Grassland | 11.08 | 1.76 | 7.02 | 1.12 | −4.06 | −0.65 |
| Agriculture | 254.85 | 40.51 | 225.83 | 35.90 | −29.03 | −4.61 |
| Open Field | 1.57 | 0.25 | 1.21 | 0.19 | −0.35 | −0.06 |
| Rivers/Lakes | 0.53 | 0.08 | 0.12 | 0.02 | −0.41 | −0.07 |
| Built-Up Areas | 131.26 | 20.87 | 171.88 | 27.32 | 40.62 | 6.46 |
| Total | 629.05 | 629.05 | ||||
| Data | Duration | Resolution | Source |
|---|---|---|---|
| Digital Elevation Model (DEM) | 30 m × 30 m | NASA | |
| Land use | 2000 and 2010 | ICIMOD | |
| Soil | 2000 | NASA | |
| Meteorological data of Kathmandu airport and Khumaltar | 1992–2010 | DHM | |
| Discharge data of Khokana gauging station | 1995–2010 | DHM | |
| Sediment data of Khokana gauging station | 2003–2006 | DHM |
| Calibration | |||||
|---|---|---|---|---|---|
| Parameters | Definition | Unit | Range of Values | Calibrated | Rank |
| SPCON(.bsn) | Linear parameter for calculating the maximum amount of sediment that can be reentrained during channel sediment rounting | 0.0001 to 0.01 | 0.01 | 1 | |
| EPCO(.hru) | Plant uptake compensation factor | 0.01 to 1 | 0.1 | 2 | |
| ESCO(.hru) | Soil evaporation compensation factor | 0.01 to 1 | 0.1 | 3 | |
| GW_REVAP(.gw) | Groundwater revap coefficient | 0.02 to 0.2 | 0.02 | 4 | |
| SPEXP(.bsn) | Exponent parameter for calculating sediment re-entrained in channel sediment routing | 1 to 2 | 0.72 | 5 | |
| REVAPMN(.gw) | Threshold depth of water in the shallow aquifer for “revap” or percolation to the deep aquifer | 0 to 500 | 100 | 6 | |
| SOIL_AWC(.sol) | Available soil water capacity | 0-0.12 | 0.02 | 7 | |
| SURLAG(.bsn) | Surface runoff lag coefficient | day | 1 to 12 | 5 | 8 |
| APHA_BF(.gw) | Baseflow alpha factor for recession constant | 0 to 1 | 0.048 | 9 | |
| RECHRG-DP(.gw) | Deep aquifer percolation fraction | 0 to 1 | 0.05 | 10 | |
| GW_DELAY(.gw) | Groundwater delay | day | 0 to 500 | 31 | 11 |
| CANMX(.hru) | Maximum canopy storage | 0 to 100 | 1 | 12 | |
| CH-N2(.mgt) | Manning’s roughness coefficient for the main channel | 0 to 0.1 | 0.1 | 13 | |
| GWQMN(.gw) | Threshold depth of water in the shallow aquifer for return flow | 0 to 5000 | 1000 | 14 | |
| CN2(.mgt) | SCS runoff curve number | 39 to 98 | ±10 | 15 | |
| CH-K2(.rte) | Effective hydraulic conductivity in the main channel | 0 to 150 | 2 | 16 | |
| CH-EROD(.rte) | Channel erodibility factor | 0 to 1 | 0.18 | 17 | |
| CH-COV(.rte) | Channel cover factor | 0 to 1 | 0.18 | 18 | |
| Stage of Model | Evaluated Statistics | |||
|---|---|---|---|---|
| R2 | NSE | RSR | PBIAS | |
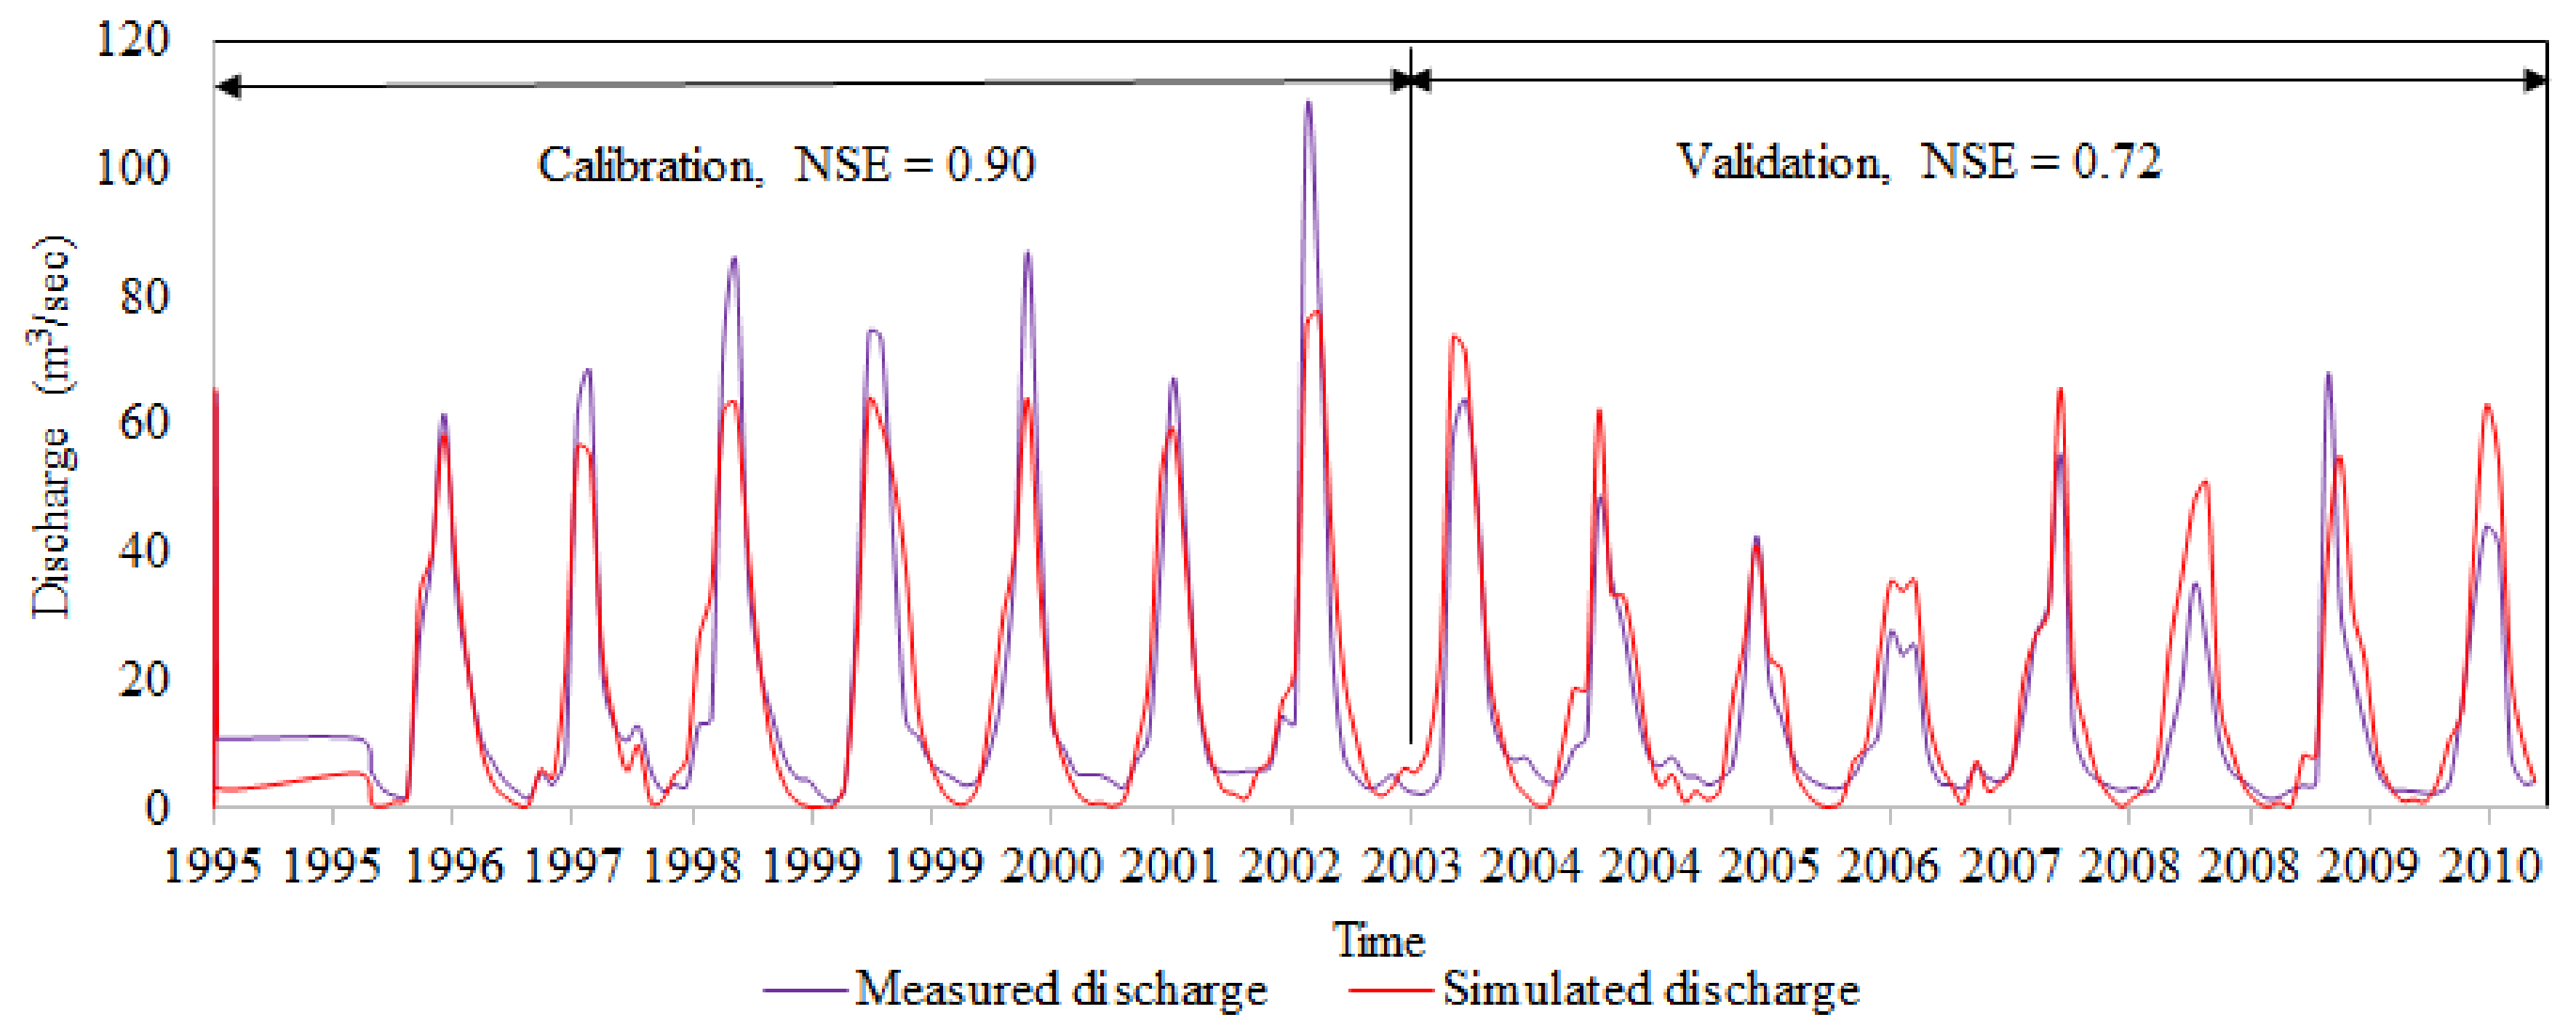
| Calibration (1995–2002) | 0.88 | 0.90 | 0.34 | 0.03 |
| Validation (2003–2010) | 0.86 | 0.72 | 0.53 | −0.25 |
| Stage of Model | Evaluated Parameters | |||
|---|---|---|---|---|
| R2 | NSE | RSR | PBIAS | |
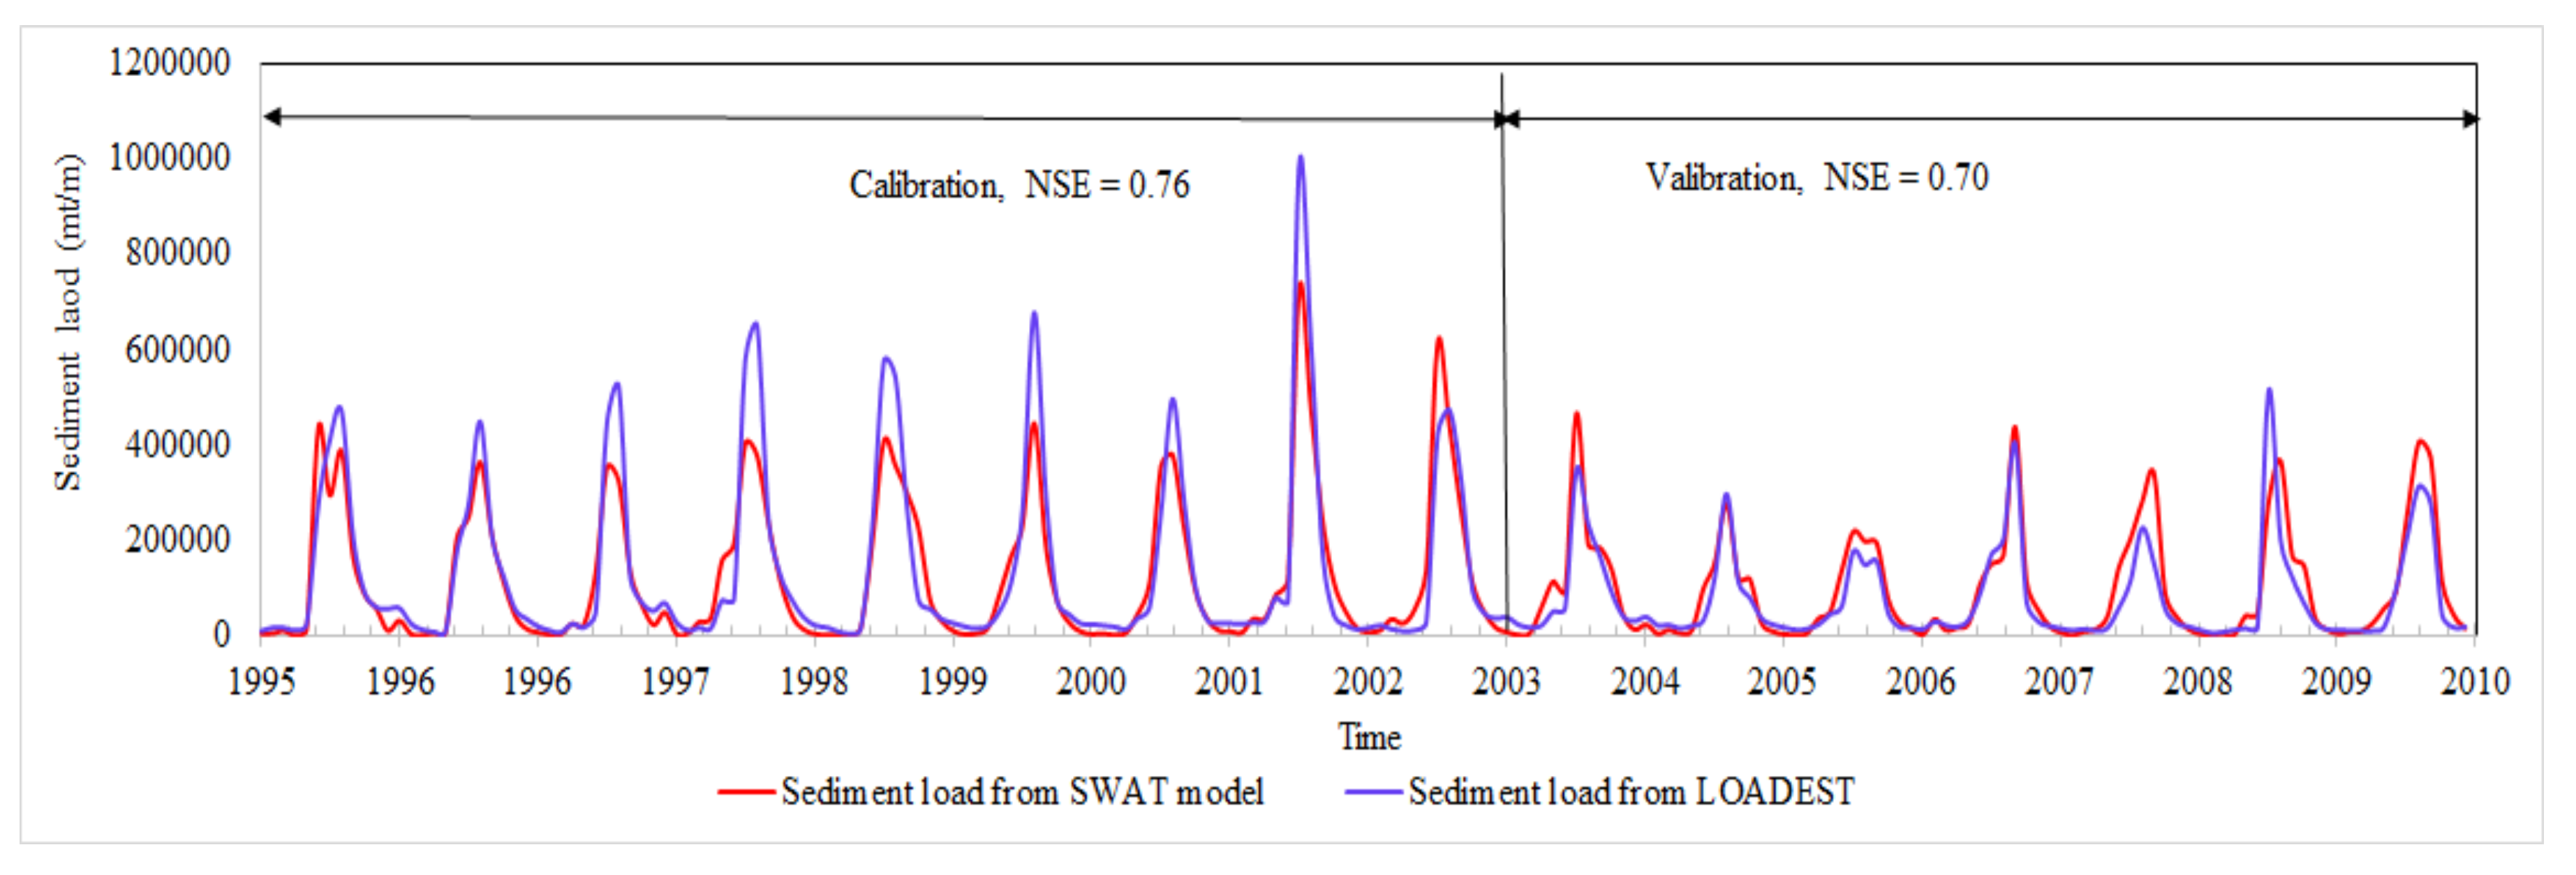
| Calibration (1995–2002) | 0.85 | 0.76 | 0.49 | 0.30 |
| Validation (2003–2010) | 0.73 | 0.70 | 0.55 | −0.21 |
| Component | Land Use | % Change | |
|---|---|---|---|
| 2000 | 2010 | ||
| Surface runoff contribution to stream flow SURQ (mm/year) | 171.99 | 219.17 | +27.43 |
| Lateral flow contribution to stream flow LATQ (mm/year) | 455.51 | 340.14 | −25.33 |
| Ground water contribution to stream flow (mm/year) | 390.66 | 309.09 | −20.88 |
| Sediment yield (mt/ha) | 2.99 | 3.15 | +5.41 |
© 2018 by the author. Licensee MDPI, Basel, Switzerland. This article is an open access article distributed under the terms and conditions of the Creative Commons Attribution (CC BY) license (http://creativecommons.org/licenses/by/4.0/).
Share and Cite
Pokhrel, B.K. Impact of Land Use Change on Flow and Sediment Yields in the Khokana Outlet of the Bagmati River, Kathmandu, Nepal. Hydrology 2018, 5, 22. https://doi.org/10.3390/hydrology5020022
Pokhrel BK. Impact of Land Use Change on Flow and Sediment Yields in the Khokana Outlet of the Bagmati River, Kathmandu, Nepal. Hydrology. 2018; 5(2):22. https://doi.org/10.3390/hydrology5020022
Chicago/Turabian StylePokhrel, Bijay K. 2018. "Impact of Land Use Change on Flow and Sediment Yields in the Khokana Outlet of the Bagmati River, Kathmandu, Nepal" Hydrology 5, no. 2: 22. https://doi.org/10.3390/hydrology5020022
APA StylePokhrel, B. K. (2018). Impact of Land Use Change on Flow and Sediment Yields in the Khokana Outlet of the Bagmati River, Kathmandu, Nepal. Hydrology, 5(2), 22. https://doi.org/10.3390/hydrology5020022