Abstract
Hurricane events combine ocean storm surge penetration with inland runoff flooding. This article presents a new methodology to determine coastal flood levels caused by the combination of storm surge and surface runoff. The proposed approach couples the Simulating Waves Nearshore model and the Advanced Circulation (ADCIRC) model with the Gridded Surface Subsurface Hydrologic Analysis (GSSHA) two-dimensional hydrologic model. Radar precipitation data in a 2D hydrologic model with a circulation model allows simulation of time and spatially varied conditions. The method was applied to study flooding scenarios occurring during the passage of Hurricane Georges (1998) on the east coast of Puerto Rico. The combination of storm surge and surface runoff produced a critical scenario, in terms of flood depth, at this location. The paper describes the data collection process, circulation and hydrologic models, their assemblage and simulation scenarios. Results show that peak flow from inland runoff and peak flow due to storm surge did not coincide in the coastal zone; however, the interaction of both discharges causes an aggravated hazardous condition by increasing flood levels beyond those obtained with storm surge penetration only. Linking of storm surge and hydrologic models are necessary when storm surge conditions occur simultaneously with high precipitation over steep and small coastal watersheds.
1. Introduction
Flood inundation maps are useful for planning and management of floodplains, evacuation routes for communities, definition of no-build zones, development of safe and cost-effective design criteria for hydraulic structures, among other uses []. Tropical storms are associated with heavy downpours, which deposit huge amounts of rainfall over already saturated soils inundating large areas. Coastal zones are also subject to storm surge conditions. Consequently, these areas are affected by the combination of two processes: (i) surface runoff flood due to inland precipitation and (ii) storm surge generated by meteorological and astronomical tides []. The interaction between these effects is critical in determining flood risk in coastal zones []. According to Bacopoulos et al. [] a combined hydrologic-hydrodynamic approach is needed to account for storm surge processes and surface runoff from precipitation. Flooding on coastal zones could be exacerbated by the addition of overland runoff. Flood risk analysis and damage in many coastal watersheds might be underestimated under current Federal Emergency Management Agency (FEMA) floodplain procedures if they do not consider dynamic storm surge boundary conditions in hydraulic models to determine inland flooding risk []. Process-based hydrologic models are becoming increasingly critical in short-term forecasting of inundation dynamics and in situations where complex land-atmosphere coupling is essential for accurate predictions []. Currently, there is no coupled hydrologic storm surge model available for Puerto Rico and the U.S. Virgin Islands. The combined effects of storm surge and surface runoff flooding are not considered when flood inundation maps are created. In addition, there are few detailed studies of extreme hydrological events in the Caribbean islands setting [].
Puerto Rico is located in a zone prone to hurricane impacts (see Figure 1). There are about seven basins where atmospheric disturbances generally develop into hurricanes []. One of these is the Atlantic Basin, which includes the Atlantic Ocean, the Gulf of Mexico and the Caribbean Sea. Most storms originate near Cape Verde, Africa and transform into hurricanes usually before reaching the Caribbean []. Discharge records registered by the U.S. Geological Survey (USGS) show that some of the largest recorded unit discharge flood peaks have occurred in Puerto Rico and most of them are associated with tropical cyclones []. During the 20th century, nine hurricanes made direct contact with Puerto Rico, five of these caused major damage [,]. Figure 2 shows their trajectory and Table 1 summarizes their impact in terms of human fatalities and total economic losses.
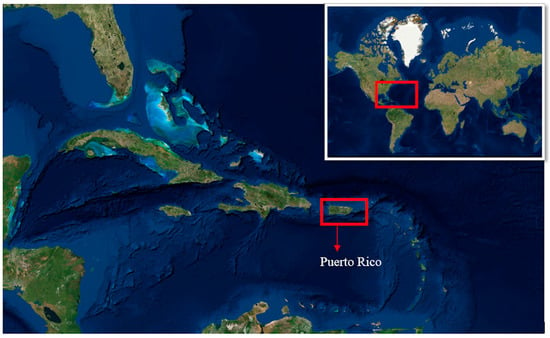
Figure 1.
Location of Puerto Rico within the Caribbean. Puerto Rico is enclosed on the red rectangular and is located on the northwestern hemisphere. (Satellite Image Credit: Esri, DigitalGlobe, Earthstar Geographics, CNES/Airbus DS, GeoEye, USDA FSA, USGS, Getmapping, Aerogrid, IGN, IGP and the GIS User Community).
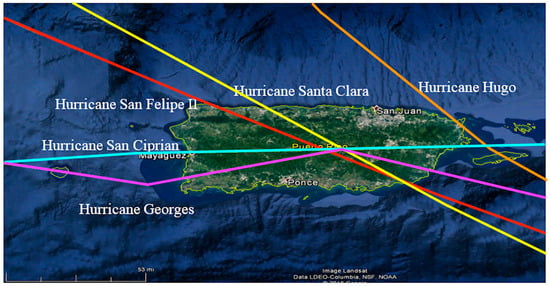
Figure 2.
Track of the five most destructive hurricanes passing over Puerto Rico during the 20th century. The different colors represent different hurricane tracks. The name is next to each trajectory [].

Table 1.
Summary of the five most destructive hurricanes passing over Puerto Rico during the 20th century [].
Studies have been conducted to develop methodologies for coupling inland to coastal models. Park et al. [] performed a study for developing a dynamic warning system to forecast the areas that needed to be evacuated due to inland flooding caused by storm surge in the Masan Bay, Korean Peninsula. Their model simulates tides, depth-averaged tidal currents, wind-driven surges and currents by solving the full set of depth-integrated, non-linear equations, through a finite difference scheme. As a case study, Ray et al. developed a dynamic modeling of storm surge and inland flooding in the coastal floodplain of Galveston, TX, USA []. A one-dimensional hydraulic model of Armand Bayou watershed, located in Texas, for the two principal streams was built. To couple the storm surge and inland flooding, Ray et al. incorporated Hurricane Ike surge elevations data into their hydraulic model as a single time-varying water surface elevation boundary condition at the outlet of each stream. The authors concluded that the timing of both rainfall and storm surge played a significant role in the magnitude of inland flooding in coastal watersheds. Despite their efforts, a one-dimensional model lacks the inland flooding distribution component through the watershed, which can only be considered in two-dimensional models.
Zheng et al. quantified the dependence between extreme rainfall and storm surge in the entire coastline of Australia using statistical simulations []. Their model is based on the bivariate logistic threshold-excess statistical model and uses an extensive observational record of rainfall and storm surge events currently available. Their findings reveal that the strength of dependence between both events (i.e., extreme rainfall and storm surge) varies depending on the following factors: storm burst duration, lag between both events, seasonal variation and spatial distance between both events. The authors concluded that the two processes must be considered jointly if flood risk is to be quantified correctly.
Martyr et al. used the Simulating Waves Nearshore model (SWAN) and the Advanced Circulation model (ADCIRC) with a refined mesh to model effects of surges produced by strong winds to simulate river flow and hurricane-driven surge conditions in the lower areas of the Mississippi River []. Their model can simulate riverine flows, tides, hurricane waves and storm surges and circulation for the southeastern Louisiana coast and was validated using the trajectory and weather conditions of Hurricane Gustave (2008). Therefore, their model can simulate the falling and rising river flow-based water levels during hurricane events. However, this model does not consider inland hydrology, since it is a purely hydrodynamic model. Using Martyr et al. model, Dresback et al. developed a fully coupled model system that includes a hydrologic model as an extension of the coastal hydrodynamic model [,]. Their model uses forecasting of real-time water levels due to tropical cyclone conditions in the coastal areas of two river basins located in North Carolina. Then estimated the average stream discharge from 128 simulations, in which several parameters were varied to produce different scenarios. Scenarios were defined on the ADCIRC + SWAN model as a river boundary condition. The forecasted and observed precipitation upstream the river boundary condition are taken into consideration on the hydrologic model and routed downstream. In addition, precipitation on the estuaries and on land surface below the river boundary condition is neglected. After testing the forecast model during the passage of Hurricane Irene (2011), Dresback et al. concluded that the freshwater discharges had a negligible effect on the total water level in the estuarine zones for Hurricane Irene conditions []. However, for other cases, such as Hurricane Floyd, freshwater played an essential role on the total water levels in these zones. The major conclusion of their study supports the concern that there is a need to combine coastal hydrodynamics with inland hydrology to evaluate the risk of coastal flooding.
Recently, Bacopoulos et al. developed a hydrologic-hydrodynamic coupled model for simulating the surge and flooding extent of the Lower St. John’s River basin, in northeast Florida, for Tropical Storm Fay in 2008 []. The Soil and Water Assessment Tool (SWAT) was selected to simulate the runoff response from radar precipitation over the selected watershed of the tributaries that discharge into the estuary. The runoff from the SWAT was used with ADCIRC as an inflow boundary condition. Their results show that the peak flow time preceded the peak river surge by approximately 24 h. In addition, the contribution of runoff inflows from SWAT model improved the performance of ADCIRC when both models were coupled. This study demonstrates the importance of combining hydrology and hydrodynamics in simulations of flood forecasting for coastal rivers.
According to Smith et al. atmospheric disturbances play an important role in extreme flood response of Puerto Rico []. The current study introduces a methodology to determine flood effects caused by the dynamic combination of the storm surge and surface runoff. The study calls the attention on assessing potential damage due to floods and their consideration for strengthening community resilience in Puerto Rico. The study focuses on hazardous flood zones on the east coast of Puerto Rico, where storm surge and surface runoff effects combined produced a critical scenario during Hurricane Georges. Hurricane Georges was selected because it carried heavy rainfall. A total of 770-mm was recorded during a 24-h period in the municipality of Jayuya, producing peak discharges that equaled or exceeded the 100-year recurrence interval []. Section 2.1 presents a description of Hurricane Georges effects on the Caribbean.
The purpose of this study is to develop a methodology to quantify flood conditions caused by the combination of the storm surge and surface runoff during hurricane or tropical storm conditions. The method described helps identifying hazardous flood zones near river outlets influenced by storm surge penetration. The remainder of this article focus on describing the case study selected, presenting the methodology and, discussing and analyzing the results. The effects of Hurricane Georges over Puerto Rico and the characteristics of the area of interest are described first. Then a description of the hydrological model and the storm surge model is presented followed by the explanation on how both models were link. Finally, the results are discussed and conclusions are presented.
2. Case Study Description
According to Smith et al. the frequency with which a hurricane passes directly over Puerto Rico is relatively low; however, partial impact on the Island has occurred more often []. This section presents a short description of the effects of Hurricane Georges during its passage through the Atlantic Ocean and a description of the area of interest selected for testing the methodology.
2.1. Hurricane Georges
Hurricane Georges became the most destructive hurricane to strike Puerto Rico since Hurricane San Ciprian in 1932 []. According to Guiney, Georges was the second deadliest and second strongest hurricane within the Atlantic basin during the 1998 season []. During its active 17 days, it made landfall seven times and produced 602 fatalities, mainly in the Dominican Republic and Haiti. Georges originated from an atmospheric disturbance on the west coast of Africa, late on 15 September 1998 and became a tropical storm at 12:00 UTC on 16 September centered about 998-km west of the Cape Verde Islands []. Its maximum sustained winds of 250-km/h at 6:00 UTC on the 20th, made it a category IV hurricane on the Saffir-Simpson scale, while located about 459-km east of Guadeloupe in the Lesser Antilles []. Georges made landfall in the southeast of Puerto Rico on the evening of 21 August, with sustained winds of 185-km/h as a category III hurricane near the vicinity of Yabucoa-Humacao [,]. Georges crossed the island of Puerto Rico from East to West during 22 August as it slightly weakened. A sample of reflectivity obtained from the San Juan Weather Surveillance Radar 1988 Doppler (WSR-88D) during Hurricane Georges over Puerto Rico at 00:07:01 UTC of 22 September 1998 is presented in Figure 3.
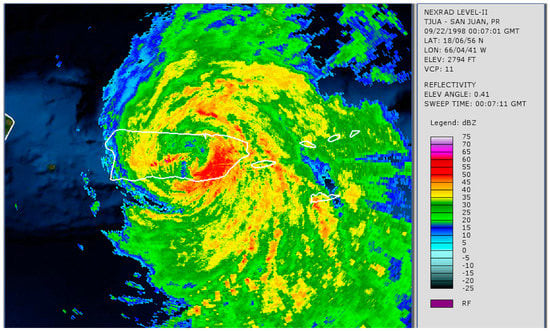
Figure 3.
Reflectivity over Puerto Rico during Hurricane Georges, 22 September 1998 00:07:01 UTC. Puerto Rico and the neighboring islands are shown in white lines. The lowest reflectivity is represented with the blue tonality and the highest reflectivity is represented with the red tonality. The reflectivity patterns were obtained from the WSR-88D radar located in Cayey, Puerto Rico [].
The storm surge was estimated to be near 3.05-m (10-ft) in the coast of Fajardo, Puerto Rico []. The maximum official two-day USGS rain gage measurement was 625-mm and occurred in Villalba, Puerto Rico; while the maximum Cooperative Observer (CO-OP) two-day total reported was 720-mm in Jayuya, Puerto Rico []. Georges produced damages in all sectors of the island, including vital services, agriculture, transportation and other infrastructure, with damage totaling $1,907,026,374 []. See Table 2 for additional details.

Table 2.
Damages and losses produced by Hurricane Georges at Puerto Rico [].
2.2. Area of Interest
The area of interest (AOI) is located within the municipalities of Fajardo and Ceiba, on the east coast of Puerto Rico. The AOI includes the following watersheds: QSN-1959, Demajagua River, Ceiba Creek and Aguas Claras Creek. This area was selected since the maximum storm surge of 3.05-m occurred near Fajardo. In addition, close to 254-mm of rainfall fell between 21 and 22 September of 1998 at the AOI []. The total area is approximately 19.69-km2 and it includes several urban developments. The delineation of each watershed, the location of each river systems, as well as a satellite image of the area of interest are presented in Figure 4. The remainder of this section presents the land-use cover classification and the surface water hydrology within the AOI.
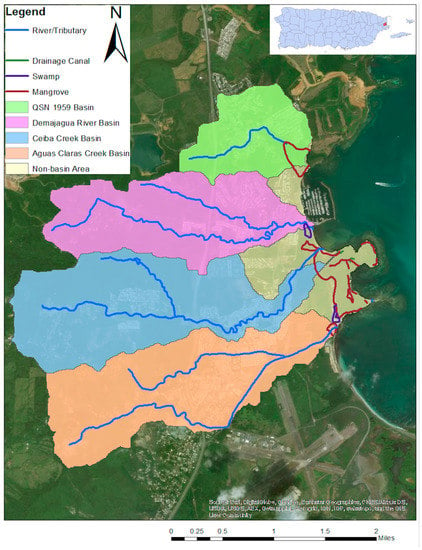
Figure 4.
Hydrography of the watershed system within the area of interest. The delineation of each watershed and their river system is presented. A satellite image of the area of interest is also shown. The river/tributary path, the drainage channel location and the swamp and mangrove areas are delimitated on the figure. The Non-Basin Areas represents zones that does not have a river/tributary path; therefore, a watershed system cannot be defined [].
2.2.1. Land-Use Cover
According to the Puerto Rico Planning Board (PRPB), land cover use is distributed as follows: pastures and shrubs cover 59% of the total area, while forest/woods, urban development and wetland represent 25, 11 and 5% of the AOI, respectively []. Figure 5 presents the land-use map within the AOI for 2006. The map was modified to reflect conditions back in 1998. These changes were made by comparing aerial photos from the USGS from 1994 and 2006. Even though no aerial photos were available for 1998, most of the changes can be associated with urban development after 1998. Construction dates of urban development areas were verified with the record of construction from the PRPB.
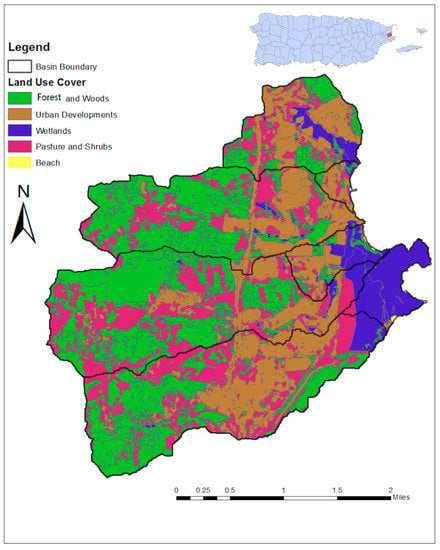
Figure 5.
Land cover use within the area of interest for the 2006 conditions. The watershed boundaries are shown with a black solid line. The land use cover divides into the following categories within the area of interest: Forrest and Woods, Urban Developments, Wetlands, Pasture and Shrubs and Beach [].
2.2.2. Surface Water Hydrology
Each watershed drains into a river or a creek system with multiple branches. Figure 4 presents the watershed delineation and hydrography and Table 3 summarizes the watershed’s geometric parameters. The largest watershed is Ceiba, with 5.81-km2. This watershed also has the largest basin length and the highest elevation above mean sea level (MSL), estimated at 5.32-km and 297-m above MSL, respectively. The watershed with the steepest basin slope is Demajagua, with a slope of 0.24-m·m−1.

Table 3.
Basin parameters for the watersheds at the area of interest.
3. Methodology
The methodology developed for this study is described in the following steps:
- Select the area of interest (AOI) for the proposed study. The AOI for this case covers the coastal zone where Hurricane Georges made landfall in Puerto Rico as a Category III hurricane. Several communities, marinas and natural reserves were impacted at the AOI. Major inland effects included damages to infrastructure and agriculture.
- Collect the necessary data from stream gages, rainfall gages, land-use, soils properties and radar for developing hydrologic and storm surge models.
- Conduct a field reconnaissance of the AOI. This includes documenting vegetation, streams and surveying of stream cross-sections at specific sites. Light Detection and Ranging (LiDAR) surveying and hydrography is recommended.
- Select suitable computer models. Extensive areas with several watersheds call for the use of two-dimensional, gridded, spatially varied hydrologic models. The Gridded Surface Subsurface Hydrologic Analysis (GSSHA) model from the U.S. Army Corps of Engineers (USACE) will be employed for this purpose [,]. Its capability to handle dynamic boundary conditions allows for an accurate simulation of the interaction between the ocean and the fresh-water bodies. Storm surge and hurricane wave fields were computed using ADCIRC + SWAN with a high-resolution grid.
- Link both models, GSSHA and ADCIRC + SWAN, to compute the flooding effects caused by surface runoff with and without storm surge penetration. Tide levels obtained from ADCIRC + SWAN were input as time series boundary conditions into the corresponding grid locations in GSSHA. Notice that the tide levels correspond to storm surge inland penetration; therefore, the same locations are included as part of the GSSHA grid. In other words, both models share the exact same location along the strip of coastal line. Time varying, spatial rainfall distribution obtained from radar reflectivity was poured on the AOI in a synchronized manner with the tide penetration. The result is a dynamic simulation combining inland flooding and storm surge conditions simultaneously even though the models were run separately. Section 3.3 provides more details on how information from the circulation model was input into the hydrologic model.
- Model calibration and validation. The simulation results should be compared against measured data and model adjustments should be done to obtain the best reproduction of the field conditions. Once the model is calibrated, validation should be done using independent data from the same watershed. Unfortunately, hurricanes and tropical storms are extremely destructive phenomena. Extreme winds and large amounts of precipitations caused great damage to hydrologic equipment in the Caribbean. Gage stations rarely survive the impact of a hurricane, nor can operate during the peak flow conditions. Consequently, it is not always possible to have data for model calibration and/or validation as desired. In this case radar data was compared and calibrated using limited rain gage data. No stream data or high-water marks were available. A local sensitivity analysis was performed on the hydrologic model parameters to study their impact on the results.
- Analyze information. The analysis includes water volumes and hydrographs and a comparison of runoff-only and runoff plus storm surge penetration hydrographs to determine coastal flooding response.
- Compare scenarios. If storm surge plus overland flood produce hazardous conditions more critical that storm surge alone, coastal inundation maps must be updated considering overland plus storm surge conditions.
3.1. Hydrologic Model and Data
Advances in hydrologic science and research has made distributed hydrologic models accessible for engineering research and applications. These models allow for spatial discretization of surface terrain, hydrologic parameters and rainfall distribution []. Time-varying radar rainfall over the watershed is used for analysis of historic events. A distributed process-based model relies on multiple components that are combined to contribute to the overall dynamics at a higher organization level, such as a watershed []. An example of these models is the Gridded Surface Subsurface Hydrologic Analysis (GSSHA). This is a two-dimensional distributed model developed by the U.S. Army Corps of Engineers (USACE). GSSHA simulates the hydrologic response of a watershed subject to given hydro-meteorological inputs []. The Green and Ampt model was selected for simulating infiltration, whereas the diffusive wave formulation is employed for hydrologic routing.
GSSHA has been tested on a wide variety of watersheds. Ogden used the GSSHA model to detect land-slide affected peak flows on the Dominica Island during Tropical Storm Erika on 27 August 2015 []. The GSSHA model performed adequately in a difficult environment for hydrological modeling, including the extremely rugged topography of this Caribbean Island. Dominica is composed of two main and 10 smaller volcanoes, very thin volcanic origin soils and high intensity rain rate near 100-mm/h []. Similarly, a GSSHA flood control system design by the USACE in Florida, led to a documented savings of over $40 million in comparison to a design using the standard practice of independent hydrology and hydraulic models []. In addition, the model can efficiently forecast discharge in both Hortonian and non-Hortonian basins, with small bias in the predictions [].
The required data for a distributed hydrologic model could be divided into the following categories: digital elevation model (DEM), stream channel cross-sections, land use cover, soil type cover, radar precipitation (for spatial and time variable precipitation) and surface roughness coefficients. Sources of data are described next:
- A 10-m resolution DEM for the Fajardo Coast []. This information is needed to delineate the watershed of any river system using the terrain elevation and the outlet location of the watershed
- Stream Channel Cross Sections. These were obtained from Light Detection and Ranging (LiDAR) data with a vertical accuracy of 18.6-cm and a horizontal accuracy of 100-cm, with a nominal spacing of 1.0-m between points []. Adequacy of LiDAR data for hydrologic routing in this study was verified with surveyed field data at specific locations, where a good agreement between the LiDAR and the surveyed cross-section for hydrologic routing purposes was observed. Table 4 shows the difference of the main dimensions for both cross-sections. The percent difference was computed as the difference of both dimensions divided by the average of both dimensions.
 Table 4. Differences between the field-surveyed and LiDAR cross-sections for each watershed.
 - Land Cover Use Map. This map was obtained through the University of Puerto Rico at Río Piedras and the Puerto Rico Planning Board. The land use cover map is dated 2006; however, it was corrected to represent conditions back in 1998, through the use of aerial photos. Land use was used to assign the surface roughness coefficient for overland flow.
- Soil Type Map. It was created by the U.S. Department of Agriculture (USDA)-Natural Resources Conservation Service (NRCS) dated 2004 []. Hydraulic conductivity, soil texture, wilting point and initial moisture were obtained from the NRCS Web Soil Survey webpage. These additional parameters are available as part of the Soil Survey Area, typically known as the SSURGO data. The information for computing infiltration was obtained from the study of Rawls et al. [].
- Radar Precipitation Data. It depends on the strength of the returned signal or reflectivity. Reflectivity patterns during Hurricane Georges were obtained from the WSR-88D radar located in Cayey, Puerto Rico []. This reflectivity was converted to rainfall intensity using the Rosenfeld Tropical Equation proposed by Roche and Vasquez []. This information is essential for two-dimensional hydrologic models, since it provides the precipitation as a function of time and space.
- Manning’s surface roughness coefficients. These are used to estimate overland and channel flow resistance [,]. The values varied between 0.050 and 0.460 for the floodplains of low-density urban development surface, to the mature secondary lowlands, respectively. Manning’s coefficient for stream bed vary between 0.040 and 0.045. These values were obtained from FEMA, Halgren and Kalyanapu et al. [,,]. Due to the complexity of the overland flow phenomenon, resistance coefficients are commonly used for model calibration, if gage data is available.
3.2. Storm Surge Model
Storm surge and hurricane wave fields were computed using the ADCIRC + SWAN coupled wave-circulation model []. ADCIRC + SWAN couples both the SWAN spectral-phase averaged wave model from Zijlema and the ADCIRC finite-element shallow-water circulation model from Westerink et al. [,]. Both wave and circulation models run on the same unstructured mesh. Wind stresses, radiation stresses, water levels and currents are shared in memory. Thus, both models seamlessly share the coupling variables without the need to interpolate or generate output files to separately run the models. These models have been extensively used and validated for tides, storm surge, hurricane wave fields and barotropic currents in a broad range of environments, such as Louisiana, Mississippi, Texas, Florida, Alabama and Puerto Rico [,,,,,,].
A high-resolution unstructured mesh with a spatial resolution (PRVI2015 henceforth) of, at least, 100-m along all the coastlines of Puerto Rico and the U.S. Virgin Islands was used []. This mesh has a domain that extends from the North Atlantic Ocean down to Brazil (Figure 6), which allows to solve for a range of dynamical scales, ranging from basin scale (100’s of kilometers) down to the coastal (km) and nearshore areas (10’s of meters), including floodplain areas. In the vicinity of Puerto Rico and the U.S. Virgin Islands, the mesh has a detailed representation of the depths and geometries of important coastal features such as reefs, sand banks and mangrove forests. The mesh also includes a mapping of the benthic habitat classifications and mangrove coverage, taking into account their frictional effects by assigning a Manning’s coefficient to each kind of bottom classification [,,]. Land cover classification is also assigned a Manning coefficient, as well as a directional roughness length for wind reduction due to land cover effects [].
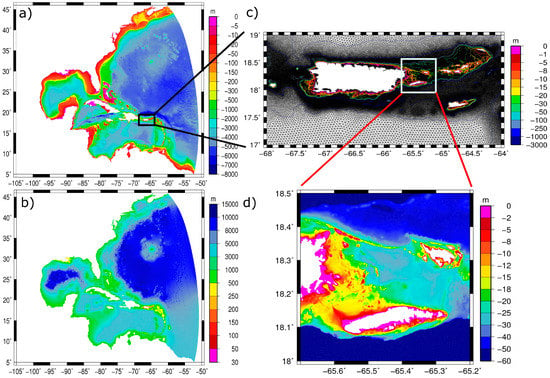
Figure 6.
(a) Bathymetry of the full domain unstructured mesh used for the ADCIRC + SWAN simulation (b) spatial horizontal resolution of the unstructured mesh (c) detail of mesh triangulation and isobaths over the Puerto Rico and Virgin Islands region and (d) detail of bathymetry on the east coast of Puerto Rico, where Hurricane Georges had the most significant impact. The highest elevation is represented with the magenta tonality and the lowest elevation is represented with the blue tonality. The islands and territories are represented with the white color.
Wind forcing for Hurricane Georges was computed using an asymmetrical parametric wind model, driven by NOAA’s ATCF database notifications [,]. As part of the model development the NCEP Climate Forecast System Reanalysis (CFSR, obtained from https://rda.ucar.edu/) wind and atmospheric pressure fields were also evaluated as atmospheric forcing but its performance lacked in comparison to the parametric wind model (see Figure 7). ADCIRC had a tidal spin-up time of 39 days, beginning on 12 August 1998. Tidal forcing was provided at the boundaries by applying the surface elevation tidal amplitudes and phases (M2, K2, N2, S2, K1, Q1, P1, O1) for the boundary nodes. These amplitudes and phases were obtained from the TPXO8 global solution []. In addition, internal tidal forcing was provided by the tidal potential function []. After these initial 39 days, the parametric wind forcing was then applied to the model along with the tidal forcing, time at which, coupling with the SWAN was initiated. ADCIRC and SWAN coupling occurs every 10 min, time at which wind and wave stresses, as well as free surface elevation are exchanged between models. The total simulation ended at 23 September 1998.

Figure 7.
Observed (dots), parametric model (blue line) and CFSR (green line) wind speed (top), wind direction (middle) and atmospheric pressure (bottom) during Hurricane Georges at San Juan, Puerto Rico. The observed values were obtained from the NOAA 9755371 monitoring station at the San Juan Harbor. The plotted period is from 20 September 20 1998 0:00 UTC to 23 September 1998 0:00 UTC [].
A comparison of parametric, CFSR and observed wind speed, direction and atmospheric pressure at San Juan, Puerto Rico is shown in Figure 7. Data availability for Hurricane Georges is scarce and San Juan was the location nearest to the AOI with available wind and water level data. It should be noted that the CFSR wind and atmospheric pressure fields do not capture neither the wind speed increase nor the atmospheric pressure drops during Hurricane Georges. This behavior resulted in only the parametric being able to be used as atmospheric forcing, limiting the time over which wind forcing could be prescribed (just over the duration of the hurricane, not allowing domain-scale atmospheric forcing to be used during spin-up previous to the hurricane). Notwithstanding its limitations, parametric wind speeds have a good agreement with observations, especially at capturing the maximum wind speed observed at this location. Due to the formulation of the parametric wind model, the computed wind field is sensitive to the radius of maximum winds and to the distance of a given location relative to the hurricane center. As the parametric wind model has a wind speed of zero on the hurricane center, certain combinations of radius of maximum winds and distance from the center can force an artificial double peak wind profile if more than one hurricane quadrant passes near a given location []. This explains the second wind peak computed by the parametric model in San Juan, which is not present in the observations. Wind direction and atmospheric pressure have better agreement than wind speeds and the wind direction during the artificial second wind speed peak agrees with the observations, indicating that these exaggerated wind speeds are related to a wider hurricane radius.
For validation purposes of the ADCIRC + SWAN model, Figure 8 shows the ADCIRC + SWAN and the NOAA NOS predicted harmonic (tide only) and observed surface elevations at San Juan during Hurricane Georges. The model had a good agreement with the observed tide, reaching a maximum total surge of 0.8-m over MSL. High tide did not coincide with the maximum surge time, which contributed to the surge being less than if had coincided.

Figure 8.
Observed (blue line) and ADCIRC + SWAN (red line) water surface levels at San Juan during Hurricane Georges. The dashed line represents the ADCIRC tide-only water level as a reference. The observed values were obtained from the NOAA 9755371 monitoring station at the San Juan Harbor. The plotted period is from 20 September 1998 0:00 UTC to 23 September 1998 0:00 UTC.
Figure 9 shows the water surface elevation and significant wave heights at the time of the most direct hit of Georges to the east coast of Puerto Rico, as well as the maximum water surface elevation over the AOI. The water surface elevation and significant wave heights show the effect of the bathymetry and the detail on the mesh in the sharp gradients of both surface elevation and significant wave heights over the reef chain that divides the Atlantic Ocean from the Virgin Islands shelf. In addition, a large sand bank on the northwest corner of Vieques Island causes an enhanced pile up of water which extends up to the eastern coast of Puerto Rico. On the vicinity of the Ceiba outlet the maximum surge exceeded 1.5-m over MSL, while at QSN, Demajagua and Aguas Claras outlets the maximum surge was in the order of one meter. Piling up of the storm surge in this location was caused by the strongest hurricane winds being oriented perpendicularly over this area. This two-dimensional water surface elevation scenario was provided to GSSHA as part of the linking technique described next.
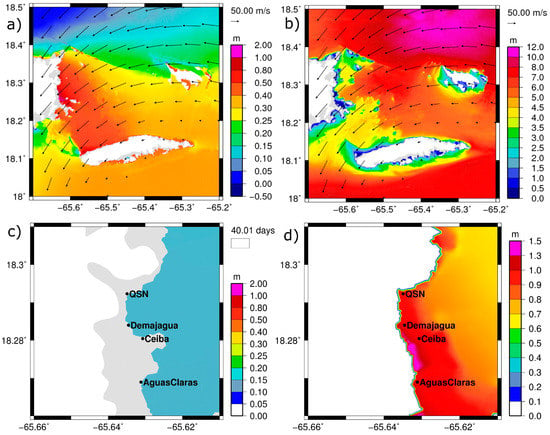
Figure 9.
(a) Water surface elevation and (b) significant wave heights at the time of maximum wind speeds and most direct hit of winds to the eastern coast of Puerto Rico. (c) ADCIRC + SWAN water surface elevation before Hurricane Georges in the vicinity of the area of interest and (d) ADCIRC + SWAN maximum water surface elevation during Hurricane Georges. Water levels before Hurricane Georges are shown as a reference of the extent of the maximum storm surge and the labels in (d) outlets used in the ADCIRC + SWAN + GSSHA linking. The highest elevation is represented with magenta and the lowest elevation is represented with dark blue (including the dry inland nodes). The islands and territories are represented with the white and grey color. The river/tributary outlets are identified with their names as QSN, Ceiba, Demajagua and Aguas Claras.
3.3. Model Linking Technique
A new technique was developed to introduce the storm surge elevations as boundary conditions during the passage of any storm event for a realistic simulation of coastal flooding conditions. The technique is described in the following steps:
- The storm surge model (i.e., ADCIRC + SWAN) for the area along the coastline is executed first, separately from the hydrologic model. The model provides the storm surge elevation time series and the maximum storm surge inland penetration along the coastline.
- A mesh with a resolution of 30-m was created the area from the coast to the point of maximum storm surge inland penetration. A finer mesh produces redundancy on the storm surge elevations time series. An exception to this was the Non-Basin Area between Ceiba Creek and Aguas Claras Creek watersheds, which had a mesh with a resolution of 90-m (see Figure 4 for more details). Since this Non-Basin Area has no urban developments, the coarser mesh was considered sufficient for this area.
- The mesh described in Step 2 was used to simulate the dynamics of the storm surge in the hydrologic model. The vertices of this mesh were included as a “feature point” in the GSSHA hydrologic model. The “feature points” contain a time-varying boundary condition representing water surface elevations at the site due to the hurricane surge field. Therefore, each vertex obtained in Step 2 was assigned a time series of water elevations obtained from the storm surge results. Water elevations were provided at 10-min time intervals. An example of the mesh produced in Step 2 within the AOI is shown in Figure 10, where each point represents a “feature point” in the GSSHA hydrologic model.
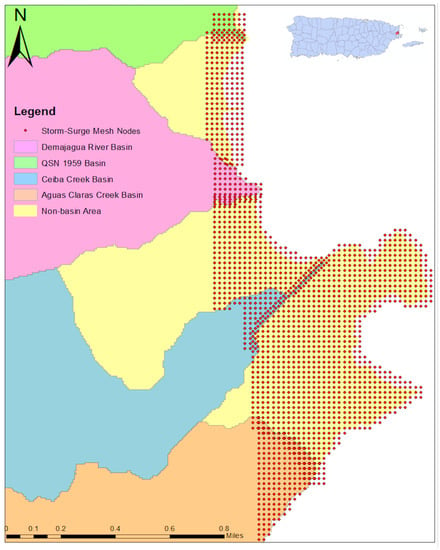 Figure 10. Vertices of the storm surge mesh (dots) within the area of interest for the coupled model. Each point represents a “feature point” in the GSSHA hydrologic model, where the point contains the water surface elevation time series from the ADCIRC + SWAN model. The mesh has a spatial resolution of 30-m, with exception of the Non-Basin Area between the Ceiba and Aguas Claras Watershed, which has a spatial resolution of 90-m.
 - Radar precipitation was introduced over the AOI in the hydrologic model. Storm rainfall over the area moves synchronous with the storm surge elevations at the boundary grid points to obtain the coastal and inland flooding conditions.
Two scenarios were compared to quantify the effects of inland runoff during storm surge conditions. The first scenario simulates surface runoff with the time-varying boundary condition by applying the ADCIRC + SWAN storm surge elevations at the river/creek outlet only. The second scenario considers surface runoff plus storm surge varying in time and space as the storm surge moves over the watershed outlet system. This scenario represents a dynamic situation where storm surge penetrates inland as inland-runoff flooding occurs and interacts simultaneously with the incoming storm surge.
4. Results and Discussion
Flood inundation maps were created for the four watersheds within the AOI and were exported to Google Earth for accessible visualization. Flood hydrographs where obtained at different locations within the water bodies for all the watersheds. A comparison between the time series of water levels for both scenarios were made. In addition, a cumulative volume analysis was developed to determine the contribution of the storm surge water penetration to inland flooding. Finally, a sensitivity analysis was performed to determine which parameters have a greater impact in the results. This article will focus on the results for the Demajagua River, QSN 1959 Creek and Aguas Claras Creek. The results are divided in the following topics: maximum flood inundation map, hydrograph analysis, cumulative water volume and sensitivity analysis.
4.1. Maximum Flood Inundation Maps
Flood hazards highly depend on the maximum water depths reached during storm events. In addition to strong winds, tropical cyclones are accompanied by a spiral system of thunderstorms and heavy rainfall. Human tragedies occur due to a combination of heavy rainfall, inland flooding and high wind velocities. According to FEMA, nine out of ten hurricane fatalities are attributed to storm surge []. Depending on the watershed characteristics and the rainfall distribution in time and space, the maximum flood depth in coastal areas is produced by a combination of both storm surge and inland flooding. Two flooding scenarios were considered, one that takes the storm surge water inland penetration within the coastal zone into consideration whereas the other does not. The following analysis describes these conditions for the three watersheds selected.
The maximum flood depth and the floodplain range at the costal zones for both flooding scenarios are summarized in Table 5 for all the simulated watershed in this study. The percent increase was computed as the ratio of the two scenarios, minus one (Table 5). The storm surge inland penetration in Demajagua River increased the maximum flood depth by approximately 43%, as compared with results that do not consider sea water inland penetration (Figure 11). In addition, the inundated area increased along the stream by 111%, in comparison with the scenario without storm surge inland penetration (See Figure 11A,B). Coastal flooding affected urban developments within this watershed, producing up to 1.50-m of water depth at the site. Similarly, the maximum coastal flood depth at Aguas Claras Creek was increased by nearly 43% when the storm surge inland penetration was considered (see Figure 12). On the other hand, the inundated area increased along the stream by 122%, when compared to the scenario without storm surge inland penetration (See Figure 12A,B). The increase in water levels at QSN 1959 were smaller, limited to nearly 20%. The inundated area was not altered significantly, since it only increased by 4%, when compared to the scenario without storm surge inland penetration (See Figure 13). In all the watersheds, the effect of the inland storm surge penetration increased the coastal flood level beyond those predicted by fixed boundary conditions. Therefore, the fully dynamic flood scenario produced higher depths near the coastline.

Table 5.
Maximum flood depth and inundated area for the two different flooding scenarios at the coastal zone of the watershed.
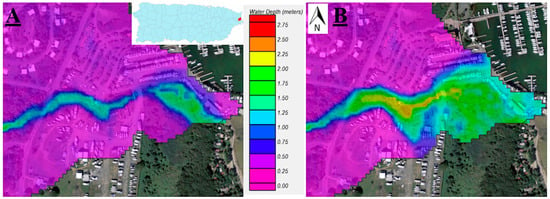
Figure 11.
Maximum flood depth for the different flooding scenario at the Demajagua River watershed. (A) Without storm surge inland penetration; (B) Considering storm surge inland penetration. The color scale represents the water depth in meters, where the red color indicates the maximum value and the magenta color represents the minimum value.
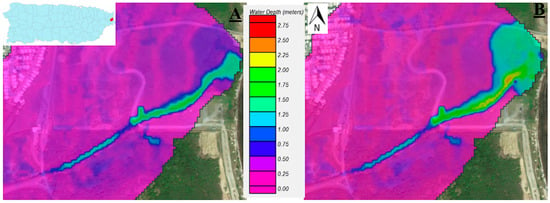
Figure 12.
Maximum flood depth for the different flooding scenario at the Aguas Claras Creek watershed. (A) Without storm surge inland penetration; (B) Considering storm surge inland penetration. The color scale represents the water depth in meters, where the red color indicates the maximum value and the magenta color represents the minimum value.

Figure 13.
Maximum flood depth for the different flooding scenario at the QSN 1959 Creek watershed. (A) Without storm surge inland penetration; (B) Considering storm surge inland penetration. The color scale represents the water depth in meters, where the red color indicates the maximum value and the magenta color represents the minimum value.
4.2. Hydrographs and Storm Surge Analysis
Flow hydrographs represent the watershed response to runoff during storm events. The effects of considering the storm surge penetration in the simulation, instead of using boundary conditions at a fixed stream outlet only, is analyzed in this section. Response hydrographs were obtained at 0-m, 50-m and 100-m from the river or creek mouth. In Figure 14, Figure 15, Figure 16 and Figure 17, the legend “Surface runoff only” refers to boundary conditions fixed at the river/creek mouth. “Surface runoff + Storm surge” refers to simulations considering the storm surge penetration along the watershed coastal zones. Notice that storm surge conditions can produce river flow moving upstream.
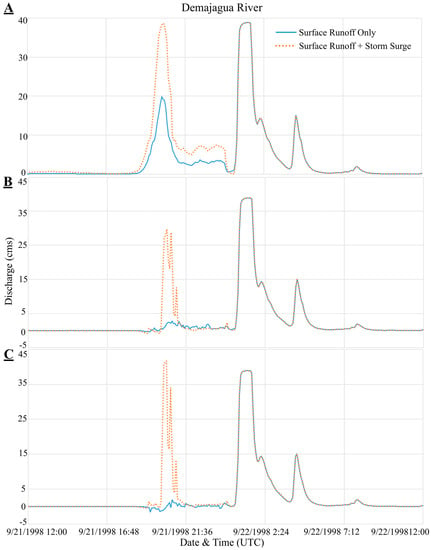
Figure 14.
Discharge hydrograph for the different flooding scenario and at different locations for the Demajagua River watershed. (A) At 0-m from the stream outlet; (B) At 50-m from the stream outlet; (C) At 100-m from the stream outlet. The “Surface Runoff + Storm Surge” flooding scenario is represented with orange dots line and the “Surface Runoff Only” flooding scenario is represented with a solid blue line. The discharge is expressed in cubic meters per second (cms).

Figure 15.
Discharge hydrograph for the different flooding scenario and at different locations for the QSN 1959 Creek watershed. (A) At 0-m from the stream outlet; (B) At 50-m from the stream outlet; (C) At 100-m from the stream outlet. The “Surface Runoff + Storm Surge” flooding scenario is represented with orange dots line and the “Surface Runoff Only” flooding scenario is represented with a solid blue line. The discharge is expressed in cubic meters per second (cms).
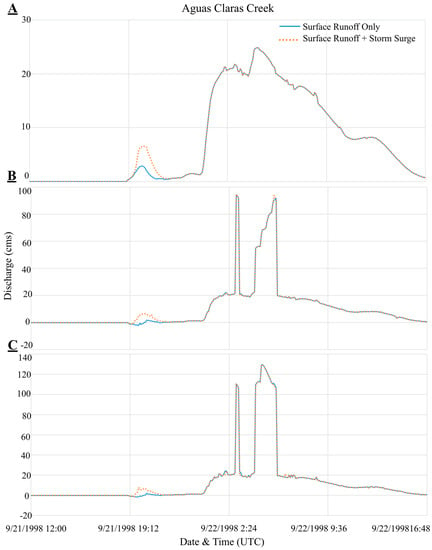
Figure 16.
Discharge hydrograph for the different flooding scenario and at different locations for the Aguas Claras Creek watershed. (A) At 0-m from the stream outlet; (B) At 50-m from the stream outlet; (C) At 100-m from the stream outlet. The “Surface Runoff + Storm Surge” flooding scenario is represented with orange dots line and the “Surface Runoff Only” flooding scenario is represented with a solid blue line. The discharge is expressed in cubic meters per second (cms).
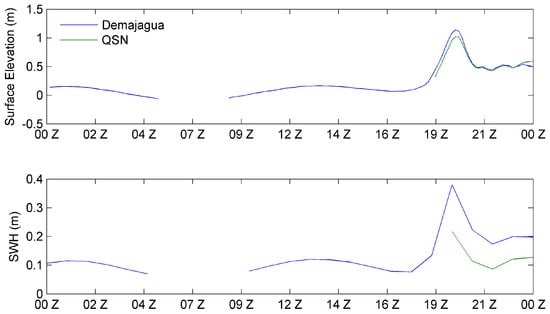
Figure 17.
ADCIRC + SWAN water surface levels at Demajagua (blue) and QSN 1959 (green) outlets during Hurricane Georges (Top). Notice how the tide penetrates into Demajagua while not into QSN 1959. ADCIRC + SWAN significant wave heights (SWH) at Demajagua and QSN 1959 outlets (Bottom). Notice how the waves reach into QSN 1959 later than the water levels, showing the fine detail achieved by the model. The plotted period is from 21 September 1998 0:00 UTC to 22 September 1998 0:00 UTC.
Figure 14A–C show hydrographs at 0-m, 50-m and 100-m from the Demajagua River mouth, respectively. Under storm surge conditions, one or two peak flows result from the combination of surface runoff and storm surge, depending on the time of arrival of the storm surge peak and the inland runoff peak flow. If both conditions occur simultaneously, there will be one peak only. If both conditions occur at different time, there will be two peaks.
In Demajagua the first peak occurred on 21 September 1998 at 20:30 UTC and the second in 22 September 1998 at 1:25 UTC. Without considering storm surge penetration, simulations predicted the first peak at the outlet as 20-m3/s and the storm surge effect dissipated rapidly along the river reach, with discharge decreasing from about 20-m3/s, to less than 5-m3/s at 50-m upstream. However, if storm surge water can move inland, the discharge increases to a peak flow of 36 m3/s at the outlet and a peak flow close to 42-m3/s, as far as 100-m inland. The second peak was due to watershed runoff caused by storm precipitation and had a magnitude of 38-m3/s. The magnitude of the first peak surpasses the second peak, aggravates flood inundation and increases the hazard to people and property. Both peak flows lagged by approximately 5 h. The weather conditions that caused both discharge peaks at the Demajagua River watershed were the same for all the other watersheds, in which the first peak is due to the storm surge inland penetration and the second peak is due to the surface runoff from the storm precipitation.
Figure 15A–C show hydrographs at 0-m, 50-m and 100-m for the QSN 1959 Creek mouth. Here the first peak occurred around 21 September 1998 at 20:00 UTC and the second, around 22 September 1998 at 1:00 UTC. Both peaks lag approximately by 5 h, similar to the Demajagua River. Negative discharges were obtained, meaning that water is moving upstream. The climatological conditions at this site did not provide enough rainfall over the watershed at the time of the peak storm surge flood. Thus, this negative discharge represents the contribution of the surge at QSN 1959, flowing upstream along the creek.
The Aguas Claras Creek hydrograph shows small impact from storm surge penetration. The second peak discharge, due to the surface runoff from precipitation, is predominant (See Figure 16A–C). The first peak occurred on 21 September 1998 at 20:30 UTC and the second, on 22 September 1998 at 4:30 UTC. The difference between both peaks is close to 20-m3/s and lagged by 8 h.
Figure 17 shows the ADCIRC + SWAN water levels and significant wave height at the Demajagua and QSN 1959 outlets during 21 September 1998. The water levels indicate that the daily tidal cycle penetrates Demajagua outlet while not QSN 1959. This has the effect of an earlier storm surge penetration, than in QSN 1959 and the maximum surge at Demajagua is slightly larger than at QSN 1959. Coincidentally, waves penetrate the Demajagua outlet during the daily tidal cycle as well. During the storm surge, peak waves are higher at Demajagua, indicating how much the wave field is dissipated by the local bottom friction, as the land cover at QSN 1959 is greatly dominated by mangrove forest, which has a high dissipative effect. This combination of water levels and wave heights during the storm peak and the differences between Demajagua and QSN 1959 show how ocean forcing coincides with the hydrographs at these locations.
4.3. Cumulative Volume Analysis
Even though peak discharge is usually used as an indicator of hazard conditions and regulations promote zero increase in peak discharge, total water volumes play a major role in water levels during flood conditions. This becomes more important during storm surge events because ocean water penetrates inland, increasing water volumes and flood depths.
The simulated total water volume during Georges, with and without penetration of storm surge for each watershed at the three locations, are summarized in Table 6. The results show that storm surge penetration increases water volume inland, as far as 100-m upstream from the mouth in all cases, except for the QSN 1959 Creek. The volume contribution due to storm surge penetration was estimated by subtracting the hydrograph volume from the surface runoff with storm surge penetration, minus the surface runoff without storm surge penetration. These results are presented as “SS Contr.” in Table 6. The contribution varies depending on the dynamics of the storm surge, the rainfall distribution in time and space and, the watershed storage capabilities. QSN 1959 received 37.8% and 12.5% more water due to storm surge penetration at 50-m and 100-m from the coast, respectively. While Demajagua received 17% and 24.2% more water at the same distances. The watershed that contained the most runoff volumes was Aguas Claras Creek, followed by Ceiba Creek. These watersheds had the smaller percentage of surge water volume because they produced more inland runoff. For example, at 50-m from the outlet, the Aguas Claras Creek received 2% and Ceiba Creek received 4% more water due to storm surge penetration.

Table 6.
Total volume produced by the two flooding scenarios for each watershed at different locations.
4.4. Sensitivity Analysis
A local sensitivity analysis was performed for the Demajagua River watershed []. This analysis consisted of increasing and decreasing the model parameters and observing their influence in the hydrographs produced by Hurricane Georges. Peak flow from inland runoff hydrograph and, water volume under the river hydrograph during the precipitation event, were used as output variables in the analysis. Results from both variables are presented at 50-m upstream from the river outlet. Similar conclusions were obtained at 100-m. Initial soil moisture, overland roughness coefficient and channel roughness coefficient were increased/decreased by 10% over the watershed. Hydraulic conductivity was perturbed 5% to avoid model instabilities.
The sensitivity coefficient is the variation of the model output produced by the variation of one model parameter, keeping the other parameters at a constant value. The constant value selected for this case was the area-weighted average value of each model input parameter. This approximation was assumed as a representative value over the watershed area. If O is the output and P is the selected parameter, the sensitivity coefficient is given by:
Using a central finite difference numerical approximation for the derivative, the sensitivity coefficient is approximated as:
where ΔP is the amount of change of parameter P, usually between 10% and 15% []. When comparing the sensitivity of different parameters to the model output, it is convenient to use non-dimensional relative sensitivity coefficients given by:
Table 7 and Table 8 summarize the sensitivity analysis for discharge and river hydrograph volume for the Demajagua watershed model. Peak flow refers to maximum flows due to inland flooding.

Table 7.
Sensitivity analysis for peak discharge at the Demajagua River watershed.

Table 8.
Sensitivity analysis for hydrograph water volume at the Demajagua River watershed.
The sign of the sensitivity coefficients indicates the direction of change. Table 7 and Table 8 indicate that an increment in hydraulic conductivity, overland roughness and channel roughness reduce the peak flow and volume of water in the river. This means that more water infiltrates or remains more time over the terrain before arriving the river. The opposite occurs with the initial moisture condition.
The sensitivity analysis shows that the most sensitive parameter for peak flow is not the same as for flood volume. The higher the absolute value of the sensitivity coefficient, the higher the sensitivity of the model response to that particular parameter. For peak flow, the most sensitive parameter is the channel roughness. For river water volume, the most sensitive parameter is the hydraulic conductivity. These are the two parameters that should be carefully chosen to represent the actual conditions during the storm event. The initial moisture and the overland roughness coefficients have less impact on the model response. Previously, GSSHA has shown to be quite sensitive to the soil hydraulic conductivity, overland and channel roughness, retention storage and plant interception of rainfall [].
5. Conclusions
This study presents a methodology to link storm surge and two-dimensional hydrologic models for storm surge penetration and inland runoff. Simulations with data from Hurricane Georges making landfall in Puerto Rico showed higher flood levels and peak discharges near the coastline when inland runoff and storm surge penetration are simulated, as compared with storm surge levels fixed at the river mouth. Their combined dynamic effect is important for accurate development of flood inundation maps in coastal areas. Storm surge penetration increases water volumes in the river and produces higher flood levels.
The simulations performed on the watersheds included in this research show that the peak flow from inland runoff hydrographs did not coincide with the peak flow due to storm surge conditions near the river mouth. Two peak discharges will occur: one due to storm surge driven discharge caused by the penetrating ocean water and another due to flood caused by rainfall. The first arriving peak is not detected unless the storm surge inland penetration is considered in the link between the storm surge and the hydrologic model. The net effect of the storm surge flood depends on the watershed conditions, the spatial and temporal distribution of rainfall and the local conditions of the river morphology near the coastline.
For coastal developments, the impact of land use changes in increasing peak discharges should be small because most land-use changes occur near the watershed outlet, where outflow occurs early during the storm event. However, urban developments near the coast increase the risk for human and infrastructure loss due to close exposure to hazardous conditions.
Even though peak discharge is usually considered as an indicator of hazardous conditions and, regulations promote zero increase in peak discharge, water volumes play a major role in water levels during coastal flood conditions. This is key during storm surge because ocean water penetrates inland increasing water volumes and flood depths. The volume contribution due to storm surge penetration varies at different places, depending on the size of the watershed. In small watersheds, such as QSN 1959, an additional 28% of more water was received due to storm surge penetration at 50-m from the coast. Demajagua received 17% more water at the same distance. Conversely, in larger watersheds that contain greater runoffs volume; such as Aguas Claras Creek and Ceiba, the effect of volume increase is not significant.
Land use cover near the stream mouth has an effect in storm surge protection. QSN 1959 showed that mangroves protected against the effect of storm surge due to dissipation of wave energy and increase of friction. Mangrove acted as a natural protection barrier against the fury of the hurricane.
The lack of gage data within the area of study represents a limitation for calibrating the hydrologic model and calls the attention to improve data acquisition systems capable of withstanding extreme events conditions. The local sensitivity analysis showed that the river peak flow from inland waters is more sensitive to channel roughness than to other model variables. However, water volume in the river is more sensitive to hydraulic conductivity. These parameters were chosen with care; however, uncertainty remain. Presently the authors are applying the method to other watershed where point gage precipitation, stream hydrographs and flood water levels are partially available. This case study would be suitable for calibration.
Radar data requires a great amount of processing. Synchronization of radar rainfall and storm-surge penetration time series is fundamental in these simulations. The GHSSA model performed very well in handling both conditions. However, adverse slopes and steep slopes had to be smoothed due to inherent limitations of the hydrologic routing algorithm. The study demonstrates that GSSHA can handle time and spatially varied boundary conditions, therefore, it is useful to model variable storm surge scenarios.
Acknowledgments
This project was sponsored by the Integrated Ocean Observing System (IOOS) Caribbean Coastal and Ocean Observing System (CariCOOS). The Puerto Rico Water Resources and Environmental Research Institute provided computer resources, infrastructure and technical support. Dr. Jorge Rivera Santos from the Dept. of Civil Engineering and Surveying at UPR-Mayaguez, provided valuable recommendations while pursuing this research. The ADCIRC + SWAN model used here was developed as part of the IOOS Coastal and Ocean Modeling Testbed managed by SURA. This research was supported in part by the Notre Dame Center for Research Computing through HPC and the Computational Hydraulics Laboratory resources. Additionally, computational resources from NSF XSEDE project OCE160002 (Stampede supercomputer) were used for the ADCIRC + SWAN simulations. Their contribution is greatly appreciated. The authors thank the anonymous reviewers for their excellent contribution to the improvement of this paper.
Author Contributions
Walter F. Silva-Araya and Félix L. Santiago-Collazo produced and post-processed the GSSHA simulations and analyzed the maximum flood inundation maps, hydrographs and cumulative volume. Walter F. Silva-Araya and Félix L. Santiago-Collazo developed the linking technique for the GSSHA and ADCIRC + SWAN models and produced the sensitivity analysis. Juan González-López designed the finite element grid, provided input data for GSSHA and post-processed the ADCIRC + SWAN simulations. He analyzed storm surge, wave and wind/pressure results. Javier Maldonado-Maldonado surveyed the field the channel cross-sections, collect the LiDAR channel cross-sections and realized a comparison of both cross-sections.
Conflicts of Interest
The authors declare no conflict of interest.
References
- Torres-Sierra, H. Flood of September 22, 1998, in Arecibo and Utuado, Puerto Rico; Technical Report 01-4247; U.S. Geologic Survey: San Juan, Puerto Rico, 2002.
- Tayel, M.; Oumeraci, H. A Hybrid Approach Using Hydrodynamics Modeling and Artificial Neural Networks for Extreme Storm Surge Prediction. Coast. Eng. J. 2015, 57, 1540004. [Google Scholar] [CrossRef]
- Zheng, F.; Westra, S.; Sisson, S.A. Quantifying the dependence between extreme rainfall and storm surge in the coastal zone. J. Hydrol. 2013, 505, 172–187. [Google Scholar] [CrossRef]
- Bacopoulos, P.; Tang, Y.; Wang, D.; Hagen, S.C. Integrated Hydrologic-Hydrodynamic Modeling of Estuarine-Riverine Flooding: 2008 Tropical Storm Fay. J. Hydrol. Eng. 2017, 22, 1–11. [Google Scholar] [CrossRef]
- Ray, T.; Stepinski, E.; Sebastian, A.; Bedient, P.B. Dynamic Modeling of Storm Surge and Inland Flooding in a Texas Coastal Floodplain. J. Hydraul. Eng. 2011, 137, 1103–1110. [Google Scholar] [CrossRef]
- Fatichi, S.; Vivoni, E.R.; Ogden, F.L.; Ivanov, V.Y.; Mirus, B.; Gochis, D.; Downer, C.W.; Comporese, M.; Davison, J.H.; Ebel, B.; et al. An overview of current applications, challenges and future trends in distributed process-based models in hydrology. J. Hydrol. 2016, 537, 45–60. [Google Scholar] [CrossRef]
- Ogden, F.L. Evidence of equilibrium peak runoff rates in steep tropical terrain on the island of Dominica during Tropical Storm Erika, August 27, 2015. J. Hydrol. 2016, 542, 35–46. [Google Scholar] [CrossRef]
- Ramírez, J.T. Huracanes; Universidad Interamericana de Puerto Rico, Centro de Recursos Educativos para Matematicas y Ciencias: Ponce, Puerto Rico, 2010; Available online: http://cremc.ponce.inter.edu/huracanes/forman.htm (accessed on 2 August 2016).
- Smith, J.A.; Sturdevant-Rees, P.; Baeck, M.L.; Larsen, M.C. Tropical cyclones and the flood hydrology of Puerto Rico. Water Resour. Res. 2005, 41, 1–16. [Google Scholar] [CrossRef]
- El Nuevo Día Newspaper. Los Cinco Huracanes más Intensos en Puerto Rico; GFR Media: Guaynabo, Puerto Rico, 2013; Available online: http://www.elnuevodia.com/noticias/locales/nota/loscincohuracanes masintensosenpuer torico-1547186/ (accessed on 3 August 2016).
- Metro Puerto Rico Newspaper. Tormentas y Huracanes que Pasaron por Puerto Rico; Metro International: Guaynabo, Puerto Rico, 2017; Available online: http://www.metro.pr/pr/noticias/2017/09/04/tormentas-huracanes-pasaron-puerto-rico.html (accessed on 12 January 2018).
- Intersection of Severe Weather, Climate and Society. Historical Hurricane Tracks; University of Illinois Urbana-Champaign: Champaign, IL, USA, 2010; Available online: http://www.atmos.uiuc.edu/iswecs/Google.Earth/Tropical/Hurrtracks/Hurrtracks.kmz (accessed on 3 August 2016).
- Park, G.H.; Kim, I.C.; Suh, K.S.; Lee, J.L. Prediction of Storm Surge and Runoff Combined Inundation. J. Coast. Res. 2011, 164, 1150–1154. [Google Scholar]
- Martyr, R.C.; Dietrich, J.C.; Westerink, J.J.; Kerr, P.C.; Dawson, C.; Smith, J.M.; Pourtaheri, H.; Powell, N.; Van Ledden, M.; Tanaka, S.; et al. Simulating Hurricane Storm Surge in the Lower Mississippi River under Varying Flow Conditions. J. Hydraul. Eng. 2013, 139, 492–501. [Google Scholar] [CrossRef]
- Dresback, K.M.; Fleming, J.M.; Blanton, B.O.; Kaiser, C.; Gourley, J.J.; Tromble, E.M.; Luettich, R.A., Jr.; Kolar, R.L.; Hong, Y.; Van Cooten, S.; et al. Skill assessment of a real-time forecast system utilizing a coupled hydrologic and coastal hydrodynamic model during Hurricane Irene (2011). Cont. Shelf Res. 2013, 71, 78–94. [Google Scholar] [CrossRef]
- Bennett, S.; Mojica, R. Hurricane Georges Preliminary Storm Report: From the Tropical Atlantic to the United States Virgin Islands and Puerto Rico; National Oceanic and Atmosphere Administration, National Weather Service, Weather Forecast Office: San Juan, Puerto Rico, 2009. Available online: http://www.srh.noaa.gov/sju/?n=1998_georges (accessed on 3 August 2016).
- Guiney, J.L. Preliminary Report: Hurricane Georges; National Oceanic and Atmosphere Administration, National Hurricane Center: Miami, FL, USA, 1999.
- National Center for Environmental Information. NEXRAD Inventory: TJUA—San Juan Puerto Rico; National Oceanic and Atmosphere Administration, U.S. Department of Commerce: Asheville, NC, USA, 2016. Available online: http://www.ncdc.noaa.gov/nexradinv/chooseday.jsp?id=TJUA&Submit=Submits (accessed on 15 February 2016).
- Puerto Rico Center for Municipal Revenue. Revision of Hydrographic Layer of CRIM Basemap; Puerto Rico Office of Management and Budget: San Juan, Puerto Rico, 2006. Available online: http://gis.otg.pr.gov/Downloads/Hydrography/Hidrografia_CRIM_OGP.zip (accessed on 5 February 2016).
- Puerto Rico Planning Board. Cubierta de Suelos, 2006; State Department of Puerto Rico: San Juan, Puerto Rico, 2006. Available online: http://www2.pr.gov/agencias/gis/descargaGeodatos/ambientales/Pages/Usos-y-cubierta-de-suelos.aspx (accessed on 15 February 2016).
- Downer, C.W.; Ogden, F.L. Gridded Surface Subsurface Hydrologic Analysis (GSSHA) User’s Manual; ERDC/CHL SR-06-1; U.S. Army Engineer Research and Development Center: Vicksburg, MS, USA, 2006. [Google Scholar]
- Downer, C.W.; Nelson, E.J.; Byrd, A. Primer: Using Watershed Modeling System (WMS) for Gridded Surface Subsurface Hydrologic Analysis (GSSHA) Data Development—WMS 6.1 and GSSHA 1.43C; ERDC/CHL TR-03-2; U.S. Army Engineer Research and Development Center: Vicksburg, MS, USA, 2002. [Google Scholar]
- Bedient, P.B.; Huber, W.C.; Vieux, B.E. Hydrology and Floodplain Analysis, 4th ed.; Prentice Hall: Upper Saddle, NJ, USA, 2008. [Google Scholar]
- Coastal and Hydraulic Laboratory. GSSHA Overview; U.S. Army Engineer Research and Development Center: Vicksburg, MS, USA, 2006; Available online: http://chl.erdc.usace.army.mil/chl.aspx?p=s&a=ARTICLES;528 (accessed on 7 June 2016).
- Taylor, L.A.; Eakins, B.W.; Carignan, K.S.; Warnken, R.R.; Sazonova, T. Digital Elevation Models of Puerto Rico: Procedures, Data Sources and Analysis; NOAA Technical Memorandum NESDIS NGDC-13; National Geophysical Data Center: Boulder, CO, USA, 2008.
- U.S. Army Corps of Engineers, St. Louis District. 2004 USACE Puerto Rico Lidar; NOAA’s Ocean Service, Office for Coastal Management: Charleston, SC, USA, 2007.
- Natural Resources Conservation Service. Soil Survey Geographic (SSURGO) Database for Puerto Rico, all Regions; United States Department of Agriculture: Washington, DC, USA, 2004. Available online: http://www2.pr.gov/agencias/gis/descargaGeodatos/ambientales/Pages/Tipos-de-suelo.aspx (accessed on 15 February 2016).
- Rawls, W.J.; Brakensiek, D.L.; Miller, N. Green-Ampt Infiltration Parameters from Soil Data. J. Hydraul. Eng. 1983, 109, 62–70. [Google Scholar] [CrossRef]
- Roche, A.; Vasquez, M. An Evaluation of WSR-88D Rainfall Estimates across Puerto Rico during Hurricane Debbie; NEXRAD Weather Forecast Office San Juan: Carolina, Puerto Rico, 2000.
- Phillips, J.V.; Tadayon, S. Selection of Manning’s Roughness Coefficient for Natural and Constructed Vegetated and Non-Vegetated Channels and Vegetation Maintenance Plan Guidelines for Vegetated Channels in Central Arizona; U.S. Geological Survey: Reston, VA, USA, 2006.
- Houghtalen, R.J.; Osman, A.; Hwang, N.H. Fundamentals of Hydraulic Engineering Systems, 4th ed.; Person Education Inc.: Upper Saddle River, NJ, USA, 2013. [Google Scholar]
- Federal Emergency Management Agency. Flood Insurance Study for Puerto Rico; Commonwealth of Puerto Rico and Municipalities: Jacksonville, FL, USA, 2009.
- Halgren, J. TREX-SMA: A Multi-Event Hybrid Hydrologic Model Applied at California Gulch, Colorado. Ph.D. Thesis, Colorado State University, Fort Collins, CO, USA, 2012. [Google Scholar]
- Kalyanapu, A.J.; Burian, S.J.; McPherson, T.N. Effect of land use-based surface roughness on hydrologic model output. J. Spat. Hydrol. 2009, 9, 51–71. [Google Scholar]
- Dietrich, J.C.; Zijlema, M.; Westerink, J.J.; Holthuijsen, L.H.; Dawson, C.; Luettich, R.A.; Jensen, R.E.; Smith, J.M.; Stelling, G.S.; Stone, G.W. Modeling Hurricane Waves and Storm Surge Using Integrally-Coupled, Scalable Computations. Coast. Eng. 2011, 58, 45–65. [Google Scholar] [CrossRef]
- Zijlema, M. Computation of wind wave spectra in coastal waters with SWAN on unstructured grids. Coast. Eng. 2010, 57, 267–277. [Google Scholar] [CrossRef]
- Westerink, J.J.; Luettich, R.A.; Feyen, J.C.; Atkinson, J.H.; Dawson, C.; Roberts, H.J.; Powell, M.D.; Dunion, J.P.; Kubatko, E.J.; Pourtaheri, H. A Basin- to Channel-Scale Unstructured Grid Hurricane Storm Surge Model Applied to Southern Louisiana. Mon. Weather Rev. 2008, 136, 833–864. [Google Scholar] [CrossRef]
- Bunya, S.; Dietrich, J.C.; Westerink, J.J.; Ebersole, B.A.; Smith, J.M.; Atkinson, J.H.; Jensen, R. A High-Resolution Coupled Riverine Flow, Tide, Wind, Wind Wave and Storm Surge Model for Southern Louisiana and Mississippi. Part I: Model Development and Validation. Mon. Weather Rev. 2010, 138, 345–377. [Google Scholar] [CrossRef]
- Funakoshi, Y.; Hagen, S.C.; Bacopoulos, P. Coupling of Hydrodynamic and Wave Models: Case Study for Hurricane Floyd (1999) Hindcast. J. Waterw. Port C. ASCE 2008, 134, 321–335. [Google Scholar] [CrossRef]
- Gonzalez-Lopez, J.; Westerink, J.J.; Canals, M.; Morell, J.M. Coupled global wind and tide driven coastal water levels and currents in Puerto Rico and the U.S. Virgin Islands. In Proceedings of the OCEANS 2015—MTS/IEEE Washington, Washington, DC, USA, 19–22 October 2015; pp. 1–6. [Google Scholar]
- Hope, M.E.; Westerink, J.J.; Kennedy, A.B.; Kerr, P.C.; Dietrich, J.C.; Dawson, C.; Bender, C.J. Hindcast and Validation of Hurricane Ike (2008) Waves, Forerunner and Storm Surge. J. Geophys. Res. Oceans 2013, 118, 4424–4460. [Google Scholar] [CrossRef]
- Bilskie, M.V.; Hagen, S.C.; Medeiros, S.C.; Cox, A.T.; Salisbury, M. Data and numerical analysis of astronomic tides, wind-waves and hurricane storm surge along the northern Gulf of Mexico. J. Geophys. Res. Oceans 2016, 121, 3625–3658. [Google Scholar] [CrossRef]
- González-López, J. Regional and Coastal Hydrodynamics of Puerto Rico, the U.S. Virgin Islands and the Caribbean Sea. Ph.D. Thesis, University of Notre Dame, Notre Dame, IN, USA, December 2015. [Google Scholar]
- Giri, C.; Ochieng, E.; Tieszen, L.L.; Zhu, Z.; Singh, A.; Loveland, T.; Masek, J.; Duke, N. Status and distribution of mangrove forests of the world using earth observation satellite data. Glob. Ecol. Biogeogr. 2011, 20, 154–159. [Google Scholar] [CrossRef]
- Kendall, M.; Monaco, M.; Buja, K.; Christensen, J.; Kruer, C.; Finkbeiner, M.; Warner, R. Methods Used to Map the Benthic Habitats of Puerto Rico and the U.S. Virgin Islands. Benthic Habitats of Puerto Rico and the U.S. Virgin Islands; U.S. National Oceanic and Atmospheric Administration, National Ocean Service, National Centers for Coastal Ocean Science Biogeography Program: Silver Spring, MD, USA, 2001.
- Bhaskaran, P.K.; Nayak, S.; Bonthu, S.R.; Murty, P.L.N.; Sen, S. Performance and Validation of a Coupled Parallel ADCIRC-SWAN Model for THANE Cyclone in the Bay of Bengal. Environ. Fluid Mech. 2013. [Google Scholar] [CrossRef]
- Fleming, J.G.; Fulcher, C.W.; Luettich, R.A.; Estrade, B.D.; Allen, G.D.; Winer, H.S. A Real Time Storm Surge Forecasting System Using ADCIRC. In Proceedings of the 10th International Conference on Estuarine and Coastal Modeling, Newport, RI, USA, 5–7 November 2007; pp. 893–912. [Google Scholar]
- Egbert, G.D.; Bennett, A.F.; Foreman, M.G.G. TOPEX/POSEIDON Tides Estimated Using a Global Inverse Model. J. Geophys. Res. 1994, 99, 24821. [Google Scholar] [CrossRef]
- Westerink, J.J.; Luettich, R.A.; Baptista, A.M.; Schener, N.W.; Farrar, P. Tide and Storm Surge Predictions Using Finite Element Model. J. Hydraul. Eng. 1992, 118, 1373–1390. [Google Scholar] [CrossRef]
- Holland, G.J. An analytic model of the wind and pressure profiles in hurricanes. Mon. Weather Rev. 1980, 108, 1212–1218. [Google Scholar] [CrossRef]
- National Oceanic and Atmosphere Administration. San Juan, La Puntilla, San Juan Bay, PR—Station ID: 9755371: Tides and Currents; Center for Operational Oceanographic Products and Services: Washington, DC, USA, 2016. Available online: https://tidesandcurrents.noaa.gov/stationhome.html?id=9755371 (accessed on 10 March 2016).
- Haan, C.T. Statistical Methods in Hydrology, 2nd ed.; Iowa State Press: Iowa City, IA, USA, 2002. [Google Scholar]
© 2018 by the authors. Licensee MDPI, Basel, Switzerland. This article is an open access article distributed under the terms and conditions of the Creative Commons Attribution (CC BY) license (http://creativecommons.org/licenses/by/4.0/).