Comparison of SWAT and GSSHA for High Time Resolution Prediction of Stream Flow and Sediment Concentration in a Small Agricultural Watershed
Abstract
:1. Introduction
2. Materials and Methods
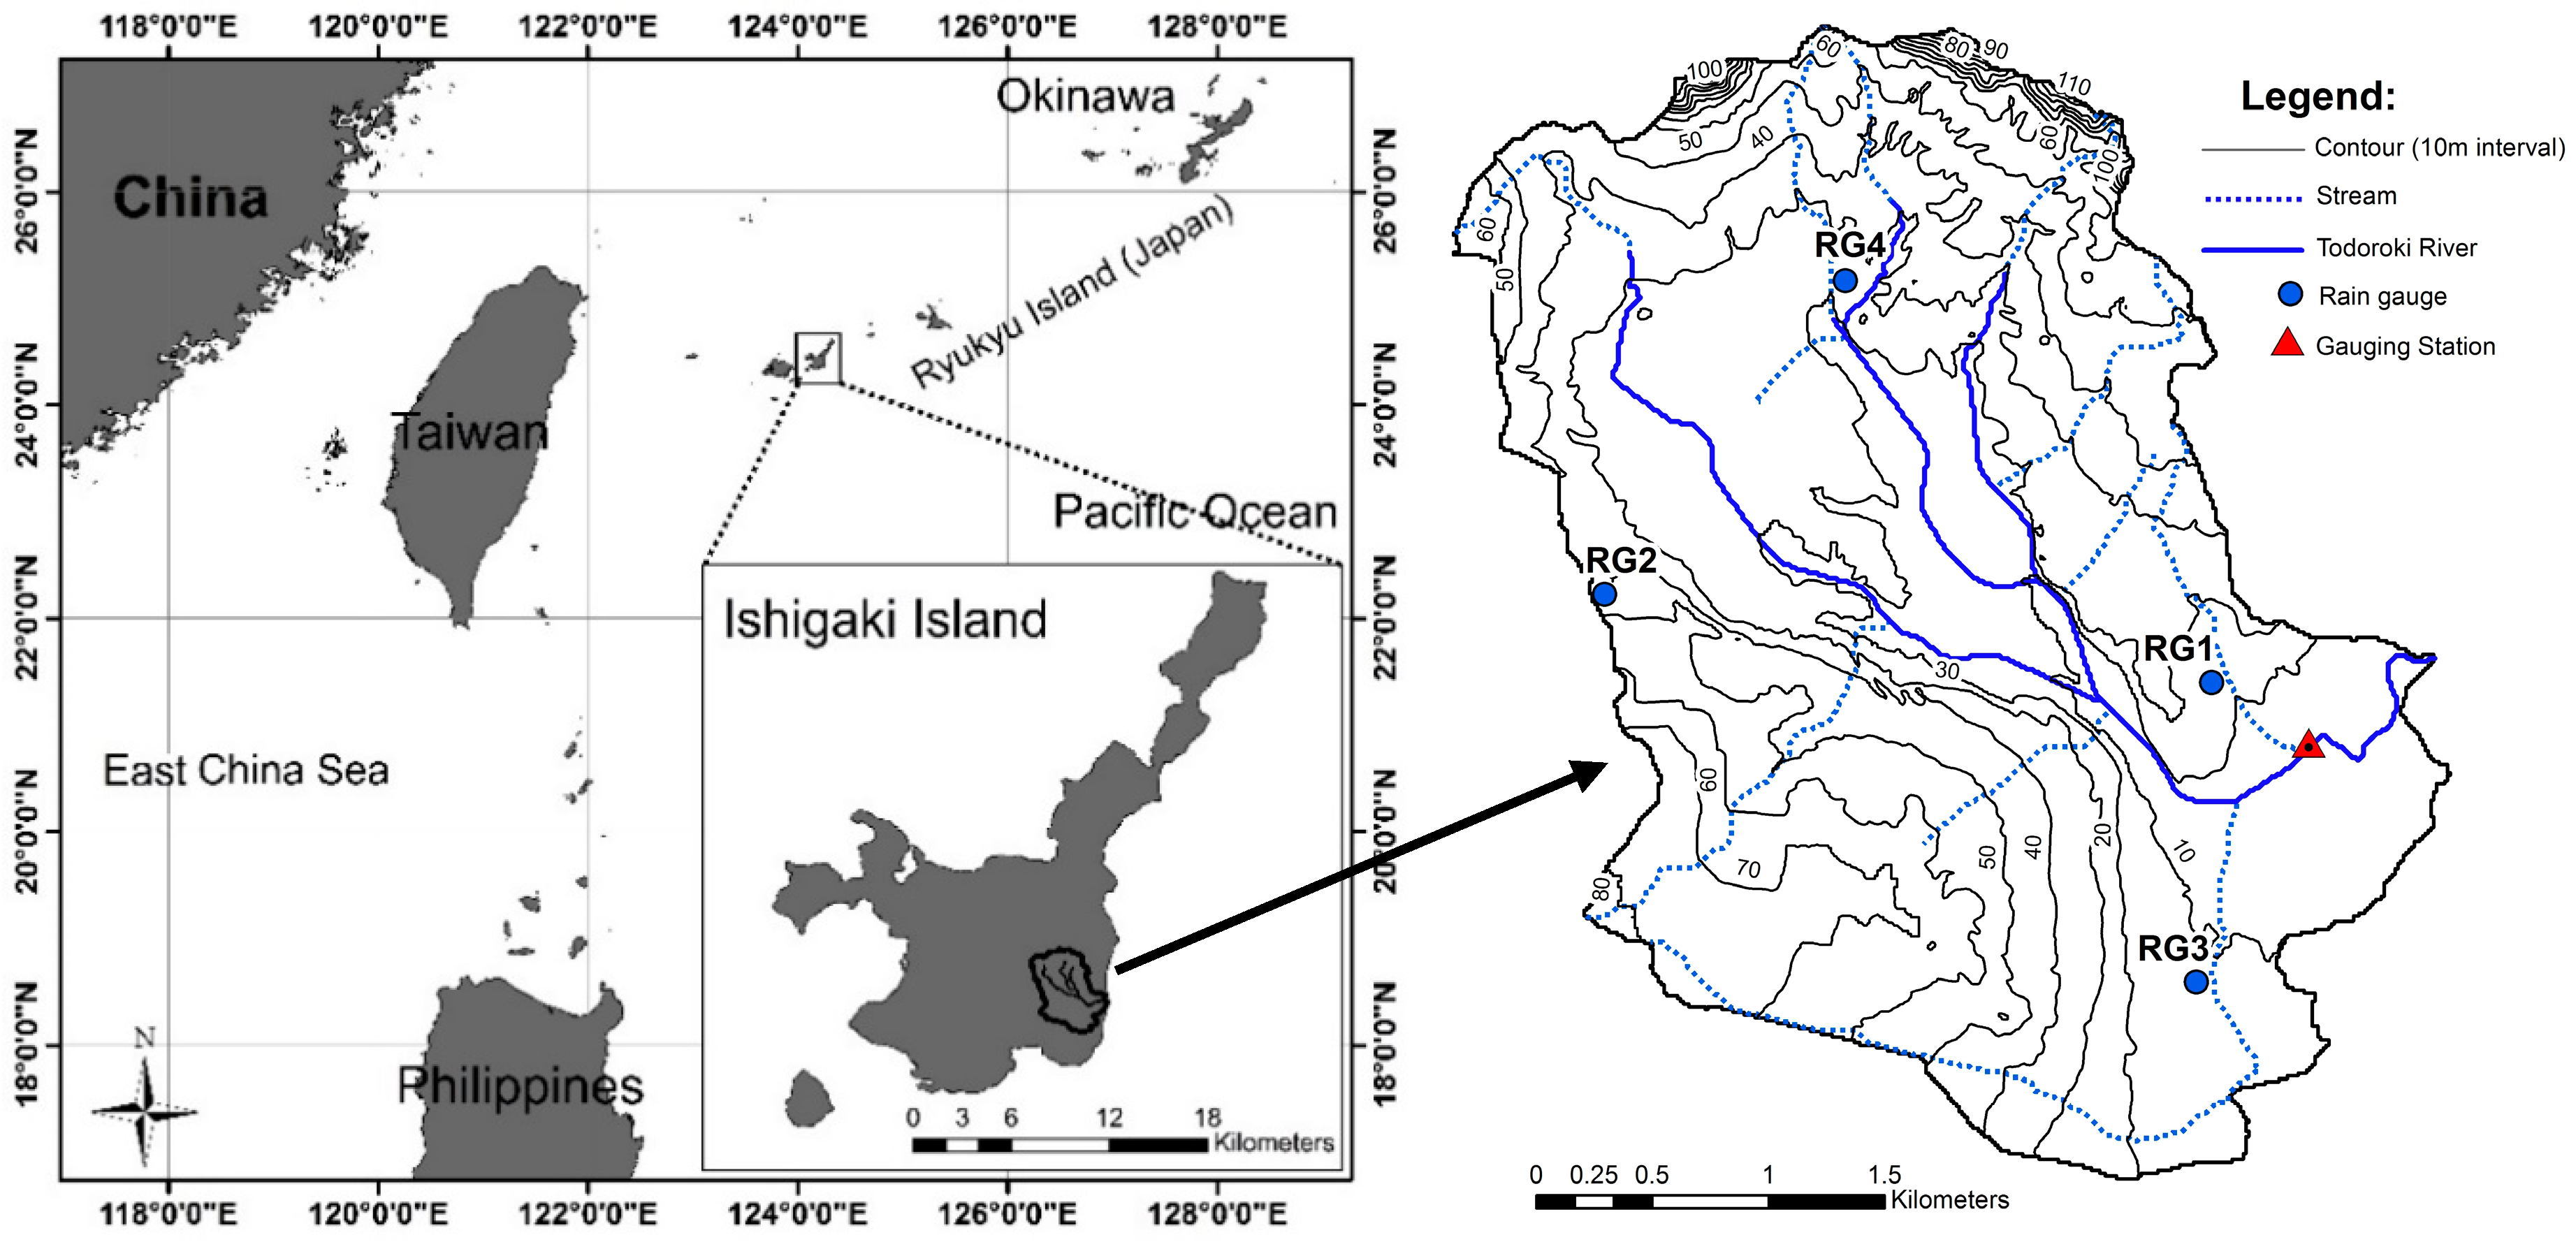
2.1. Study Area
2.2. Monitoring and Sources of Data
2.3. Model Descriptions
2.4. Model Setup and Evaluation
3. Results and Discussion
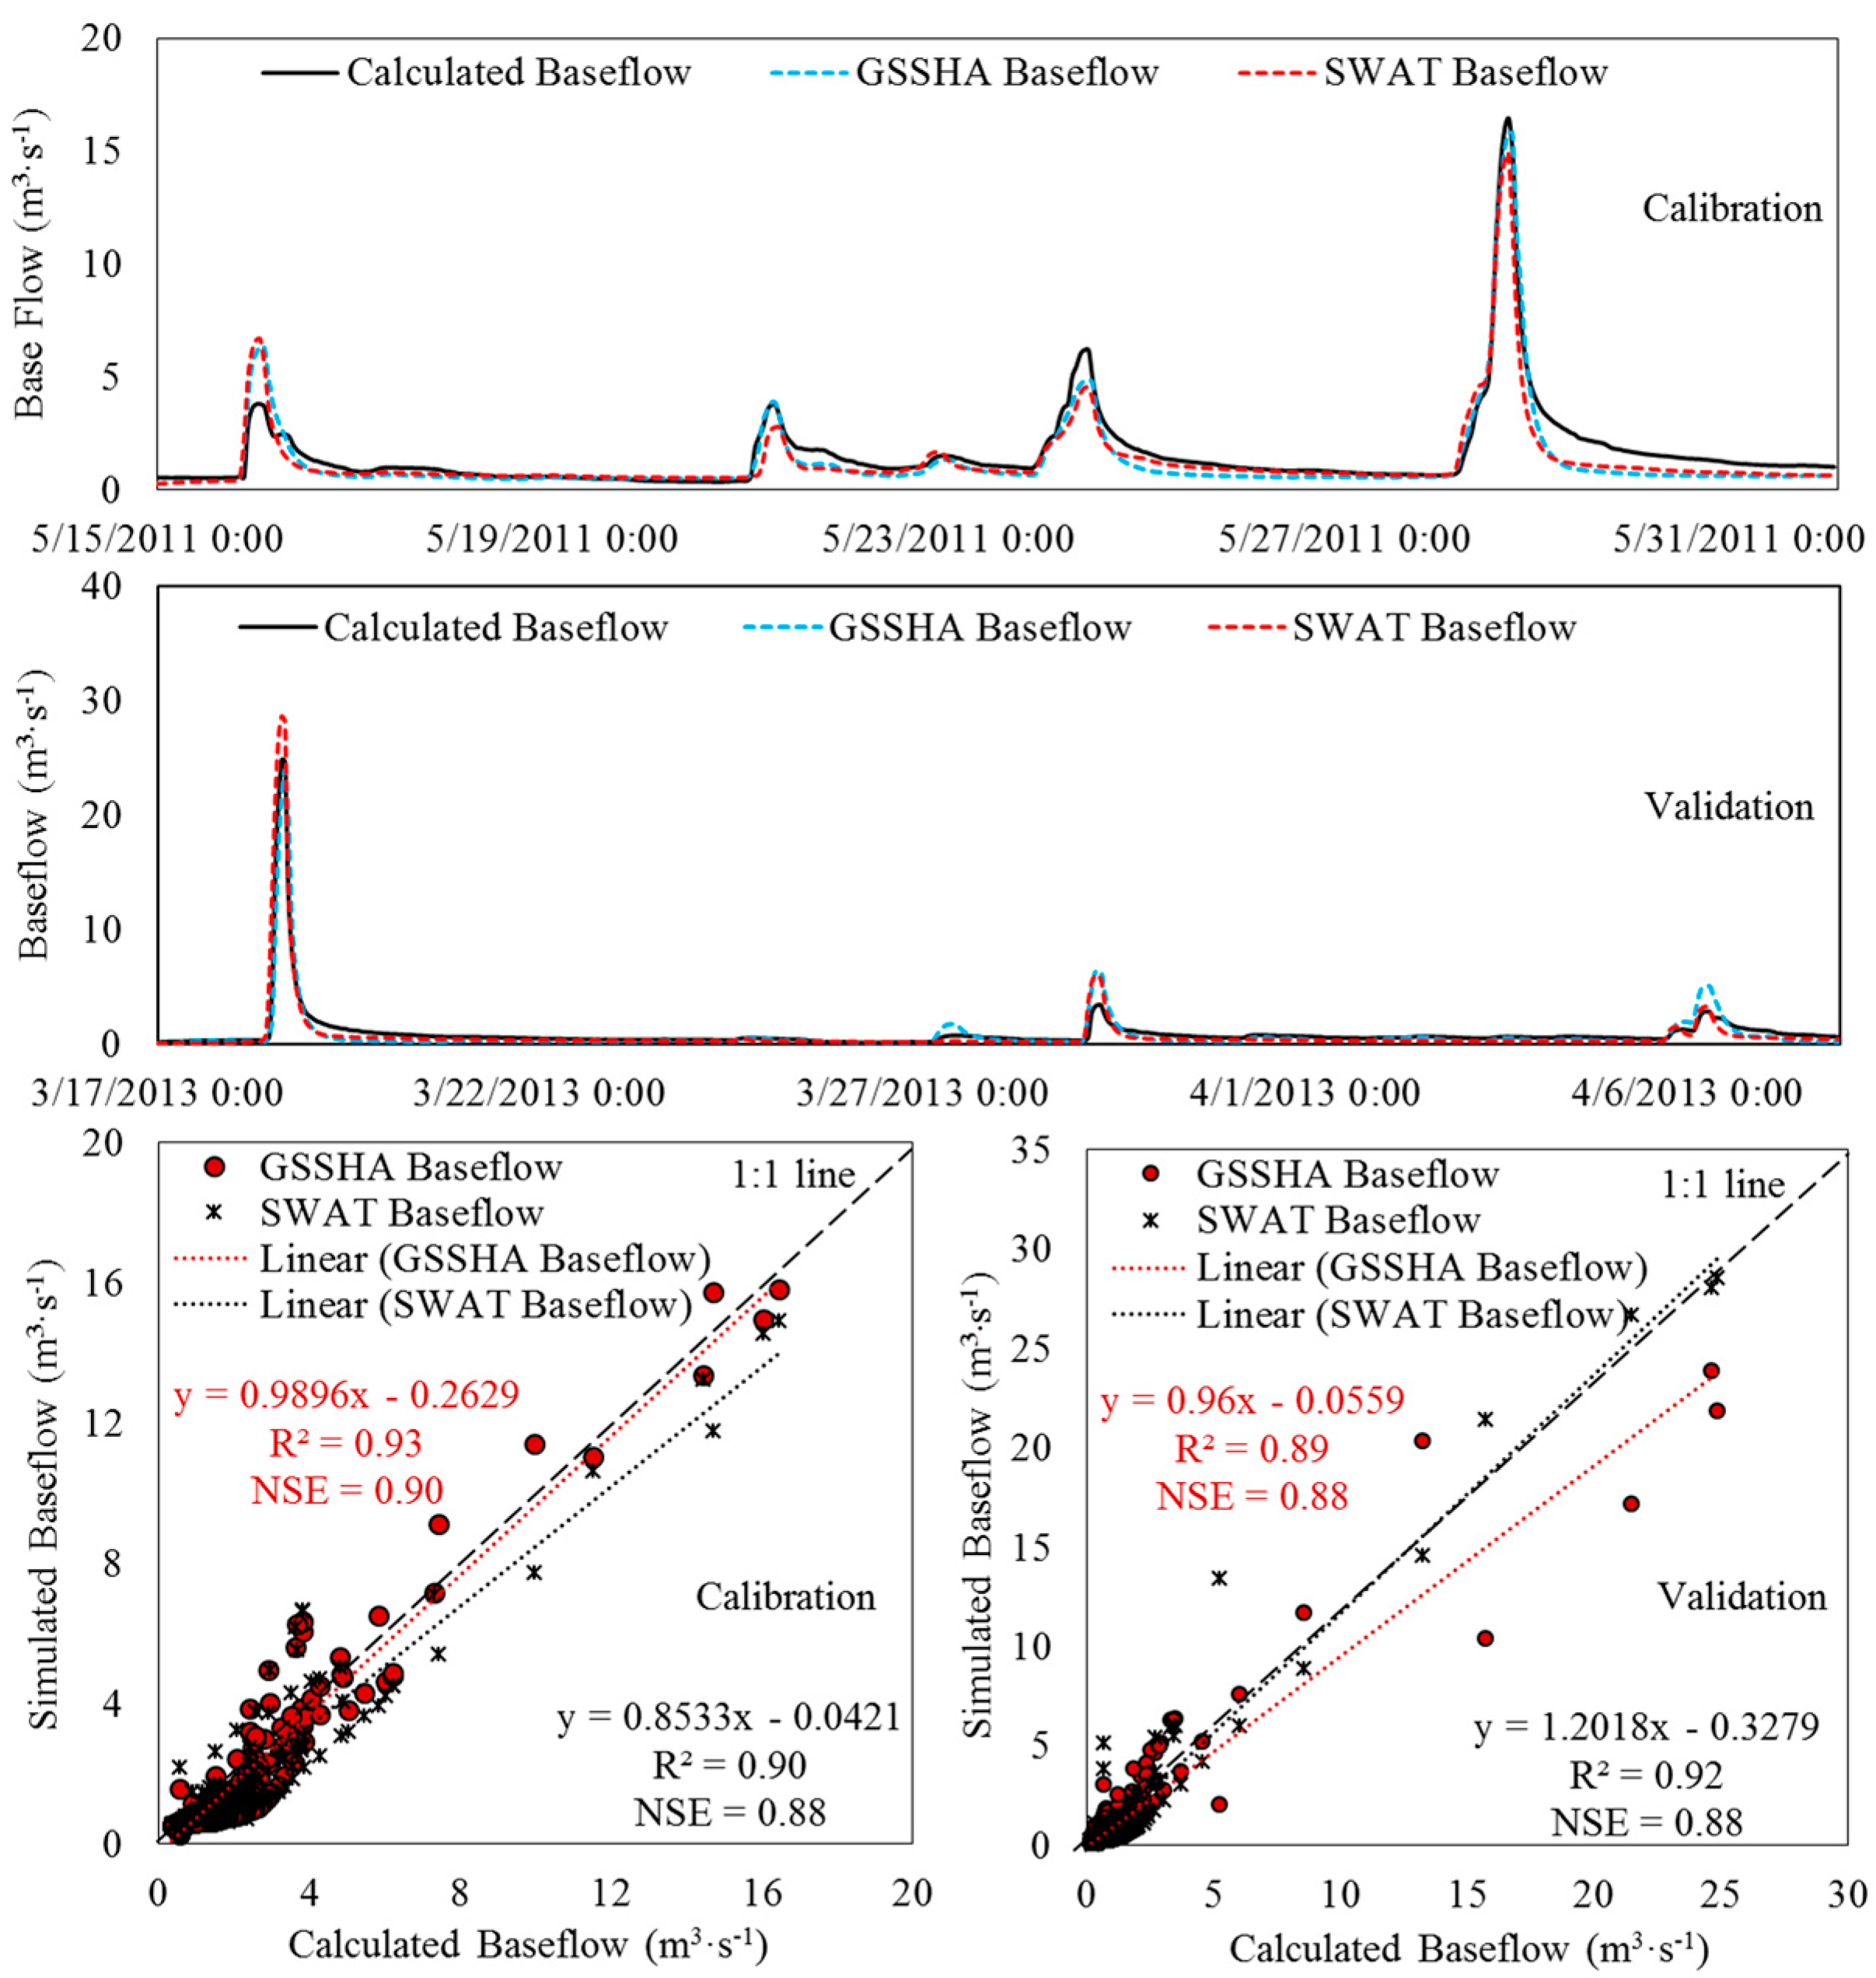
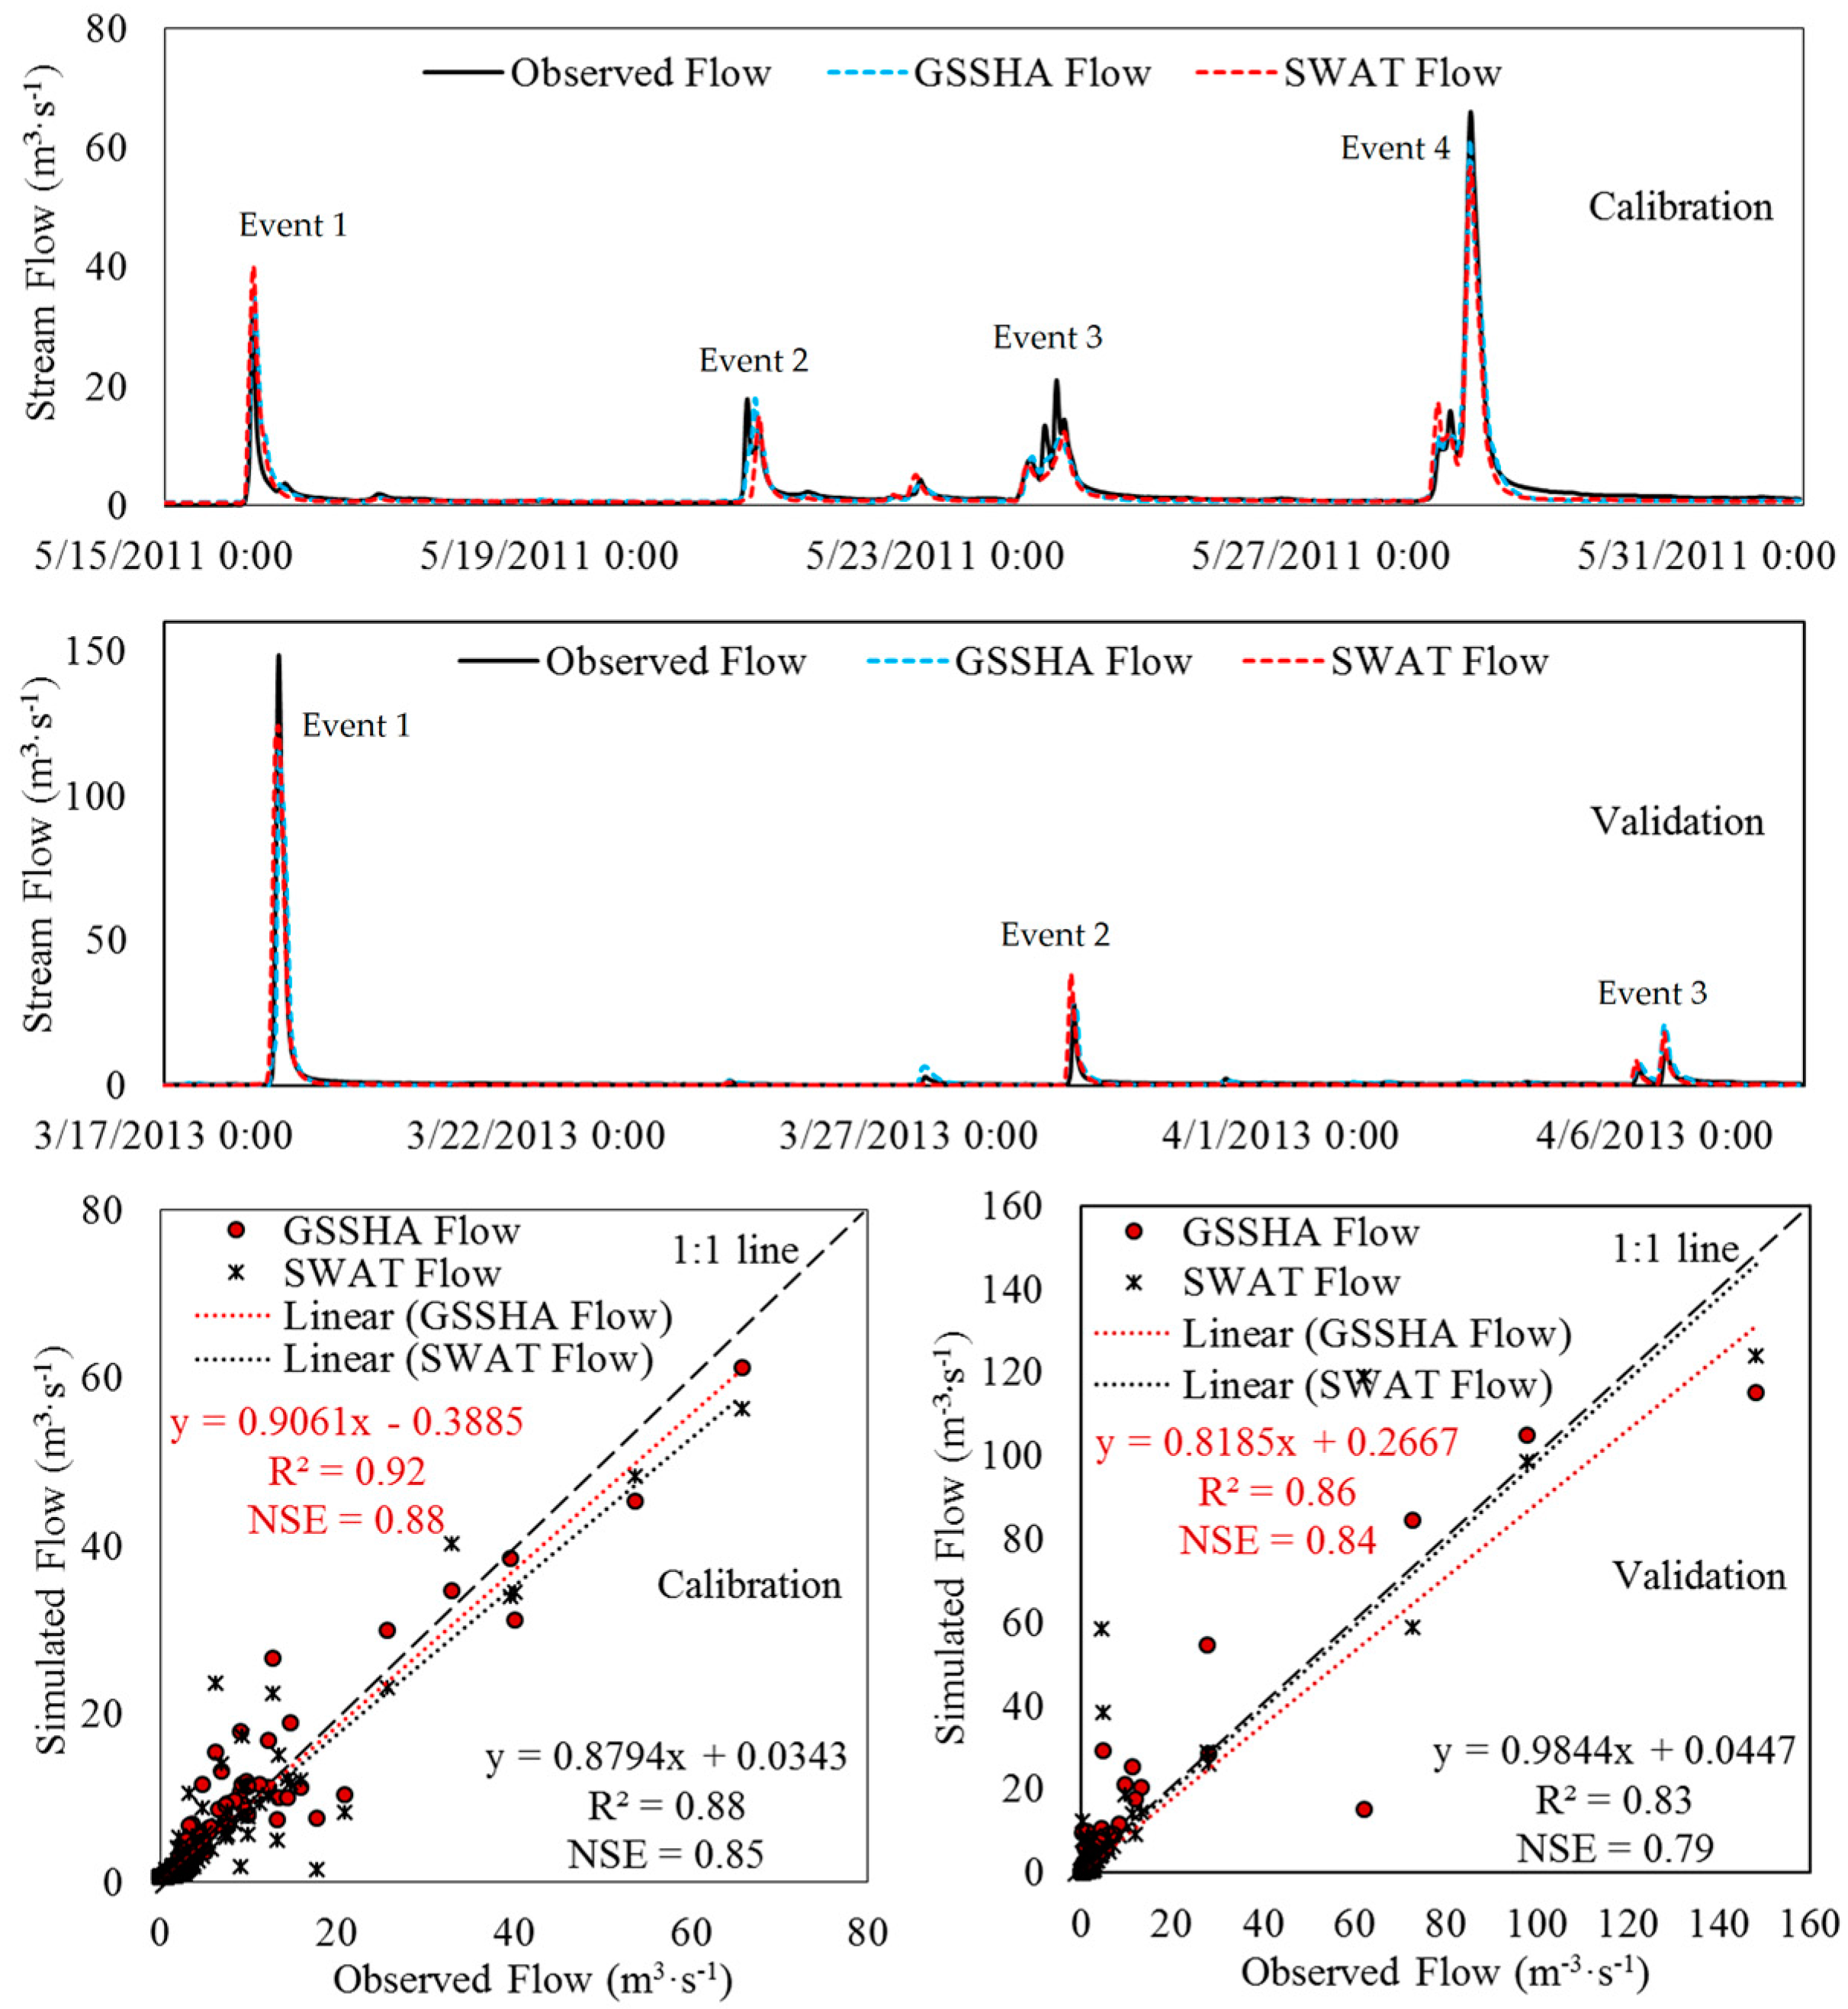
3.1. Simulation of Baseflow and Stream Flow
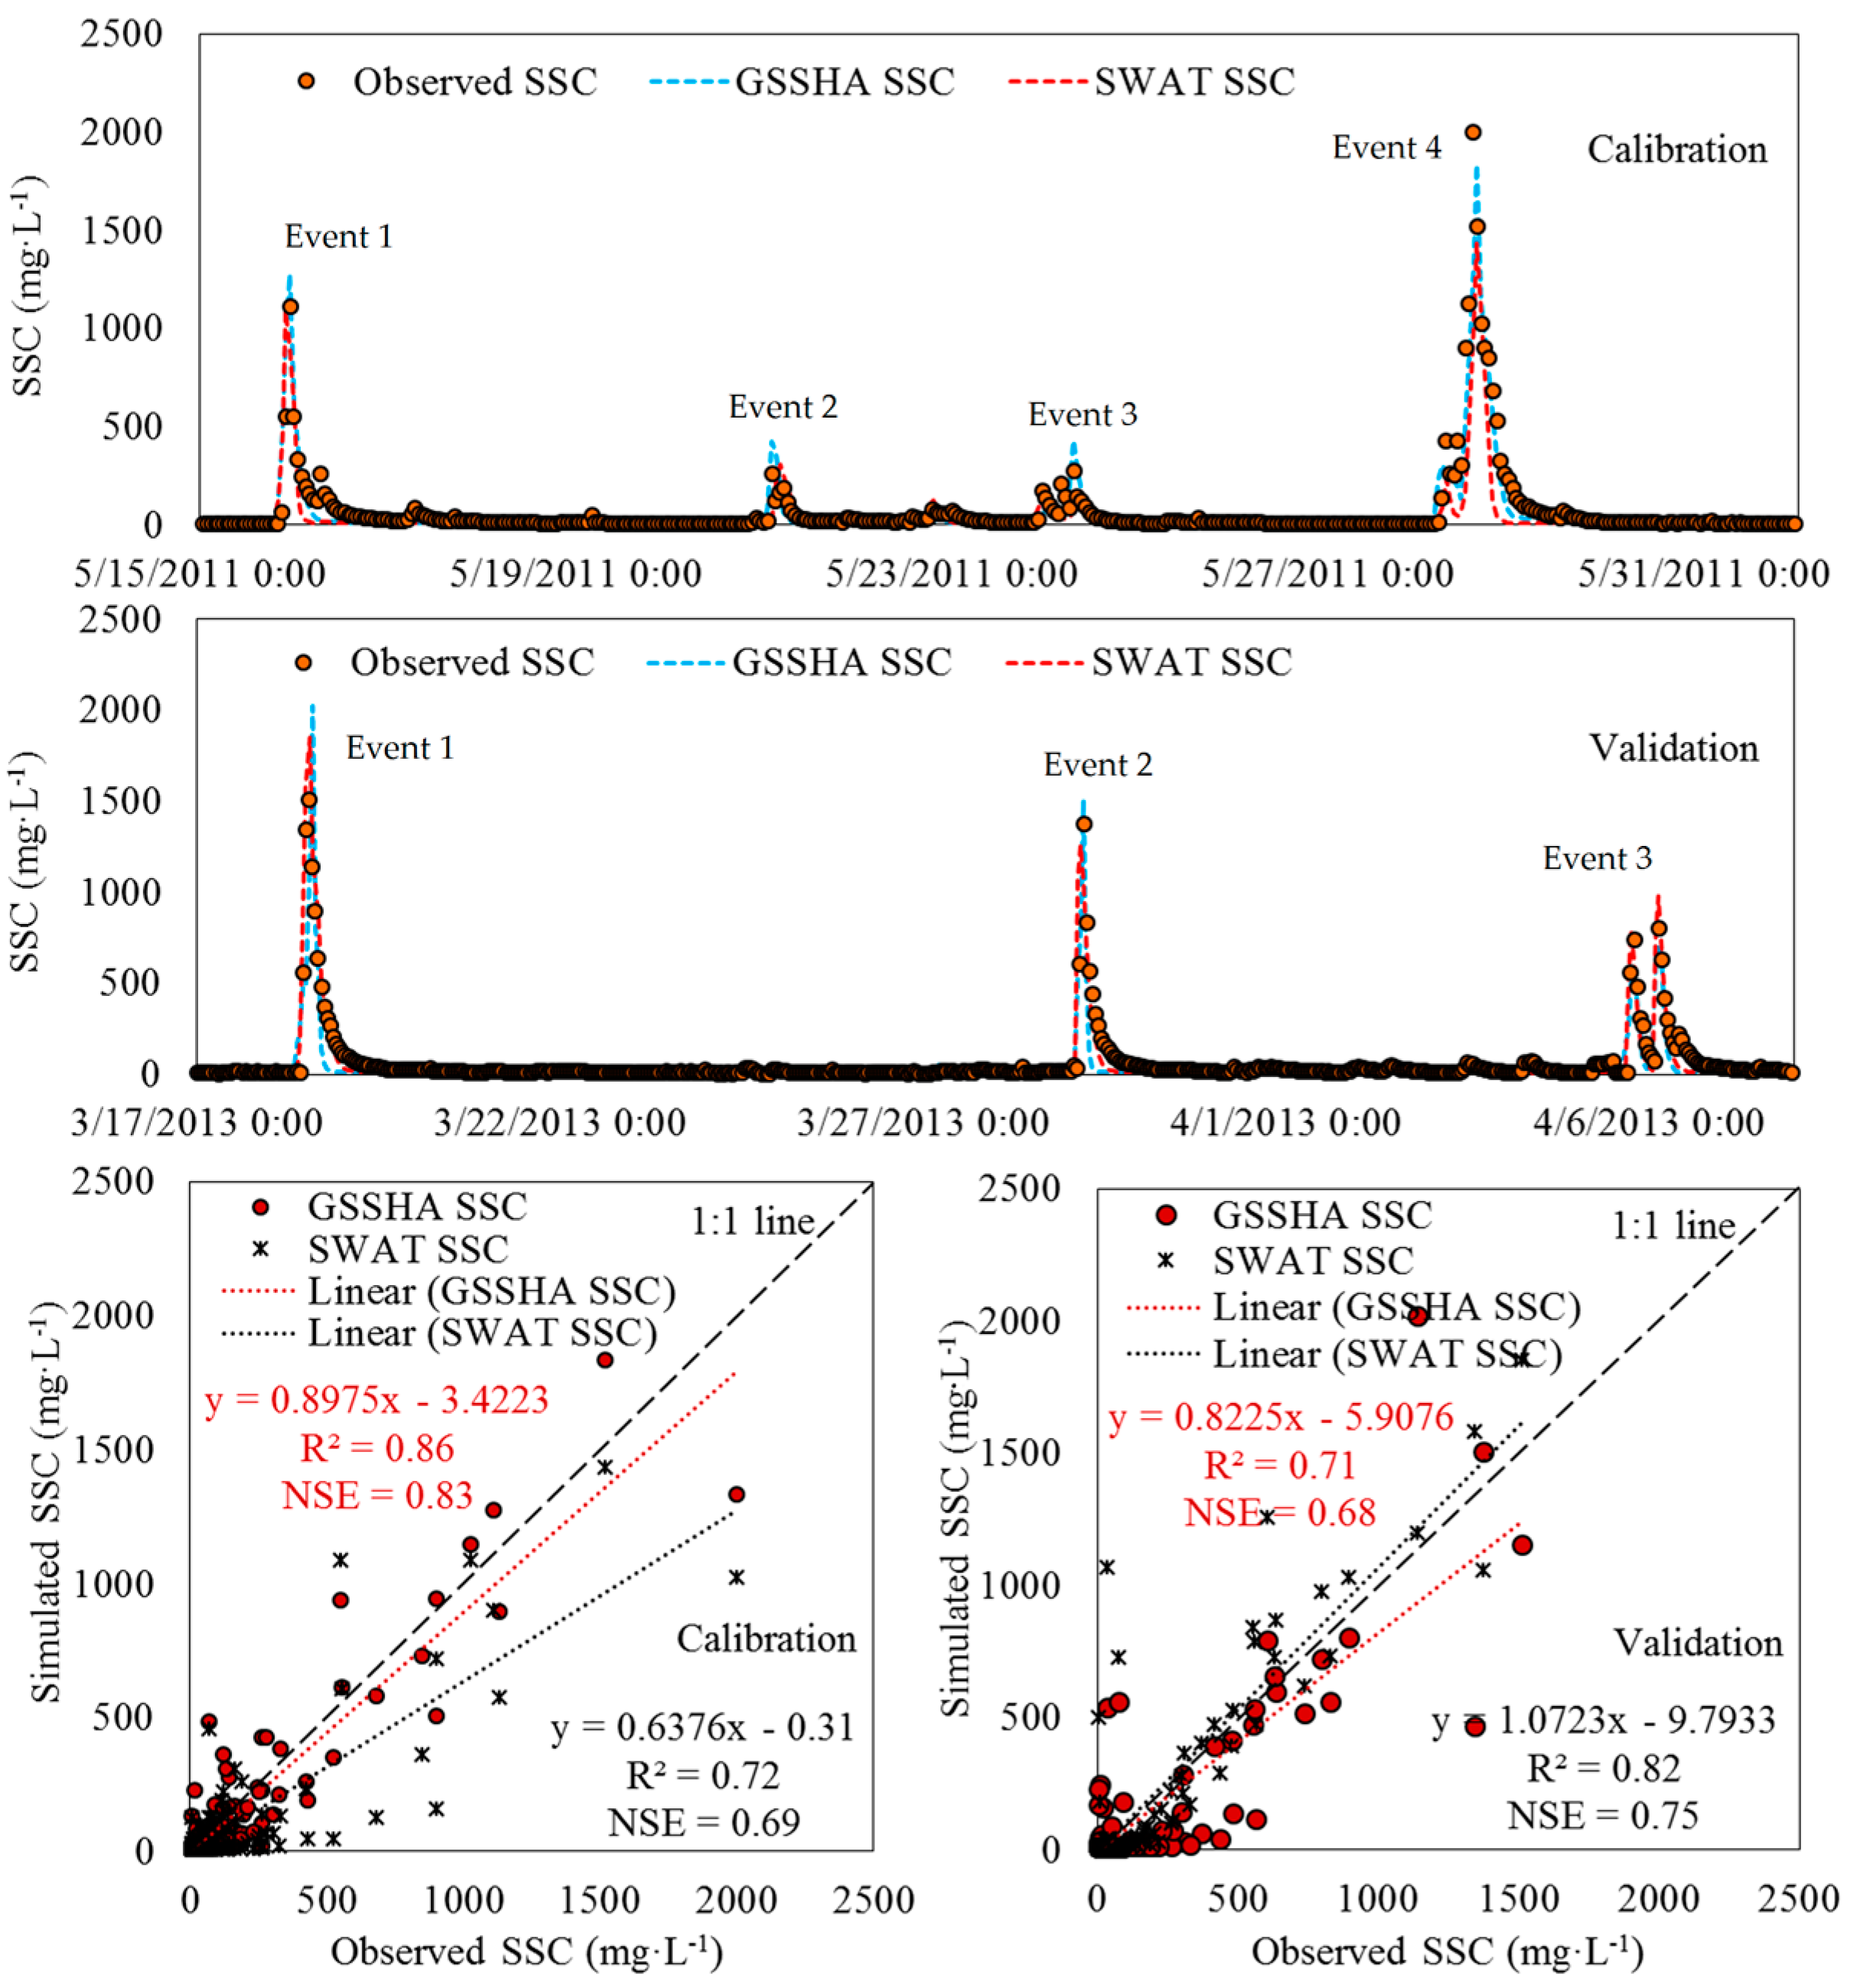
3.2. Sediment Concentration
3.3. Evaluation of Model Performance for Long-Term Simulation
4. Conclusions
Acknowledgments
Author Contributions
Conflicts of Interest
References
- Bobba, A.G.; Singh, V.P.; Bengtsson, L. Application of environmental models to different hydrological systems. Ecol. Model. 2000, 125, 15–49. [Google Scholar] [CrossRef]
- Borah, D.K.; Bera, M. Watershed-scale hydrologic and nonpoint-source pollution models: Review of mathematical bases. Trans. ASAE 2003, 46, 1553–1566. [Google Scholar] [CrossRef]
- Borah, D.K.; Arnold, J.G.; Bera, M.; Krug, E.C.; Liang, X.Z. Storm event and continuous hydrologic modeling for comprehensive and efficient watershed simulations. J. Hydrol. Eng. 2007, 12, 605–616. [Google Scholar] [CrossRef]
- Shen, Z.Y.; Gong, Y.W.; Li, Y.H.; Hong, Q.; Xu, L.; Liu, R.M. A comparison of WEPP and SWAT for modeling soil erosion of the Zhangjiachong watershed in the Three Gorges reservoir area. Agric. Water Manag. 2009, 96, 1435–1442. [Google Scholar] [CrossRef]
- Paudel, M.; Nelson, E.J.; Downer, C.W.; Hotchkiss, R. Comparing the capability of distributed and lumped hydrologic models for analyzing the effects of land use change. J. Hydroinform. 2011, 13, 461–473. [Google Scholar] [CrossRef]
- Golmohammadi, G.; Prasher, S.; Madani, A.; Rudra, R. Evaluating three hydrological distributed watershed models: MIKE–SHE, APEX, SWAT. Hydrology 2014, 1, 20–39. [Google Scholar] [CrossRef]
- Downer, C.W.; Ogden, F.L.; Martin, W.D.; Harmon, R.S. Theory, development and applicability of the surface water hydrologic model CASC2D. Hydrol. Process. 2002, 16, 255–275. [Google Scholar] [CrossRef]
- Arnold, J.G.; Williams, J.R.; Srinivasan, R.; King, K.W.; Griggs, R.H. SWAT: Soil and Water Assessment Tool; USDA Agricultural Research Service: College Station, TX, USA, 1994. [Google Scholar]
- HEC 2001 HEC-HMS, User’s Mannual, Version 2.1; US Army Corps of Engineerings Hydrologic Engineering Center: Davis, CA, USA, 2001.
- Sharif, H.O.; Sparks, L.; Hassan, A.A.; Zeitler, J.; Xie, H. Application of a distributed hydrologic model to the November 17, 2004, fllod of Bull Creek watershed, Austin, Texas. J. Hydrol. Eng. 2010, 15, 651–657. [Google Scholar] [CrossRef]
- Sharif, H.O.; Hassan, A.A.; Shafique, S.B.; Xie, H.; Zeitler, J. Hydrologic modeling of an extreme flood in the Guadalupe river in Texas. J. Am. Water Resour. Assoc. 2010, 46, 881–891. [Google Scholar] [CrossRef]
- Pradhan, N.R.; Downer, C.W.; Johnson, B.E. A physics based hydrologic modeling approach to simulate non–point source pollution for the purposes of calculating TMDLs and designing abatement measures. In Practical Aspects of Computational Chemistry III; Leszczynski, J., Shukla, M.K., Eds.; Springer US: New York, NY, USA, 2014; pp. 249–282. [Google Scholar]
- Arnold, J.G.; Allen, P.M. Methods for estimating baseflow and groundwater recharge from stream flow. J. Am. Water Resour. Assoc. 1999, 35, 411–424. [Google Scholar] [CrossRef]
- Gassman, P.W.; Reyes, M.R.; Green, C.H.; Arnold, J.G. The soil and water assessment tool: Historical development, application, and future research directions. Trans. ASABE 2007, 50, 1211–1250. [Google Scholar] [CrossRef]
- Neitsch, S.L.; Arnold, J.G.; Kiniry, J.R.; Williams, J.R. Soil and Water Assessment Tool: Theoretical Documentation—Version 2009; Grassland, Soil and Water Research Laboratory, Agricultural Research Service: College Station, TX, USA, 2009; p. 618. [Google Scholar]
- Im, S.; Brannan, K.; Mostaghimi, S.; Cho, J. A comparison of SWAT and HSPF models for simulating hydrologic and water quality responses from an urbanizing watershed. In Proceedings of the 2003 ASAE Annual Meeting, Las Vegas, NV, USA, 27–30 July 2003. [Google Scholar]
- Abu El-Nasr, A.; Arnold, J.G.; Feyen, J.; Berlamont, J. Modeling the hydrology of a catchment using a distributed and a semi distributed model. Hydrol. Process. 2005, 19, 573–587. [Google Scholar] [CrossRef]
- Diluzio, M.; Arnold, J.G. Formulation of a hybrid calibration approach for a physically based distributed model with NEXRAD data input. J. Hydrol. 2004, 298, 136–154. [Google Scholar] [CrossRef]
- Jeong, J.; Kannan, N.; Arnold, J.; Glick, R.; Gosselink, L.; Srinivasa, R. Development and integration of sub-hourly rainfall-runoff modeling capability within a watershed model. Water Resour. Manag. 2010, 24, 4505–4527. [Google Scholar] [CrossRef]
- Maharjan, G.R.; Park, Y.S.; Kim, N.W.; Shin, D.S.; Choi, J.W.; Hyun, G.W.; Jeon, J.H.; Ok, Y.S.; Lim, K.J. Evaluation of SWAT sub-daily runoff estimation at small agricultural watershed in Korea. Front. Environ. Sci. Eng. 2013, 7, 109–119. [Google Scholar] [CrossRef]
- Yang, X.; Liu, Q.; He, Y.; Luo, X.; Zhang, X. Comparison of daily and sub-daily SWAT models for daily stream flow simulation in the Upper Huai River Basin of China. Stoch. Environ. Res. Risk Assess. 2016, 30, 959–972. [Google Scholar] [CrossRef]
- Chintalapudi, S.; Sharif, H.O.; Xie, H. Sensitivity of distributed hydrlogic simulations to ground and satellite based rainfall products. Water 2014, 6, 1221–1245. [Google Scholar] [CrossRef]
- Saha, G.C. Climate change induced precipitation effects on water resources in the Peace region of British Columbia, Canada. Climate 2015, 3, 264–282. [Google Scholar] [CrossRef]
- Downer, C.W.; Ogden, F.L. GSSHA: Model to simulate diverse stream flow producing processes. J. Hydrol. Eng. 2004, 9, 161–174. [Google Scholar] [CrossRef]
- Downer, C.W.; Pradhan, N.R.; Ogden, F.L.; Byrd, A.R. Testing the effects of detachment limits and transport capacity formulation on sediment runoff predictions using the U.S. Army Corps of Engineering GSSHA model. J. Hydrol. Eng. 2015, 20, 1–11. [Google Scholar] [CrossRef]
- Chow, V.T.; Maidment, D.R.; Mays, L.W. Applied Hydrology; McGrawHill: New York, NY, USA, 1998. [Google Scholar]
- Cunge, J.A. On the subject of a flood propagation method (Muskingum method). J. Hydraul. Res. 1969, 7, 205–230. [Google Scholar] [CrossRef]
- Williams, J.R. Flood routing with variable travel time or variable storage coefficients. Trans. ASABE 1969, 12, 100–103. [Google Scholar] [CrossRef]
- Arnold, J.G.; Allen, P.M.; Bernhardt, G. A comprehensive surface-groundwater flow model. J. Hydrol. 1993, 142, 47–69. [Google Scholar] [CrossRef]
- Monteith, J.L. Evaporation and the environment: In the state and movement of water in living organisms. Symp. Soc. Exp. Biol. 1965, 19, 205–234. [Google Scholar] [PubMed]
- Williams, J.R. Sediment-yield prediction with universal equation using runoff energy factor. In Present and Prospective Technology for Predicting Sediment Yield and Sources, Proceedings of the Sediment Yield Workshop, 28–30 November 1972; Agriculture Research Service, US Department of Agriculture: College Station, TX, USA, 1975; pp. 244–252. [Google Scholar]
- Jeong, J.; Kannan, N.; Arnold, J.G.; Glick, R.; Gosselink, L.; Srinivasan, R.; Harmel, R.D. Development of sub-daily erosion and sediment transport algorithms for SWAT. Trans. ASABE 2010, 54, 1685–1691. [Google Scholar] [CrossRef]
- Abbaspour, K.C. SWAT-CUP: SWAT Calibration and Uncertainty Programs—A User Manual; Swiss Federal Institute of Aquatic Science and Technology, Eawag: Dübendorf, Switzerland, 2011. [Google Scholar]
- Tolson, B.A.; Shoemaker, C.A. Dynamically dimensioned search algorithm for computationally efficient watershed model calibration. Water Resour. Res. 2007, 43, 1–16. [Google Scholar] [CrossRef]
- Santhi, C.; Arnold, J.G.; Williams, J.R.; Dugas, W.A.; Srinivasan, R.; Hauck, L.M. Validation of the SWAT model on a large river basin with point and nonpoint sources. J. Am. Water Res. Assoc. 2001, 37, 1169–1188. [Google Scholar] [CrossRef]
- Van Liew, M.W.; Garbrecht, J. Hydrological simulation of the little Washita river experimental watershed using SWAT. J. Am. Water Res. Assoc. 2003, 39, 413–426. [Google Scholar] [CrossRef]
- Nash, J.E.; Sutchliffe, J.V. River flow forecasting through conceptual models. Part 1-A discussion of principles. J. Hydrol. 1970, 10, 282–290. [Google Scholar] [CrossRef]
- Krause, P.; Boyle, D.P.; Base, F. Comparision of different efficiency criteria for hydrological model assessment. Adv. Geosci. 2005, 5, 83–87. [Google Scholar] [CrossRef]
- Lim, K.J.; Engel, B.A. WHAT: Web-based Hydrograph Analysis Tool. Available online: https://engineering.purdue.edu/mapserve/WHAT/ (accessed on 10 December 2016).
- Nearing, M.A.; Govers, G.; Norton, L.D. Variability in soil erosion data from replicated plots. Soil Sci. Soc. Am. J. 1999, 63, 1829–1835. [Google Scholar] [CrossRef]
- Bonuma, N.B.; Rossi, C.G.; Arnold, J.G.; Reichert, J.M.; Minella, J.P.; Allen, P.A.; Volk, M. Simulating landscape sediment transport capacity by using modified SWAT model. J. Environ. Qual. 2014, 43, 55–66. [Google Scholar] [CrossRef] [PubMed]
- Sith, R.; Yamamoto, T.; Watanabe, A.; Nakamura, T.; Nadaoka, K. Analysis of red soil sediment yield in a small agricultural watershed in Ishigaki Island, Japan, using long-term and high resolution monitoring data. Environ. Process. 2017, 4, 1–22. [Google Scholar] [CrossRef]

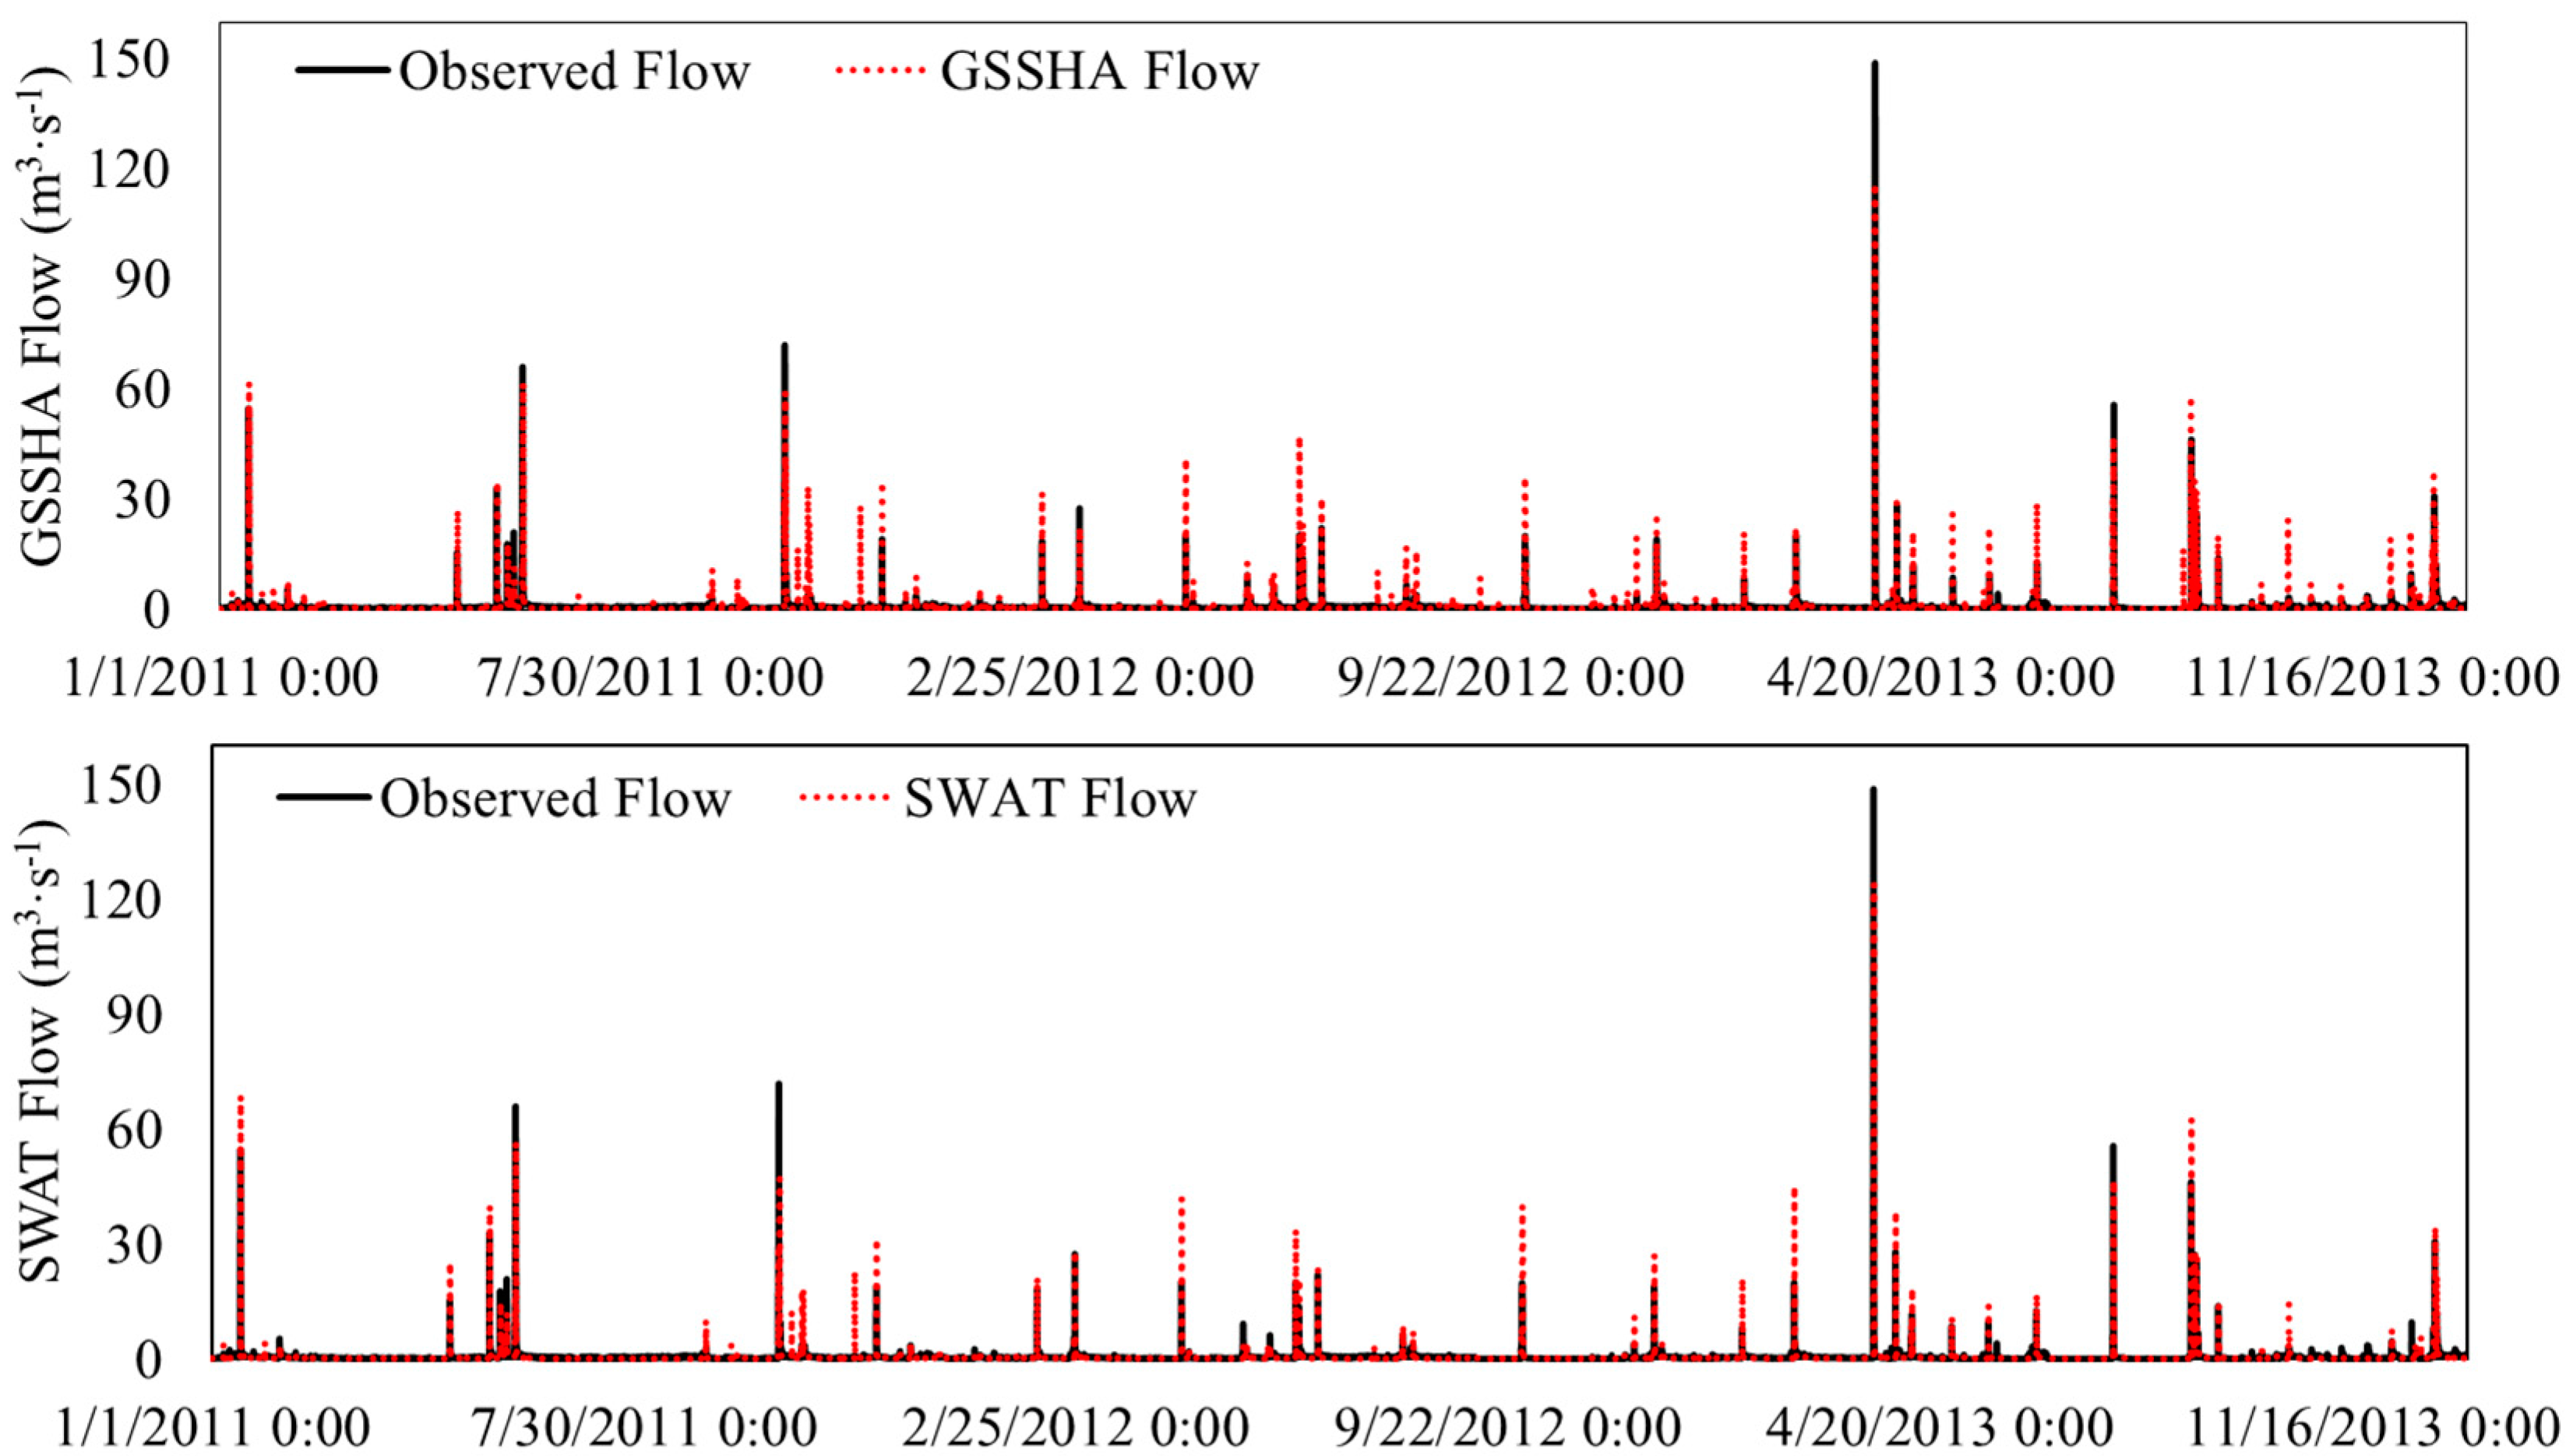
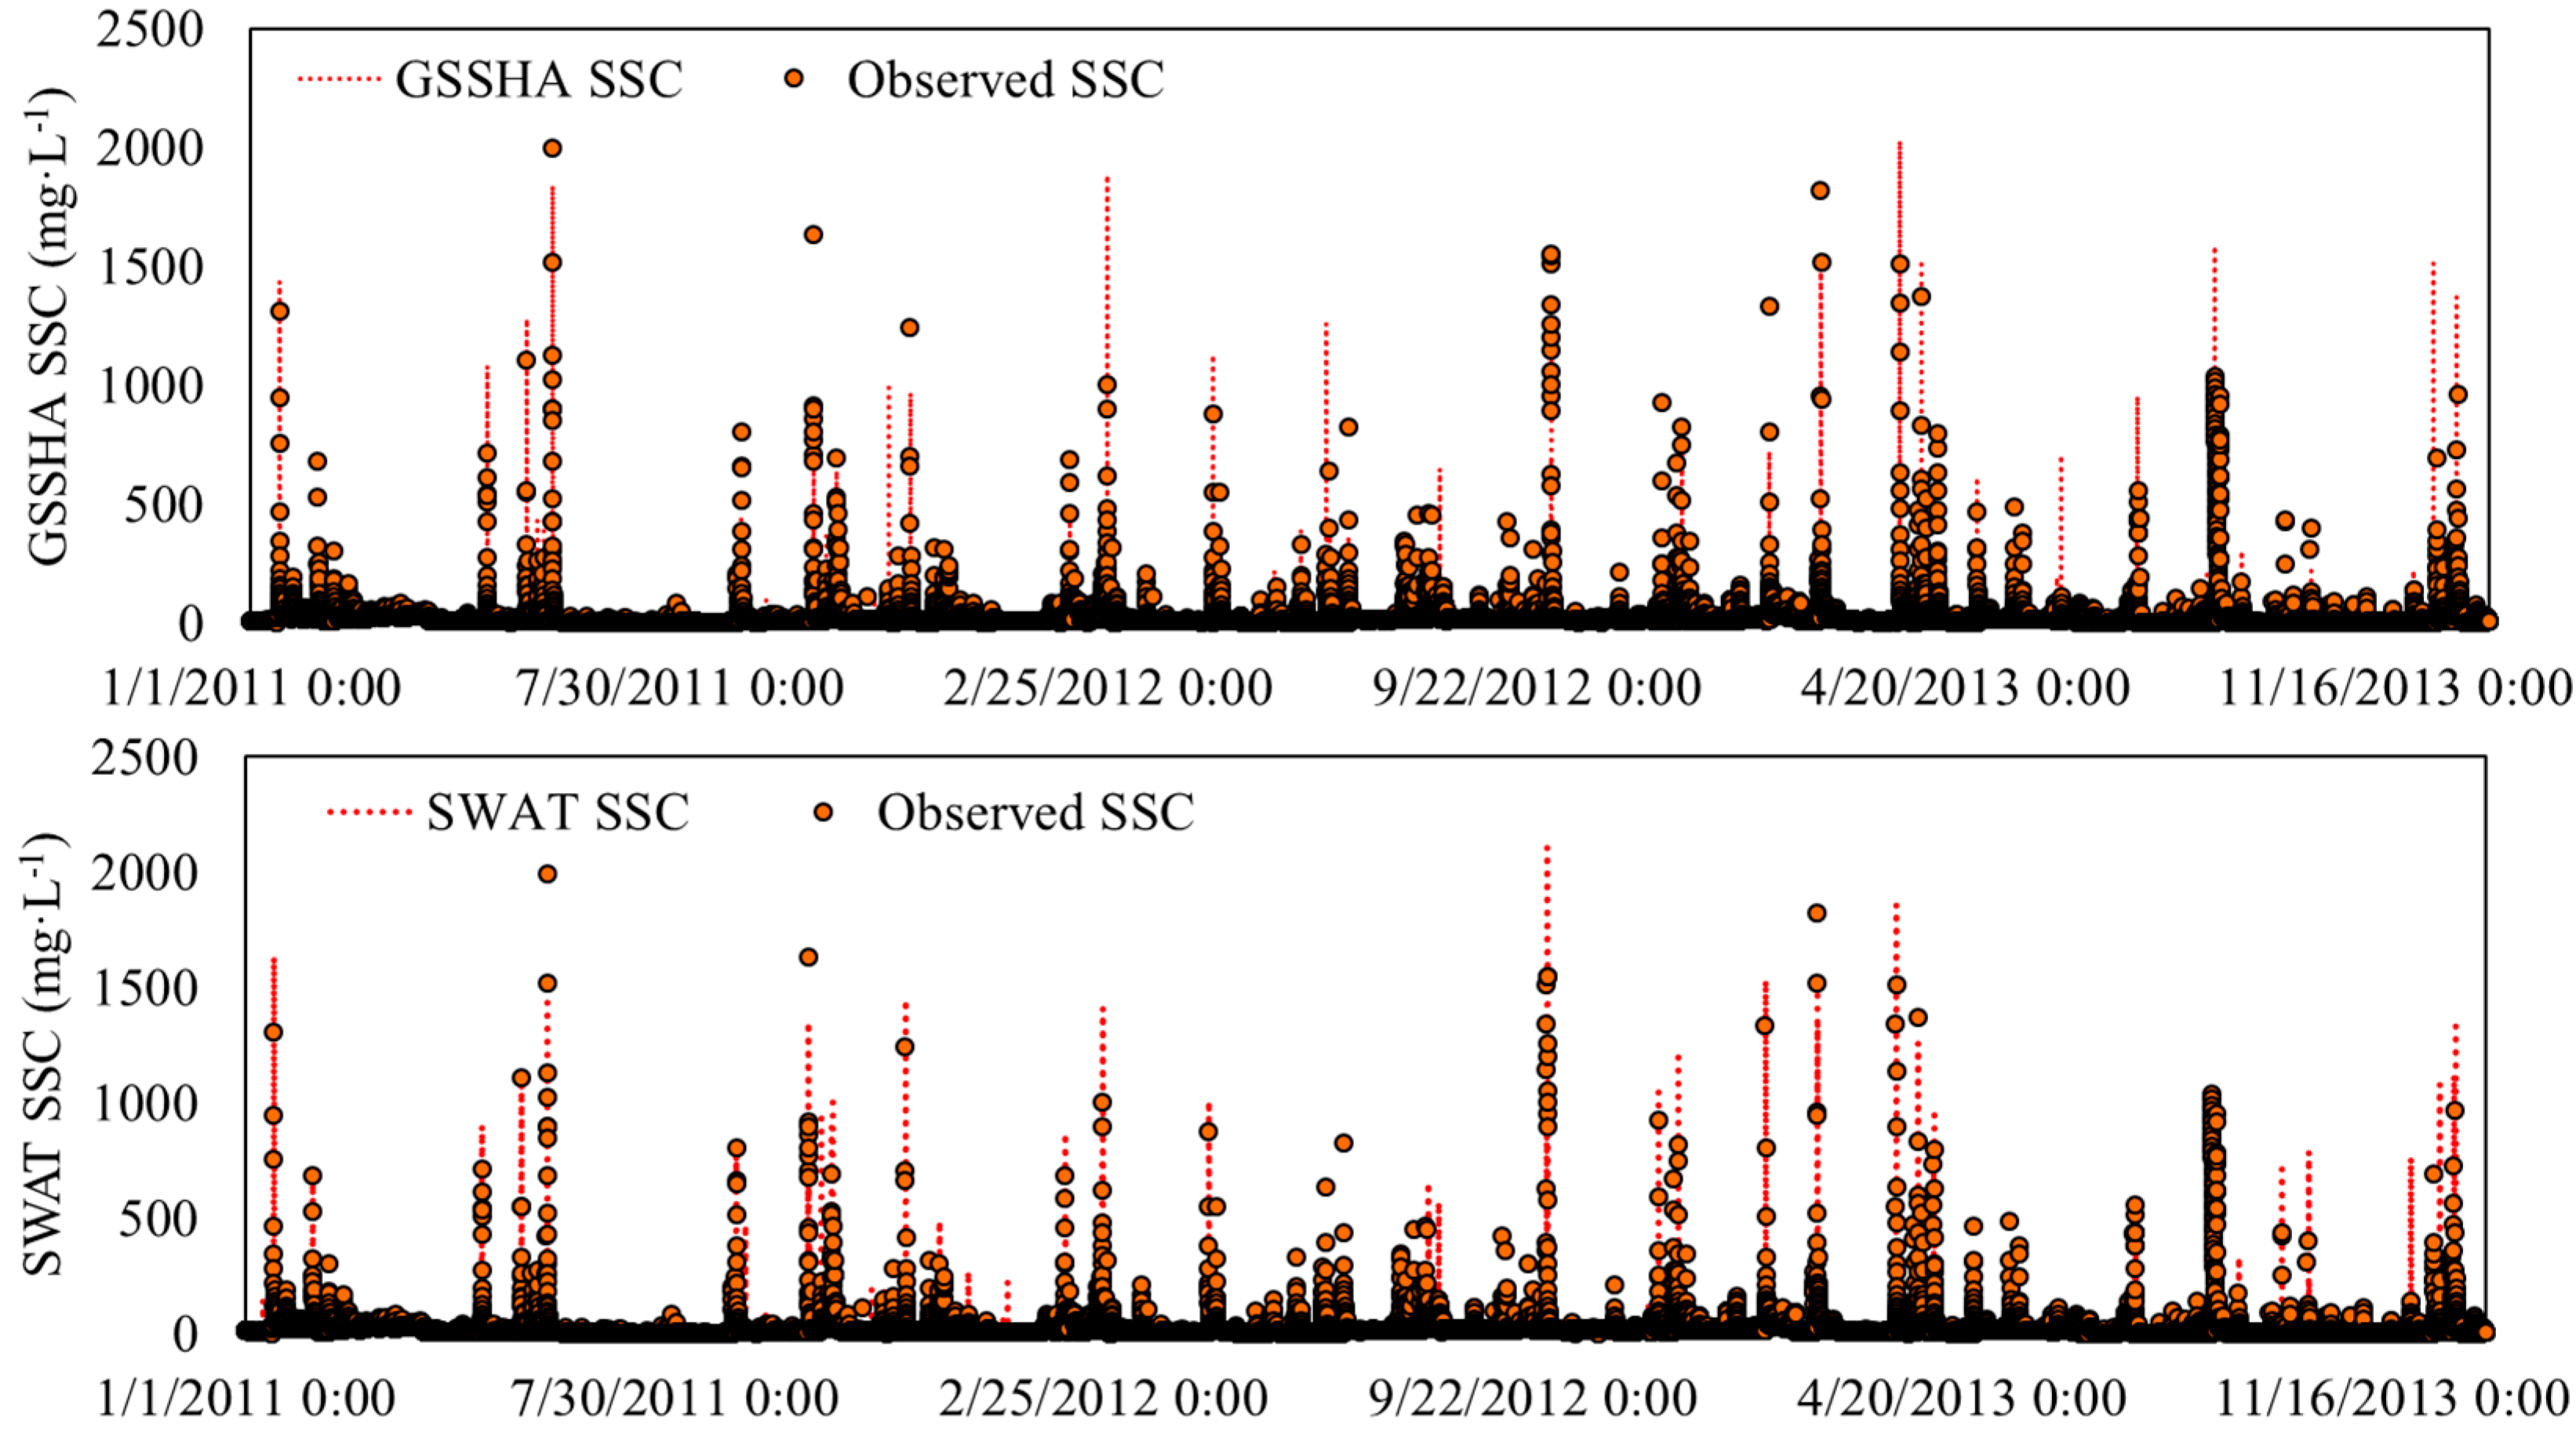
| Parameters | Alluvial | Kunigami | Shimajiri |
|---|---|---|---|
| Hydraulic conductivity (cm·h−1) | 0.12 | 0.40 | 0.36 |
| Capillary head (cm) | 28.25 | 35.3 | 32.20 |
| Porosity (m3·m−3) | 0.35 | 0.295 | 0.295 |
| Pore distribution index (cm·cm−1) | 0.256 | 0.378 | 0.378 |
| Residual saturation (m3·m−3) | 0.056 | 0.056 | 0.056 |
| Field capacity (m3·m−3) | 0.131 | 0.127 | 0.128 |
| Wilting point (m3·m−3) | 0.10 | 0.10 | 0.10 |
| Initial moisture (m3·m−3) | 0.22 | 0.20 | 0.20 |
| Parameters | Manning’s Roughness |
|---|---|
| Open water | 0.090 |
| Built-up | 0.015 |
| Bare land | 0.105 |
| Forest | 0.204 |
| Grassland | 0.175 |
| Pasture | 0.180 |
| Paddy field | 0.150 |
| Pineapple | 0.120 |
| Sugarcane | 0.210 |
| Other agricultural farmland | 0.160 |
| Parameters | Definition | Range | Fitted Values |
|---|---|---|---|
| v_SURLAG.bsn | Surface runoff lag coefficient | 1–24 | 10.32 |
| v_EPCO.bsn | Plant uptake compensation factor | 0.01–1 | 0.607 |
| v_ALPHA_BF.gw | Base flow alpha factor | 0–1 | 0.385 |
| v_RCHRG_DP.gw | Deep aquifer percolation fraction | 0–1 | 0.767 |
| v_GW_DELAY.gw | Groundwater delay | 0–350 | 162 |
| v_GWQMN.gw | Threshold depth of water in the shallow aquifer for return flow to occur | 10–1000 | 576 |
| v_REVAPMN.gw | Threshold depth of water in the shallow aquifer for “revap” to occur | 0–100 | 98 |
| v_GW_REVAP.gw | Groundwater “revap” coefficient | 0.02–0.2 | 0.125 |
| v_OV_N.hru | Manning’s “n” value for overland flow | 0.01–0.8 | 0.738 |
| r_SOL_AWC.sol | Available water capacity of the soil layer | −0.3–0.3 | 0.118 |
| r_SOL_K.sol | Saturated hydraulic conductivity (mm/h) | −0.8–0.8 | −0.689 |
| r_SOL_BD.sol | Moisture bulk density | −0.3–0.3 | −0.185 |
| v_ESCO.bsn | Soil evaporation compensation factor | 0.01–1 | 0.237 |
| v_CH_N2.rte | Manning’s “n” value for the main channel | 0.01–0.5 | 0.319 |
| v_CH_K2.rte | Effective hydraulic conductivity in main channel | 0–150 | 129 |
| Models | Events | Observed Peak (m3·s−1) | Simulated Peak (m3·s−1) | Peak Error (%) | Observed Volume (m3) | Simulated Volume (m3) | Volume Error (%) | R2 | NSE |
|---|---|---|---|---|---|---|---|---|---|
| GSSHA | Event 1 | 32.99 | 34.32 | 4.03 | 585,225 | 733,707 | 25.37 | 0.87 | 0.69 |
| Event 2 | 17.76 | 17.53 | −1.30 | 606,637 | 549,346 | −9.44 | 0.68 | 0.65 | |
| Event 3 | 7.46 | 7.76 | 4.02 | 831,538 | 637,851 | −23.29 | 0.88 | 0.81 | |
| Event 4 | 65.74 | 60.87 | −7.41 | 1,755,397 | 1,538,002 | −12.38 | 0.97 | 0.96 | |
| SWAT | Event 1 | 32.99 | 40.2 | 21.86 | 585,225 | 758,887 | 29.67 | 0.87 | 0.58 |
| Event 2 | 17.76 | 14.8 | −16.67 | 606,637 | 492,080 | −18.88 | 0.45 | 0.42 | |
| Event 3 | 7.46 | 6.84 | −8.31 | 831,538 | 659,369 | −20.70 | 0.83 | 0.75 | |
| Event 4 | 65.74 | 56.1 | −14.66 | 1,755,397 | 1,462,968 | −16.66 | 0.95 | 0.92 |
| Models | Events | Observed Peak (m3·s−1) | Simulated Peak (m3·s−1) | Peak Error (%) | Observed Volume (m3) | Simulated Volume (m3) | Volume Error (%) | R2 | NSE |
|---|---|---|---|---|---|---|---|---|---|
| GSSHA | Event 1 | 148.24 | 115.01 | −22.42 | 1,885,258 | 1,716,390 | −8.96 | 0.89 | 0.88 |
| Event 2 | 28.13 | 29.17 | 3.70 | 555,687 | 698,999 | 25.79 | 0.74 | 0.71 | |
| Event 3 | 15.86 | 21.05 | 32.72 | 559,162 | 657,299 | 17.55 | 0.86 | 0.68 | |
| SWAT | Event 1 | 148.24 | 124.12 | −16.27 | 1,885,258 | 2,083,882 | 10.54 | 0.84 | 0.82 |
| Event 2 | 28.13 | 38.5 | 36.86 | 555,687 | 599,490 | 7.88 | 0.82 | 0.46 | |
| Event 3 | 15.86 | 18.6 | 17.28 | 559,162 | 468,029 | −16.30 | 0.67 | 0.58 |
| Land Cover | Soil Type | Erodibility Coefficient (K) | Detachment Coefficient (1·J−1) | Rill Erodibility Coefficient (s·m−1) |
|---|---|---|---|---|
| Sugarcane | Alluvial | 0.00362 | 7.95 | 0.1529 |
| Sugarcane | Kunigami | 0.00826 | 14.16 | 0.0924 |
| Sugarcane | Shimajiri | 0.00684 | 15.32 | 0.0638 |
| Pasture | Alluvial | 0.00236 | 8.27 | 0.0527 |
| Pasture | Kunigami | 0.000328 | 10.16 | 0.0426 |
| Pasture | Shimajiri | 0.000267 | 9.56 | 0.0582 |
| Pineapple | Kunigami | 0.03572 | 21.86 | 0.2548 |
| Others | Alluvial | 0.000154 | 5.27 | 0.0527 |
| Others | Kunigami | 0.000217 | 9.57 | 0.0532 |
| Others | Shimajiri | 0.000359 | 10.38 | 0.0624 |
| Parameters | Definition | Range | Fitted Values |
|---|---|---|---|
| v_CH_COV1.rte | Channel erodibility factor | 0–0.6 | 0.5 |
| v_CH_COV2.rte | Channel cover factor | 0.001–1 | 1 |
| v_SPCON.bsn | Linear factor for channel sediment routing | 0.0001–0.01 | 0.005 |
| v_SPEXP.bsn | Sediment re-entrained in channel sediment routing | 1–1.5 | 1.2 |
| v_EROS_EXPO.bsn | Exponent in the overland flow erosion equation | 1–3 | 1.2 |
| v_EROS_SPL.bsn | Splash erosion coefficient | 0.9–3.1 | 1.5 |
| v_C_FACTOR.bsn | Parameter for cover and management factor P | 0.001–0.45 | 0.40 |
| v_PRF_BSN.bsn | Peak rate adjustment factor for main channel | 0–2 | 0.25 |
| v_RILLMLT.bsn | Multiplier to USLE_K for soil susceptible to rill erosion | 0.5–2 | 1.10 |
| v_CH_D50.bsn | Median particle diameter of channel bed | 0.001–10 | 5.2 |
| Models | Events | Observed Peak (mg·L−1) | Simulated Peak (mg·L−1) | Peak Error (%) | Observed Load (ton) | Simulated Load (ton) | Load Error (%) | R2 | NSE |
|---|---|---|---|---|---|---|---|---|---|
| GSSHA | Event 1 | 1108.99 | 1272.39 | 14.73 | 159.79 | 209.65 | 31.20 | 0.85 | 0.73 |
| Event 2 | 262.25 | 425.12 | 62.10 | 40.18 | 55.30 | 37.63 | 0.58 | 0.38 | |
| Event 3 | 276.43 | 428.11 | 54.87 | 65.09 | 62.73 | −3.63 | 0.79 | 0.62 | |
| Event 4 | 1996.8 | 1834.93 | −8.11 | 1382.94 | 1142.01 | −17.42 | 0.90 | 0.89 | |
| SWAT | Event 1 | 1108.99 | 1090.24 | −1.69 | 159.79 | 189.83 | 18.80 | 0.69 | 0.60 |
| Event 2 | 262.25 | 311.23 | 18.68 | 40.18 | 46.42 | 15.53 | 0.49 | 0.28 | |
| Event 3 | 276.43 | 154.87 | −43.97 | 65.09 | 32.97 | −49.35 | 0.49 | 0.47 | |
| Event 4 | 1996.8 | 1434.93 | −28.14 | 1382.94 | 880.15 | 31.20 | 0.79 | 0.70 |
| Models | Events | Observed Peak (mg·L−1) | Simulated Peak (mg·L−1) | Peak Error (%) | Observed Load (ton) | Simulated Load (ton) | Load Error (%) | R2 | NSE |
|---|---|---|---|---|---|---|---|---|---|
| GSSHA | Event 1 | 1510.27 | 2021.32 | 33.84 | 1874.29 | 1663.93 | −11.22 | 0.70 | 0.66 |
| Event 2 | 1372.86 | 1505.26 | 9.64 | 220.30 | 316.54 | 43.69 | 0.73 | 0.59 | |
| Event 3 | 797.6 | 720.27 | −9.70 | 124.81 | 183.64 | 47.13 | 0.71 | 0.54 | |
| SWAT | Event 1 | 1510.27 | 1850.12 | 22.50 | 1874.29 | 2475.35 | 32.07 | 0.98 | 0.94 |
| Event 2 | 1372.86 | 1260.25 | −8.20 | 220.30 | 384.77 | 74.66 | 0.60 | 0.48 | |
| Event 3 | 797.7 | 974.38 | 22.15 | 124.81 | 182.28 | 46.04 | 0.70 | 0.55 |
© 2017 by the authors. Licensee MDPI, Basel, Switzerland. This article is an open access article distributed under the terms and conditions of the Creative Commons Attribution (CC BY) license (http://creativecommons.org/licenses/by/4.0/).
Share and Cite
Sith, R.; Nadaoka, K. Comparison of SWAT and GSSHA for High Time Resolution Prediction of Stream Flow and Sediment Concentration in a Small Agricultural Watershed. Hydrology 2017, 4, 27. https://doi.org/10.3390/hydrology4020027
Sith R, Nadaoka K. Comparison of SWAT and GSSHA for High Time Resolution Prediction of Stream Flow and Sediment Concentration in a Small Agricultural Watershed. Hydrology. 2017; 4(2):27. https://doi.org/10.3390/hydrology4020027
Chicago/Turabian StyleSith, Ratino, and Kazuo Nadaoka. 2017. "Comparison of SWAT and GSSHA for High Time Resolution Prediction of Stream Flow and Sediment Concentration in a Small Agricultural Watershed" Hydrology 4, no. 2: 27. https://doi.org/10.3390/hydrology4020027
APA StyleSith, R., & Nadaoka, K. (2017). Comparison of SWAT and GSSHA for High Time Resolution Prediction of Stream Flow and Sediment Concentration in a Small Agricultural Watershed. Hydrology, 4(2), 27. https://doi.org/10.3390/hydrology4020027


