Article

Assessing Streamflow Response to Climate Change Under Shared Socioeconomic Pathways (SSPs) in the Olifants River Basin, South Africa

by
Kiya Kefeni Benti
*,
Megersa Olumana Dinka
,
Sophia Sudi Rwanga
and
Mesfin Reta Aredo
Department of Civil Engineering Science, Faculty of Engineering and The Built Environment, University of Johannesburg, Auckland Park 2006, South Africa
*
Author to whom correspondence should be addressed.
Hydrology 2025, 12(9), 244; https://doi.org/10.3390/hydrology12090244
Submission received: 17 June 2025 / Revised: 25 July 2025 / Accepted: 28 July 2025 / Published: 20 September 2025

Abstract

Climate change affects streamflow through changes in precipitation, temperature, and extreme weather events. These changes will impact water resource availability significantly. Thus, understanding the impacts of climate change on hydrology is essential for sustainable water management. This study investigated the potential effects of climate change on streamflow in the Olifants River basin under shared socioeconomic pathways (SSPs), utilizing the restructured version of the Soil and Water Assessment Tool (SWAT+) model. Projected precipitation and temperature (Tmax and Tmin) were analyzed for the near (2030–2060) and far (2070–2100) future to simulate and analyze streamflow variations under SSP245 and SSP585 scenarios using bias-corrected CMIP6 data and the SWAT+ model. The SWAT+ model was calibrated and validated successfully, with Nash–Sutcliffe efficiency (NSE) values of 0.76 and 0.77, and coefficient of determination (R2) values of 0.78 and 0.82 during the calibration and validation periods, respectively. Climate model ensemble projections show a consistent decline in precipitation and increases in Tmax and Tmin, with Tmin increasing more significantly. These changes are projected to reduce streamflow, with annual declines of 43.08% and 50.89% under SSP245 and 57.79% and 58.82% under SSP585 for the near and far future, respectively. Moreover, climate change reduces streamflow across all seasons in the Olifants River basin. Therefore, adopting water management strategies such as enhancing integrated water resource management and investing in climate-resilient infrastructure is essential for sustainable water resource management under changing climate conditions in the basin.

1. Introduction

Climate change significantly affects hydroclimatic conditions globally. These changes pose serious challenges to the sustainability of freshwater resources, impacting agriculture, energy production, and overall human well-being [1,2]. Furthermore, these changes hinder progress toward achieving the Sustainable Development Goals (SDGs) and exacerbate existing inequalities, particularly in rural and marginalized areas [2,3,4]. Climate change is increasingly recognized as a major driver of hydrological variability, affecting water availability and ecosystem sustainability across regions [5]. Streamflow is a vital component of the hydrological cycle, significantly influencing water availability for various sectors. Recent studies [6,7] indicate that climate change alters streamflow patterns, leading to potential risks for water availability and ecosystem integrity. These alterations are primarily driven by precipitation and temperature changes, which affect streamflow quantity, flow pattern, and timing [8].
The Southern Africa region is particularly one of the most vulnerable to the effects of climate change owing to its existing water stress and socioeconomic challenges. The region is experiencing increased frequency and intensity of extreme weather events, such as droughts and floods, affecting water scarcity and management practices [5]. South Africa is predominantly characterized by a semi-arid climate, marked by highly variable precipitation patterns across space and time and high evapotranspiration rates, which collectively constrain the availability of water resources [9]. The region is experiencing more frequent and intense droughts and floods, which are exacerbated by the El Niño–Southern Oscillation effect [5]. These changes threaten water availability, agricultural productivity, and energy generation, increasing food insecurity and economic vulnerability [4,5]. The Olifants River basin in northeastern South Africa supports agriculture, urban development, mining activities, and regional ecosystems [10]. However, climate change considerably alters temperature and precipitation patterns, impacting water availability and intensifying pressure on sectoral demands within the basin. The reduced precipitation and rising temperatures will likely exacerbate drought conditions, further diminishing streamflow. Several studies [10,11,12,13] in the basin have revealed a consistent trend of decreasing precipitation and increasing temperatures, which may increase vulnerability of the area to water scarcity and declining streamflow availability. Besides climate change, the basin is significantly impacted by various human-induced activities, further exacerbating its vulnerability to climatic shifts. Key factors such as population growth, urbanization, land use changes, and industrial activities contribute to alterations in both the quality and quantity of water resources in the basin [12,14]. Moreover, despite the basin’s critical importance, there is inadequate understanding of the potential climate change impact on streamflow in the area under shared socioeconomic scenarios (SSPs).
Global Climate Models (GCMs) are essential for projecting future climate scenarios, providing critical insights for understanding climate change impacts. Despite their strengths, GCMs face limitations, particularly regarding regional accuracy and inherent uncertainties in climate projections [15]. The Coupled Model Intercomparison Project (CMIP), initiated in 1995, has evolved significantly to enhance understanding of climate variability and change through enhanced simulations and community engagement [16]. The latest CMIP6 GCMs generally integrate new physical processes and improved spatial resolution, which is expected to have more reliable climate simulations than the former generations [17]. Moreover, the emission scenarios implemented in CMIP6 are the combinations of shared socioeconomic pathways (SSPs) and Representative Concentration Pathways (RCPs). These improvements enhance understanding of climate variability and projections through a multi-model framework [18,19]. Hydrological models are essential tools for projecting and analyzing the impacts of climate change on water systems. Among these hydrological models, the Soil and Water Assessment Tool (SWAT) is a widely utilized hydrological model that integrates climate, land use, soil, and topography to simulate watershed processes, including water movement, sediment transport, and nutrient cycling [20]. SWAT’s semi-distributed framework enables the simulation of hydrological processes across different spatial and temporal scales, making it particularly effective for complex watershed analyses [21]. The revised version of the SWAT, known as SWAT+, offers enhanced capabilities for simulating the impacts of climate change and land use on water systems, particularly in complex river basins [22]. SWAT+ builds upon the original SWAT model by incorporating more sophisticated spatial representations and management options, making it a powerful tool for hydrological modeling and water resource management. It introduces landscape units and improves flow and pollutant routing across landscapes, enhancing the spatial representation of watershed elements and processes [23,24]. This restructuring allows more detailed simulations of interactions between landscape and river systems, crucial for complex basins like the Olifants. SWAT+ has been effectively utilized to simulate the impacts of climate change on water balance components across various river basins [22,25,26,27], demonstrating its capability to model hydrological processes under changing climatic conditions. The model’s ability to incorporate high-resolution climate data and scenarios, such as RCP4.5/SSP245 and RCP8.5/SSP585, allows for detailed projections of hydrological changes.
Previous studies [10,11,12] in the Olifants River basin have predominantly employed climate projections from various CMIP5 models concerning the hydrological responses to future climate change. However, studies on climate change impacts on future streamflow changes based on the CMIP6 GCMs remain notably limited and largely unexplored in the Olifants River basin. Therefore, assessing future streamflow responses to the changing climate using the latest CMIP6 models is crucial for managing water resources. Thus, the objective of this study was to evaluate the response of streamflow in the Olifants River basin to climate change using the latest SSPs from CMIP6. Therefore, this study aimed to investigate the impacts of climate change on streamflow in the Olifants River basin utilizing CMIP6 through a multi-model ensemble of bias-corrected GCMs for two distinct scenarios (SSP245 and SSP585). Unlike previous studies [11,12,28] that relied on RCP, this study used a comprehensive climate modeling framework accounting for polices, population dynamics, and economic trends. Using SSP245 and SSP585 scenarios with bias-corrected and downscaled climate projections, this study provides insights into the future hydrological patterns and offers enhanced guidance for water resource management in water-stressed, climate-sensitive basins.

2. Materials and Methods

2.1. Description of the Study Area

The Olifants River basin, situated in the northeastern part of South Africa (Figure 1), is an area of critical importance for water resources management in the country. Geographically, the basins are located between 23.8° S and 26.5° S and 28.3° E and 31.9° E. The basin is one of the country’s most significant and water-stressed basins, covering an area of approximately 54,000 km2 and spanning across three provinces: Gauteng, Mpumalanga, and Limpopo [14]. It is part of the larger Limpopo River basin, draining into the Indian Ocean, and is a key water resource for South Africa [28]. The Olifants River is approximately 770 km long, with its main tributaries including the Wilge, Moses, Elands, and Ga-Selati Rivers on the left bank and the Klein Olifant, Steelpoort, Blyde, and Timbavati Rivers on the right bank [14,29]. These tributaries play crucial roles in maintaining the river flows and supporting the ecological health of the basin. Diverse topographical features characterize the basin, including high-elevation areas in the west, a sharp rise to an escarpment near the center, and low elevation in the eastern part of the basin, creating varied climatic and hydrological conditions across the basin [12]. Based on a 30 m resolution Shuttle Radar Topography Mission (SRTM) digital elevation model (DEM), the elevation in the basin ranges from 0 m to 2400 m above mean sea level, reflecting the basin’s diverse topography [29].
The climate of the Olifants River basin is characterized as semi-arid conditions, with significant variability in rainfall and temperature. Mean annual rainfall ranges from 500 to 800 mm, primarily occurring during the summer [28], whereas temperatures vary widely, influenced by the basin’s diverse topography. This variability poses challenges for water management and agricultural planning in the region. Evaporation within the basin exhibits significant spatial variability, with the highest rate occurring in the northern and western areas. Across the basin, potential evapotranspiration (PET) ranges approximately from 1800 mm in the eastern regions to more than 2200 mm in the southwest parts [13]. The land use in the basin is highly diverse, encompassing agricultural activities, urban areas, and natural landscapes [12,29]. The basin supports diverse economic activities, including agriculture, mining, and urban development. A strong mining and industrial presence characterizes the upper sub-basin. The region has significant coal mining operations, contributing to the local and national economy [28]. The middle sub-basin is primarily dominated by agricultural activities, particularly irrigated farming, and is a major water consumer in the basin. The lower reaches of the basin are characterized by a mix of economic activities, including agriculture, tourism, and some industrial development. Irrigated agriculture, like the middle basin, is a significant economic driver, with crops like citrus fruits and cotton cultivated [29]. The region also attracts tourists drawn to the natural beauty of the Kruger National Park and other wildlife reserves located along the lower Olifants River. The basin’s geology predominantly comprises complex rock formations such as the Karoo Supergroup, the Bushveld Igneous Complex, and the Transvaal Supergroup. These formations influence the groundwater availability and quality, which are critical for local communities.

2.2. Datasets and Method

2.2.1. Details of Input Data and Sources

The SWAT+ model relies on spatial and temporal data to simulate hydrological processes. Temporal data include climatic and streamflow data, while the spatial data inputs consist of digital elevation models (DEM), soil, and land use/cover (LULC) data. Table 1 summarizes the input data and their respective sources used in this study.
The 30 m resolution DEM was obtained from the SRTM (Figure 2a) and employed in delineating the watershed. The slope information map was derived from the DEM using a spatial analysis tool in QGIS and combined with soil and land use/land cover map data to define the hydrological response units (HRUs). LULC data are essential inputs for reliable hydrological modeling [30]. The Sentinel-2 LULC (2016) map for South Africa was obtained from https://opendata.rcmrd.org/datasets/rcmrd accessed on 20 August 2024 (Land use South Africa). This dataset was used to extract the LULC map of the study watershed. The clipped map was then classified into five major land use types depending on the dominant LULC (Figure 2b), namely, rangeland (RNGE), agricultural land (AGRL), urban area/settlements (URBN), Forest land (FRST), and water bodies (WATR), with rangeland and agricultural land being the predominant classes.
The physical characteristics of soil horizons significantly influence the movement of water and air through the soil profile, and variations in soil texture, density, and porosity across different horizons dictate water retention and infiltration rates, ultimately impacting the hydrological cycle [31]. The Food and Agriculture Organization (FAO) produced a global digital soil map at a scale of 1:5,000,000 by compiling information from approximately 1700 soil profiles worldwide [10]. The soil data used in this study were obtained from the FAO digital soil map (Figure 3); then, the FAO digital soil map was utilized to clip the soil map of the study watershed. The clipped FAO soil data for the study area reveal the presence of eleven soil types (Table 2), with the following predominant soil types: chromic luvisols (44.16%), cambic arenosols (30%), chromic vertisols (19.78%), orthic acrisols (3.53%), and both chromic cambisoils and rhodic ferralsols (each 1.06%).
The GCMs were selected based on their data availability, spatial resolution, and other authors’ recommendations on the Olifants River basin. Table 3 presents the details of the selected CMIP6 GCMs used in this study, including their originating institutions and spatial resolution. The CMIP6 models provide historical and future datasets covering 1850–2014 and 2015–2100, respectively. Selecting appropriate climate models and emission scenarios is essential for generating accurate climate projections. This study focused on SSP245 (an intermediate emission scenario) and SSP585 (a high-emission scenario), both essential for understanding future climate conditions and the implications for water resources. Detailed descriptions of these scenarios, which combine SSP storylines with radiative forcing levels, were provided by the authors of [32].
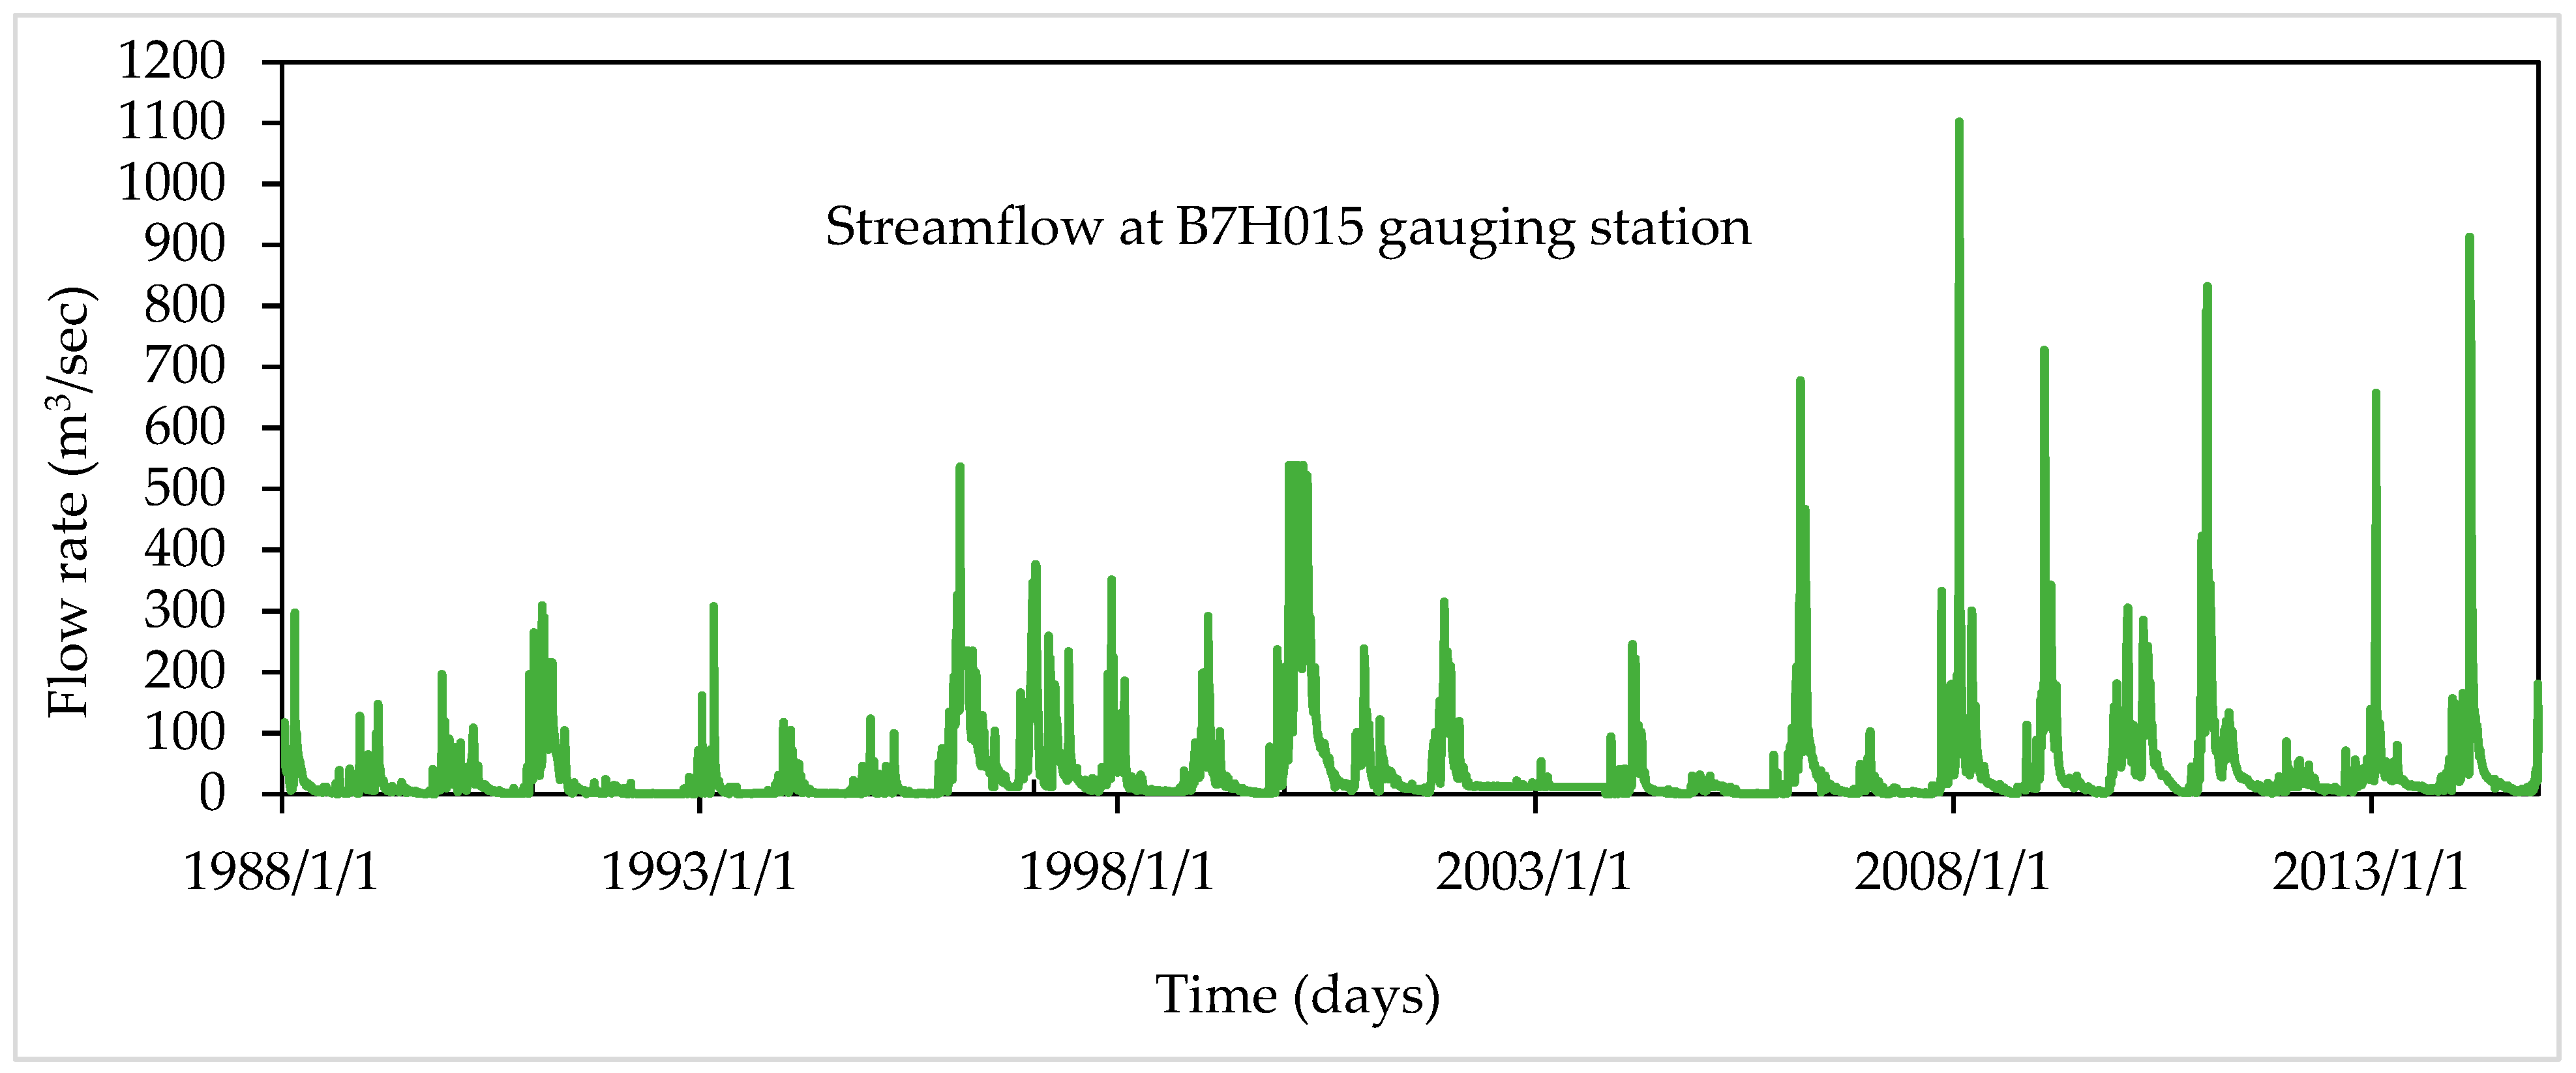
SWAT+ also requires observed streamflow data to calibrate and validate the hydrological model. The observed streamflow data were collected from the South African Department of Water and Sanitation. Although several gauging stations are available in the study area, most lack continuous data. The Mamba (B7H015) gauging station utilized in this study provides continuous data that accurately represent the monthly and seasonal flow patterns, with low flows during the dry season and high flows during the rainy season. Continuous daily flow records were plotted (Figure 4) to check for a significant change in magnitude and frequency. Missing values were then filled using linear regression.

2.2.2. Methodological Framework

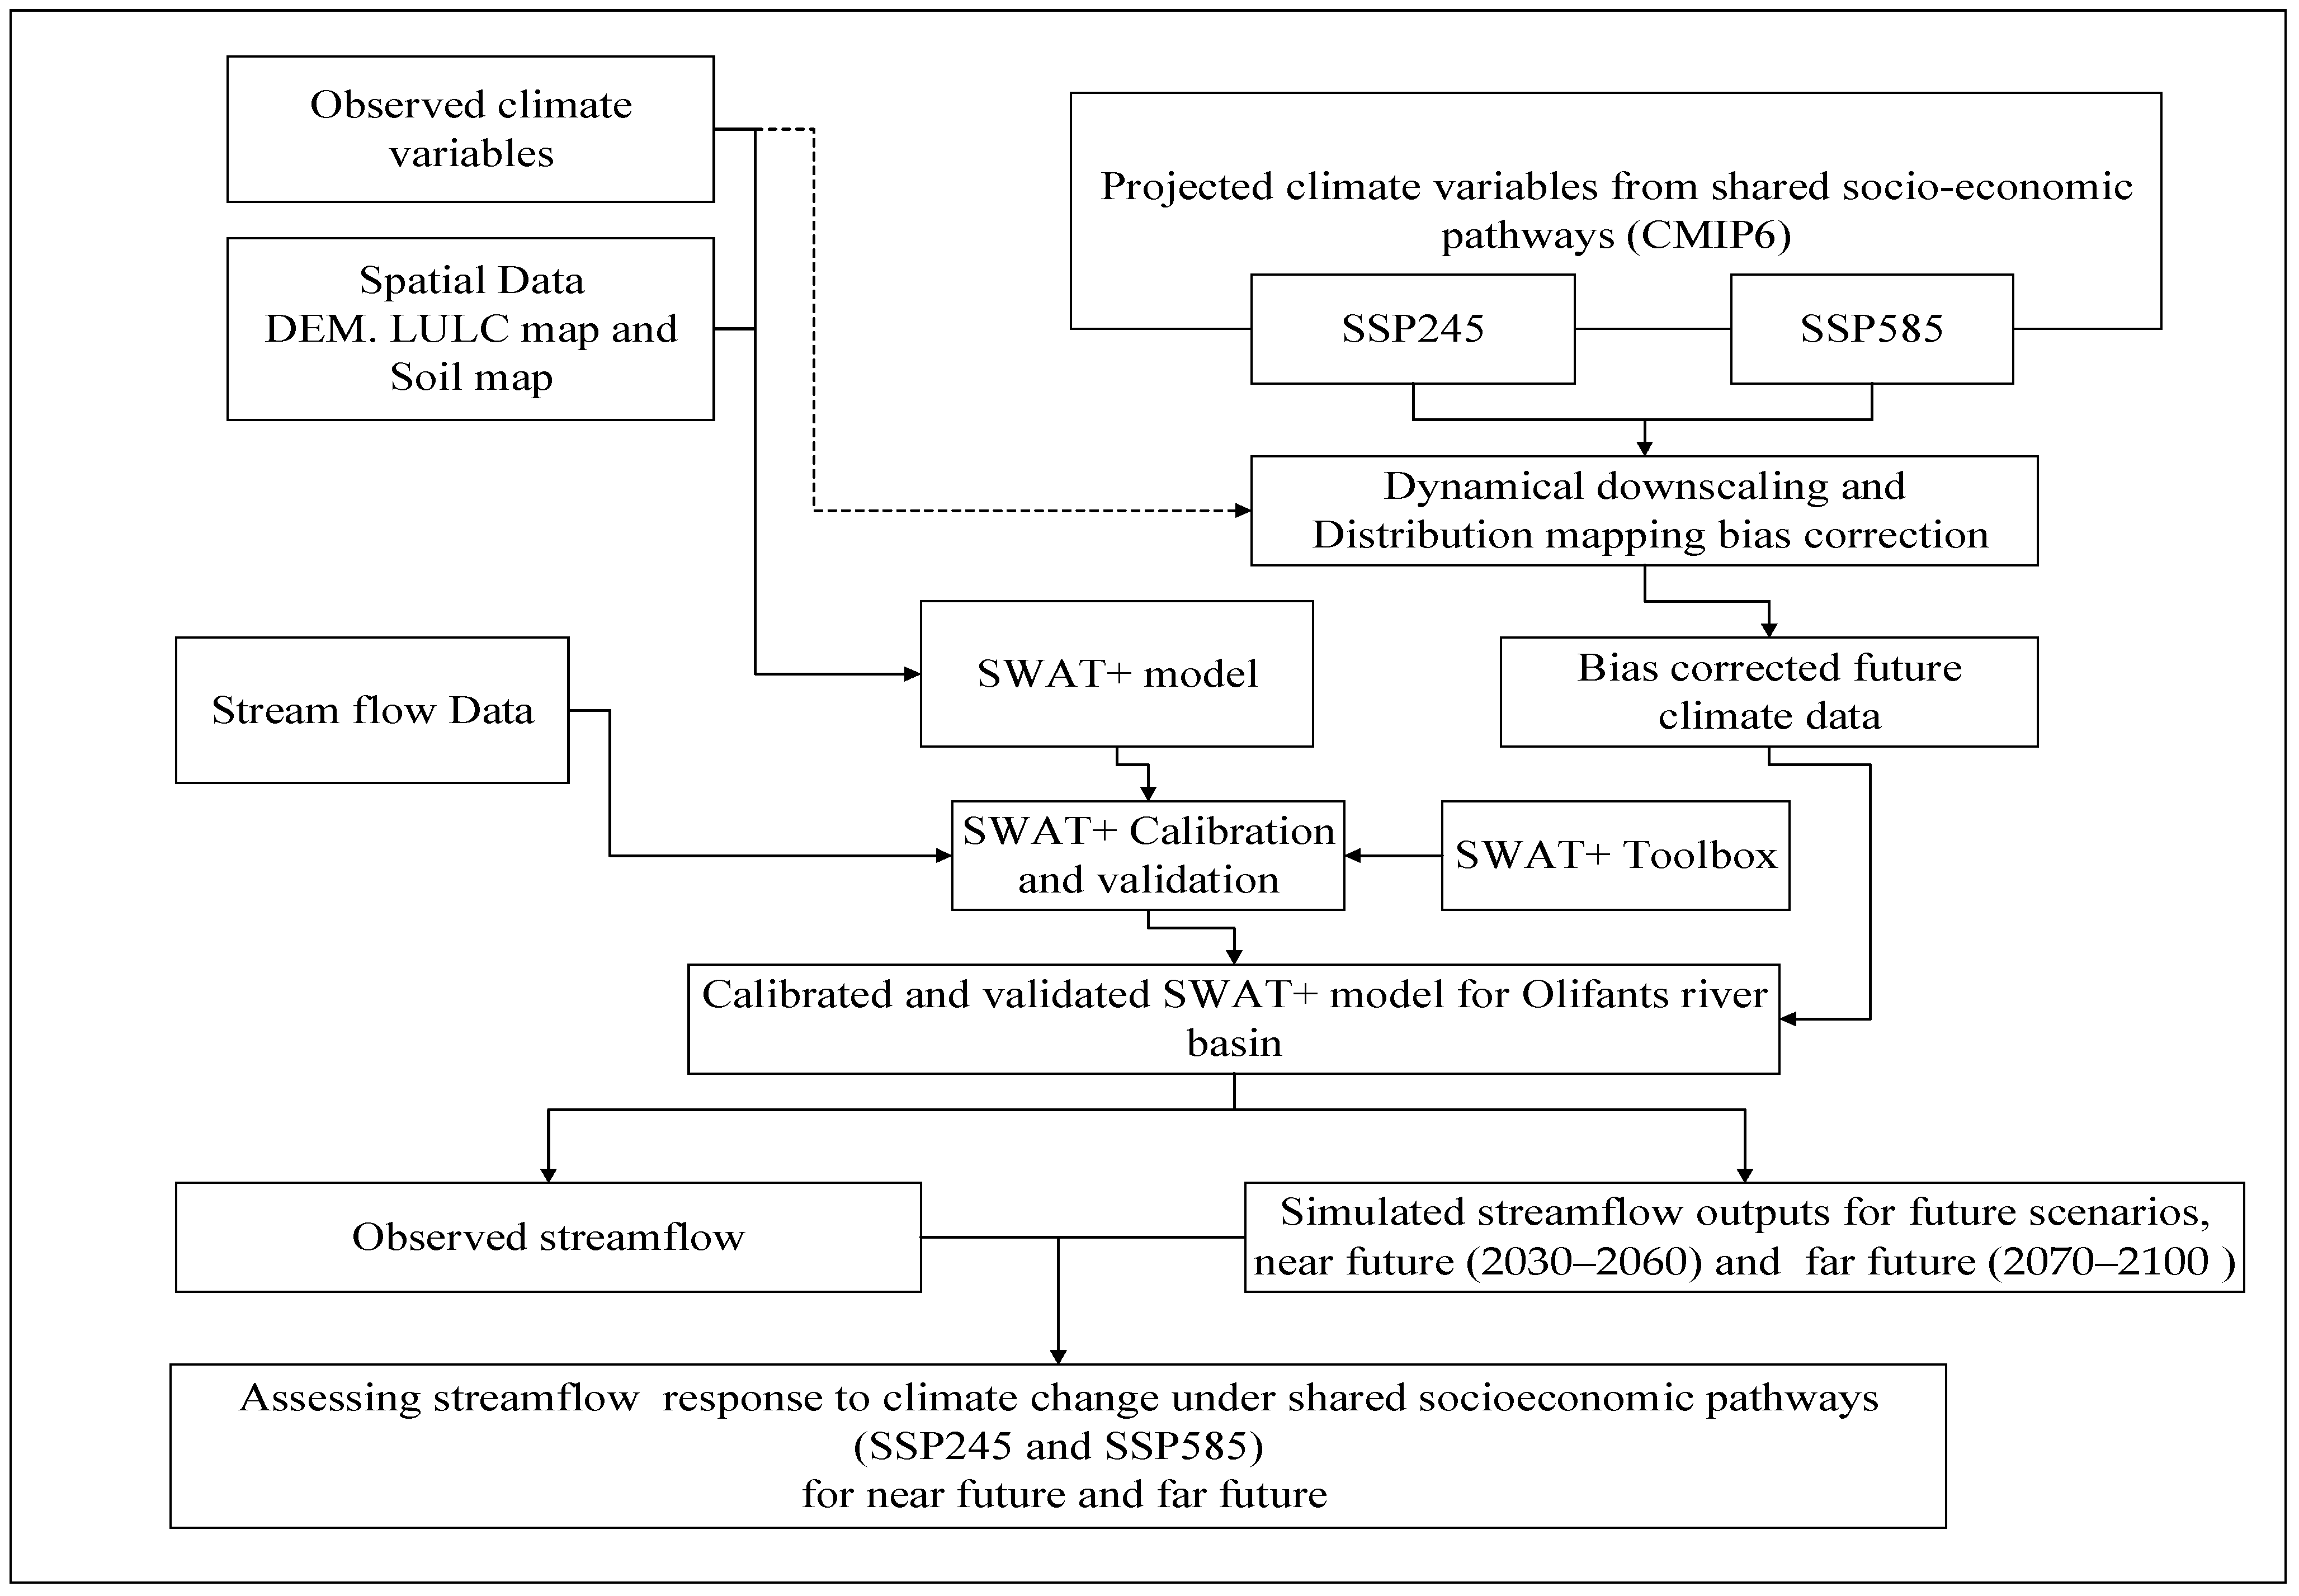
This study employs SWAT+ hydrological modeling, consisting of three key components: model setup and development, model performance evaluation, and future streamflow projection. The calibrated and validated SWAT+ hydrologic model was used to estimate the stream flow response to climate change using projected precipitation and temperature data from CMIP6 scenarios. The results were compared with observed streamflow values to examine the impact of projected climate change. Projected precipitation and temperature data from five GCMs under the CMIP6 were dynamically downscaled and bias-corrected for climate change modeling. Figure 5 presents the methodological framework of this study, including the preparation of climate and spatial datasets into SWAT+ format, model setup, calibration, and validation of the model using observed streamflow data, and the assessment of future climate impact on stream flow under different climate change scenarios. To determine any stream flow variations due to climate change, all other input data of the SWAT+ model established during the baseline period were kept constant. These input parameters included land cover types, soil characteristics, and elevation data. By keeping these model parameters as constants from the baseline period, any variations in streamflow can be directly attributed to climate change alone. A similar approach was applied to assess the impacts of climate change on streamflow and reservoir inflows in the Upper Manyame sub-catchment of Zimbabwe, where the model parameters were held constant to isolate the impact of climate change only [33]. Potential evapotranspiration (PET) plays a critical role, as it directly affects the water balance of the basin. SWAT+ provides three methods to simulate daily potential evapotranspiration (PET) at the HRU scale, namely, the Penman-Monteith, the Priestley–Taylor, and the Hargreaves methods. The Penman–Monteith equation is regarded as the most suitable approach for estimating PET, as it explicitly distinguishes between the impacts of climate and land cover properties on each component of evapotranspiration. The Penman–Monteith method was selected to estimate PET in this study. The bias-corrected climatic variables from CMIP6 outputs were integrated into the calibrated SWAT+ model for simulating future streamflow.

2.3. Bias Correction and Downscaling Method

Global Climate Models (GCMs) are vital for projecting future climate scenarios and providing critical data for climate change impact studies [34]. These models simulate the Earth’s atmospheric and oceanic processes, offering insights into the complex interactions that drive climatic shifts. However, GCMs have limitations, particularly in spatial resolution, necessitating downscaling techniques to provide finer detail for regional and local impact assessments. These methods adjust the GCM outputs to better align with observed climate data, thereby improving the representation of local climatic conditions [15]. CMhyd is a tool designed to extract and bias-correct climate data from global and regional models [35]. It addresses the systematic biases inherent in climate model outputs, which can significantly affect climate impact analyses. The tool employs various bias correction techniques, including linear scaling, delta change correction, precipitation local intensity scaling, power transformation of precipitation, variance scaling of temperature, and precipitation and temperature distribution mapping [35,36]. However, CMhyd could not directly extract climate data from CMIP6 for the SSP scenarios. To address this limitation, we developed a Python (5.4.3) script to extract GCM data, which are available as network Common Data Form (netCDF) files and converted to the ASCII format for downscaling and bias correction in CMhyd. The Data extraction process was conducted using the spyder software environment (version 5.4.3) (Supplementary S1). The distribution mapping and dynamic downscaling were selected for bias correction and downscaling because of their effectiveness in adjusting simulated climate model data to match observed values [8]. In the distribution mapping method, the gamma distribution, characterized by the shape parameter α and the scale parameter β, is frequently utilized for modeling precipitation distribution [37,38], as given by Equation (1).
f γ x α , β = x α 1 1 β α Γ ( α ) e x β ; x 0 ;   α ,   β > 0
where Γ is the gamma function, and α and β are the form and scale parameters, respectively.
Climate models frequently overestimate the frequency of light rainy days and simultaneously underestimate the total amounts of extreme observed precipitation [39]. This results in many drizzle days in the raw climate model simulated precipitation, which can significantly distort the precipitation distribution. To address this issue in this study, the correction is performed on LOCI-corrected precipitation as given by Equation (2).
P h s t , m , d c o r = F γ 1 ( F γ ( P L O C I , h s t , m , d | α L O C I , h s t , m , β L O C I , h s t , m ) | α o b s , m , β o b s , m )
where Fγ and F γ 1 , respectively, represent the gamma cumulative distribution functions (cdfs) and their inverses, αLOCI;m and βLOCI;m are the fitted gamma parameters for the LOCI-corrected precipitation in a given month m, and αobs,m and βobs,m are the observations.
For temperature, the Gaussian distribution with location parameter α and scale parameter β is often assumed to agree with the optimal temperature distribution [38], as given by Equation (3). The corrected temperature can be expressed in terms of the Gaussian cdfs (FN) and its inverse ( F N 1 ), as given by Equation (4).
f N   x | μ , σ 2 = 1 σ 2 π   e x μ 2 2 σ 2   ;         x   ϵ   R      
T h s t , m , d c o r = F N 1 ( F N ( T r a w , m , d | μ r a w , m ,   σ r a w , m ) | μ o b s , m , σ o b s , m )
where the mean and standard deviation, respectively, determine µ and σ; F N and F N 1 are the Gaussian CDF and its inverse, µraw,m, and µobs,m are the fitted and observed means for the raw and observed precipitation series at a given month m, and σraw,m, and σobs,m are the corresponding standard deviations.

2.4. Multi-Model Ensemble Mean (MME)

Several studies [40,41,42] have suggested that one GCM is insufficient to assess the uncertainties associated with the future climate. MMEs are widely employed in climate forecasting to reduce uncertainties inherent in GCM simulations and projections. Uncertainties in climate projections stemming from GCM structure, assumptions, initial conditions, and parameterization can be reduced by identifying an ensemble of better-performing GCMs [43,44,45]. By integrating predictions from various climate models, this approach aims to capture a broader range of potential outcomes, thereby improving the robustness of climate forecasts. Different approaches are documented in the literature for calculating an ensemble mean of GCMs, ranging from a simple arithmetic mean to machine learning algorithms [44]. This study used a simple arithmetic mean to calculate an ensemble mean of GCMs. Simple mean-based MMEs were developed by averaging the simulated precipitation and temperature (Tmax and Tmin) of the GCMs [46] using Equation (5).
S M = 1 n i = 1 n G C M i
where n refers to the number of GCMs considered for developing MMEs.

2.5. Trend Analysis

Analyzing trends is a crucial aspect of examining time series data. Both parametric and non-parametric tests are commonly used in trend analysis. Mann–Kendall’s test is a widely recognized non-parametric method for detecting trends in time series data, particularly valued for its robustness against outliers and flexibility in identifying linear and nonlinear trends [47]. The MK test is based on the test statistic S and calculated from the difference between later and earlier measured values, (xjxi), where j > i [48]. The Mann–Kendall test statistic is computed as follows:
S = i = 1 n 1 j = i + 1 n s i g n x j x i   S = i = 1 n 1 j = i + 1 n S g n θ
where Sgn(θ) satisfies any of the following conditions:
S g n θ = + 1   ( x j x i ) > 0 0     ( x j x i ) = 0 1   x j x i < 0
With xj and xi being sequential data values, n is the length of the dataset.
Variance (S) is computed in Equation (8) to obtain the Z value.
V a r S = n n 1 2 n + 5 i = 1 n t i ( t i 1 ) ( 2 t i + 5 ) 18
where ti is the number of ties of extent i.
The standardized test statistic ZMK for the Mann–Kendall trend is computed as follows:
Z M K = S 1 V a r ( S ) ,   if   S > 0 0 ,   if   S = 0 S + 1 V a r ( S )   ,   if   S < 0
where S is the Mann–Kendall statistic, and Var(S) is the variance of S. The standardized test statistics ZMK, therefore, measure the significance of the trend. A positive Z value indicates an increasing trend, while a negative value indicates a decreasing trend. A previous study by the authors of [48] examined the Olifants River basin’s monthly and seasonal rainfall trends. This study focused on the annual average rainfall and temperature trends to capture long-term climatic changes in the basin.

2.6. Hydrological Modeling

SWAT+ is a revised version of the SWAT model [23], developed to address present and future challenges to water resource modeling and management [22,25]. SWAT+ enhances the spatial representation of watershed interactions and processes, making it a valuable tool for simulating water quality and quantity across various scales [23]. This model allows for detailed assessments of land use impacts, management practices, and climate change on hydrological dynamics [49,50]. This study utilized the revised version of the Soil and Water Assessment Tool model (SWAT+, revision 60.5.4) to simulate streamflow response to climate change for the Olifants River basin. The model uses the same equations as SWAT to represent hydrological processes (Equation (10)), offering users more flexibility in configuring the model [51].
S W t = S W O + i = 1 t P d a y Q s u r f E a W s e e p Q g w
where SWt is the final soil water (mm), SW0 is the initial soil water (mm), Pday is the precipitation at the time i (mm), QSurf is the surface runoff (mm), Ea is the evapotranspiration (mm), Wseep is the water flow to the unsaturated zone (mm), and Qgw is the amount of return flow on the day (mm).

2.6.1. Model Sensitivity Analysis, Calibration, and Validation

Sensitivity analysis, calibration, and validation were conducted using the SWAT+ toolbox in QGIS. The SWAT+ toolbox is one of the latest free software tools, which helps users to analyze uncertainty, calibration, and model validation [22,52]. Since many parameters influence watershed processes, identifying the most sensitive parameters and minimizing the free parameters through sensitivity analysis was essential [53]. The SWAT+ toolbox offers four methods for sensitivity analysis, allowing users to select the most suitable method for their specific needs [54]. Among these, the Sobol method is the most commonly used in hydrology due to its accuracy, efficiency, and capability to account for dependencies between input variables [52]. This study employed the Sobol method to rank various sensitive parameters that affect stream flow. The calibration and validation processes that follow sensitivity analysis are essential for improving the accuracy and reliability of models in hydrological studies [55]. These processes involve systematically adjusting model parameters to ensure simulated outputs align with observed data, allowing the model to predict hydrological responses effectively. The Dynamically Dimensioned Search (DDS) algorithm was selected in the SWAT+ toolbox to optimize the model parameters, enabling automatic calibration and assessing parameter sensitivity. The SWAT+ toolbox, version 1.0.5, an independent tool from SWAT+, was explicitly used to calibrate and validate streamflow data. The SWAT+ model was calibrated and validated using monthly streamflow data. Monthly calibration provides a reliable representation of hydrological patterns and seasonal flow dynamics, essential for assessing climate change impacts. This approach is commonly used in large-scale basin studies, where monthly records are consistent and less affected by missing data compared to daily records. The calibration covered the period from 1988 to 1995, whereas validation was performed with data from 1996 to 1999. Additionally, a one-year warm-up period (1987 to 1988) was included to enhance the model’s stability and accuracy.

2.6.2. Model Performance Evaluation

The performance of the model was evaluated to assess how well the model’s simulated values fit the observed values [56]. We adopted the model performance classification proposed in [57] to evaluate the model performance. The metrics used for this evaluation include the Nash–Sutcliffe efficiency (NSE), coefficient of determination (R2), and percent bias (PBIAS). The model performance was evaluated as per the summarized criteria presented in Table 4.

3. Results

3.1. Performance of the Hydrological Model

Table 5 presents the list of sensitive parameters and their rankings. Among the selected parameters, CN2, ESCO, EPCO, AWC, ALPHA, and REVAP were found to be the most sensitive parameters. The CN was the most sensitive parameter, highlighting its dominant role in simulating surface runoff in the Olifants River basin. Both graphical and quantitative techniques were employed to assess the performance of the hydrological model. The model performance evaluation statistics for both the calibration and validation periods depict a satisfactory agreement between simulated and observed streamflow values.
Figure 6 presents a comparison between the observed and simulated monthly streamflow during the calibration and validation period. The results indicate a strong agreement between observed and simulated data, with NSE values of 0.76 and 0.77 for the calibration and validation periods, respectively (Table 6). Both NSE values exceed the threshold of 0.70, indicating excellent model performance [57]. The coefficient of determination was also above the acceptable range, with values of 0.78 during calibration and 0.82 during validation. Nevertheless, the PBIAS values remained within the acceptable range. As noted by the authors of [57], the model slightly overestimated the observed streamflow by 5.76% during the calibration period and 12.22% during the validation period. The model demonstrated satisfactory performance and effectively captured high and low streamflow variations. The models sufficiently simulated streamflow values comparable to the observed monthly time series.

3.2. Rainfall and Temperature Trend Analysis

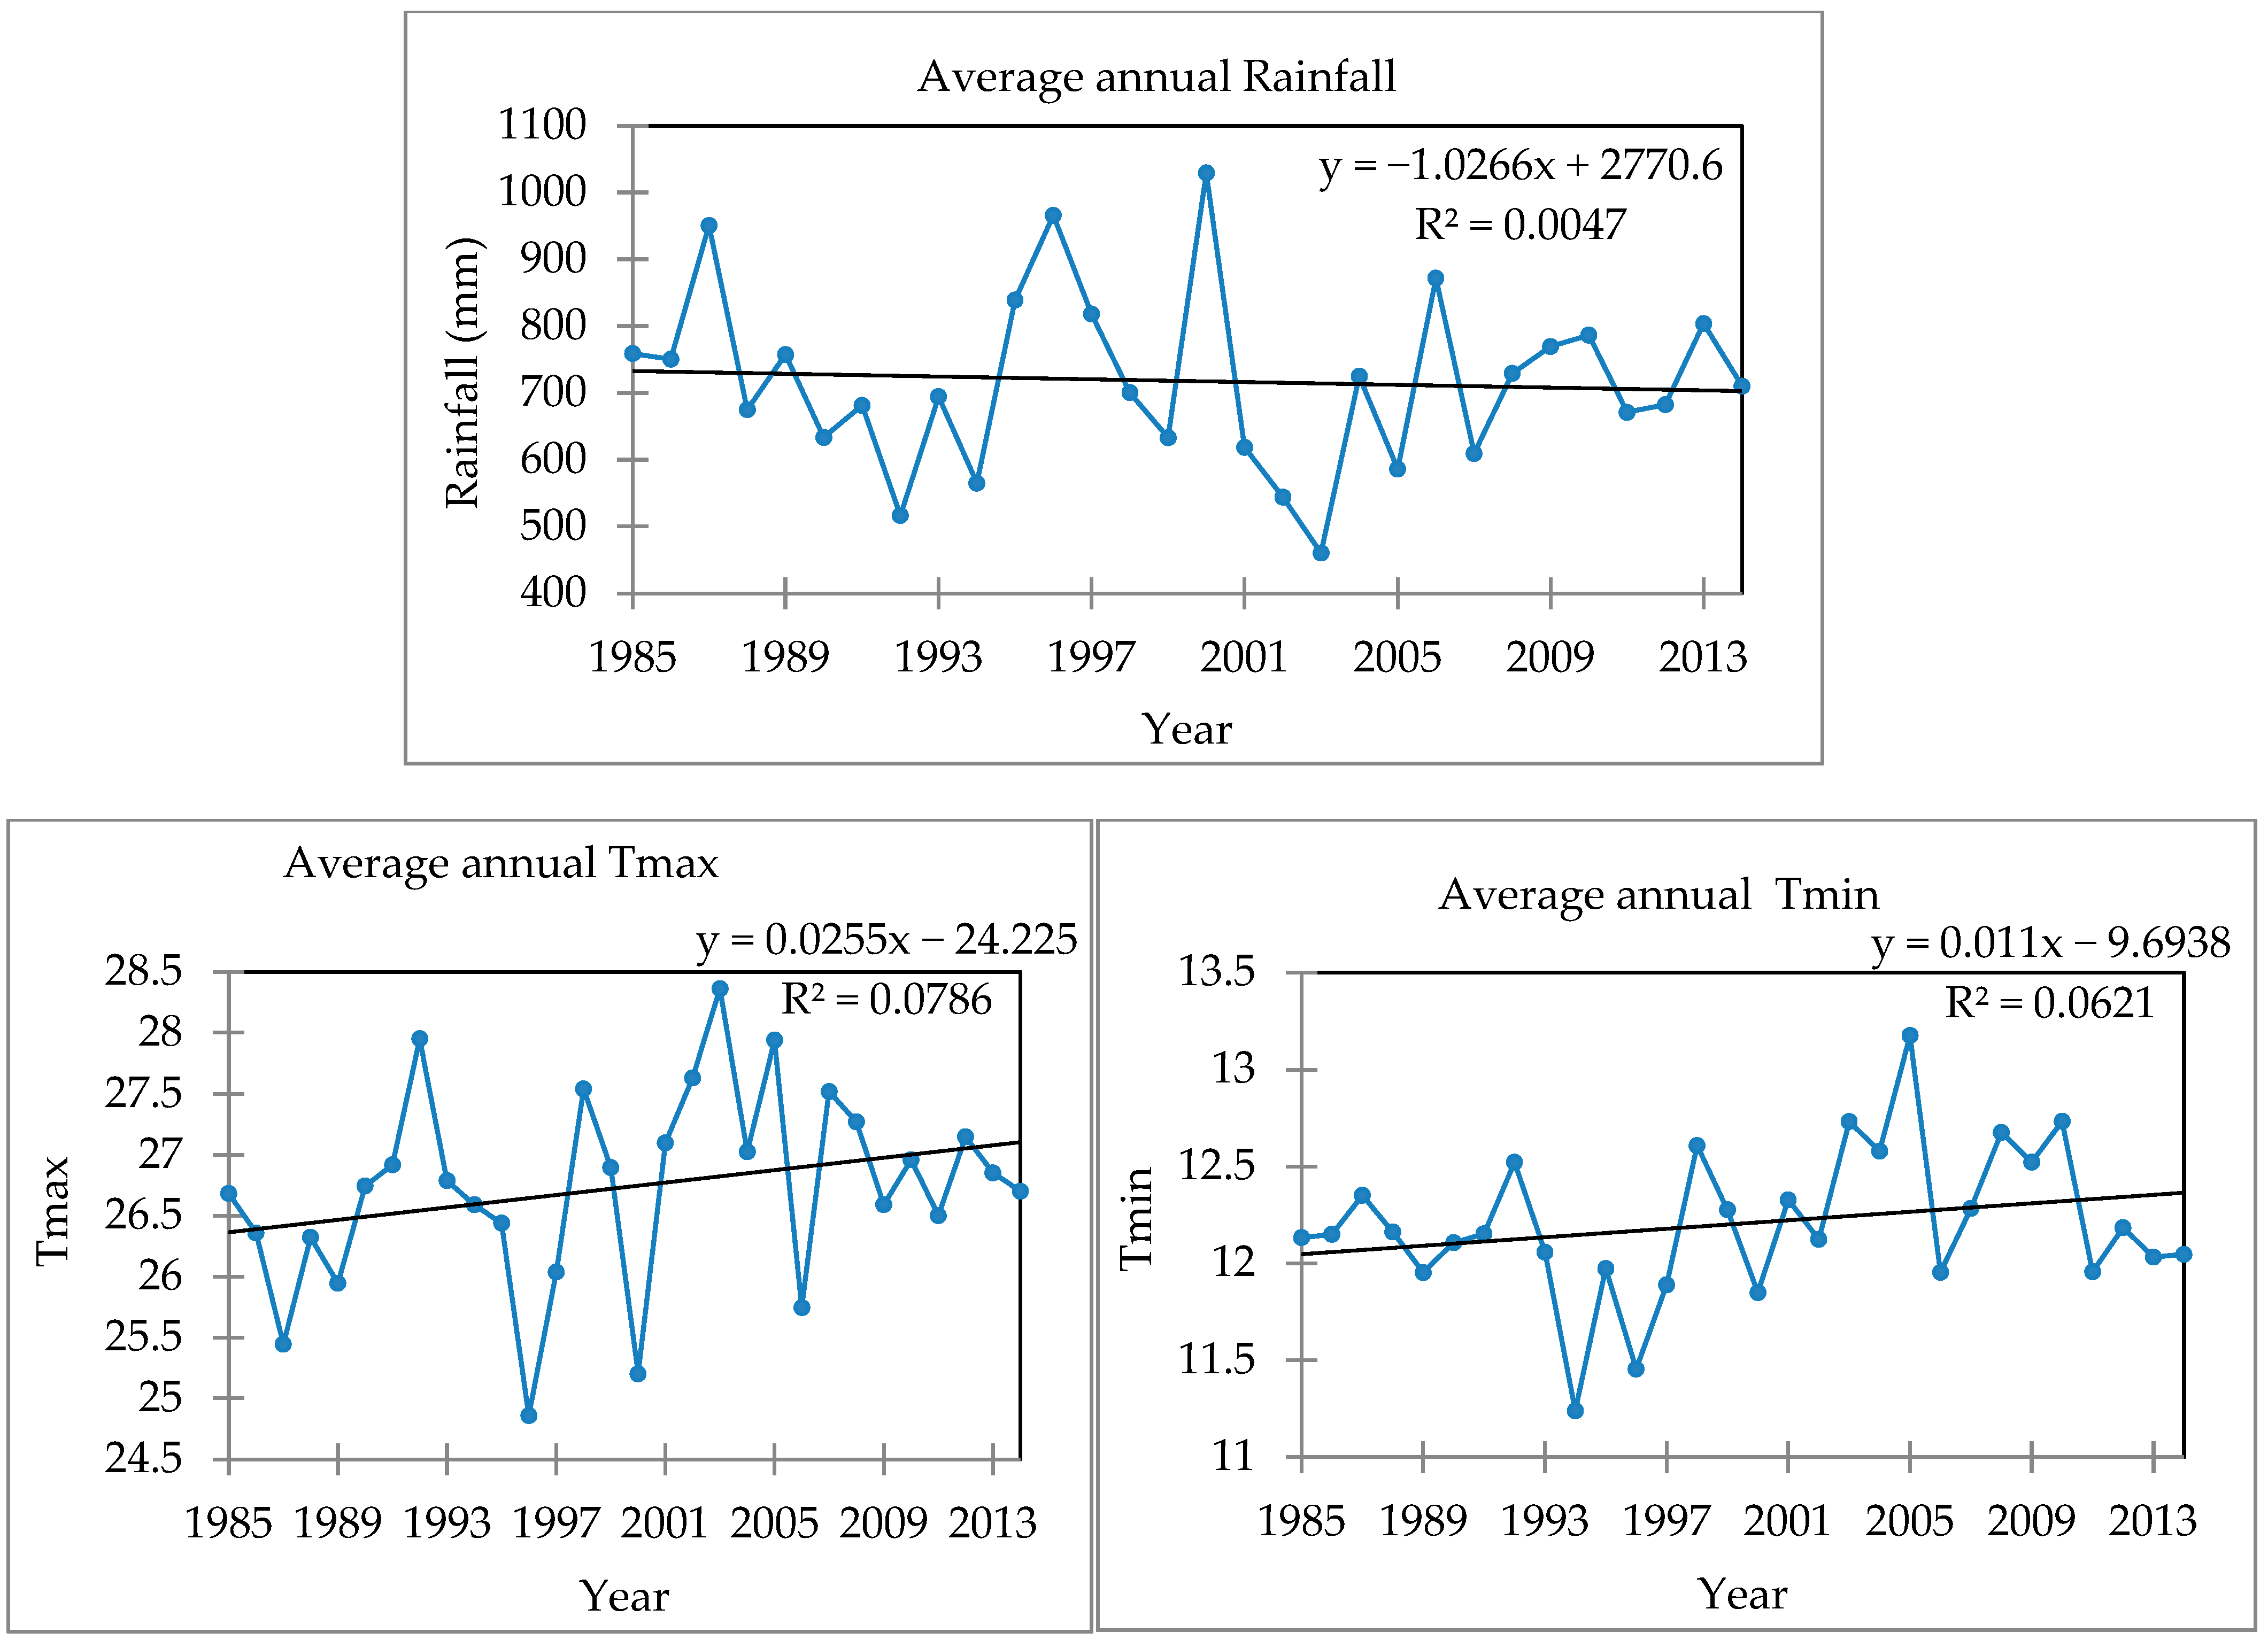
Figure 7 presents the results of the non-parametric MK test for the average annual rainfall and temperature of the Olifants River basin. The average annual rainfall for the Olifants basin exhibits an insignificant decreasing trend. A decreasing but insignificant trend in rainfall has also been reported in South Africa, particularly in the northeastern part of the region [58]. These results are consistent with the research in [11,48], which examined long-term trends in the Olifants River basin using a similar approach. A similar study [11] in the basin indicates that the rainfall decreases, but the annual and seasonal trends are not statistically significant. For temperature, the Mann–Kendall trend analysis revealed a positive Z value of 0.33 and Sen’s slope of 0.02 for average Tmax, indicating that the average annual Tmax significantly increased over the analysis period. This trend suggests that the basin has been experiencing a gradual increase in Tmax, which may affect the basin’s evaporation rates, water availability, and overall hydrological processes. These findings are consistent with a previous study [11], which also reported long-term warming trends in the basin using a similar statistical approach. The consistency between these results strengthens the reliability of the observed warming pattern and highlights the ongoing impact of climate change in the basin. In addition to Tmax, the average annual Tmin trend analysis showed an increasing trend with a Z value of 0.15 over the analyzed period. The increasing trends in temperature (Tmax and Tmin) underscore the need to formulate climate-resilient planning projects and adaptation strategies, particularly for water-stressed basins like Olifants, where rising temperatures may exacerbate existing challenges related to water resources management.

3.3. Projected Changes in Climatic Variables

3.3.1. Monthly Precipitation

The study area’s projected climate change depicts a considerable change in precipitation and temperature under the SSP245 and SSP585 scenarios, each revealing distinct climatic patterns. The projected monthly precipitation under SSP245 indicates a decrease across most months, with slight increases in January, July, and December, suggesting a shift in seasonal patterns. Moreover, this suggests a nuanced response to moderate emission scenarios, potentially influenced by regional climatic factors. Conversely, SSP585 indicates a consistent decline in precipitation across all months for both the near and far future periods. This consistent decline in monthly precipitation under SSP585 reflects the impact of high emissions on global precipitation patterns. Figure 8 presents the average monthly variations in precipitation under the SSP245 and SSP585 scenarios for the near and far future in the study basin.
Various climatic factors influence the monthly precipitation change and exhibit significant variability across different regions. Under both SSP245 and SSP585 scenarios, the Southern Africa region is expected to experience a trend toward drying, with dry years projected by the end of the 21st century, indicating significant changes in monthly precipitation patterns [59].

3.3.2. Monthly Temperature

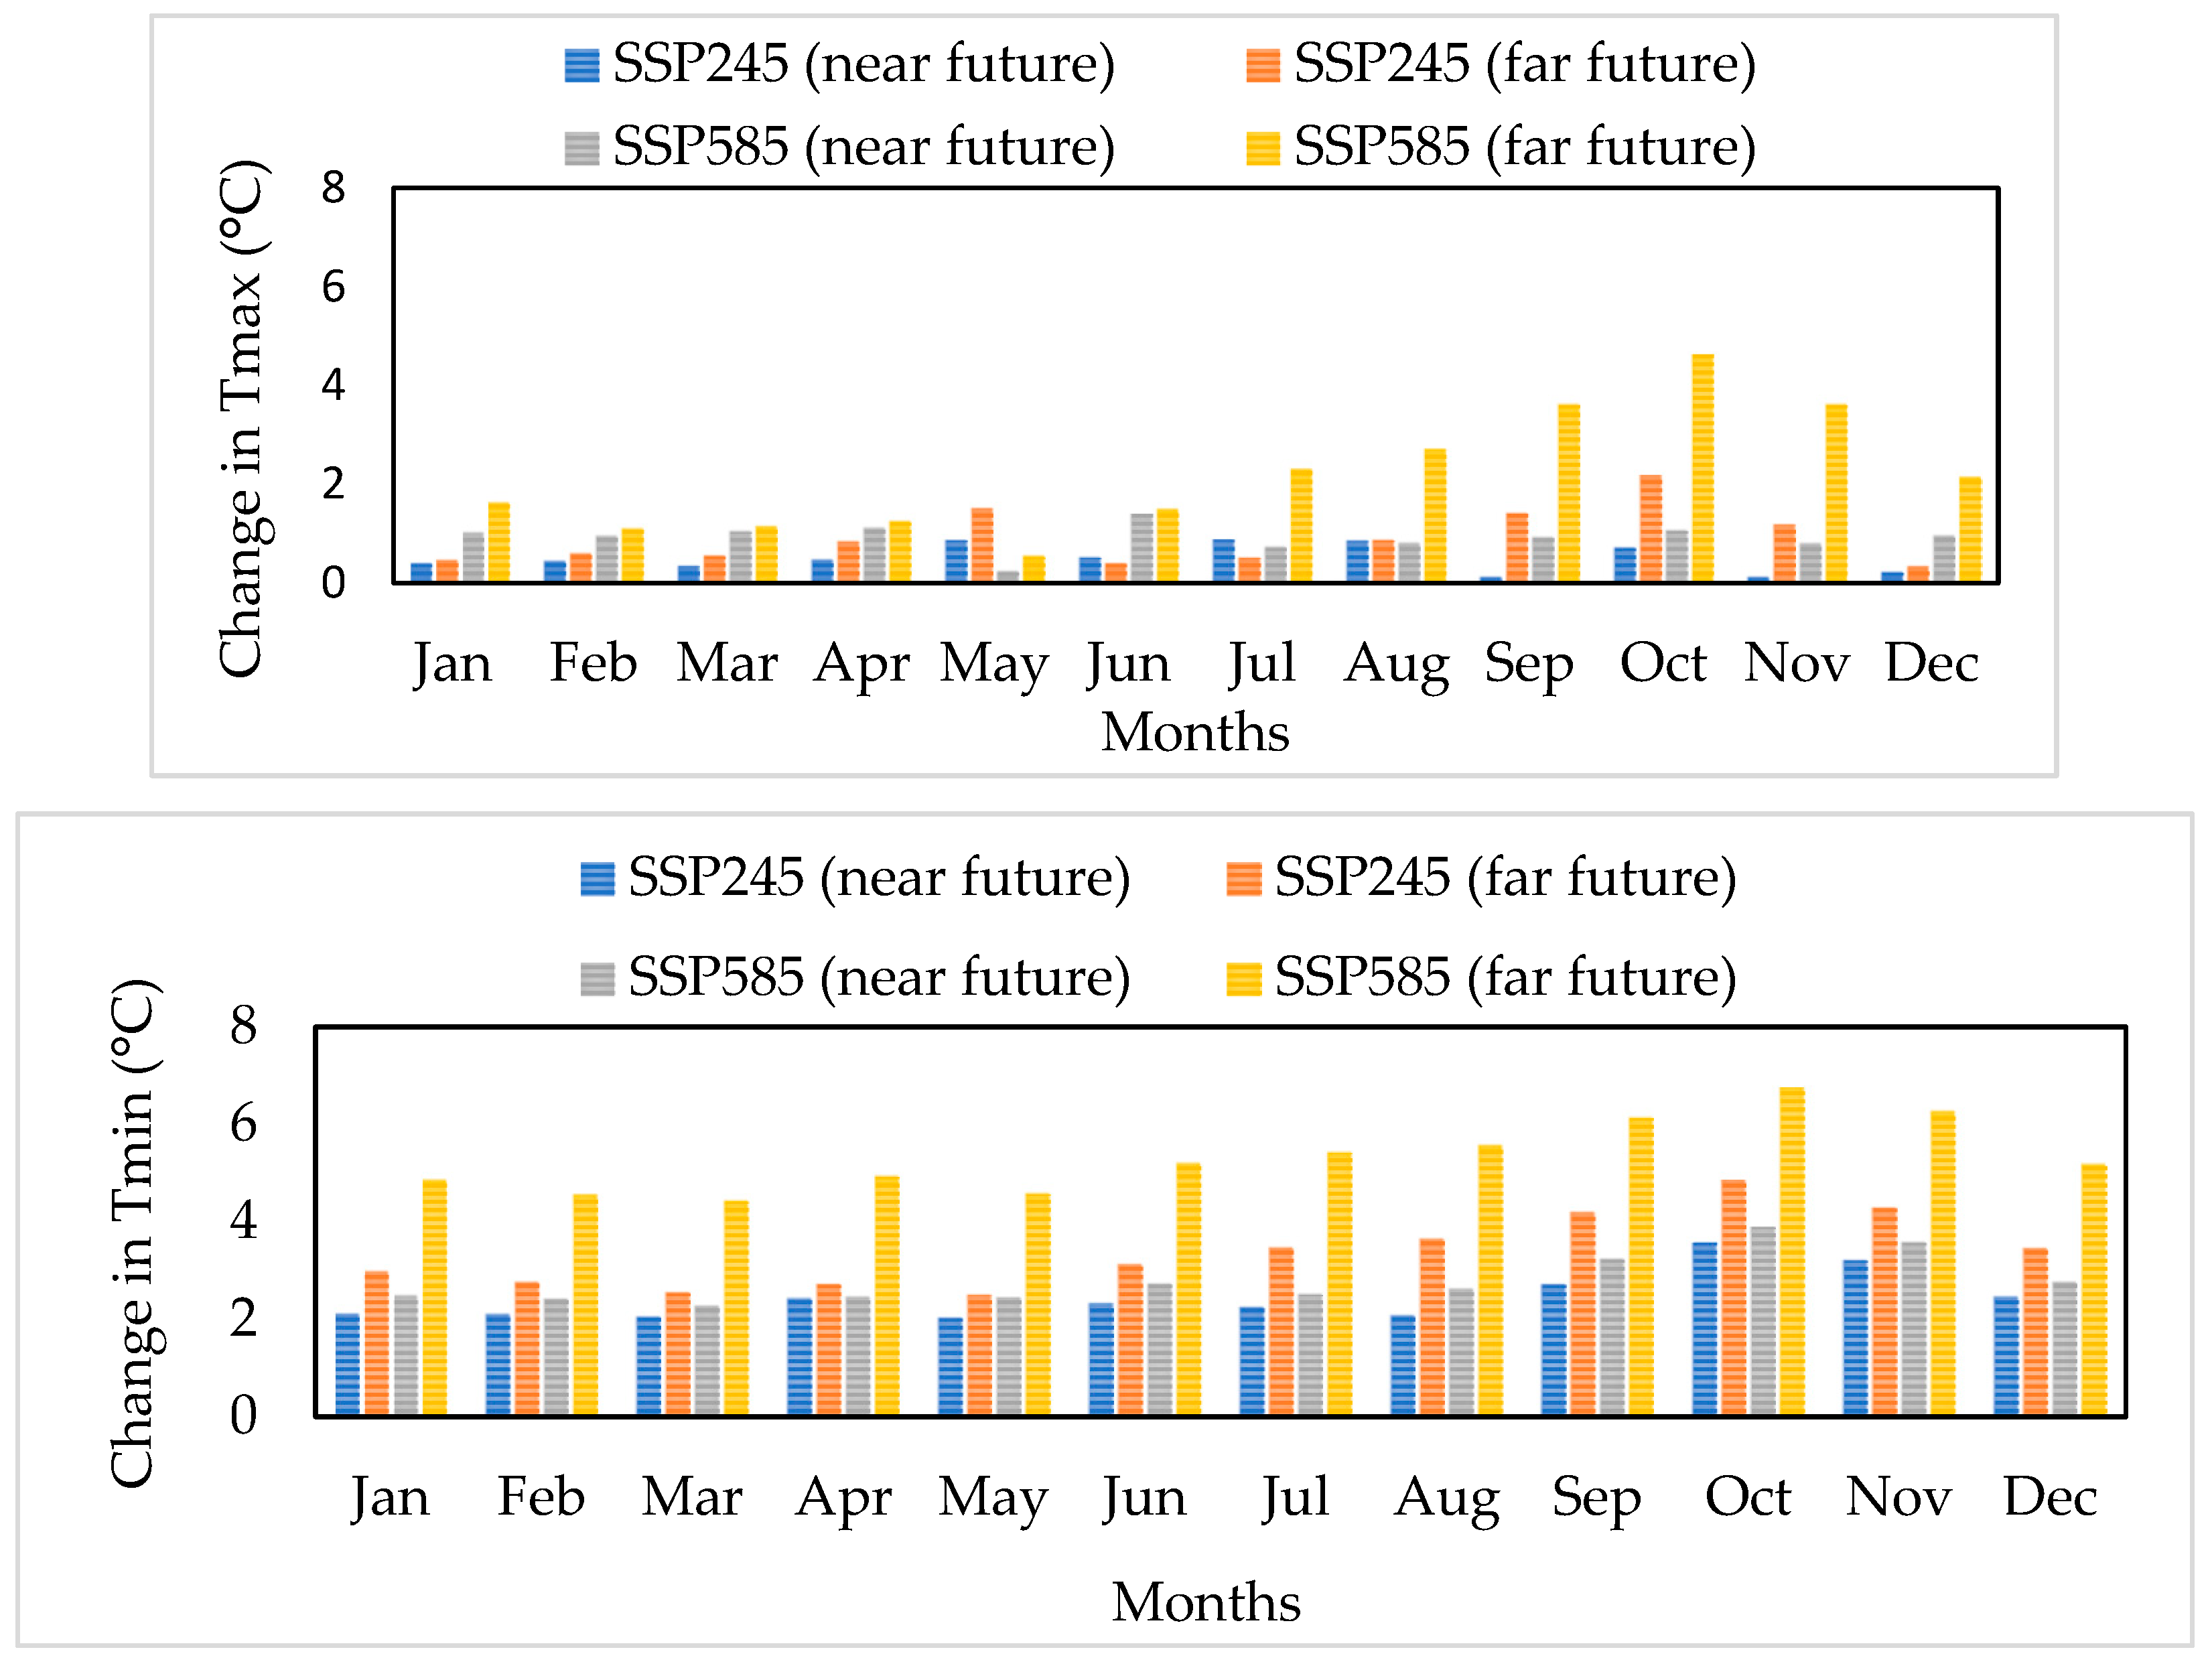
The projected changes in Tmax and Tmin under the SSP245 and SSP585 scenarios show a notable increase across all months in the basin. Figure 9 illustrates the monthly variations in Tmax and Tmin under the SSP245 and SSP585 scenarios. Both scenarios predict a rise in average temperatures, with Tmin expected to increase more than Tmax under both scenarios, which aligns with global climate change patterns observed in many regions. The Tmin is projected to increase more frequently during the spring (September to November) and winter (June to August) seasons than in summer (December to February) and autumn (March to May). This warming trend in minimum temperatures is projected to be more profound under the SSP585 scenario, particularly in the far future.
Under SSP245, the average maximum temperature is projected to increase by nearly 0.86 °C in the near future and will increase to 2.19 °C in the future scenario. SSP585 predicts even higher increases, with maximum temperatures potentially rising to 1.41 °C and 4.65 °C in the near and far future. These projections indicate a rise in temperatures and a decline in precipitation, which will profoundly impact water resources management and agricultural activities in the basin. Specifically, rising minimum and maximum temperatures under both scenarios will alter the hydrological cycle in the basin as warmer temperatures increase evaporation, reducing soil moisture and surface runoff. These changes are expected to exacerbate existing water stress in the region, causing an imbalance between water supply and demand.

3.3.3. Annual Changes in Precipitation and Temperatures

Table 7 presents the projected changes in mean annual precipitation and temperature during the near and far future periods under the SSP245 and SSP585 emission scenarios. Projected mean annual precipitation shows a consistent decline across the basin in future periods under both SSP245 and SSP585 scenarios. Long-term average annual precipitation change showed that the ensemble average of GCMs predicts a decline of 15.21% and 17.57% under SSP245 and 21.01% and 19.77% under SSP585 for the near and far future, respectively. This reduction in precipitation, combined with increased temperatures, is likely to lead to decreased river discharge. The projected average annual maximum and minimum temperatures significantly increase in both future periods. The range of percentage changes in Tmax and Tmin is between 0.5 °C to 1.06 °C and 2.45 °C to 3.38 °C under SSP245 during the near and far future, respectively. Under the SSP585 scenario, the range is between 0.82 °C to 3.22 °C for Tmax and 2.78 °C to 5.33 °C for Tmin during the near and far future, respectively. The increment in Tmax and Tmin obtained in this investigation aligns with the study results reported in [12], which found that future projections indicate a rise in average temperatures between 1 °C and 5 °C by 2090.
Additionally, our results reveal a more rapid increase in Tmin than Tmax in the basin. The increase in temperature is in line with broader regional trends observed across Africa, where significant warming is projected under both scenarios [60]. The analysis indicates a decreasing trend in precipitation and increasing Tmax and Tmin over time, aligning with previous research in the Olifants River basin [11,12,13]. The projected changes in precipitation and temperature in the basin highlight critical challenges due to climate change. This reduction in precipitation, combined with increased temperatures, is likely to lead to decreased river discharge. The anticipated decrease in precipitation, coupled with significant increases in temperature under both SSP245 and SSP585 scenarios, necessitates urgent adaptation strategies for water resource management. Generally, the Olifants River basin in South Africa faces significant climatic changes due to global warming, with projections indicating alterations in precipitation and temperature under various SSPs. The basin faces significant climate change effects in the SSP245 and SSP585 scenarios, with a significant decline in precipitation with rising temperatures. These climate changes will impact seasonal water resource availability and demands, requiring integrated and adaptive management strategies. For instance, irrigation demands are expected to rise due to increased evapotranspiration and reduced rainfall during critical growing periods [12].

3.4. Streamflow Response to Climate Change

Figure 10 presents the monthly observed and projected streamflow for different future periods under the SSP245 and SSP585 scenarios. It is evident that, relative to the observed baseline flow, streamflow is projected to decline across all months under both SSP scenarios in the basin. Surface runoff, a significant contributor to streamflow, is projected under SSP scenarios. The results revealed a significant annual decline in surface runoff, with reductions of 44.16% and 51.35% under SSP245 and decreases of 61.75% and 58.98% under SSP585 for the near and far future, respectively. This decline in surface runoff is critical, as it directly affects water-dependent agricultural, domestic, and ecological sectors [11]. The annual river discharge in the basin is generally forecasted to show a decreasing trend under all SSP scenarios.
Similarly, projected declines in precipitation and temperature increases are expected to impact streamflow in the Olifants River basins. For instance, expected reductions in precipitation range from 5% to 30%, leading to a potential decrease in streamflow [12]. These climatic changes have significantly impacted hydrological cycles, reducing water availability in various regions. Moreover, the decline in streamflow affects water resource management and agriculture, necessitating adaptation strategies. Therefore, under projected streamflow decline, adaptations must target policy and sectors, including agriculture and infrastructure. Policy should focus on integrated water management and climate-resilient planning. Agricultural adaptations include water-efficient practices and drought-tolerant crops. Infrastructure priorities should be to develop water storage systems and modernize irrigation networks to secure the water supply.
Table 8 presents the percentage change in predicted annual streamflow for the near and far future scenarios relative to the baseline period. The average annual streamflow of 263.08 m3/s during the baseline period is expected to decline sharply owing to climate change in the basin, with reductions of 43.09% and 50.89% under the SSP245 scenario and 57.79% and 58.82% under the SSP585 scenario for the near and far future periods, respectively. This decline in streamflow is due to rising Tmax and Tmin, coupled with a significant reduction in precipitation, as evidenced by multiple studies. For instance, ref. [61] demonstrated that decreased precipitation and increased temperatures have significantly reduced streamflow in the Mediterranean region. Similarly, ref. [62] found that future climate change scenarios in the Little Ruaha catchment are projected to substantial decline in streamflow, primarily due to the combined impact of temperature and precipitation changes.
Seasonal projections of the Olifants River basin show significant streamflow reductions across all seasons due to climate change (Figure 11). These alterations are expected to adversely affect hydrological patterns, increasing drought frequency and water scarcity. According to the South African Weather Services, South Africa experiences four distinct weather seasons: summer (December–February), autumn (March–May), winter (June–August), and spring (September–November). These are the same seasonal patterns experienced in the Olifants River basin. The projected changes in seasonal streamflow indicate a consistent decrease across all seasons. Streamflow decreases of 39.71% (DJF), 49.51% (MAM), 34.18% (JJA), and 48.97% (SON) are anticipated under SSP245 for the near future. Further reductions are expected for the far future, with decreases of 49.07% (DJF), 55.80% (MAM), 42.74% (JJA), and 53.97% (SON). The projected changes in average seasonal streamflow indicate relatively slight variations during winter and summer compared to more significant shifts in autumn and spring for both near- and far-future scenarios under SSP245. This trend aligns with findings from various studies that highlight the impacts of climate change and human activities on hydrological patterns.
Under the SSP585 scenario, the study area faces significant seasonal streamflow fluctuations, with a more pronounced reduction expected in the far future. The projected changes in seasonal streamflow indicate significant decreases across various seasons. Specifically, the near-future projections show reductions of 59.56% in summer (DJF), 62.27% in autumn (MAM), 42.29% in winter (JJA), and 52.94% in spring (SON). These figures are projected to be 62.34%, 57.90%, 49.59%, and 59.24% in the far future, respectively.
The expected decline in precipitation, coupled with rising temperatures in Southern Africa, is anticipated to reduce streamflow, significantly impacting water availability across the region [5]. This situation is exacerbated by socioeconomic pressures and climate variability, increasing the risk of water scarcity. Projections indicate a decrease in precipitation and an increase in temperature, collectively threatening water availability. Several studies reveal a consistent trend of increasing temperatures and decreasing precipitation, which is expected to exacerbate water scarcity and affect streamflow dynamics in the basin studies [10,11,12]. However, some studies suggest localized increases in precipitation under specific scenarios, which could lead to temporary boosts in streamflow, highlighting the complexity of climate impacts in the region [62,63]. Projected precipitation changes in the semi-arid region indicate a complex future characterized by increases and decreases in rainfall, significantly impacting streamflow patterns [64]. As projected, a decline in precipitation and increased temperature under both climate change scenarios were major causes for the drastic decrease in streamflow in the Olifants River basin. As precipitation patterns shift, particularly under the projected climate change scenarios, the annual and monthly average streamflow within the basin is expected to decrease [12]. Precipitation intensity and frequency changes alter streamflow dynamics, affecting water availability for agriculture and the ecosystem. For instance, [12] indicates that the anticipated decline in water availability could increase unmet water demand by up to 80% by the end of the century, impacting economic activities reliant on water resources. The findings of this study align with [13], which highlights observed trends of increasing temperatures and the likely reduction in precipitation, emphasizing the river’s significant water stress owing to climate change. Generally, the streamflow response to climate change under SSP scenarios reveals significant variations across different regions and hydrological models. Numerous studies [33,61,62] indicate that climate change has a considerable effect on streamflow dynamics, specifically due to significant precipitation and temperature fluctuations. These findings align with studies conducted in similar regions by the authors of [65], who projected decreases in regional runoff by 8.7% under the A2 scenario and 3.9% under the B1 scenario, indicating a significant reduction in water availability. Generally, hydroclimatic shifts are exerting widespread and significant effects on water resource availability in southern Africa, with pressing consequences on river flow patterns, groundwater depletion, and reservoir management. Projections indicate a significant decline in river flow across the region under various climate change scenarios, intensifying existing water stress [66]. These changes are exacerbating the vulnerability of rural and marginalized communities, particularly in terms of access to clean water, agricultural dependency, and economic stability. These communities often rely on climate-sensitive resources for their livelihoods, including subsistence agriculture, livestock production, and local water supplies [67]. Therefore, understanding these dynamics is crucial for sustainable water resources management and adaptation strategies in the face of climate change.

4. Discussion

In southern Africa, shifting hydroclimatic conditions driven by climate change intensify water scarcity and create significant challenges for sustainable water resource management. By 2050, projections indicate that water availability will be reduced due to declining streamflow and increased actual evaporation rates, particularly affecting agriculture and hydropower generation [5]. One of the significant components of the hydrological cycle is streamflow, which is sensitive to climate variables such as precipitation, temperature, and evapotranspiration changes. Several studies [12,62,67,68] indicate that, while some regions experience increased precipitation, others will face significant declines. For instance, precipitation in the Rietspruit sub-basin is projected to increase under RCP4.5 and RCP8.5 scenarios, leading to a corresponding increase in streamflow by 53% and 47%, respectively [69]. However, precipitation has been declining by 20% in the projected climate scenario, which could also be reducing streamflow by 14% under worst-case scenarios in the Upper Crocodile River basin [63]. In the Limpopo River basin, precipitation patterns are becoming more extreme, with higher intensities and longer dry periods, despite no significant trends in annual totals [70]. Similarly, the Olifants River basin is expected to experience a 5–30% decrease in precipitation under the RCP4.5 and RCP8.5 scenarios, exacerbating water supply challenges [12]. These projections are consistent with the findings of the CMIP6 models, as summarized in the IPCC’s Sixth Assessment Report, which anticipates a general decline in precipitation across much of Southern Africa in the future. Temperature increases are a consistent feature of climate change projections in Southern Africa. For instance, the Vaal River catchment is expected to experience temperature increases of 0.07–5 °C by the end of the century, with corresponding reductions in summer streamflow [66]. Similarly, in the Rietspruit sub-basin, Tmax is projected to rise significantly, particularly in winter months, while Tmin shows variable trends, decreasing in the near- and mid-future under RCP4.5 and increasing in the far future [69]. These temperature increases will exacerbate evaporation, further reducing water availability in already water-stressed regions. Furthermore, as temperatures increase under projected climate change scenarios, PET is expected to increase. This increase in PET can reduce the amount of water available for surface runoff and streamflow, particularly in semi-arid regions like the Olifants River basin. Studies indicate significant temperature increases and precipitation declines, threatening water availability and exacerbating existing water stress in the region [12,60]. Trends observed in the Olifants River basin align with broader Southern African studies, underlining climate change’s widespread threat to regional water security [9,13,71].
Climate change is expected to significantly impact streamflow in South Africa, with varying responses across different river basins. For example, streamflow in the Limpopo River basin is expected to decrease, with the basin projected to experience more frequent dry conditions and fewer wet years [72]. Conversely, in the Rietspruit sub-basin, increased precipitation under the RCP4.5 and RCP8.5 scenarios is projected to lead to higher streamflow [69]. Climate change is also altering the frequency and intensity of extreme hydroclimatic events. For instance, prolonged droughts have been linked to increased flood intensity in the Limpopo River basin due to positive correlations between maximum river flow and antecedent drought conditions [73]. This highlights the complex interplay between droughts and floods in shaping streamflow dynamics. Similarly, in the Upper Umvoti River basin, interactions between temperature and land cover changes, such as afforestation, influence streamflow [68].
Climate change projections for the basin indicate significant declines in water availability owing to reduced precipitation and increased temperatures, which threaten the ecosystem health of the basin. These changes threaten the ecosystem health of the basin and the livelihoods of local communities that rely on water resources for agriculture, drinking, and industrial activities, such as mining extraction in the upper part of the basin. The primary influence of climate change on streamflow has been driven by decreased precipitation and increased temperatures, resulting in reduced water availability for hydrological processes and a decline in river and stream flows [53]. In this study, projections under the SSP (SSP245 and SSP585) scenarios reveal a consistent decline in precipitation and a rise in both Tmax and Tmin across the near and far future. These changes are projected to significantly reduce streamflow and alter the basin’s overall hydrological balance. Previous studies in the Olifants River basin under the Representative Concentration Pathways (RCP4.5 and RCP8.5), such as those by the authors of [11,28], also reported declining precipitation patterns and increasing temperatures, leading to reduced streamflow. Compared to these earlier RCP-based studies, the current SSP-based results are consistent in trend but show slightly more pronounced reductions, especially under SSP585, which aligns with the updated projections associated with CMIP6 models. In the Olifants River basin, increased evapotranspiration due to higher temperatures is expected to exacerbate water supply challenges, with unmet water demand projected to increase by 58% and 80% under the RCP4.5 and RCP8.5 scenarios, respectively [12]. In the Vaal River catchment, reduced streamflow during summer months is expected to limit water availability, particularly for irrigation and urban use [66]. These changes underscore the need for integrated water management strategies to mitigate the impacts of climate change on water resources. Key strategies include rainwater harvesting for dry periods, drought-resistant crop varieties to reduce vulnerability, improved irrigation efficiency, catchment conservation to enhance infiltration, and local water storage infrastructure development, such as small dams, to buffer seasonal shortages. These measures can help to mitigate the impact of reduced streamflow and sustainable water management under future climate conditions.

5. Conclusions

This study investigates the impacts of climate change on streamflow in the Olifants River basin, utilizing climate data derived from two shared socioeconomic pathways: SSP245 and SSP585. Dynamic downscaling and distribution mapping techniques were employed to minimize systematic biases in climate model data outputs from five GCMs. The SWAT+ model simulated future streamflow using bias-corrected and downscaled climate projections. The results indicate a consistent pattern of rising temperatures and declining precipitation under both emission scenarios considered. Under SSP245, Tmax is projected to increase by 0.5 °C in the near future and by 1.02 °C in the far future, while SSP585 shows an increase of 0.82 °C and 3.22 °C, respectively. Tmin is expected to rise by 2.45 °C and 3.38 °C under SSP245 and 2.78 °C and 5.33 °C under SSP585. Precipitation is expected to decline by 15.21% and 17.57% under SSP245 and by 21.01% and 19.77% under SSP585 in the near and far future, respectively. These climatic shifts are projected to reduce streamflow and intensify water stress in the basin significantly. Average annual streamflow is expected to decline significantly, with reductions of 43.09% and 50.89% under SSP245 and 57.79% and 58.82% under SSP58.5 for the near and far future periods, respectively. The results of this study indicate that streamflow during both scenarios is likely to decrease, consistent with a decline in precipitation and an increase in temperature under both the SSP scenarios. Seasonal streamflow is also projected to decline across all seasons. Under SSP245, in the near future, streamflow reductions of 39.71% in summer (DJF), 49.51% in autumn (MAM), 34.18% in winter (JJA), and 48.97% in spring (SON) are anticipated. These reductions are expected to intensify in the far future, reaching 49.07% (DJF), 55.80% (MAM), 42.74% (JJA), and 53.97% (SON). Under the SSP585 scenario, even more pronounced seasonal decreases are projected by 59.56% (DJF), 62.27% (MAM), 42.29% (JJA), and 52.94% (SON) in the near future, increasing to 62.34%, 57.90%, 49.59%, and 59.24% in the far future, respectively. This study’s findings reveal a significant decline in seasonal streamflow, underscoring challenges for water availability. Addressing these challenges requires combining adaptation strategies and integrated water management approaches to ensure sustainable water availability. Policymakers must integrate climate projections into water resource planning and prioritize watershed management practices to mitigate risks and ensure long-term water security. Future research should consider the combined impacts of climate change and human activities, such as land use and land cover, on water availability.

Supplementary Materials

The following supporting information can be downloaded at: https://www.mdpi.com/article/10.3390/hydrology12090244/s1. Supplementary S1: NetCDF file extraction Precipitation and Temperature.

Author Contributions

Conceptualization, K.K.B., M.O.D., S.S.R. and M.R.A.; methodology, K.K.B.; Software, K.K.B.; formal analysis and investigation, K.K.B.; writing—original draft preparation, K.K.B.; writing—review and editing, K.K.B., M.O.D., S.S.R. and M.R.A.; visualization, K.K.B.; investigation, K.K.B.; supervision, M.O.D., S.S.R. and M.R.A. All authors have read and agreed to the published version of the manuscript.

Funding

This research received no external funding.

Data Availability Statement

The corresponding author will provide the processed datasets used in this study upon a reasonable request.

Acknowledgments

We acknowledge the South African Weather Service (SAWS) and the Department of Water and Sanitation (DWS) for providing the observed climate and hydrological data. We acknowledge the logistics support of the University of Johannesburg. We also thank the editor and the reviewers for their valuable time and constructive feedback.

Conflicts of Interest

The authors declare no conflicts of interest.

References

  1. Wang, X.; Liu, L. The Impacts of Climate Change on the Hydrological Cycle and Water Resource Management. Water 2023, 15, 2342. [Google Scholar] [CrossRef]
  2. Ehtasham, L.; Sherani, S.H.; Nawaz, F. Acceleration of the hydrological cycle and its impact on water availability over land: An adverse effect of climate change. Meteorol. Hydrol. Water Manag. 2024, 12, 1–21. [Google Scholar] [CrossRef]
  3. Kgabi, N.A.; Amwele, H.R. Ensuring Sustainability of Groundwater Resources: A Review of Challenges and Initiatives by Southern African Arid and Semi-arid Countries. In Water Management in Developing Countries and Sustainable Development; Springer: Singapore, 2024. [Google Scholar] [CrossRef]
  4. Thakur, R. The Impacts of Climate Change on Water Resources in the Anthropocene: Mitigation and Adaptation Strategies in Southern Africa. In Climate Change and Socio-Political Violence in Sub-Saharan Africa in the Anthropocene; Springer: Cham, Switzerland, 2024. [Google Scholar] [CrossRef]
  5. Kusangaya, S.; Mazvimavi, D.; Shekede, M.D.; Masunga, B.; Kunedzimwe, F.; Manatsa, D. Climate Change Impact on Hydrological Regimes and Extreme Events in Southern Africa. In Climate change and water resources in Africa; Springer: Cham, Switzerland, 2021; pp. 87–129. [Google Scholar] [CrossRef]
  6. Park, S.Y.; Moon, H.T.; Kim, J.S.; Lee, J.H. Assessing the Impact of Human-Induced and Climate Change-Driven Streamflow Alterations on Freshwater Ecosystems. Ecohydrol. Hydrobiol. 2024, 25, 1–9. [Google Scholar] [CrossRef]
  7. Reshma, C.; Arunkumar, R. Assessment of impact of climate change on the streamflow of Idamalayar River Basin, Kerala. J. Water Clim. Chang. 2023, 14, 2133–2149. [Google Scholar] [CrossRef]
  8. Kassaye, S.M.; Tadesse, T.; Tegegne, G.; Hordofa, A.T.; Malede, D.A. Relative and Combined Impacts of Climate and Land Use/Cover Change for the Streamflow Variability in the Baro River Basin (BRB). Earth 2024, 5, 149–168. [Google Scholar] [CrossRef]
  9. Kusangaya, S.; Warburton, M.L.; Archer van Garderen, E.; Jewitt, G.P.W. Impacts of climate change on water resources in southern Africa: A review. Phys. Chem. Earth 2014, 67, 47–54. [Google Scholar] [CrossRef]
  10. Nkhonjera, G.K.; Dinka, M.O.; Woyessa, Y.E. Assessment of localized seasonal precipitation variability in the upper middle catchment of the olifants river basin. J. Water Clim. Chang. 2021, 12, 250–264. [Google Scholar] [CrossRef]
  11. Adeola, A.M.; Kruger, A.; Makgoale, T.E.; Botai, J.O. Observed trends and projections of temperature and precipitation in the Olifants River Catchment in South Africa. PLoS ONE 2022, 17, e0271974. [Google Scholar] [CrossRef]
  12. Olabanji, M.F.; Ndarana, T.; Davis, N.; Archer, E. Climate change impact on water availability in the olifants catchment (South Africa) with potential adaptation strategies. Phys. Chem. Earth 2020, 120, 102939. [Google Scholar] [CrossRef]
  13. Udall, B. 21st Century Climate Change Impacts on Olifants River Flows. 2018, pp. 1–38. Available online: https://cer.org.za/wp-content/uploads/2019/08/Annexure-I-Udall-Report.pdf (accessed on 22 July 2024).
  14. Gyamfi, C.; Ndambuki, J.M.; Salim, R.W. Hydrological responses to land use/cover changes in the Olifants Basin, South Africa. Water 2016, 8, 588. [Google Scholar] [CrossRef]
  15. Ershadfath, F.; Shahnazari, A.; Sarjaz, M.R.; Andaryani, S.; Trolle, D.; Olesen, J.E. Blue and green water availability under climate change in arid and semi-arid regions. Ecol. Inform. 2024, 82, 102743. [Google Scholar] [CrossRef]
  16. Durack, P.J.; Taylor, K.E.; Gleckler, P.J.; Meehl, G.A.; Lawrence, B.N.; Covey, C.; Stouffer, R.J.; Levavasseur, G.; Ben-nasser, A.; Denvil, S.; et al. The Coupled Model Intercomparison Project (CMIP): Reviewing project history, evolution, infrastructure and implementation. EGUsphere, 2025; 2025, 1–74. [Google Scholar] [CrossRef]
  17. Ma, D.; Bai, Z.; Xu, Y.P.; Gu, H.; Gao, C. Assessing streamflow and sediment responses to future climate change over the Upper Mekong River Basin: A comparison between CMIP5 and CMIP6 models. J. Hydrol. Reg. Stud. 2024, 52, 101685. [Google Scholar] [CrossRef]
  18. Eyring, V.; Cox, P.M.; Flato, G.M.; Gleckler, P.J.; Abramowitz, G.; Caldwell, P.; Collins, W.D.; Gier, B.K.; Hall, A.D.; Hoffman, F.M.; et al. Taking climate model evaluation to the next level. Nat. Clim. Chang. 2019, 9, 102–110. [Google Scholar] [CrossRef]
  19. Qin, D.; Ding, Y.; Zhai, P.; Song, L.; Luo, Y.; Jiang, K. The Change of Climate and Ecological Environment in China 2021: Synthesis Report; Springer Nature: Dordrecht, The Netherlands, 2023. [Google Scholar] [CrossRef]
  20. Chandra, N.A.; Sahoo, S.N. Assessing the impacts of climate and land cover change on groundwater recharge in a semi-arid region of Southern India. Theor. Appl. Climatol. 2024, 155, 7147–7163. [Google Scholar] [CrossRef]
  21. Janjić, J.; Tadić, L. Fields of Application of SWAT Hydrological Model—A Review. Earth 2023, 4, 331–344. [Google Scholar] [CrossRef]
  22. Pulighe, G.; Lupia, F.; Chen, H.; Yin, H. Modeling climate change impacts on water balance of a mediterranean watershed using swat+. Hydrology 2021, 8, 157. [Google Scholar] [CrossRef]
  23. Bieger, K.; Arnold, J.G.; Rathjens, H.; White, M.J.; Bosch, D.D.; Allen, P.M.; Volk, M.; Srinivasan, R. Introduction to SWAT+, A Completely Restructured Version of the Soil and Water Assessment Tool. J. Am. Water Resour. Assoc. 2017, 53, 115–130. [Google Scholar] [CrossRef]
  24. Bieger, K.; Arnold, J.G.; Rathjens, H.; White, M.J.; Bosch, D.D.; Allen, P.M. Representing the Connectivity of Upland Areas to Floodplains and Streams in SWAT+. J. Am. Water Resour. Assoc. 2019, 55, 578–590. [Google Scholar] [CrossRef]
  25. Barresi, O.L.; Sauvage, S.; Houska, T.; Bieger, K.; Schürz, C.; Sánchez Pérez, J.M. Representation of Hydrological Components under a Changing Climate—A Case Study of the Uruguay River Basin Using the New Version of the Soil and Water Assessment Tool Model (SWAT+). Water 2023, 15, 2604. [Google Scholar] [CrossRef]
  26. Gurusinghe, T.; Mut, L.; Matheswaran, K.; Dickens, C. Developing a Foundational Hydrological Model for the Limpopo River Basin Using the Soil and Water Assessment Tool Plus (SWAT+); CGIAR Initiative on Digital Innovation; International Water Management Institute (IWMI): Colombo, Sri Lanka, 2024; pp. 1–14. Available online: https://hdl.handle.net/10568/151939 (accessed on 22 July 2024).
  27. Wagner, P.D.; Bieger, K.; Arnold, J.G.; Fohrer, N. Representation of hydrological processes in a rural lowland catchment in Northern Germany using SWAT and SWAT+. Hydrol. Process. 2022, 36, 14589. [Google Scholar] [CrossRef]
  28. Nkhonjera, G.K. Understanding the impact of climate change on the dwindling water resources of South Africa, focusing mainly on Olifants River basin: A review. Environ. Sci. Policy 2017, 71, 19–29. [Google Scholar] [CrossRef]
  29. Mthethwa, N.P. Hydrological Impacts of Sustainable Land Management in the Olifants Sub-Basin. Master’s Thesis, University of the Witwatersrand, Johannesburg, South Africa, 2021; pp. 43–49. [Google Scholar]
  30. Liu, W.; Wu, J.; Xu, F.; Mu, D.; Zhang, P. Modeling the effects of land use/land cover changes on river runoff using SWAT models: A case study of the Danjiang River source area, China. Environ. Res. 2024, 242, 117810. [Google Scholar] [CrossRef] [PubMed]
  31. Gebisa, B.T.; Dibaba, W.T. Ensemble modeling of the hydrological impacts of climate change: A case study of the Baro River sub-basin, Ethiopia. Hydrol. Res. 2024, 55, 1143–1160. [Google Scholar] [CrossRef]
  32. O’Neill, B.C.; Tebaldi, C.; Van Vuuren, D.P.; Eyring, V.; Friedlingstein, P.; Hurtt, G.; Knutti, R.; Kriegler, E.; Lamarque, J.F.; Lowe, J.; et al. The Scenario Model Intercomparison Project (ScenarioMIP) for CMIP6. Geosci. Model Dev. 2016, 9, 3461–3482. [Google Scholar] [CrossRef]
  33. Masimba, O.; Gumindoga, W.; Mhizha, A.; Rwasoka, D.T. Impacts of climate change on streamflow and reservoir inflows in the Upper Manyame sub-catchment of Zimbabwe. Water SA 2022, 48, 359–368. [Google Scholar] [CrossRef]
  34. Sajjan, P.; Krupavathi, K.; Aparna, C. Projection of future climate data using global circulation models. In Futuristic Trends in Agriculture Engineering & Food Science; Iterative International Publishers (IIP): Chikmagalur, Karnataka, India, 2024; Volume 3, pp. 113–126. [Google Scholar]
  35. Rathjens, H.; Bieger, K.; Srinivasan, R.; Arnold, J.G. CMhyd User Manual Documentation for Preparing Simulated Climate Change Data for Hydrologic Impact Studies; SWAT: Garland, TX, USA, 2016; pp. 1–16. [Google Scholar]
  36. Yeboah, K.A.; Akpoti, K.; Kabo-bah, A.T.; Ofosu, E.A.; Siabi, E.K.; Mortey, E.M.; Okyereh, S.A. Assessing climate change projections in the Volta Basin using the CORDEX-Africa climate simulations and statistical bias-correction. Environ. Chall. 2022, 6, 100439. [Google Scholar] [CrossRef]
  37. Fang, G.H.; Yang, J.; Chen, Y.N.; Zammit, C. Comparing bias correction methods in downscaling meteorological variables for a hydrologic impact study in an arid area in China. Hydrol. Earth Syst. Sci. 2015, 19, 2547–2559. [Google Scholar] [CrossRef]
  38. Teutschbein, C.; Seibert, J. Bias correction of regional climate model simulations for hydrological climate-change impact studies: Review and evaluation of different methods. J. Hydrol. 2012, 456, 12–29. [Google Scholar] [CrossRef]
  39. Lazoglou, G.; Economou, T.; Anagnostopoulou, C.; Zittis, G.; Tzyrkalli, A.; Georgiades, P.; Lelieveld, J. Multivariate adjustment of drizzle bias using machine learning in European climate projections. Geosci. Model Dev. 2024, 17, 4689–4703. [Google Scholar] [CrossRef]
  40. Min, S.K.; Hense, A. A Bayesian approach to climate model evaluation and multi-model averaging with an application to global mean surface temperatures from IPCC AR4 coupled climate models. Geophys. Res. Lett. 2006, 33, L08708. [Google Scholar] [CrossRef]
  41. Weigel, A.P.; Knutti, R.; Liniger, M.A.; Appenzeller, C. Risks of model weighting in multimodel climate projections. J. Clim. 2010, 23, 4175–4191. [Google Scholar] [CrossRef]
  42. Miao, C.; Duan, Q.; Yang, L.; Borthwick, A.G.L. On the Applicability of Temperature and Precipitation Data from CMIP3 for China. PLoS ONE 2012, 7, 0044659. [Google Scholar] [CrossRef] [PubMed]
  43. Buontempo, C.; Mathison, C.; Jones, R.; Williams, K.; Wang, C.; McSweeney, C. An ensemble climate projection for Africa. Clim. Dyn. 2015, 44, 2097–2118. [Google Scholar] [CrossRef]
  44. Kim, J.; Ivanov, V.Y.; Fatichi, S. Climate change and uncertainty assessment over a hydroclimatic transect of Michigan. Stoch. Environ. Res. Risk Assess. 2016, 30, 923–944. [Google Scholar] [CrossRef]
  45. You, Q.; Jiang, Z.; Wang, D.; Pepin, N.; Kang, S. Simulation of temperature extremes in the Tibetan Plateau from CMIP5 models and comparison with gridded observations. Clim. Dyn. 2018, 51, 355–369. [Google Scholar] [CrossRef]
  46. Ahmed, K.; Sachindra, D.A.; Shahid, S.; Demirel, M.C.; Chung, E.S. Selection of multi-model ensemble of general circulation models for the simulation of precipitation and maximum and minimum temperature based on spatial assessment metrics. Hydrol. Earth Syst. Sci. 2019, 23, 4803–4824. [Google Scholar] [CrossRef]
  47. Manjurul, H. and I.M. pyMannKendall: A python package for non parametric Mann Kendall family of trend tests. J. Open Source Softw. 2019, 4, 1556. [Google Scholar] [CrossRef]
  48. Gyamfi, C.; Ndambuki, J.M.; Salim, R.W. A Historical Analysis of Rainfall Trend in the Olifants Basin in South Africa. Earth Sci. Res. 2016, 5, 129. [Google Scholar] [CrossRef]
  49. Dile, Y.T.; Daggupati, P.; George, C.; Srinivasan, R.; Arnold, J. Introducing a new open source GIS user interface for the SWAT model. Environ. Model. Softw. 2016, 85, 129–138. [Google Scholar] [CrossRef]
  50. Kakarndee, I.; Kositsakulchai, E. Comparison between SWAT and SWAT+ for simulating streamflow in a paddy-field-dominated basin, northeast Thailand. E3S Web Conf. 2020, 187, 06002. [Google Scholar] [CrossRef]
  51. Chawanda; Arnold, J.; Thiery, W.; van Griensven, A. Mass balance calibration and reservoir representations for large-scale hydrological impact studies using SWAT+. Clim. Change 2020, 163, 1307–1327. [Google Scholar] [CrossRef]
  52. Merlo, A. Runoff Modelling Using QSWAT+ to Assess the Contribution of Piped Network Stormflow in the Haaganpuro Semi-Urban Catchment. Master’s Thesis, Politecnico di Torino, Torino, Italy, 2023; p. 87316161. [Google Scholar]
  53. Aryal, S.; Babel, M.S.; Gupta, A.; Farjad, B.; Khadka, D.; Hassan, Q.K. Attribution of the Climate and Land Use Change Impact on the Hydrological Processes of Athabasca River Basin, Canada. Hydrology 2025, 12, 7. [Google Scholar] [CrossRef]
  54. Chawanda, C. Hydrological Modelling Using SWAT+ Training Manual (v1). 2021. Available online: https://www.qgis.org/en/site/forusers/download.html (accessed on 22 July 2024).
  55. Abbas, S.A.; Bailey, R.T.; White, J.T.; Arnold, J.G.; White, M.J.; Čerkasova, N.; Gao, J. A framework for parameter estimation, sensitivity analysis, and uncertainty analysis for holistic hydrologic modeling using SWAT+. Hydrol. Earth Syst. Sci. 2024, 28, 21–48. [Google Scholar] [CrossRef]
  56. Sane, M.L.; Sambou, S.; Leye, I.; Ndione, D.M.; Diatta, S.; Ndiaye, I.; Badji, M.L.; Kane, S. Calibration and Validation of the SWAT Model on the Watershed of Bafing River, Main Upstream Tributary of Senegal River: Checking for the Influence of the Period of Study. Open, J. Mod. Hydrol. 2020, 10, 81–104. [Google Scholar] [CrossRef]
  57. Moriasi, D.N.; Arnold, J.G.; Van Liew, M.W.; Bingner, R.L.; Harmel, R.D.; Veith, T.L. Model Evaluation Guidelines for Systematic Quantification of Accuracy in Watershed Simulations. Trans. ASABE 2007, 50, 885–900. [Google Scholar] [CrossRef]
  58. MacKellar, N.; New, M.; Jack, C. Observed and modelled trends in rainfall and temperature for South Africa: 1960–2010. S. Afr. J. Sci. 2014, 110, 1–13. [Google Scholar] [CrossRef]
  59. Bobde, V.; Akinsanola, A.A.; Folorunsho, A.H.; Adebiyi, A.A.; Adeyeri, O.E. Projected regional changes in mean and extreme precipitation over Africa in CMIP6 models. Environ. Res. Lett. 2024, 19, 074009. [Google Scholar] [CrossRef]
  60. Almazroui, M.; Saeed, F.; Saeed, S.; Nazrul Islam, M.; Ismail, M.; Klutse, N.A.B.; Siddiqui, M.H. Projected Change in Temperature and Precipitation Over Africa from CMIP6. Earth Syst. Environ. 2020, 4, 455–475. [Google Scholar] [CrossRef]
  61. Garcia, C.; Amengual, A.; Homar, V.; Zamora, A. Losing water in temporary streams on a Mediterranean island: Effects of climate and land-cover changes. Glob. Planet. Change 2017, 148, 139–152. [Google Scholar] [CrossRef]
  62. Nobert, J. Assessment of the Impact of Climate Change on Stream Flow: The Case of Little Ruaha Catchment, Rufiji Basin, Tanzania. Tanzania J. Sci. 2022, 48, 170–184. [Google Scholar] [CrossRef]
  63. Fynn, B.M.; Abiye, T.A. Modelling the Impact of Climate Variability and Land-Use Changes in the Upper Crocodile River Basin, South Africa. Master’s Thesis, University of the Witwatersrand, Johannesburg, South Africa, February 2022. [Google Scholar]
  64. Moses, O. Projected changes in rainfall and temperature using CMIP6 models over the Okavango River basin, southern Africa. Theor. Appl. Climatol. 2024, 155, 5337–5351. [Google Scholar] [CrossRef]
  65. Singh, R.; van Werkhoven, K.; Wagener, T. Hydrological impacts of climate change in gauged and ungauged watersheds of the Olifants basin: A trading- space-for-time approach. Hydrol. Sci. J. 2014, 59, 29–55. [Google Scholar] [CrossRef]
  66. Remilekun, A.T.; Thando, N.; Nerhene, D.; Archer, E. Integrated assessment of the influence of climate change on current and future intra-annual water availability in the Vaal River catchment. J. Water Clim. Chang. 2021, 12, 533–551. [Google Scholar] [CrossRef]
  67. RANKOANA, S. A Review of Rural Communities’ Vulnerability to Climate Change: The Case of Limpopo Province in South Africa. Int. J. Environ. Sustain. Soc. Sci. 2023, 4, 1742–1754. [Google Scholar] [CrossRef]
  68. Lebek, K.; Senf, C.; Frantz, D.; Monteiro, J.A.F.; Krueger, T. Interdependent effects of climate variability and forest cover change on streamflow dynamics: A case study in the Upper Umvoti River Basin, South Africa. Reg. Environ. Chang. 2019, 19, 1963–1971. [Google Scholar] [CrossRef]
  69. Banda, V.D.; Dzwairo, R.B.; Singh, S.K.; Kanyerere, T. Quantifying the influence of climate change on streamflow of Rietspruit sub-basin, South Africa. J. Water Clim. Chang. 2024, 15, 2282–2308. [Google Scholar] [CrossRef]
  70. Bjerre, E.; Enemark, T.; Jessen, S.; Høgh Jensen, K. Climatic controls on streamflow and groundwater dynamics in a semi-arid catchment: Long-term trends and importance of episodic events. In Proceedings of the EGU General Assembly 2024, Vienna, Austria, 14–19 April 2024; p. 8584. [Google Scholar] [CrossRef]
  71. Adlam, A.L.; Chimimba, C.T.; Retief, D.C.H.; Woodborne, S. Modelling water temperature in the lower Olifants River and the implications for climate change. S. Afr. J. Sci. 2022, 118, 4–9. [Google Scholar] [CrossRef]
  72. Botai, C.M.; Botai, J.O.; Zwane, N.N.; Hayombe, P.; Wamiti, E.K.; Makgoale, T.; Murambadoro, M.D.; Adeola, A.M.; Ncongwane, K.P.; de Wit, J.P.; et al. Hydroclimatic extremes in the limpopo river basin, south africa, under changing climate. Water 2020, 12, 3299. [Google Scholar] [CrossRef]
  73. Franchi, F.; Mustafa, S.; Ariztegui, D.; Chirindja, F.J.; Di Capua, A.; Hussey, S.; Loizeau, J.L.; Maselli, V.; Matanó, A.; Olabode, O.; et al. Prolonged drought periods over the last four decades increase flood intensity in southern Africa. Sci. Total Environ. 2024, 924, 171489. [Google Scholar] [CrossRef]
Figure 1. Geographical location of the Olifants River basin.
Hydrology 12 00244 g001
Figure 2. Digital elevation map (a) and LULC map (b) of the study area.
Hydrology 12 00244 g002
Figure 3. Soil type (masked from FAO soil map using spatial analysis tool in QGIS).
Hydrology 12 00244 g003
Figure 4. Daily time series streamflow of the Olifants River.
Hydrology 12 00244 g004
Figure 5. Methodological framework to investigate streamflow response to climate change.
Hydrology 12 00244 g005
Figure 6. Simulated and observed monthly discharges during the calibration and validation periods.
Hydrology 12 00244 g006
Figure 7. Historical average annual rainfall and temperature (Tmax and Tmin) trends for the Olifants River basin.
Hydrology 12 00244 g007
Figure 8. Mean monthly projected change in precipitation under SSP245 and SSP585.
Hydrology 12 00244 g008
Figure 9. Average monthly variations in Tmax and Tmin under SSP245 and SSP585.
Hydrology 12 00244 g009
Figure 10. Average monthly projected streamflow changes for near and far future periods under SSP245 and SSP585 scenarios.
Hydrology 12 00244 g010
Figure 11. Projected changes in seasonal streamflow for near and far future periods under the SSP245 and SSP585 scenarios.
Hydrology 12 00244 g011
Table 1. Description of input data and their sources used in this study.
Data TypeDescriptionSource
DEMElevation data used for watershed delineation USGS
https://glovis.usgs.gov/app accessed on 20 August 2024
LULCLand use/land cover type of the Olifants River basin.Sentinel-2 Land Use/Land Cover map for South Africa.
https://opendata.rcmrd.org/datasets/rcmrd::Landuse South Africa/about accessed on 10 September 2024
Soil MapSoil type and properties for the Olifants River basin were obtained from FAO.Food and Agriculture (FAO) database
Climate data for the baseline periodDaily rainfall (mm) and Daily minimum and maximum temperature (°C)DWS, SAWS, South Africa
CHRIPS https://data.chc.ucsb.edu/products/CHIRPS-2.0/ accessed on 20 August 2024
NASA https://power.larc.nasa.gov/data-access-viewer/ accessed on 20 August 2024
Streamflow dataDaily streamflow data are used to calibrate and validate the modelDWS, South Africa
Future climate data (GCMs)Daily temperature (Tmax and Tmin) and rainfall for CMIP6 and SSP scenariosCoordinated Regional Downscaling Experiment (CORDEX), obtained from the Lawrence Livermore National Laboratory at the Earth System Grid Federation (ESGF) https://esgf-node.ipsl.upmc.fr/search/cmip6-ipsl/ accessed on 10 September 2024
Table 2. Description of the soil type in the study area.
FAO Soil CodeSoil Texture TypeGeneral Soil Description
Bc7-2bc-451Sandy Clay LoamChromic cambisol with fine-grained texture
Qc42-1a-887Sandy LoamCambic arenosol with coarse texture
Lc65-1-2a-725Sandy LoamMedium- to coarse-textured chromic luvisols
Lc3-2ab-702Sandy Clay LoamChromic luvisols
Fr20-3bc-575ClayRhodic ferralsols
We18-1-2a-976Sandy loamEutric planosol
Vc23-3a-262ClayGenerally fine-textured chromic vertisols
Ao69-1a-434Sandy LoamOrthic acrisols
Lc64-2b-722Sandy Clay LoamMedium-textured chromic luvisols
Vc1-3a-954ClayChromic vertisols with fine texture
Lc66-1a-728Sandy loamCoarse-textured chromic luvisols
Table 3. Details of the selected CMIP6 models used in this study.
CMIP6 ModelInstituteCountryGrid Spacing (Degrees)Variant Label
CanESM5The Canadian Centre for Climate Modelling and Analysis (CCCma) at Environment and Climate Change CanadaCanada2.8° × 2.8°r1i1p1f1
INM-CM5-0Institute for Numerical Mathematics, Russian Academy of ScienceRussia2° × 1.5°r1i1p1f1
IPSL-CM6A-LRInstitute Pierre Simon LaplaceFrance2.5° × 1.3°r1i1p1f1
MIROC6Japan Agency for Marine-Earth Science and Technology (JAMSTEC)Japan1.4° × 1.4°r1i1p1f1
MPI-ESM1-2-LRMax Planck Institute for Meteorology (MPI-M)Germany1.9° × 1.9°r1i1p1f1
Table 4. Criteria for evaluating the performance of the SWAT+ model [56].
Statistical CriterionEquationsValuesClassification of Performance
N S E N S E = 1 i = 1 n Q m i Q s i 2 i = 1 n Q m i Q ¯ m 2 0.75 < NSE ≤ 1
0.65 < NSE ≤ 0.75
0.5 < NSE ≤ 0.65
0.4 < NSE ≤ 0.5
NSE ≤ 0.4
Very good
Good
Satisfactory
Acceptable
unsatisfactory
R 2 R 2 = i = 1 n Q m i Q ¯ m Q s i Q ¯ S 2 i = 1 n Q m i Q ¯ m 2 i = 1 n Q s i Q ¯ S 2 R2 > 0.5R2 > 0.5 is regarded as acceptable for model simulation.
PBIAS P B I A S = i = 1 n Q m i i = 1 n Q s i i = 1 n Q m i × 100 PBIAS < ± 10
± 10 ≤ PBIAS <±15
± 15 ≤ PBIAS < ±25
PBIAS ≥ ±25
Very good
Good
Satisfactory
Unsatisfactory
Qm is the measured discharge, Qs is the simulated discharge, Q ¯ m is the average measured discharge, and Q ¯ S is the average simulated discharge.
Table 5. Sensitive parameters and best-fitted values.
Sensitivity Calibration
ParameterChange TypeSensitivity RankValue Range
Abs-Max
Fitted Value
CN2.hrupercent1−2020−1.93
ESCOrelative2010.94
EPCOreplace3010.99
AWCrelative40.0110.68
ALPHArelative5010.33
REVAP_MINreplace60500.80
Table 6. Model performance evaluation statistics.
PeriodObjective Function
NSEPBIASR2
Calibration (1988–1995)0.765.760.78
Validation (1996–1999)0.7712.220.82
Table 7. Projected changes in precipitation and temperature under SSP scenarios.
ScenariosPrecipitation Change (%)Temperature Change (°C)
TmaxTmin
SSP2452030–2060−15.210.502.45
2070–2100−17.571.023.38
SSP5852030–2060−21.010.822.78
2070–2100−19.773.225.33
Table 8. Percentage change in streamflow compared to the baseline scenario.
ScenariosPeriodsSimulated Stream Flow in (m3/s)Change in Streamflow (%)
Baseline1985–2014263.08-
SSP245Near future (2030–2060)149.72−43.09
Far future (2070–2100)129.19−50.89
SSP585Near future (2030–2060)112.07−57.79
Far future (2070–2100)108.33−58.82
Disclaimer/Publisher’s Note: The statements, opinions and data contained in all publications are solely those of the individual author(s) and contributor(s) and not of MDPI and/or the editor(s). MDPI and/or the editor(s) disclaim responsibility for any injury to people or property resulting from any ideas, methods, instructions or products referred to in the content.