Article

Effect of Storm Event Duration on the Indices of Concentration Discharge Hysteresis

HSM, Université de Montpellier, CNRS, IRD, 34090 Montpellier, France
Hydrology 2025, 12(8), 221; https://doi.org/10.3390/hydrology12080221
Submission received: 21 July 2025 / Revised: 11 August 2025 / Accepted: 17 August 2025 / Published: 20 August 2025

Abstract

The relationship between concentration and discharge (C/Q) is widely studied to understand the behavior of solute transport in complex natural media during storm events. The causes of C/Q hysteresis are due to the delay between the signals of C and Q at a given observation point. Many indices are used to characterize the C/Q hysteresis curve, like the hysteresis index (HI) and the flushing index (FI). The limitation of relating C/Q hysteresis relationships or indices to storm event parameters is because, in real-world situations, we ignore and do not control storm event parameters. This paper is the first attempt to study the variability of C/Q relationships under a well-known storm event on a controlled experimental channel. We tested nine scenarios where the storm event consisted of a triangular input signal with a constant peak and a variable duration. The main parameter of this study is the storm event duration. We calculated known indices, like the hysteresis index (HI) and the flushing index (FI), and we introduced the following two new indices: the saturation index (SI) and the bisector index (BI). Then we related all calculated indices to the storm duration parameter. The importance of our study is that it presents, for the first time, a quantitative description of how the magnitude of the hysteresis indices varies with the storm duration parameter. We found that the most popular HI index does not follow a monotonic behavior for increasing storm duration. Conversely, the FI index and the two newly introduced indices (SI and BI) follow a monotonic behavior for increasing storm duration according to a Fermi-type function. The SI varies between 0.11 and 0.93, while the BI varies between 1 and 0.32 for an increasing storm event duration.

1. Introduction

Water and solute transfers in rivers are inherently coupled. Studying the stream water chemistry evolution in a river during storm events is a complicated process because it mixes non-linear hydraulic and chemical processes depending on both hydraulic properties (e.g., water depth, velocity, dispersion coefficient, and slope of the rising and falling limbs of the hydrograph) and chemical processes (e.g., mixing, convection, adsorption, and dispersion properties). Moreover, relationships between discharge (Q) and concentrations (C) are difficult to measure in situ in a channel during storm events because complex hydrological processes may occur along the channel (i.e., lateral flow, surface runoff from hillslopes, surface–groundwater exchanges, and overbank flow during extreme storm events), which can modify the water chemistry, and because of high uncertainties on samples’ representability. Changes in solute concentrations as functions of discharge, e.g., concentration–discharge hysteresis (noted C/Q by [1]) relationships, are empirical relationships largely used in the literature to describe these complex processes.
In the last few decades, the C/Q relationship has been widely studied for many purposes, including stream hydrochemical variations and flow generation process [2], urban stream runoff [3], understanding the behavior and vulnerability of a karst aquifer [4], temporal sequences of DOC and NO3 discharge responses in an intermittent stream [5], characterizing karst spring discharge [6], storm event and controls in agricultural watersheds [7], identification of hydrological function across the ‘hillslope–depression–stream’ continuum in a karst catchment [8], hydrological flushing and biogeochemical cycling in streams [9], studying channel–groundwater interaction in karstic catchments [10], or dynamic water storage and subsurface geochemical structure [11]. Several review papers present the advances made in C/Q hysteresis interpretation and the implications for understanding solute/particle transport in natural systems. Ref. [12] shows the use of hysteresis analysis to quantify and qualify sediment dynamics. Ref. [13] shows how event-scale hysteresis metrics reveal processes and mechanisms controlling constituent export from watersheds.
Many conceptual models based on different concentration components have been proposed to explain or reproduce the observed C/Q hysteresis. Ref. [3] used a two-component system based on ‘pre-event’ water (groundwater) and ‘event’ water (storm runoff), which was consistent with most of the geochemical observations. Other studies used a three-component system based on groundwater, soil water, and event water [1,14]. Ref. [15] used a lumped numerical model based on a series of cascading conceptual reservoirs to represent the transfer and storage of water and nitrate in conduit, soil, epikarst, and phreatic zones. Ref. [10] used the diffusive wave equation to evaluate the lateral flow at the reach scale. Ref. [16] showed that land cover and seasonality had an effect on storm hysteresis and loading of dissolved organic carbon and nitrate measurements in Hugerford Brook and Wade Brook (Lake Champlain Basin of Vermont in the Northeastern U.S.). Ref. [17] used concentration–discharge hysteresis to describe solute and sediment mobilization, reaction, and transport at event and longer time scales. Zhang et al. (2020) studied the influence of the local heterogeneity of the depression aquifer on the temporal and spatial variability of the hysteresis relationship [8]. Ref. [18] showed that hysteresis analysis reveals dissolved carbon C/Q relationships during and between storm events, with significant differences in dissolved carbon dynamics at the inter- and intra-event scales. Ref. [19] studied the influence of climatic factors and vegetation extent on the hysteresis relationship in six karst watersheds in southwest China. Ref. [20] studied the influence of landscape characteristics on sediment–discharge hysteresis in the Wudinghe River Basin (China). Ref. [21] used C/Q hysteresis analysis to investigate the spatial and temporal dynamics of dissolved organic carbon concentration in a Mediterranean headwater catchment. Ref. [22] suggested that the variability of C/Q relationships among different hydrologic events (and solutes) could be linked to a range of environmental controls. Ref. [23] tried to identify the factors that control the hysteresis of solute based on statistical analysis.
The causes of C/Q hysteresis are due to the delay between the signals (i.e., curves) of C and Q at a given observation point. If C rises faster than Q, the concentration source is close to the observation point, and the C/Q hysteresis is clockwise. Conversely, if Q rises faster than C, the concentration source is far from the observation point, and the C/Q hysteresis is anticlockwise. Many indices are used to characterize the C/Q hysteresis curve. The most used ones are the hysteresis index (HI) and the flushing index (FI). If HI is positive, the C/Q hysteresis curve is clockwise, which indicates that the source of concentration is close to the observation point. Otherwise, if HI is negative, the C/Q hysteresis curve is anticlockwise, which indicates that the source of concentration is far from the observation point. There exist several formulations of HI, but the most relevant and used one is the formulation of [24], where C and Q are normalized according to their minimum and maximum values. Thus, C and Q will vary in the interval [0, 1], and HI will vary in the interval [−1, 1]. In the formulation of [24], HI is in fact the mathematical area of the C/Q hysteresis curve. The FI index represents the difference of concentration between the beginning and peak of the storm event. If FI is positive, stormwater has a higher concentration than pre-event water. As an HI index, when C and Q are normalized according to their minimum and maximum values, FI will vary in the interval [−1, 1]. All these indices are simple descriptors of the shape of the empirical C/Q curve and can be considered as ‘hydrological signatures’ useful to understand hydrological processes and to describe the complex C/Q relationship.
However, the majority of the literature is based on case studies, where detailed knowledge about the hydrology of the catchment and rivers is often missing. All these studies involve field measurements where the spatial origin of the water is difficult to identify and where the delimitation of surface and groundwater catchments is difficult to delimit, particularly in karst areas. Moreover, the limitation of relating C/Q hysteresis relationships or indices to storm event parameters is because, in real-world situations, we simply ignore and do not control either storm event parameters or flow paths on hillslopes, through the channel network, and in the soil and groundwater.
Let us consider the storm event as an input signal at some point in space and time. All we measure in a real-world situation is the output signal (i.e., the response to the input signal) at a given observation point in space and time. All existing studies deal with data that correspond to output signal measurements at a given observation point, and they try to formulate guesses or estimates about the input signal. Because of the lack of information about the input signal, the calculated hysteresis indices lead to a qualitative description and not a quantitative one. When we calculate indices (such as HI or FI) of an output signal, all we can deduce is if they are positive or negative with the corresponding qualitative interpretations (dilution or no dilution; source of concentration close or far from observation point). But nothing can be said about the variability of the hysteresis indices magnitude (whether in the positive or negative range) and how this magnitude is related to storm event parameters. The conclusions of the literature review on C/Q relationships concern mainly the identification of the origins of water (i.e., spatial zone, surface water vs. groundwater, recent rainwater vs. old water) and propose a ‘possible’ hydrological functioning scheme of the catchment of the channel. A C/Q relationship can be caused by different hydrological functioning schemes. Therefore, it is important to study C/Q relationships in a controlled environment channel where the inputs and outputs of both water and solutes are known, and there is a need to define simple descriptors of the C/Q curve to be linked to the main characteristics of the storm event, such as the duration of the rising and falling limbs of the studied hydrographs.
Recently, Ref. [25] developed an experimental platform to study stage–discharge hysteresis. This experiment platform is promising, and a question arises on the possibility of measuring the C/Q phenomenon on small channels with small time steps, as well as on the possibility of exploring different forms of C/Q by modifying the shape of the input signal.
This article has the dual objectives of (i) showing whether with simple experimentation on a scale model we can observe a complex mechanism such as C/Q hysteresis and (ii) introducing new, simple, easy-to-use descriptors of the C/Q relationship as a function of the characteristics of the input signal.
This paper is the first attempt to study the variability of C/Q relationships (output signal) under a well-known storm event (input signal) on a controlled experimental channel. This work uses the recent experimental laboratory channel platform developed by [26], which has the advantage of controlling both input, output, and lateral flow hydrographs and solute conductivity at the inlet and the outlet of a channel. The experimentations aim to show the interest of laboratory experiments for understanding a complex process such as C/Q hysteresis. The storm event tested in this paper is a triangular input signal where the peak of the storm event (triangle summit) is constant and the duration of the storm event (triangle basis) is variable. The experiments are limited to the study of the main parameter, which is the duration of the input signal, which controls the slopes of the rising and falling limbs of the hydrographs and consequently, the shape of C/Q hysteresis.

2. Materials and Methods

2.1. Experimental Setup

We use a serpentine experimental channel (length 4 m, width 3 cm, height 5 cm). Two peristaltic pumps (Gilson Minipuls 3, Villiers Le Bel, France) are used to introduce at the channel input deionized water and NaCl solution at 0.05 M (Figure 1) under a constant discharge (2 mL/s), which represents the pre-storm event. NaCl solution is introduced under a variable discharge, and it represents the storm event.
In this study, the shape of the storm event (input signal) is an isosceles triangle that has a constant peak (3 mL/s) and a basis with variable duration. Thus, the input triangle hydrograph duration (i.e., storm event duration) is the main parameter of this study. We tested nine scenarios corresponding to different triangle duration, as shown in Table 1.
At the channel output, a conductimeter and a scale give the measurements of NaCl concentration and discharge of the effluent. The measurements are performed at the time interval of 1 s and are stored on a datalogger (Campbell Scientific CR1000, Loughborough, UK). The measurements at the channel output permit obtaining the C/Q hysteresis relationship of the output signal as a response to the NaCl triangle input signal at the channel input.
Each of the nine tested scenarios is repeated 3 times, and the results presented in this study are the mean of 3 replicates. The replicates (and their mean) are important because they reduce statistical noise in the measurements. Thus, we consider that our experimental measurements and the resulting curves are of high resolution due to the small time interval of measurements (1 s) and the 3 replicates performed on each scenario.

2.2. Hysteresis Indices

The C/Q hysteresis relationships are normalized according to the following equations:
Q n , i = Q i Q m i n Q m a x Q m i n
C n , i = C i C m i n C m a x C m i n
where Qi and Ci are, respectively, the discharge and concentration at timestep i, Qmin and Cmin, respectively the minimum storm parameter value; Qmax and Cmax, respectively, the maximum storm parameter value; and Qn,i and Cn,i, respectively, the normalized discharge and concentration at timestep i.
Since our experimental curves are of high resolution, the interval [Qmin, Qmax] is divided into 200 timesteps i (1 ≤ i ≤ 200). The division into 200 timesteps used in this study is higher than what is used in other literature studies: 100 timesteps in [24], 50 timesteps in [15,16]. The division of the interval [Qmin, Qmax] into 200 timesteps leads thus to more accurate values of the calculated hysteresis indices.
The HI index is calculated according to the following:
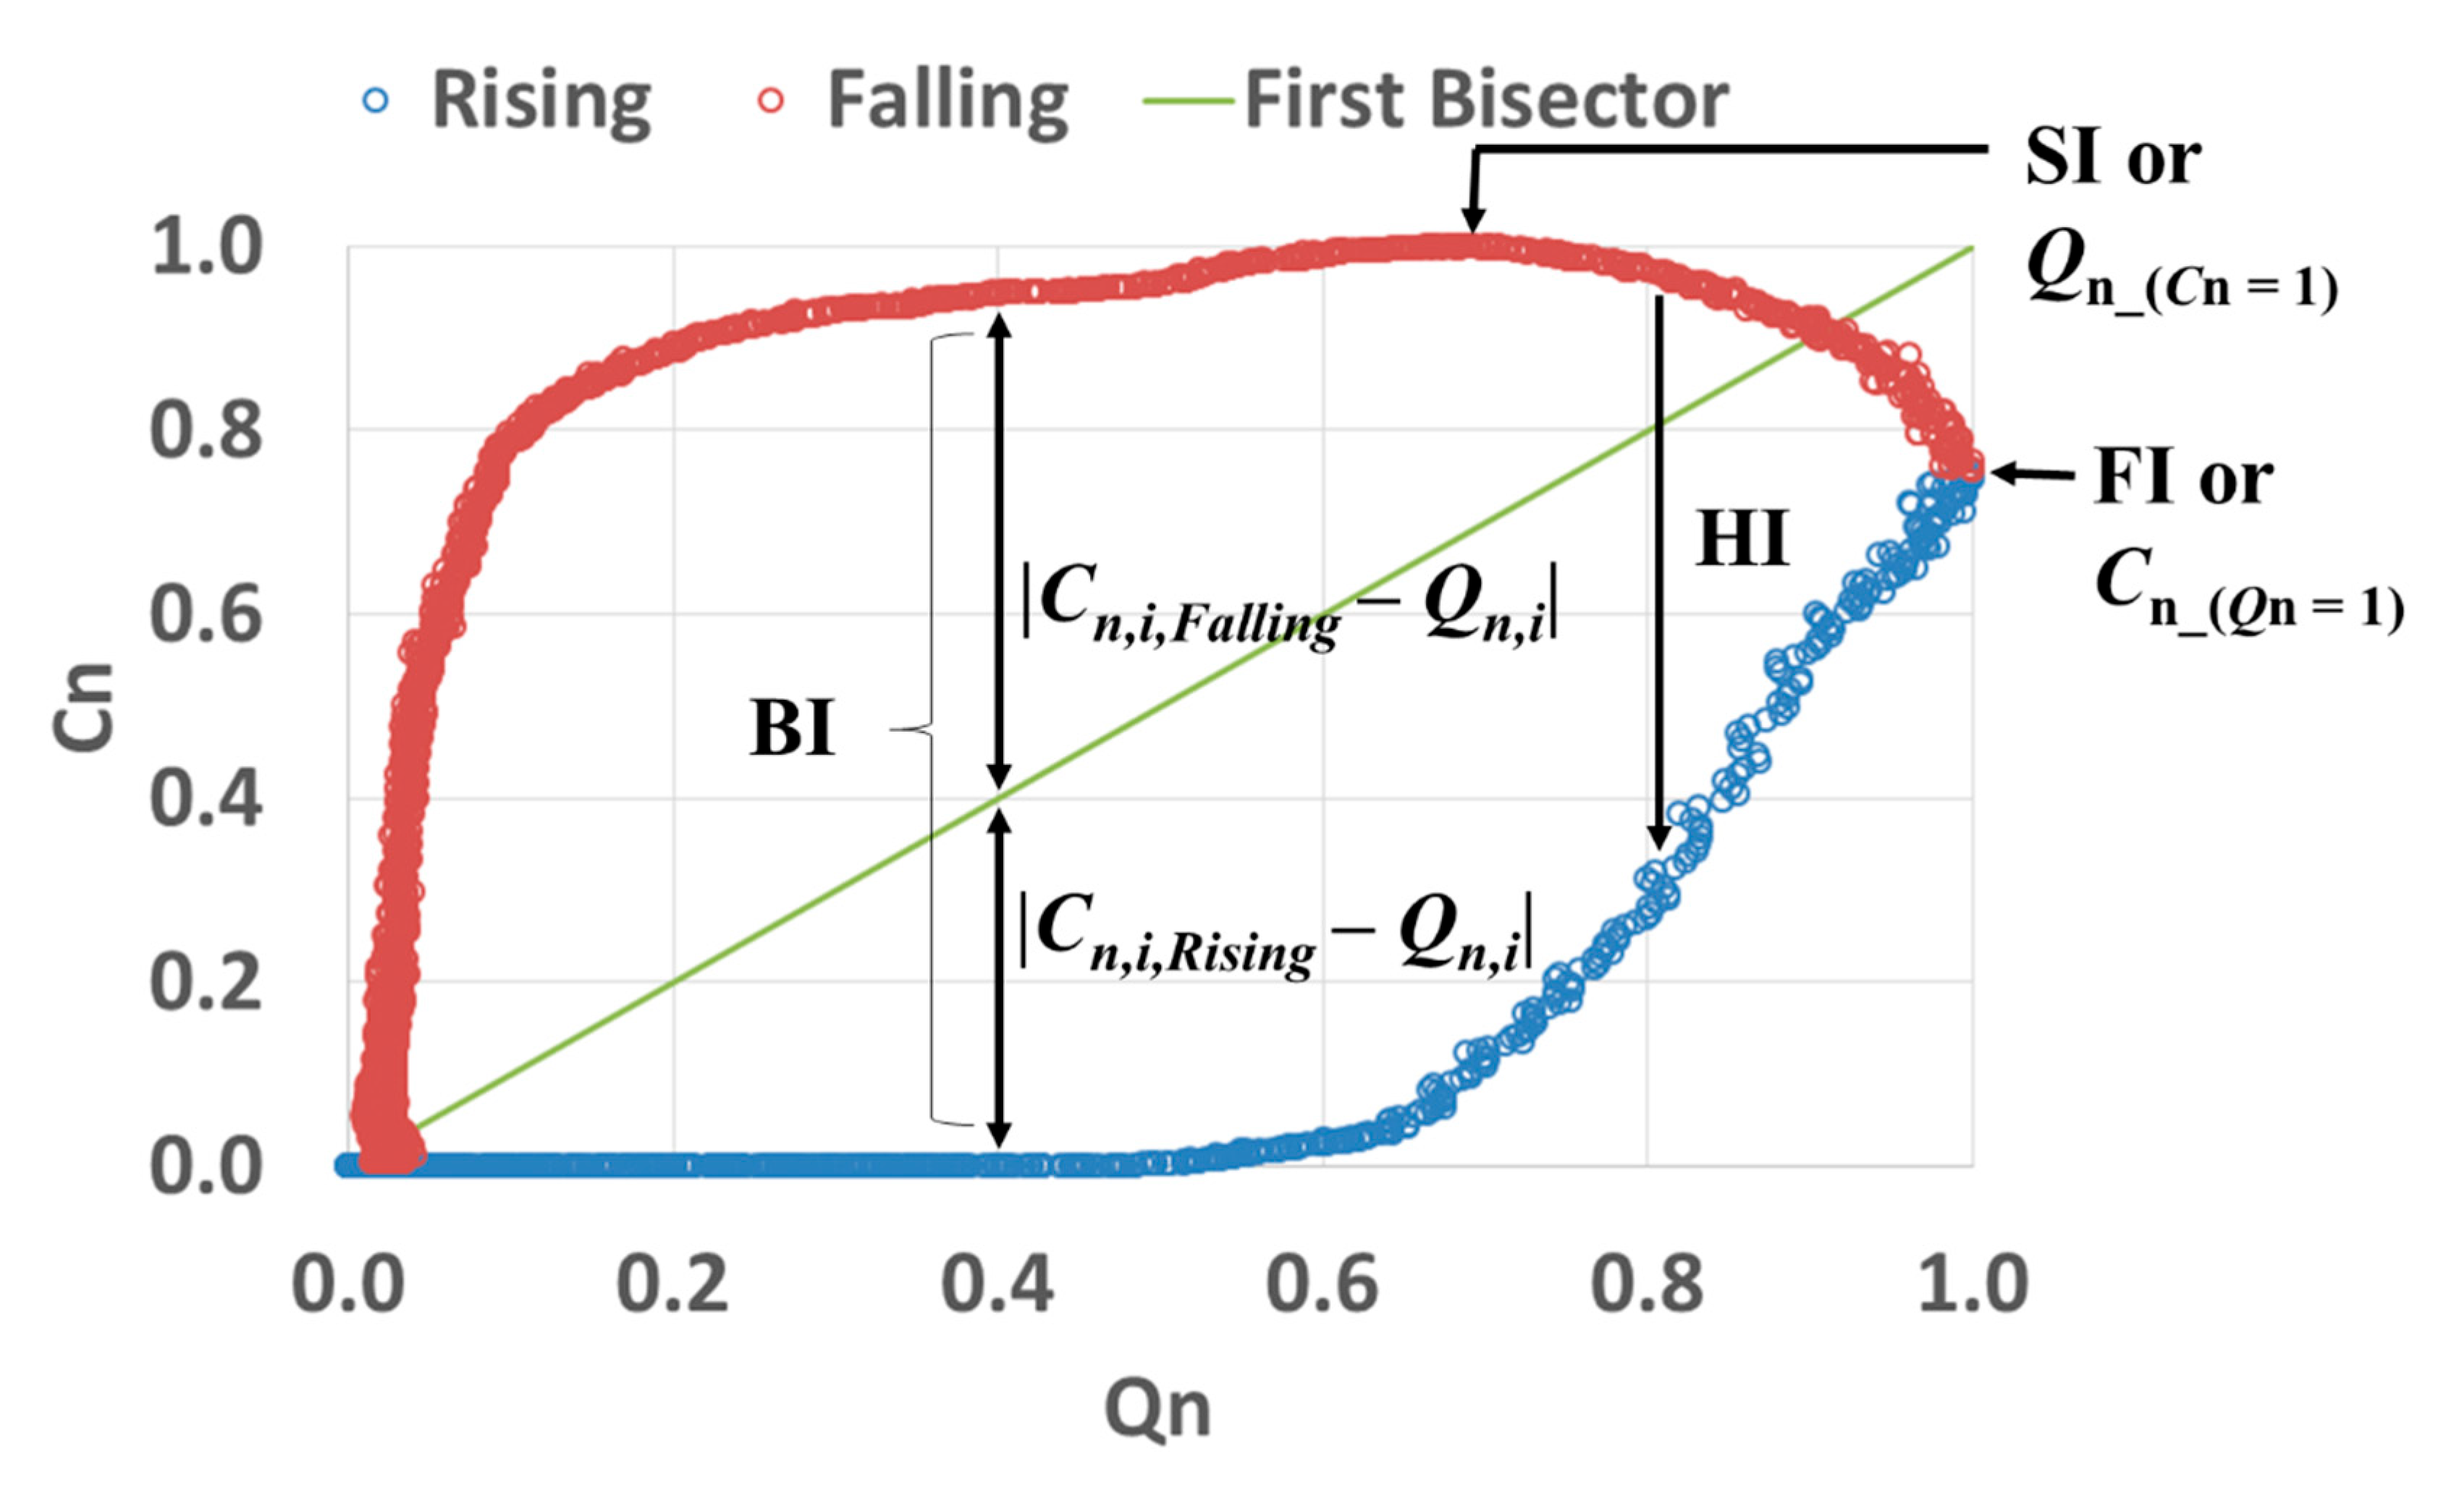
H I =   1 200 i = 1 200 ( C n , i , R i s i n g C n , i , F a l l i n g )
where Cn,i,Rising and Cn,i,Falling are, respectively, the normalized concentrations of the rising and falling limbs of the hysteresis at timestep i (Figure 2). Equation (2) is the most used formulation of HI since [24].
We also calculate the value of Cn that corresponds to the maximum of discharge (Qn = 1). The resulting index Cn_(Qn=1) is in fact the flushing index FI (Figure 2).
Along with HI and FI, we propose two new hysteresis indices, a ‘saturation index’ noted SI and a ‘bisector index’ noted BI:
  • The ‘saturation index’ SI (Figure 2) is obtained by calculating the value of Qn that corresponds to the maximum of concentration (Cn = 1). The resulting index Qn_(Cn=1) is SI.
  • The ‘bisector index’ (BI) is based on the mean absolute distance between the first bisector and both rising and falling limbs of the hysteresis according to the following:
B I = 1 200 i = 1 200 C n , i , R i s i n g Q n , i + C n , i , F a l l i n g Q n , i
In our study, the source of concentration is at the channel input (x = 0 m), and the observation point is at the channel output (x = 4 m). The source of concentration is thus far from the observation point, which leads to anticlockwise C/Q hysteresis relationships with negative HI values. Since we add NaCl solution to deionized water, the FI values are positive. We relate all indices defined above to the duration of the storm event. We work under experimental conditions corresponding to negative HI and positive FI values. It is not the sign of the hysteresis indices that interests us (qualitative description), but rather how the variability of their magnitude is related to the storm event duration (quantitative description). As emphasized in the introduction, the aim of this study is not to see when the hysteresis indices pass from positive to negative values: this has been extensively performed in other literature studies, and it only leads to qualitative description. In this study, we are rather interested in relating the variability of the indices’ magnitude to the storm duration parameter, which leads to a quantitative description.

3. Results

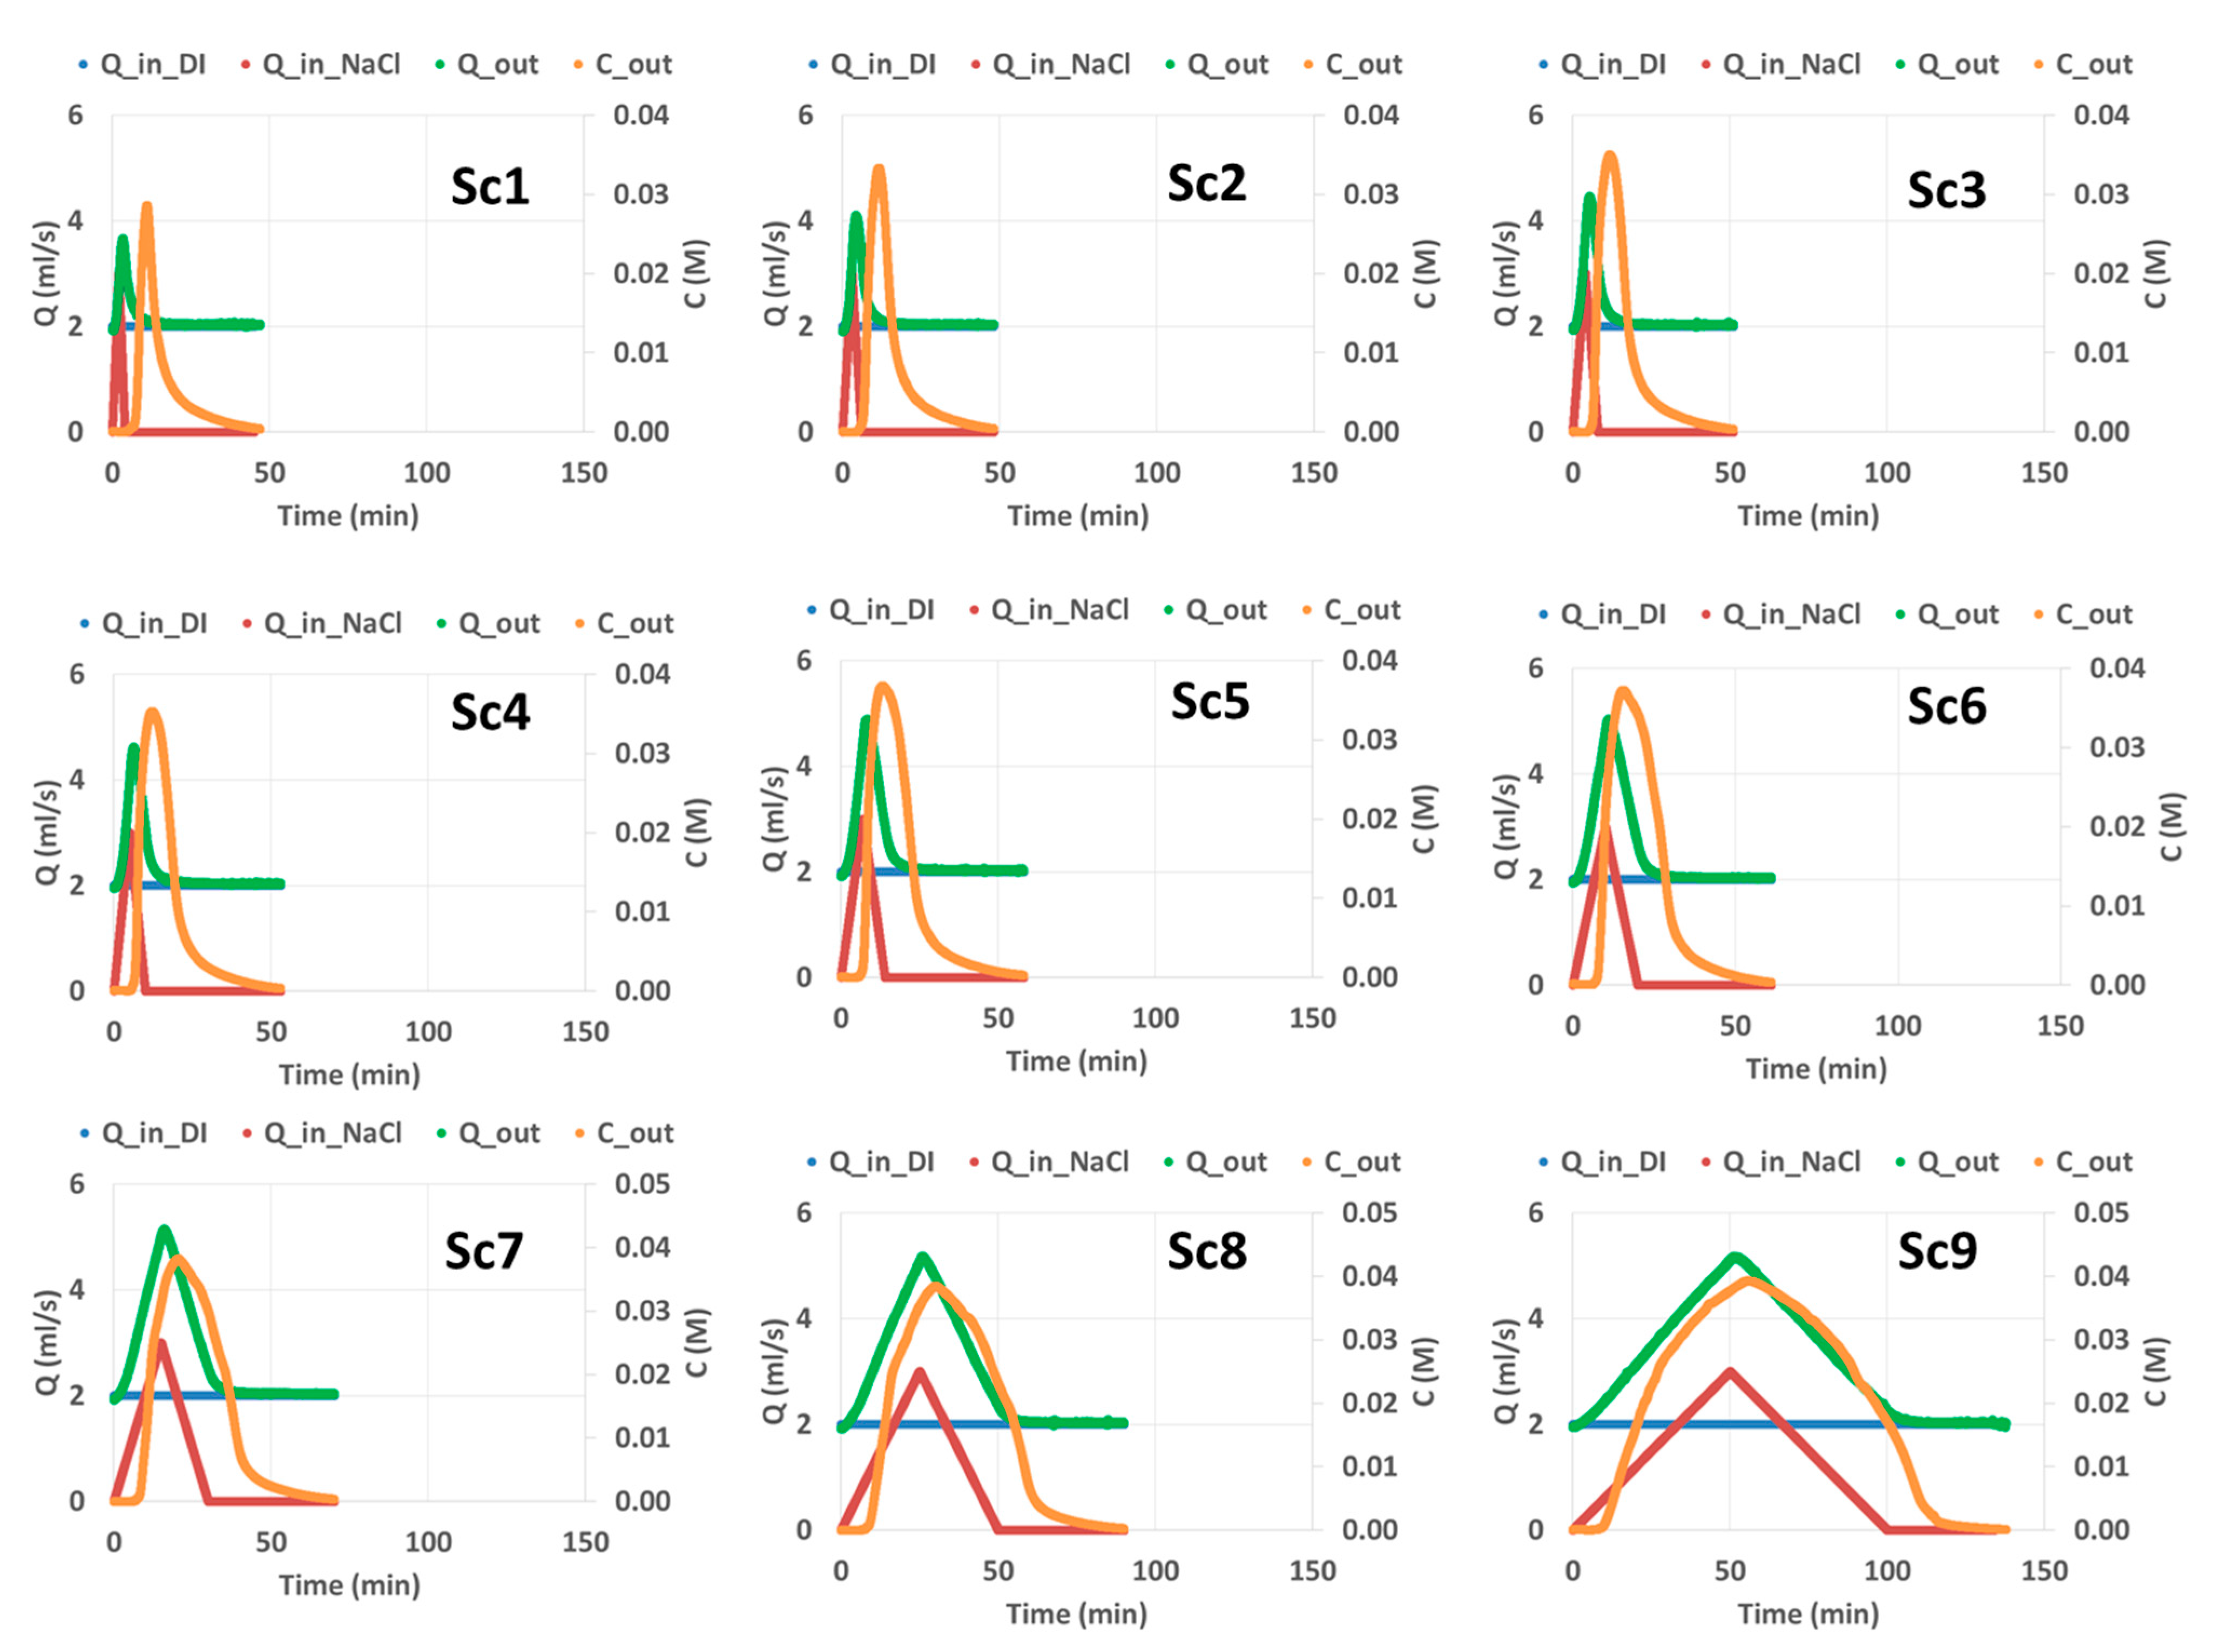
For the nine tested scenarios, experimental curves of discharge and concentration at both channel input and output are shown in Figure 3.
For all scenarios, the NaCl storm event (input signal) is a triangle with the same peak (3 mL/s) but with a variable basis (i.e., variable storm duration) according to Table 1. By associating the measured discharge and concentration at the channel output (Q_out and C_out in Figure 3), and after normalization, we obtain the C/Q normalized hysteresis relationships for the nine tested scenarios (Figure 4).
It is intriguing to see how, for the same triangular shape of the storm event at the channel input, the resulting C/Q hysteresis relationships at the channel output have very different shapes according to the storm duration. Based on the normalized curves of Figure 4, we calculate the hysteresis indices HI, FI, SI, and BI (as described in Section 2.2). The calculated hysteresis indices for the nine tested scenarios are given in Table 1.
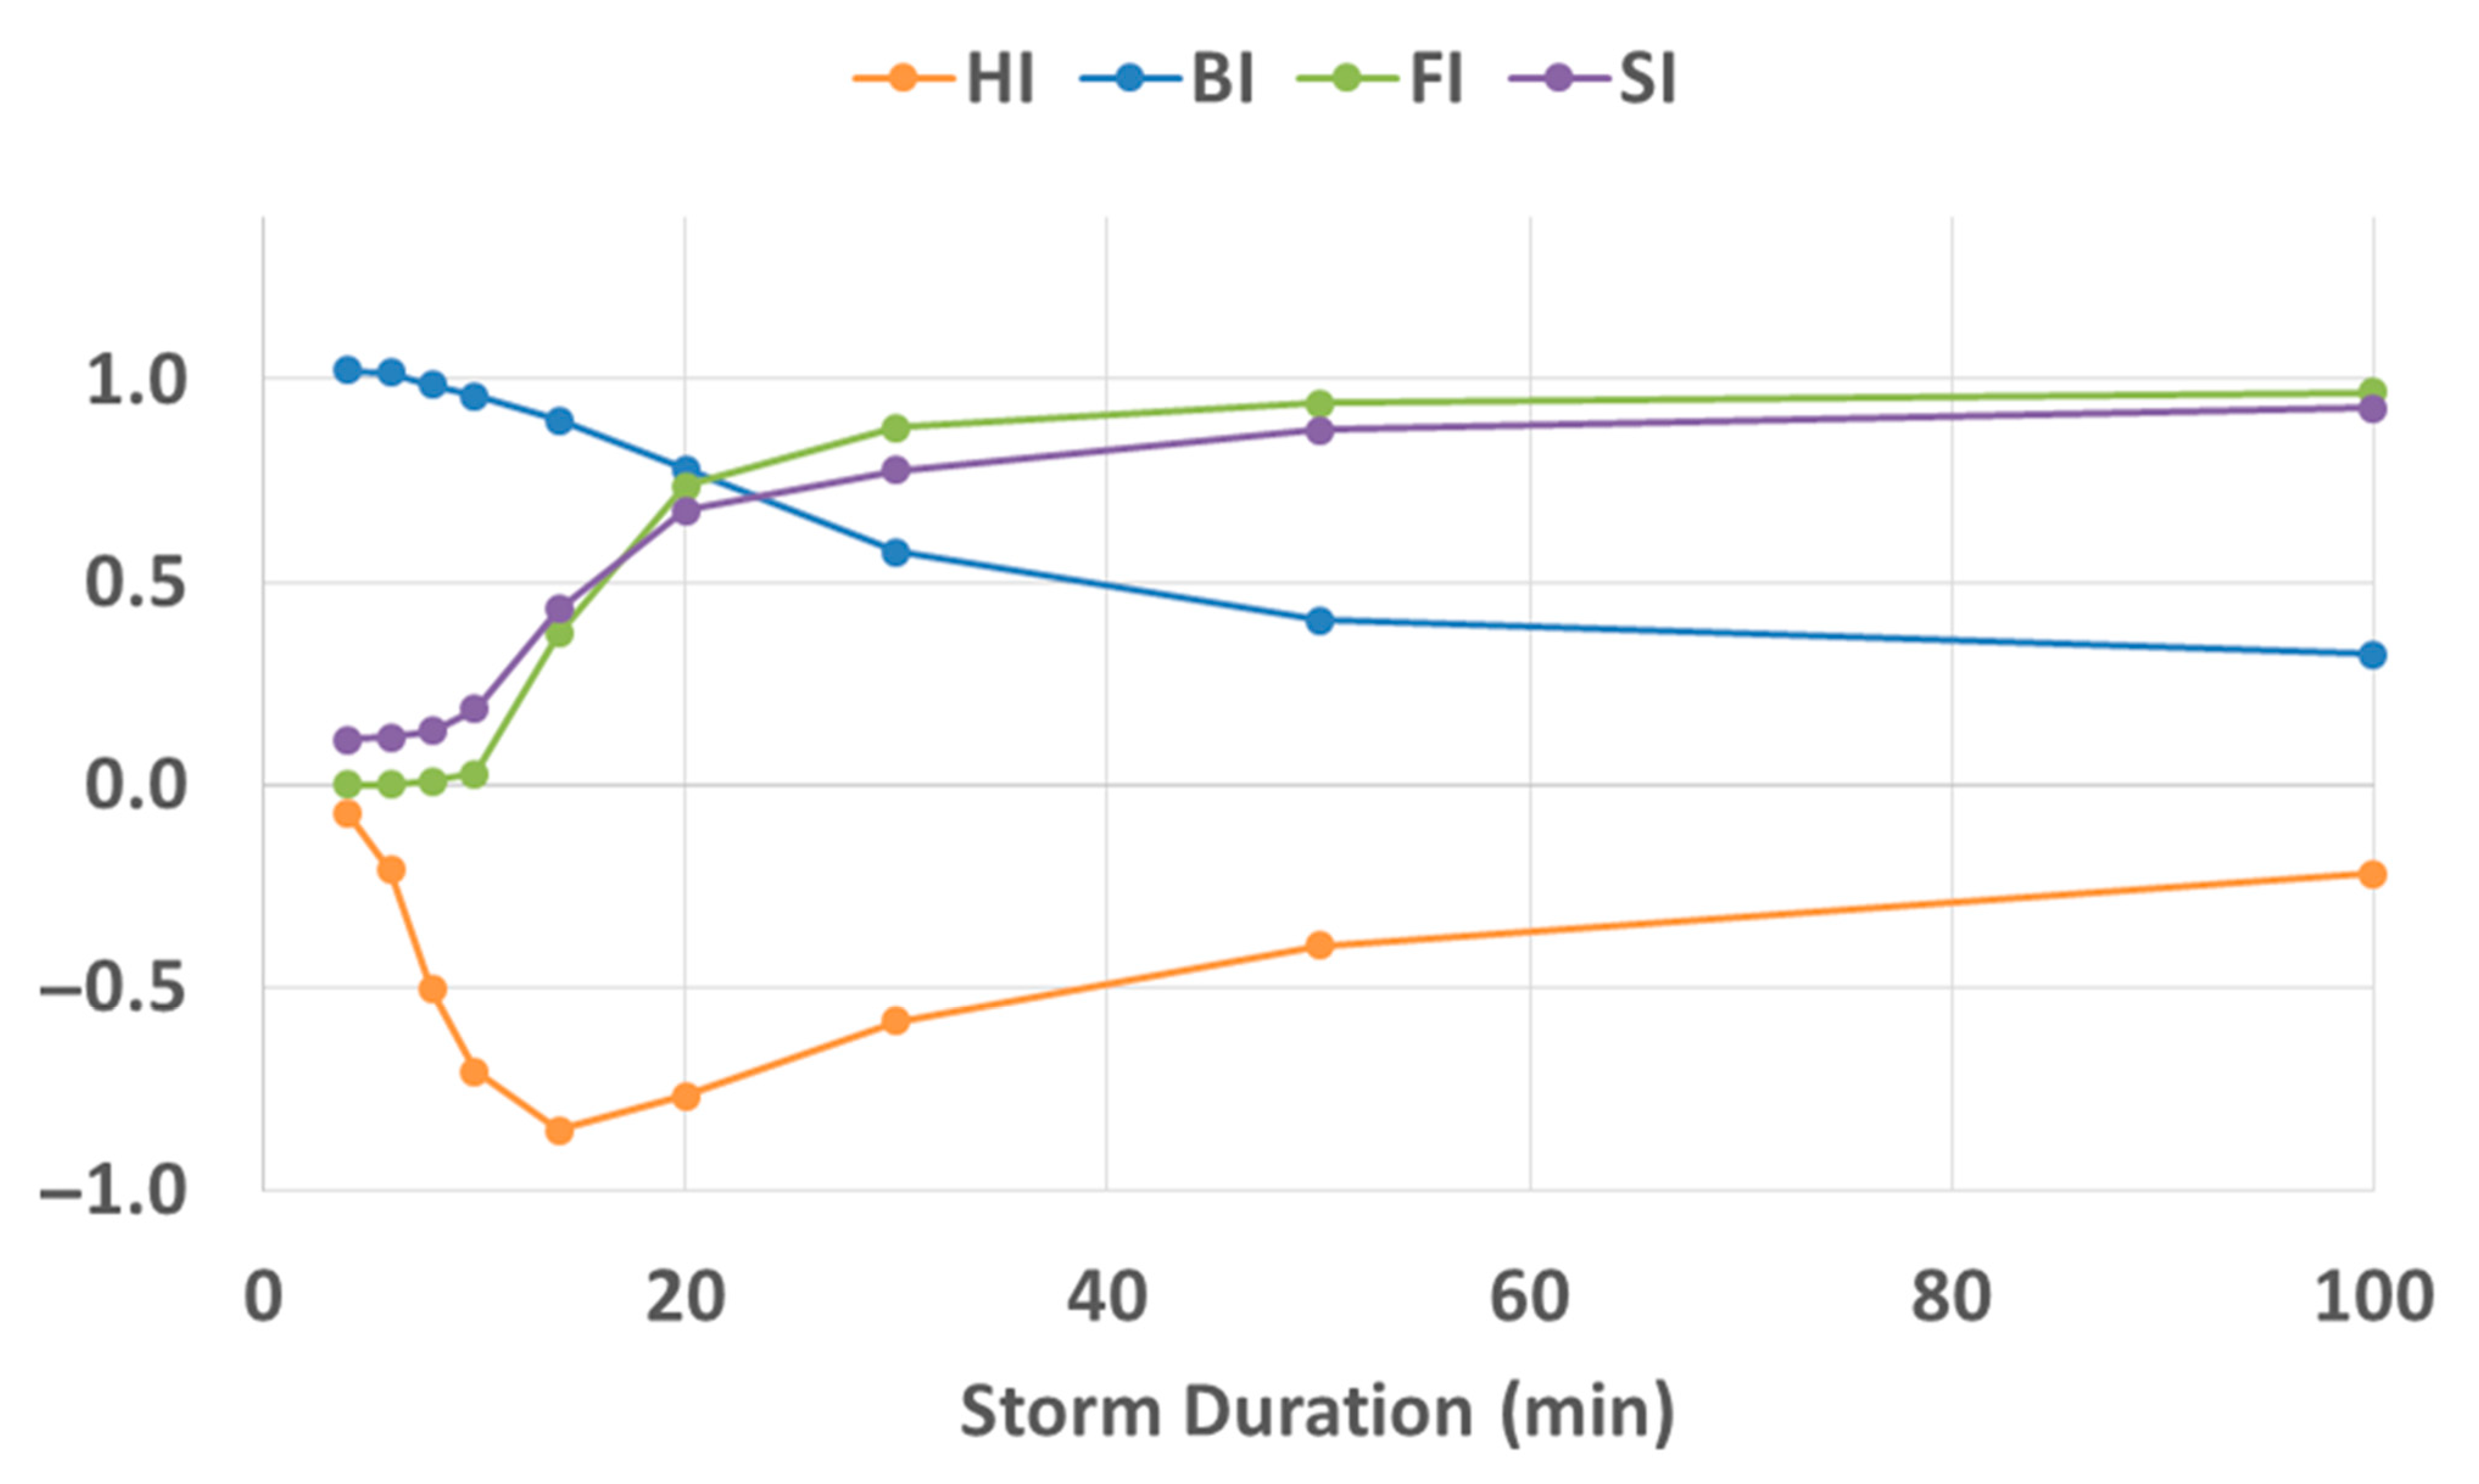
Figure 5 shows how the calculated hysteresis indices vary with storm duration. We see the following for increasing storm duration:
  • The HI index does not follow a monotonic mathematical function: HI decreases until it reaches a minimum (−0.847) around 14 min, then it increases asymptotically towards 0.
  • FI and SI follow a monotonic increase from 0 to 1.
  • BI follows a monotonic decrease from 1 to 0.
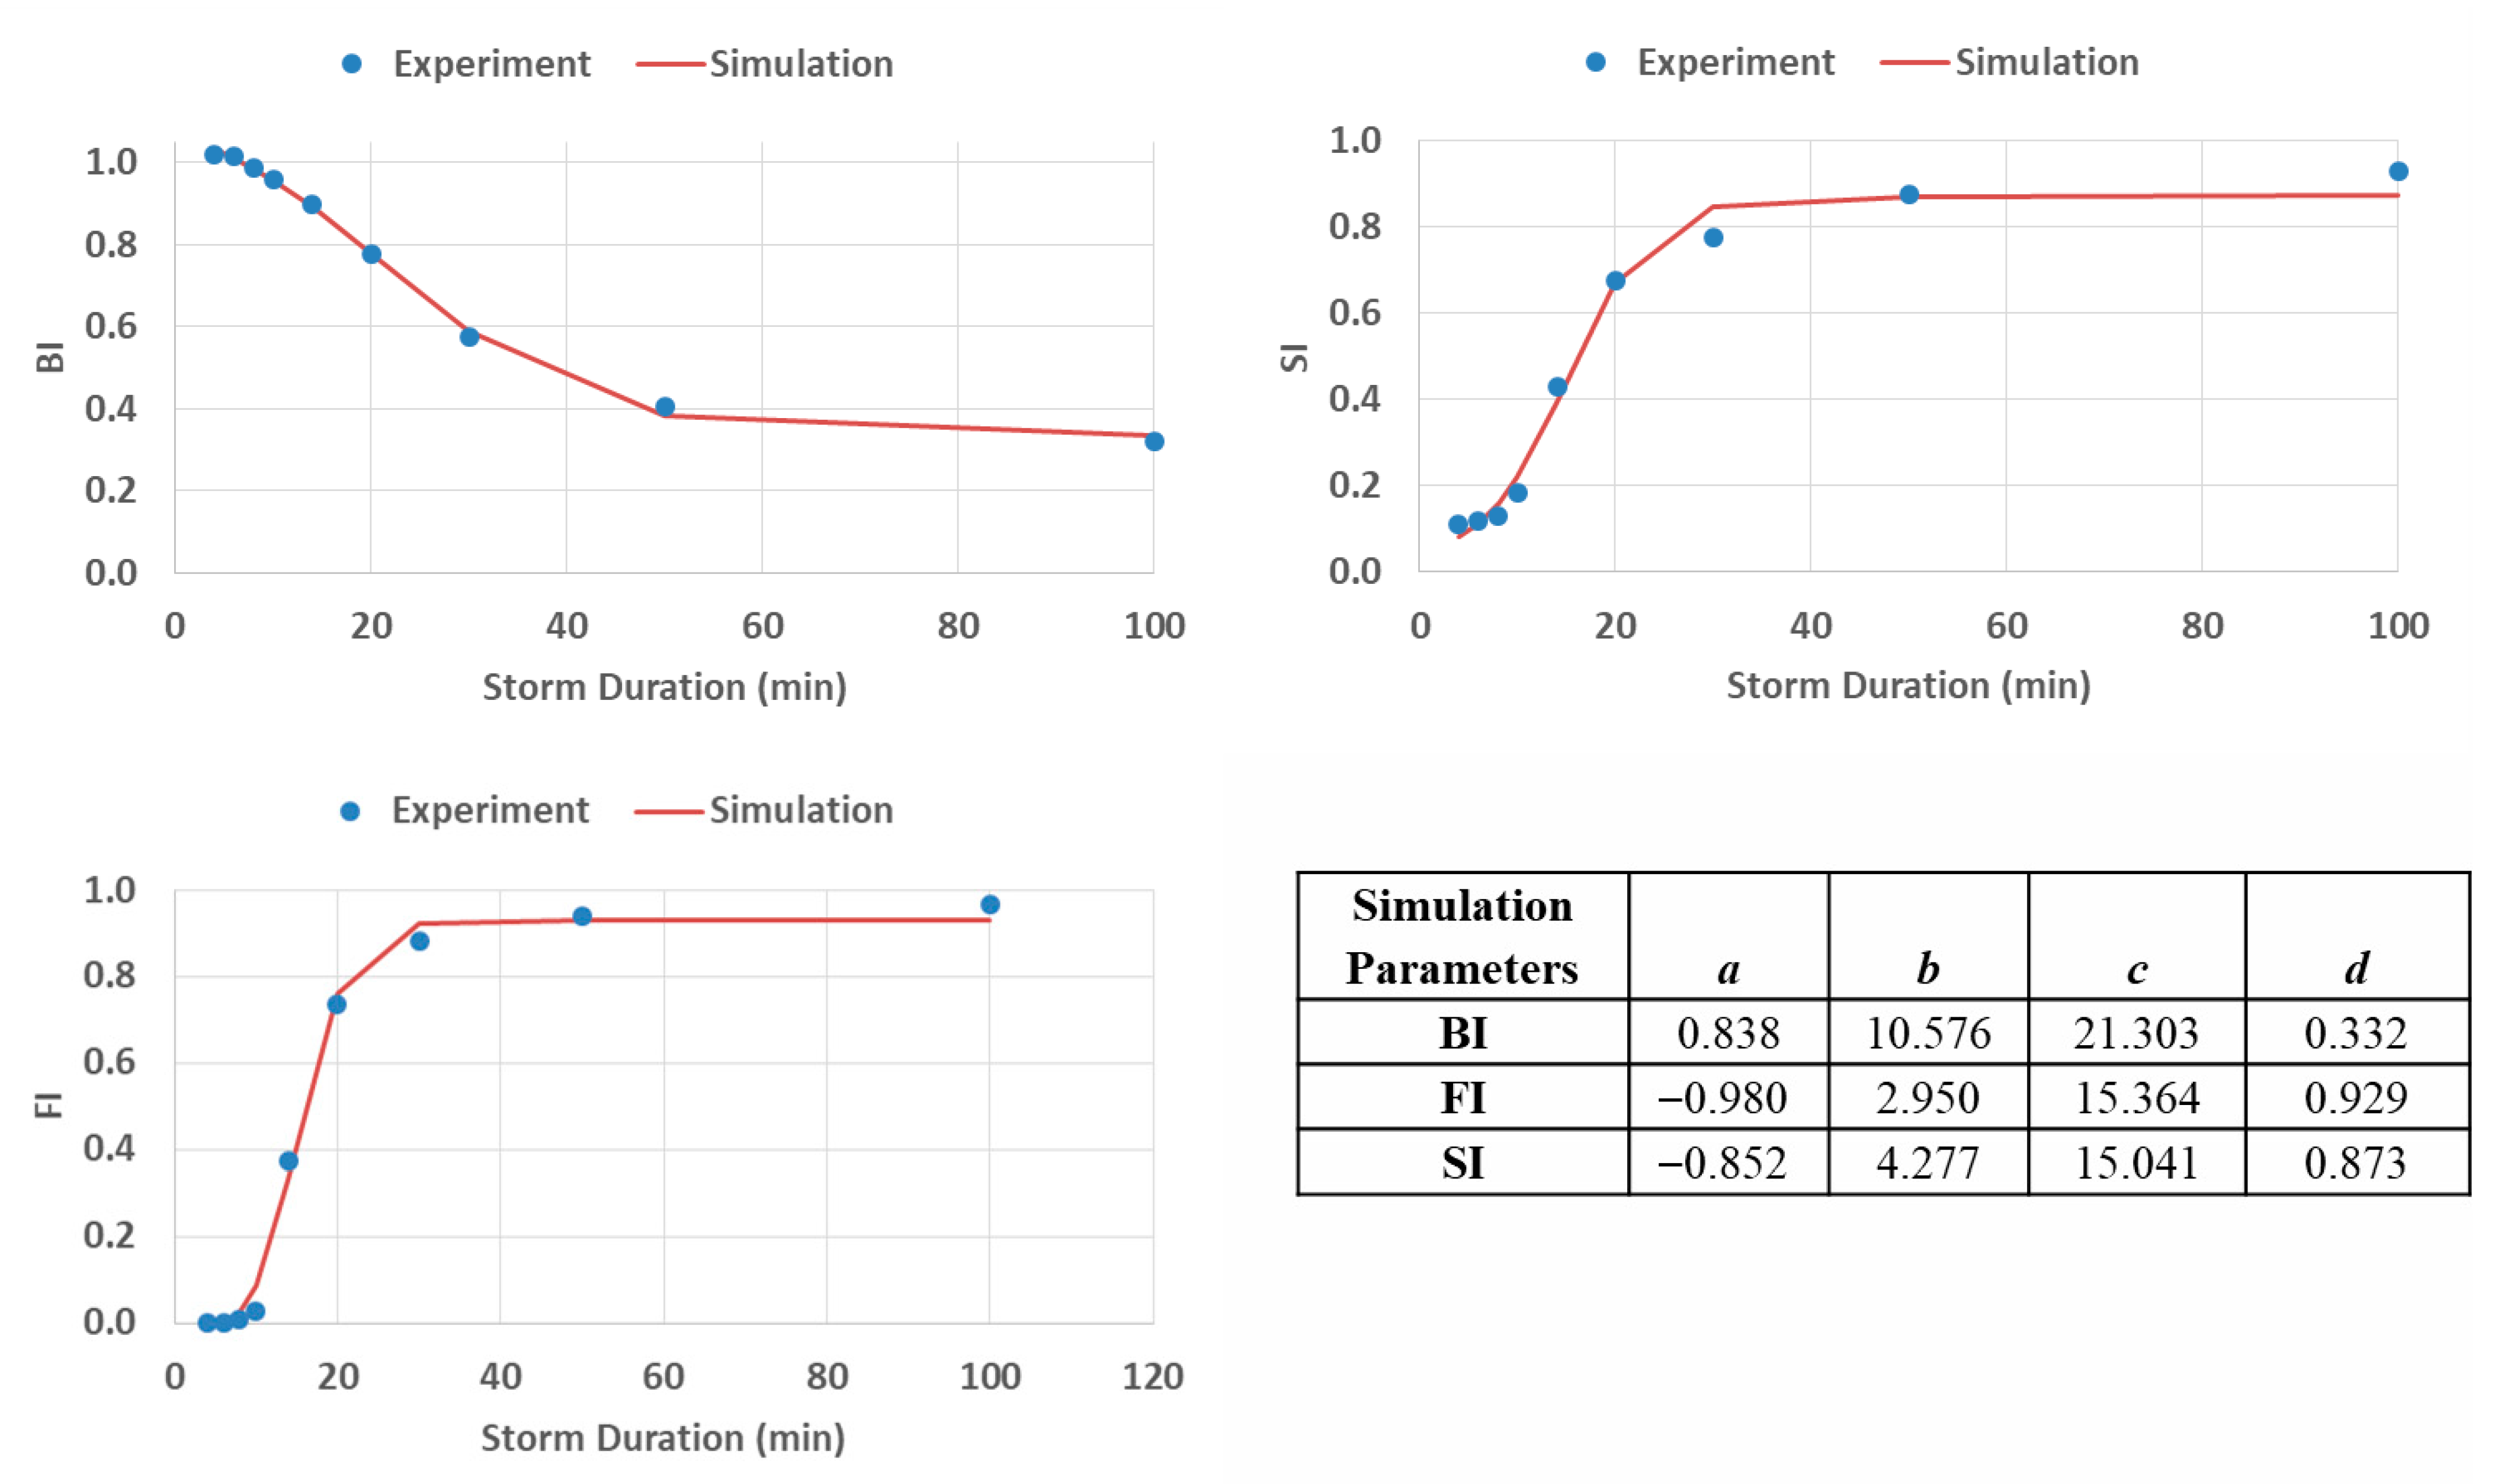
The monotonic behavior of BI, FI, and SI is close to an ‘S-shape’ function that passes from one level (min or max) to another level (max or min) around a critical threshold value. To simulate such mathematical behavior, we use a Fermi-type function according to the following:
I n d e x = a 1 + e T c b + d
where a, b, c, and d are simulation parameters, T (min) is the storm duration, and Index could be BI, FI, or SI. The c parameter represents the threshold of the Fermi function. The parameters (a, d) are dimensionless, and the parameters (b, c) are in minutes.
Figure 6 shows that the Fermi-type function reproduces very well the variability of magnitude of the indices (BI, FI, and SI) as a function of the storm duration parameter. For FI and SI, the threshold is around 15 min (c ~ 15.3 for FI, c ~ 15.0 for SI), whereas for BI the threshold is around 21 (c ~ 21.3 for BI).
The values of a, b, c, and d are related to the geometry of the channel used in this study. For other geometries and other experimental conditions, a, b, c, and d could have other values. But what we learn from this study is that the indices (BI, FI, and SI) are related to storm duration parameters and that a Fermi-type function would be a good candidate to describe the change in magnitude of (BI, FI, SI) for increasing storm duration.

4. Discussion

4.1. Platform Models

Refs. [26,27] proposed a novel experimental channel platform to study water and solute transport under unsteady flow conditions. The objective was to investigate hydraulic processes on small-size channels in comparison with usually used large-size channels. The advantage of small-size channels is that they offer the possibility of testing a large variety of unsteady hydraulic scenarios (i.e., variable with time) along with low-cost experimental conditions (low water and energy consumption, small experimental time duration).
Previous works showed the possibility of carrying out accurate stage–discharge measurements on small channel sections (a few centimeters width and depth) at small time steps (1 s) for low water levels: stage measurement [27] and stage–discharge hysteresis [25]. However, in the literature, few studies investigated the phenomenon of C/Q hysteresis on small-size experimental channels. The main result of this study is that the C/Q hysteresis phenomenon is observed on small-size experimental channels for a large variety of unsteady hydrographs.

4.2. Concentration–Discharge (C/Q) Hysteresis

Concentration–discharge hysteresis is a complex coupled hydraulic-chemical process observed in several real-world storm situations. Concentration–discharge hysteresis studies in rivers for unsteady flow are important to understand and predict water and solute transport. These studies will help in studying path flow and the origin of water.
In the literature, empirical relationships and descriptors are generally used to describe and characterize the C/Q relationship. In field studies, the major difficulties lie in data acquisition, the representativeness of measurements, uncertainties, and the complexity of hydrological, hydraulic, and chemical processes. The experimental platform overcomes these difficulties and allows us to study the C/Q relation in a controlled environment where C(t) and Q(t) data are measured precisely. This work focused on the study of the evolution of the shape of the C/Q relationship as a function of a major factor, which is the duration of the storm event (here a triangular inlet hydrograph with the same peak for all scenarios), which will influence the slope of the rising and falling limbs of the hydrograph. The results made it possible to study the evolution of the classic indices HI and FI as a function of storm event duration. We also defined two new descriptors, SI and BI, to characterize the C/Q curve, and we adjusted empirical relations to describe the evolution of these different descriptors depending on the duration of the storm event.
The experimental platform enables us to easily define new descriptors, considered as ‘hydrological signature’, describing the input and output signals stage (H), discharge (Q), and concentration (C), and to explore the evolution of these descriptors as a function of the characteristics of H(t), C(t), and Q(t). The results of this study give hydrologists new tools to understand hydrological signatures in natural rivers by relating the values of BI, SI, and FI to the duration of a storm event occurring upstream.
We should, however, bear in mind that our results are obtained on a small-scale experimental platform and that the extrapolation to large-scale natural systems needs to take into account the problem of scale variation.

5. Conclusions

In this paper, we presented the first attempt to study and report in the literature the variability of C/Q hysteresis as an output signal in response to a well-known storm event input signal. We tested nine scenarios where the storm event is a triangular input signal having a constant peak and a variable duration. The main parameter of this study is thus the storm event duration.
The nine scenarios were tested on an experimental channel (length 4 m, width 3 cm, height 5 cm). In order to reduce statistical noise, each scenario was replicated three times, and we take the mean of the three replicates as the scenario result. The measurements of C/Q hysteresis relationships at the channel output were performed at the time interval of 1 s. Thus, we obtain high-resolution experimental C/Q curves that permit us to calculate hysteresis indices with higher precision (200 timestep-discretization).
We calculated already known indices like the hysteresis index (HI) and flushing index (FI), and we introduced two new indices: the saturation index (SI) and the bisector index (BI). Then we relate all calculated indices to the storm duration parameter. All existing literature studies were focusing on the sign change in hysteresis indices, which leads to a qualitative description. The importance of our study is that it presents for the first time a quantitative description of how the magnitude of the hysteresis indices varies with the storm duration parameter.
We found that the most popular HI index does not follow a monotonic behavior for increasing storm duration. Conversely, the FI index and the two newly introduced indices (SI and BI) follow a monotonic behavior for increasing storm duration according to a Fermi-type function: FI and SI (respectively BI) increase (respectively decrease) for increasing storm duration.
The stage (H), discharge (Q), and concentration (C) measurement techniques developed in the experimental platform can be easily used in physical models to simulate water and solute transfer for non-steady flow conditions, to easily define new descriptors or ‘hydrological signatures’ describing the hysteresis H/Q, C/H, and C/Q, and to explore the evolution of these descriptors as a function of the characteristics of storm events.

Funding

This research received no external funding.

Data Availability Statement

Data are available upon request. Contact Email: samer.majdalani@umontpellier.fr.

Acknowledgments

The author thanks Jean-Philippe Chazarin from the laboratory HydroSciences Montpellier—France for his help in developing the electronic devices used in the experiments.

Conflicts of Interest

The author declares no conflict of interest.

References

  1. Evans, C.; Davies, T.D. Causes of concentration/discharge hysteresis and its potential as a tool for analysis of episode hydrochemistry. Water Resour. Res. 1998, 34, 129–137. [Google Scholar] [CrossRef]
  2. Evans, C.; Davies, T.D.; Murdoch, P.S. Component flow processes at four streams in the Catskill Mountains, New York, analysed using episodic concentration/discharge relationships. Hydrol. Process. 1999, 13, 563–575. [Google Scholar] [CrossRef]
  3. Rose, S. Comparative solute–discharge hysteresis analysis for an urbanized and a ‘control basin’ in the Georgia (USA) Piedmont. J. Hydrol. 2003, 284, 45–56. [Google Scholar] [CrossRef]
  4. Fournier, M.; Massei, N.; Bakalowicz, M.; Dussart-Baptista, L.; Rodet, J.; Dupont, J.P. Using turbidity dynamics and geochemical variability as a tool for understanding the behavior and vulnerability of a karst aquifer. Hydrogeol. J. 2007, 15, 689–704. [Google Scholar] [CrossRef]
  5. Butturini, A.; Alvarez, M.; Bernal, S.; Vazquez, E.; Sabater, F. Diversity and temporal sequences of forms of DOC and NO3 discharge responses in an intermittent stream: Predictable or random succession? J. Geophys. Res. 2008, 113, G03016. [Google Scholar] [CrossRef]
  6. Toran, L.; Reisch, C.E. Using stormwater hysteresis to characterize karst spring discharge. Groundwater 2013, 51, 575–587. [Google Scholar] [CrossRef]
  7. Sherriff, S.C.; Rowan, J.S.; Fenton, O.; Jordan, P.; Melland, A.R.; Mellander, P.E.; Ó hUallacháin, D. Storm Event Suspended Sediment-Discharge Hysteresis and Controls in Agricultural Watersheds: Implications for Watershed Scale Sediment Management. Environ. Sci. Technol. 2016, 50, 1769–1778. [Google Scholar] [CrossRef]
  8. Zhang, R.; Chen, X.; Zhang, Z.; Soulsby, C. Using hysteretic behaviour and hydrograph classification to identify hydrological function across the “hillslope–depression–stream” continuum in a karst catchment. Hydrol. Process. 2020, 34, 3464–3480. [Google Scholar] [CrossRef]
  9. Heathwaite, A.L.; Bieroza, M. Fingerprinting hydrological and biogeochemical drivers of freshwater quality. Hydrol. Process. 2020, 2021, e13973. [Google Scholar] [CrossRef]
  10. Le Mesnil, M.; Charlier, J.B.; Moussa, R.; Caballero, Y. Investigating flood processes in karst catchments by combining concentration-discharge relationship analysis and lateral flow simulation. J. Hydrol. 2022, 605, 127358. [Google Scholar] [CrossRef]
  11. Floury, P.; Bouchez, J.; Druhan, J.L.; Gaillardet, J.; Blanchouin, A.; Gayer, E.; Ansart, P. Linking dynamic water storage and subsurface geochemical structure using high-frequency concentration-discharge records. Water Resour. Res. 2024, 60, e2022WR033999. [Google Scholar] [CrossRef]
  12. Malutta, S.; Kobiyama, M.; Chaffe, P.L.B.; Bonumá, N.B. Hysteresis analysis to quantify and qualify the sediment dynamics: State of the art. Water Sci. Technol. 2020, 81, 2471–2487. [Google Scholar] [CrossRef]
  13. Liu, W.; Birgand, F.; Tian, S.; Chen, C. Event-scale hysteresis metrics to reveal processes and mechanisms controlling constituent export from watersheds: A review. Water Res. 2021, 200, 117254. [Google Scholar] [CrossRef] [PubMed]
  14. Chanat, J.G.; Rice, K.C.; Hornberger, G.M. Consistency of patterns in concentration-discharge plots. Water Resour. Res. 2002, 38, 1147. [Google Scholar] [CrossRef]
  15. Husic, A.; Fox, J.F.; Clare, E.; Mahoney, T.; Zarnaghsh, A. Nitrate hysteresis as a tool for revealing storm-event dynamics and improving water quality model performance. Water Resour. Res. 2023, 59, e2022WR033180. [Google Scholar] [CrossRef]
  16. Vaughan, M.C.H.; Bowden, W.B.; Shanley, J.B.; Vermilyea, A.; Sleeper, R.; Gold, A.J.; Pradhanang, S.M.; Inamdar, S.P.; Levia, D.F.; Andres, A.S.; et al. High-frequency dissolved organic carbon and nitrate measurements reveal differences in storm hysteresis and loading in relation to land cover and seasonality. Water Resour. Res. 2017, 53, 5345–5363. [Google Scholar] [CrossRef]
  17. Rose, L.A.; Karwan, D.L.; Godsey, S.E. Concentration–discharge relationships describe solute and sediment mobilization, reaction, and transport at event and longer timescales. Hydrol. Process. 2018, 32, 2829–2844. [Google Scholar] [CrossRef]
  18. Li, X.; Wang, J.; Lin, J.; Yin, W.; Shi, Y.Y.; Wang, L.; Xiao, H.B.; Zhong, Z.M.; Jiang, H.; Shi, Z.H. Hysteresis analysis reveals dissolved carbon concentration—Discharge relationships during and between storm events. Water Res. 2022, 226, 119220. [Google Scholar] [CrossRef]
  19. Zhu, M.; Yu, X.; Li, Z.; Xu, X.; Ye, Z. Quantifying and interpreting the hysteresis patterns of monthly sediment concentration and water discharge in karst watersheds. J. Hydrol. 2023, 618, 129179. [Google Scholar] [CrossRef]
  20. Yu, B.; Shi, Z.; Zhang, Y. Linking hydrological and landscape characteristics to suspended sediment-discharge hysteresis in Wudinghe River Basin on the Loess Plateau, China. Catena 2023, 228, 107169. [Google Scholar] [CrossRef]
  21. Senatore, A.; Corrente, G.A.; Argento, E.L.; Castagna, J.; Micieli, M.; Mendicino, G.; Beneduci, A.; Botter, G. Seasonal and storm event-based dynamics of Dissolved Organic carbon (DOC) concentration in a Mediterranean headwater catchment. Water Resour. Res. 2023, 59, e2022WR034397. [Google Scholar] [CrossRef]
  22. Knapp, J.L.A.; von Freyberg, J.; Studer, B.; Kiewiet, L.; Kirchner, J.W. Concentration–discharge relationships vary among hydrological events, reflecting differences in event characteristics. Hydrol. Earth Syst. Sci. 2020, 24, 2561–2576. [Google Scholar] [CrossRef]
  23. Peña, P.; Pesántez, J.; Birkel, C.; Mosquera, G.; Arízaga-Idrovo, V.; Mora, E.; Crespo, P. How do storm characteristics influence concentration-discharge hysteresis in a high-elevation tropical ecosystem? J. Hydrol. 2023, 619, 129345. [Google Scholar] [CrossRef]
  24. Lloyd, C.E.M.; Freer, J.E.; Johnes, P.J.; Collins, A.L. Technical Note: Testing an improved index for analysing storm discharge–concentration hysteresis. Hydrol. Earth Syst. Sci. 2016, 20, 625–632. [Google Scholar] [CrossRef]
  25. Majdalani, S.; Delestre, O.; Moussa, R. Experimental investigation of loop rating curve on a small 3D printed laboratory channel. J. Hydrol. 2023, 623, 129741. [Google Scholar] [CrossRef]
  26. Majdalani, S.; Moussa, R.; Chazarin, J.P. A novel platform to evaluate the dampening of water and solute transport in an experimental channel under unsteady flow conditions. Hydrol. Process. 2020, 34, 956–971. [Google Scholar] [CrossRef]
  27. Majdalani, S.; Chazarin, J.P.; Moussa, R. A new water level measurement method combining infrared sensors and floats for applications on laboratory scale channel under unsteady flow regime. Sensors 2019, 19, 1511. [Google Scholar] [CrossRef]
Figure 1. Experimental setup.
Hydrology 12 00221 g001
Figure 2. Hysteresis indices used in this study. HI is the mean of the difference between rising and falling limbs of the hysteresis (Equation (2)). Cn_(Qn=1) is the flushing index FI. Qn_(Cn=1) is the saturation index SI (new index). Another new index is the bisector index (BI), which is the mean of the absolute distance between the first bisector and both rising and falling limbs of the hysteresis (Equation (3)).
Hydrology 12 00221 g002
Figure 3. Experimental curves of discharge and concentration at both channel input and output. Q_in_DI (blue) is the constant discharge (2 mL/s) of deionized water imposed at the channel input. Q_in_NaCl (red) is the variable discharge of NaCl solution imposed at the channel input. Q_out (green) is the discharge of the effluent measured at the channel output. C_out (orange) is the concentration of the effluent measured at the channel output.
Hydrology 12 00221 g003
Figure 4. C/Q normalized hysteresis relationships for the nine tested scenarios. Blue: hysteresis rising limb. Red: hysteresis falling limb. Green: the first bisector. These C/Q hysteresis relationships are the ‘output signal’ measured at the channel output as a response to the ‘input signal’ (NaCl triangular storm event) imposed at the channel input.
Hydrology 12 00221 g004
Figure 5. Calculated hysteresis indices (HI, BI, FI, and SI) as a function of the storm duration parameter. Full lines are for eye guidance.
Hydrology 12 00221 g005
Figure 6. Simulation of hysteresis indices (BI, FI, and SI) with a Fermi-type function (Equation (4)) and the corresponding simulation parameters (a, b, c, and d).
Hydrology 12 00221 g006
Table 1. Triangle storm event duration of the nine tested scenarios and the corresponding calculated hysteresis indices.
Storm Duration
(min)
ScenarioHIBIFISI
4Sc1−0.0991.020.000080.111
6Sc2−0.2651.020.00020.117
8Sc3−0.5470.990.0080.130
10Sc4−0.7390.960.0270.185
14Sc5−0.8470.900.3720.431
20Sc6−0.7540.780.7360.676
30Sc7−0.5620.570.8810.775
50Sc8−0.3660.400.9410.876
100Sc9−0.1910.320.9670.930
Disclaimer/Publisher’s Note: The statements, opinions and data contained in all publications are solely those of the individual author(s) and contributor(s) and not of MDPI and/or the editor(s). MDPI and/or the editor(s) disclaim responsibility for any injury to people or property resulting from any ideas, methods, instructions or products referred to in the content.