Article

Method for Establishing Heavy Rainfall Equations Based on Regional Characteristics: Transformation of Maximum Daily Precipitation

by
Laura Thebit de Almeida
1,
Roberto Avelino Cecílio
2,*,
Marcel Carvalho Abreu
3 and
Ivana Patente Torres
4
1
Federal Institute of Education, Science and Technology of Northern Minas Gerais, Januária 39480-000, Brazil
2
Department of Forest and Wood Sciences, Federal University of Espírito Santo, Jerônimo Monteiro 29550-000, Brazil
3
National Center for Monitoring and Alerts for Natural Disasters, São José dos Campos 12247-016, Brazil
4
Department of Agricultural Engineering, Federal University of Viçosa, Viçosa 36570-900, Brazil
*
Author to whom correspondence should be addressed.
Hydrology 2025, 12(8), 211; https://doi.org/10.3390/hydrology12080211
Submission received: 16 July 2025 / Revised: 7 August 2025 / Accepted: 10 August 2025 / Published: 12 August 2025

Abstract

Modeling heavy rainfall patterns is essential for designing hydraulic structures, planning land use and water resources, and predicting disasters, among others. Usually, heavy rainfall is characterized by curves that relate the intensity, duration, and frequency (IDF), adjusted from the analysis of pluviograms. Alternatively, these equations can be adjusted using disaggregated daily rainfall data, whose reliability is currently questioned due to the use of common coefficients to disaggregate the maximum daily precipitation (hday) into rainfall associated with shorter durations. This study proposes the Transformation of Maximum Daily Precipitation method (TMDP) using the maximum daily precipitation of the station of interest and the curve of heavy rainfall of the nearest location, denoting the local characteristic, to transform the hday associated with a return period into rainfall intensities for shorter durations. The TMDP proved to be slightly superior to the most widely used rainfall disaggregation method in Brazil, particularly in regions with a higher density of data for the IDF equation. The TMDP is a potential tool for regions with low density of rainfall data, although it has limitations in regions where such data are scarce.

1. Introduction

Heavy rainfall is regarded as high rainfall volumes in a short time. These events can have considerably undesirable effects on human activities and the environment, such as losses in agricultural production [1], water erosion [2], floods [3], landslides [4], silting of lowlands and riverbeds [5], damage to hydraulic structures [6], among others.
Models providing reliable estimates of heavy rainfall are essential for hydraulic structure design, land use planning, water resource management, and forecasting environmental disasters [7]. Currently, one of the most common ways of characterizing heavy rainfall in a given location is through intensity, duration, and frequency (IDF) curves [8], represented by Equation (1), which has local parameters, adjusted from data on the most intense rainfalls of different durations, associated with different return periods [9]. Usually, the data needed to adjust the equations comes from pluviographs.
I m = K   T a ( d + b ) c
in which Im represents the average maximum rainfall intensity, in mm h−1; T is the rainfall’s return period, in years; d is its duration, in minutes; K, a, b, c are parameters statistically adjusted to each location.
An IDF curve, following the standard method, is established from a series of sub-daily rainfall data of maximum rainfall associated with different durations. The largest database of IDF curves for Brazil, a continental country with more than 8.5 million km2, accounts for only 373 equations established in this way, in the Plúvio 2.1 application. This number represents the density of one equation (rainfall station) for every 22,754 km2, a number much higher than the maximum limit of one station for every 3000 km2, suggested by the World Meteorological Organization [10]. In countries with large territorial extensions and demographic, social, economic, and environmental differences, such as Brazil, the distribution of the rainfall network is uneven, aggravating the situation of representativeness of IDF equations in remote regions.
To increase the availability of IDF equations, an alternative is to establish them from daily rainfall data, disaggregating the maximum daily precipitation into maximum rainfalls with sub-daily durations. This method, called “Rainfall Depth-Duration” (RDD), is the most widely used in Brazil in studies to obtain the IDF equation [11]. The vast majority of common applications of RDD in Brazil use generic disaggregation coefficients (dc) developed by “Companhia Ambiental do Estado de São Paulo” [12], assumed to be valid for the entire country. However, said disaggregation coefficients were established from the ratio of maximum rainfalls of different durations from short and old rainfall series (between 1957 and 1979), which do not necessarily reflect the specific temporal and regional/local peculiarities of intense rainfall for the whole of Brazil [13,14,15]. The methods described and traditionally employed are essentially site-specific, lacking a spatial relationship among the generated IDF equations. Their application in areas without rain gauges, therefore, relies on spatialization techniques, which can only be implemented after the development of the equations.
Some efforts have been made to address regional/local peculiarities of heavy rainfall by establishing specific disaggregation coefficients in places with sub-daily extreme rainfall data available to represent a specific coverage area [14,16,17,18,19]. However, the procedure is limited by low data availability to determine specific disaggregation coefficients, due to the insufficiency of a monitoring network and/or the time lag and progressive gaps in the series [20,21].
The major challenge to studying alternative methods for obtaining IDF relationships in Brazil is to cover broader areas with disaggregation coefficients in regions without observations of pluviometric data. It is believed, as a premise of this work, that a better way of establishing IDF curves can be achieved by associating the ease of application of the “Rainfall Depth-Duration” with the regional peculiarities of intense rainfall. Local and regional characteristics of extreme rainfall events can be utilized to improve methods for deriving IDF equations, allowing for a more accurate representation of spatial and temporal variability.
Hence, the present work aims to propose a new method, called Transformation of Maximum Daily Precipitation (TMDP), to obtain the curves of intense rainfall, from the transformation of daily rainfall data from the desired location into maximum sub-daily rainfall intensities. The information on intense rainfall is obtained through the product of the local maximum daily precipitation by a transformation coefficient (tc), established from data extracted from the IDF curve of the nearest rain gauge station, denoting the regional characteristic.

2. Materials and Methods

2.1. Study Area

Brazil exhibits a diverse rainfall regime (Figure 1a) primarily governed by its vast territorial extension, tropical location, and complex atmospheric circulation patterns. Annual precipitation ranges from over 3000 mm in the Amazon Basin to less than 500 mm in the semi-arid northeast. The majority of the country experiences a marked wet season during the austral summer (approximately November to March), driven by the South American Monsoon System. In contrast, the northeast region is characterized by irregular and scarce rainfall, often influenced by the Intertropical Convergence Zone (ITCZ) and sea surface temperature anomalies in the Atlantic and Pacific oceans. Coastal areas and the southern region present more evenly distributed rainfall throughout the year.
The temperature regime (Figure 1b) is predominantly influenced by its tropical and subtropical latitudinal position, low topographic variation in most regions, and extensive landmass. The country experiences generally high average temperatures throughout the year, with mean annual temperatures ranging from approximately 18 °C in the southern highlands to over 28 °C in the northern lowlands. Seasonal temperature variation is relatively low in equatorial regions but becomes more pronounced in the southern states due to subtropical influences. Although Brazil does not experience severe winters, occasional cold air incursions from higher latitudes can affect the South, leading to temporary drops in temperature, particularly during austral winter (June–August).
Brazil’s topography (Figure 1c) is characterized predominantly by extensive plateaus, low mountain ranges, and broad sedimentary basins. The Brazilian Highlands (Planalto Brasileiro) dominate much of the central and eastern territory, with elevations typically between 300 and 900 m above sea level. In contrast, the Amazon Basin in the north features vast lowland plains with gentle relief, playing a crucial role in the country’s hydrological and ecological systems. Mountainous regions are relatively limited, with the highest elevations found in the southeastern and southern parts of the country, such as the Mantiqueira and Serra do Mar ranges. Overall, the Brazilian terrain lacks extreme altitudinal variation but contributes significantly to regional climatic and hydrological dynamics.

2.2. Proposed Method

The proposed method was called Transformation of Maximum Daily Precipitation (TMDP), and it uses a transformation coefficient ( t c d , T ) designed to transform the maximum daily precipitation depth (hday) of a specific station into the maximum average rainfall intensity, associated with a specific duration (d) and return period (T). The maximum rainfall intensity associated with a pair of d and T ( I d ,   T ^ in mm/h) is obtained by the product between t c d , T and the maximum daily precipitation depth associated with the same T (hday,T in mm), according to Equation (2).
I d ,   T ^ = t c d , T   ·   h d a y , T
The hday,T represents the local magnitude of maximum rainfall events. It is calculated through frequency analysis and estimation of quantiles of interest of the maximum annual daily rainfall for the station of interest, as described in Section 2.2.1.
The t c d , T to be applied are not derived from the station or location of interest. Instead, they pertain to the nearest location for which an IDF equation is available (the support station). Therefore, the t c d , T   represent the regional patterns of heavy rainfall. The methodology for establishing the t c d , T is outlined in Section 2.2.2.
Once the transformations of hday,T have been performed for several I d ,   T ^ associated with a series of pairs of d (1440, 720, 360, 240, 180, 120, 60, 50, 40, 30, 20, and 10 min) and T (2, 5 10, 20, 50, and 100 years), it is possible to adjust the IDF equation according to the traditional procedure for establishing these equations [16], estimating the parameters K, a, b and c of Equation (1), using the Gauss–Newton method.

2.2.1. Maximum Daily Precipitation Depth Associated with a Return Period (hday,T)

The hday,T is determined from an annual series of maximum daily precipitation (hday) from the rainfall station of interest. Annual extreme sub-daily rainfall time series are rarely not random or independent [13]. In this study, the series were therefore considered independent.
Probability density functions (PDF) are fitted to the data series; the most commonly used are: Gumbel (GUM), Generalized Extreme Events (GEV), 2-parameter Log-normal (LN2), 3-parameter Log-normal (LN3), or Gamma (G) [22]. PDFs are commonly employed for the estimation of the probable maximum precipitation, particularly in association with return periods. This approach enables the characterization of rainfall extremes and their recurrence, providing a statistical basis for hydrological design and risk assessment [13,16,22]. The adequacy of the probability distributions to the observed data, as well as the classification of their performance, was evaluated using goodness-of-fit tests at a 5% significance level. It can also classify the PDFs according to the level of adequacy of each PDF to the data series [13]. The best PDF is chosen through goodness-of-fit (GOF) tests, which verify the adequacy of the PDF to the data series with a significance level of 5%. It can also classify the PDFs according to the level of adequacy of each PDF to the data series. The GOF tests used were: Kolmogorov–Smirnov (KS), Chi-square (Χ2), and Anderson–Darling (AD). The classification of PDFs was performed by analyzing the p-value in each GOF test, which represents the probability of obtaining a test statistic equal to or more extreme than that observed in a sample, under the null hypothesis that the PDF is adherent to the data series. The p-values below the significance level (α = 0.05) indicate PDFs that are not suitable for the hday data series, and in such cases, these distributions are not employed to estimate the probable maximum precipitation. The highest p-value in each GOF indicates which PDF is most appropriate to the hday series. If the adherence tests regarding the best PDF disagree among themselves, that is, GOF tests resulted in different PDFs with the best performance, the PDF with the best performance in the chi-square test (Χ2) was considered. The X2 test was selected because it presented good performance in the selection of PDFs, with less uncertainty in the estimation of quantiles of interest and good statistical performance in the representation of hday [22].

2.2.2. Coefficients to Transform Daily Rainfall ( t c d , T )

The transformation coefficients are used to consider the regional characteristics of intense rainfall with sub-daily duration, based on a geographic criterion. Therefore, they must be established with the daily rainfall data and with the IDF equation of the support station. The t c d , T are established through Equation (3), which expresses the relationship between the maximum rainfall intensity calculated by the IDF equation ( I I D F   d ,   T ) and the hday,T of the support station. Several combinations between d (1440, 720, 360, 240, 180, 120, 60, 50, 40, 30, 20, 10 min) and T (2, 5 10, 20, 50, 100 years) are considered, to establish a specific t c d , T of these combinations.
t c d , T = I I D F   d , T h   d a y , T
The hday,T is the quantile of interest calculated as described in Section 2.2.1, using precipitation data for the same period (same years of analysis) for which the IDF equation was originally adjusted.
Assuming a spatial dependence [23] and similar characteristics of heavy rainfall for nearby locations, the established t c d , T are applied to transform the maximum daily precipitation in nearby rainfall stations, thus reflecting the regional behavior of sub-daily heavy rainfall.

2.3. Method’s Application and Assessment

2.3.1. Establishing t c d , T for Brazil

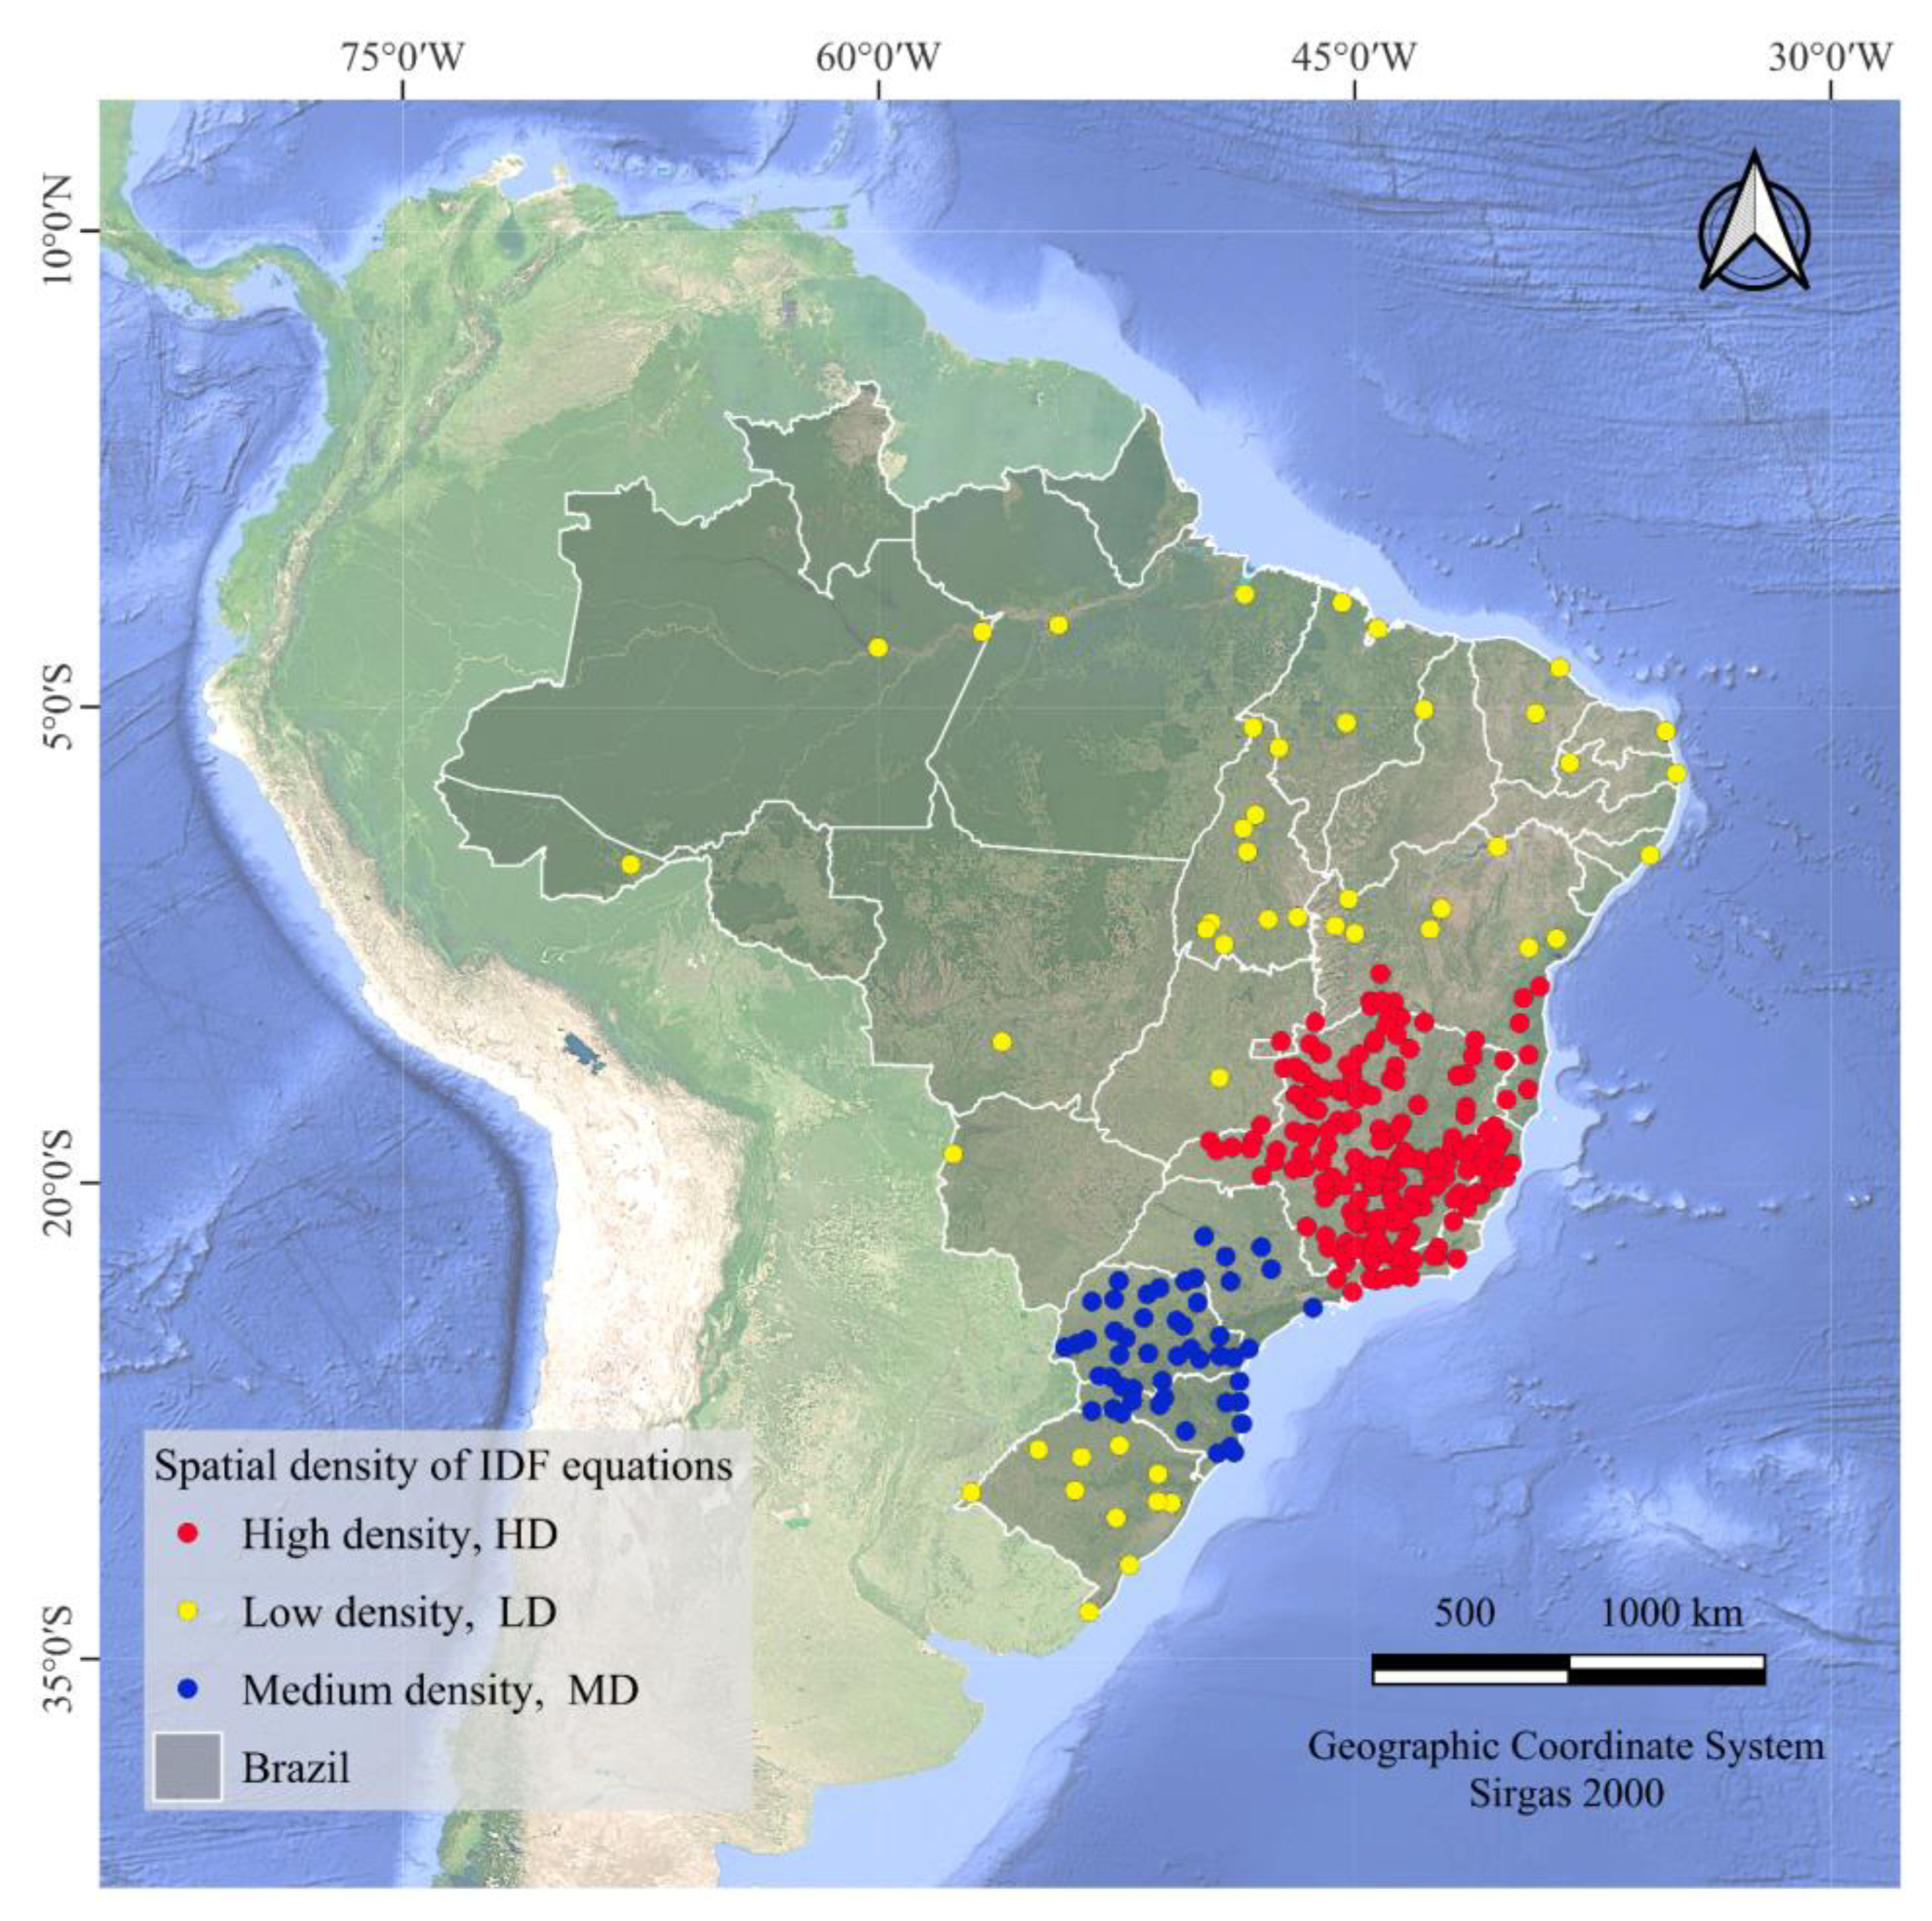
First, the t c d , T of the TMDP method was established for the 373 locations in Brazil where adjusted IDF equations exist [24,25,26,27,28,29,30], as in Section 2.2.2. Figure 2 shows the spatial distribution of these stations in Brazil. The temporal extent of the extreme rainfall series ranges from 5 to 26 years, exhibiting variability in both commencement and termination dates. The majority of these series initiated in the 1980s and terminated towards the late 1990s [11]. The highest density of IDF equations, defined as the high-density group (HD), is in the southeast of the country, except for the state of São Paulo, and in the south of Bahia, with approximately one equation every 3400 km2. Equations concentrated in the states of São Paulo, Santa Catarina, and Paraná correspond to the region with medium density (MD) of IDF equations distributed by area, with one station every 9000 km2. The lowest density group (LD), represented by the other stations spread throughout the country, has one station every 150,000 km2. It is noteworthy that all observed densities are still below those recommended by the WMO.

2.3.2. Assessment

The TMDP was applied to the same locations where rainfall data and established IDF equations are available. The rainfall data from the stations were obtained from the Santa Catarina Agricultural Research and Rural Extension Company—Epagri, the Department of Water and Energy (DAEE), and the Hidroweb portal of the National Water and Basic Sanitation Agency [31]. The IDF equations were obtained from publications in peer-reviewed journals. It should be noted that, for this stage, the t c d , T used were those of the station closest to the one of interest, and not from the station itself.
For each station, the I I D F   d , T were obtained using the parameters K, a, b, and c of Equation (1), for the combinations of durations (d) of 1440, 720, 360, 240, 180, 120, 60, 50, 40, 30, 20, 10 min with the return periods (T) of 2, 5 10, 20, 50, 100 years.
The performance of TMDP was assessed by comparing its results with the Rainfall Depth-Duration method (RDD), due to its wide application in Brazil [11] and the availability of its application in the same stations where new IDF equations were established via the RDD method. Therefore, the two methods that configured the estimated data (Ei) were evaluated: TMDP, using the t c d , T of the nearest support station, and RDD, applied with the disaggregation coefficients (dc) from Table 1, which are the most widely used in Brazil [16].
The reference data was from the IDF equations of each location made from observed sub-daily precipitation data. The local IDF equation (using the parameters K, a, b, and c) was applied for each duration (d) and return period (T), to obtain the average maximum intensity for each d and T I I D F   d , T . The estimates of I I D F   d , T at each station of interest, obtained by the alternative methods (TMDP and RDD), were considered for comparison with the reference data, to verify the performance and applicability of these methods.
The equivalence between the estimated and the reference I I D F   d , T was performed using Student’s t-test for the intercept (β0) and angular coefficient (β1) parameters of the linear regression (Yj = β0 + β1Y1 + εi) between the data from the original IDF equations (Y1) and the maximum rainfall intensities estimated with the application of alternative methods (Yj): TMDP method ( I d , T ^   T M D P   ) and the RDD method ( I d , T ^   R C D D   ). The Student’s t-test was performed to test the null hypotheses (H0) that β1 = 1 and β0 = 0. When the regression line has an intercept equal to zero and an angular coefficient equal to 1, it passes through the origin (point: 0, 0), defining a line with 45°, which guarantees an equivalent rate of modification of Yj with the modification of Y1. Therefore, equivalence is assumed between the reference data and the estimated one.
In addition to equivalence, fit and error statistics such as root mean square error (RMSE, in mm/h), mean percentage error (MPE, in percentage), coefficient of determination (R2), and Kling–Gupta efficiency (KGE) were calculated. The hydroGOF package [32] was used to obtain the fit statistics and error indices through the gof function in the R environment [33]. The RMSE, MPE, R2, and KGE equations are available in Equations (4), (5), (6), and (7), respectively, in which, n is the number of observations; Oi is the maximum intensity in the i-th reference observation; O ¯ is the average of the reference values of maximum precipitation intensity; Ei is the maximum intensity in the i-th observation estimated by each alternative method; E ¯ is the average of the estimated values of maximum precipitation intensity; r is the Pearson correlation coefficient; σ is the standard deviation; µ is the average of the simulation/bias term.
R M S E = n 1 i = 1 n ( O i E i ) 2
M P E = i = 1 n ( E i     O i ) O i n 100
R 2 = i = 1 n O i O ¯ ( E i E ¯ ) i = 1 n O i O ¯ 2 i = 1 j ( E i E ¯ 2 0 , 5
K G E = 1   r 1 2 + σ O i σ E i 1 2   + µ O i µ E i 1 2  
The performance parameters used aim to analyze the precision and accuracy of the estimates of I I D F   d , T by the proposed method and the most common alternative method. The R2 is a measure of precision (repeatability or reproducibility of results) and its values range from 0 to 1, and the closer to the unity, the greater the precision of the estimates. The KGE provides an interesting diagnostic decomposition of the Nash-Sutcliffe efficiency, facilitating the analysis of the relative importance of its different components: correlation, bias, and variability within hydrological modeling. The error indices (RMSE and MPE) indicate the magnitude of the errors on average, with the lowest values of these indices indicating a smaller deviation between observed and estimated data of I I D F   d , T .

3. Results and Discussion

3.1. t c d , T for Brazil

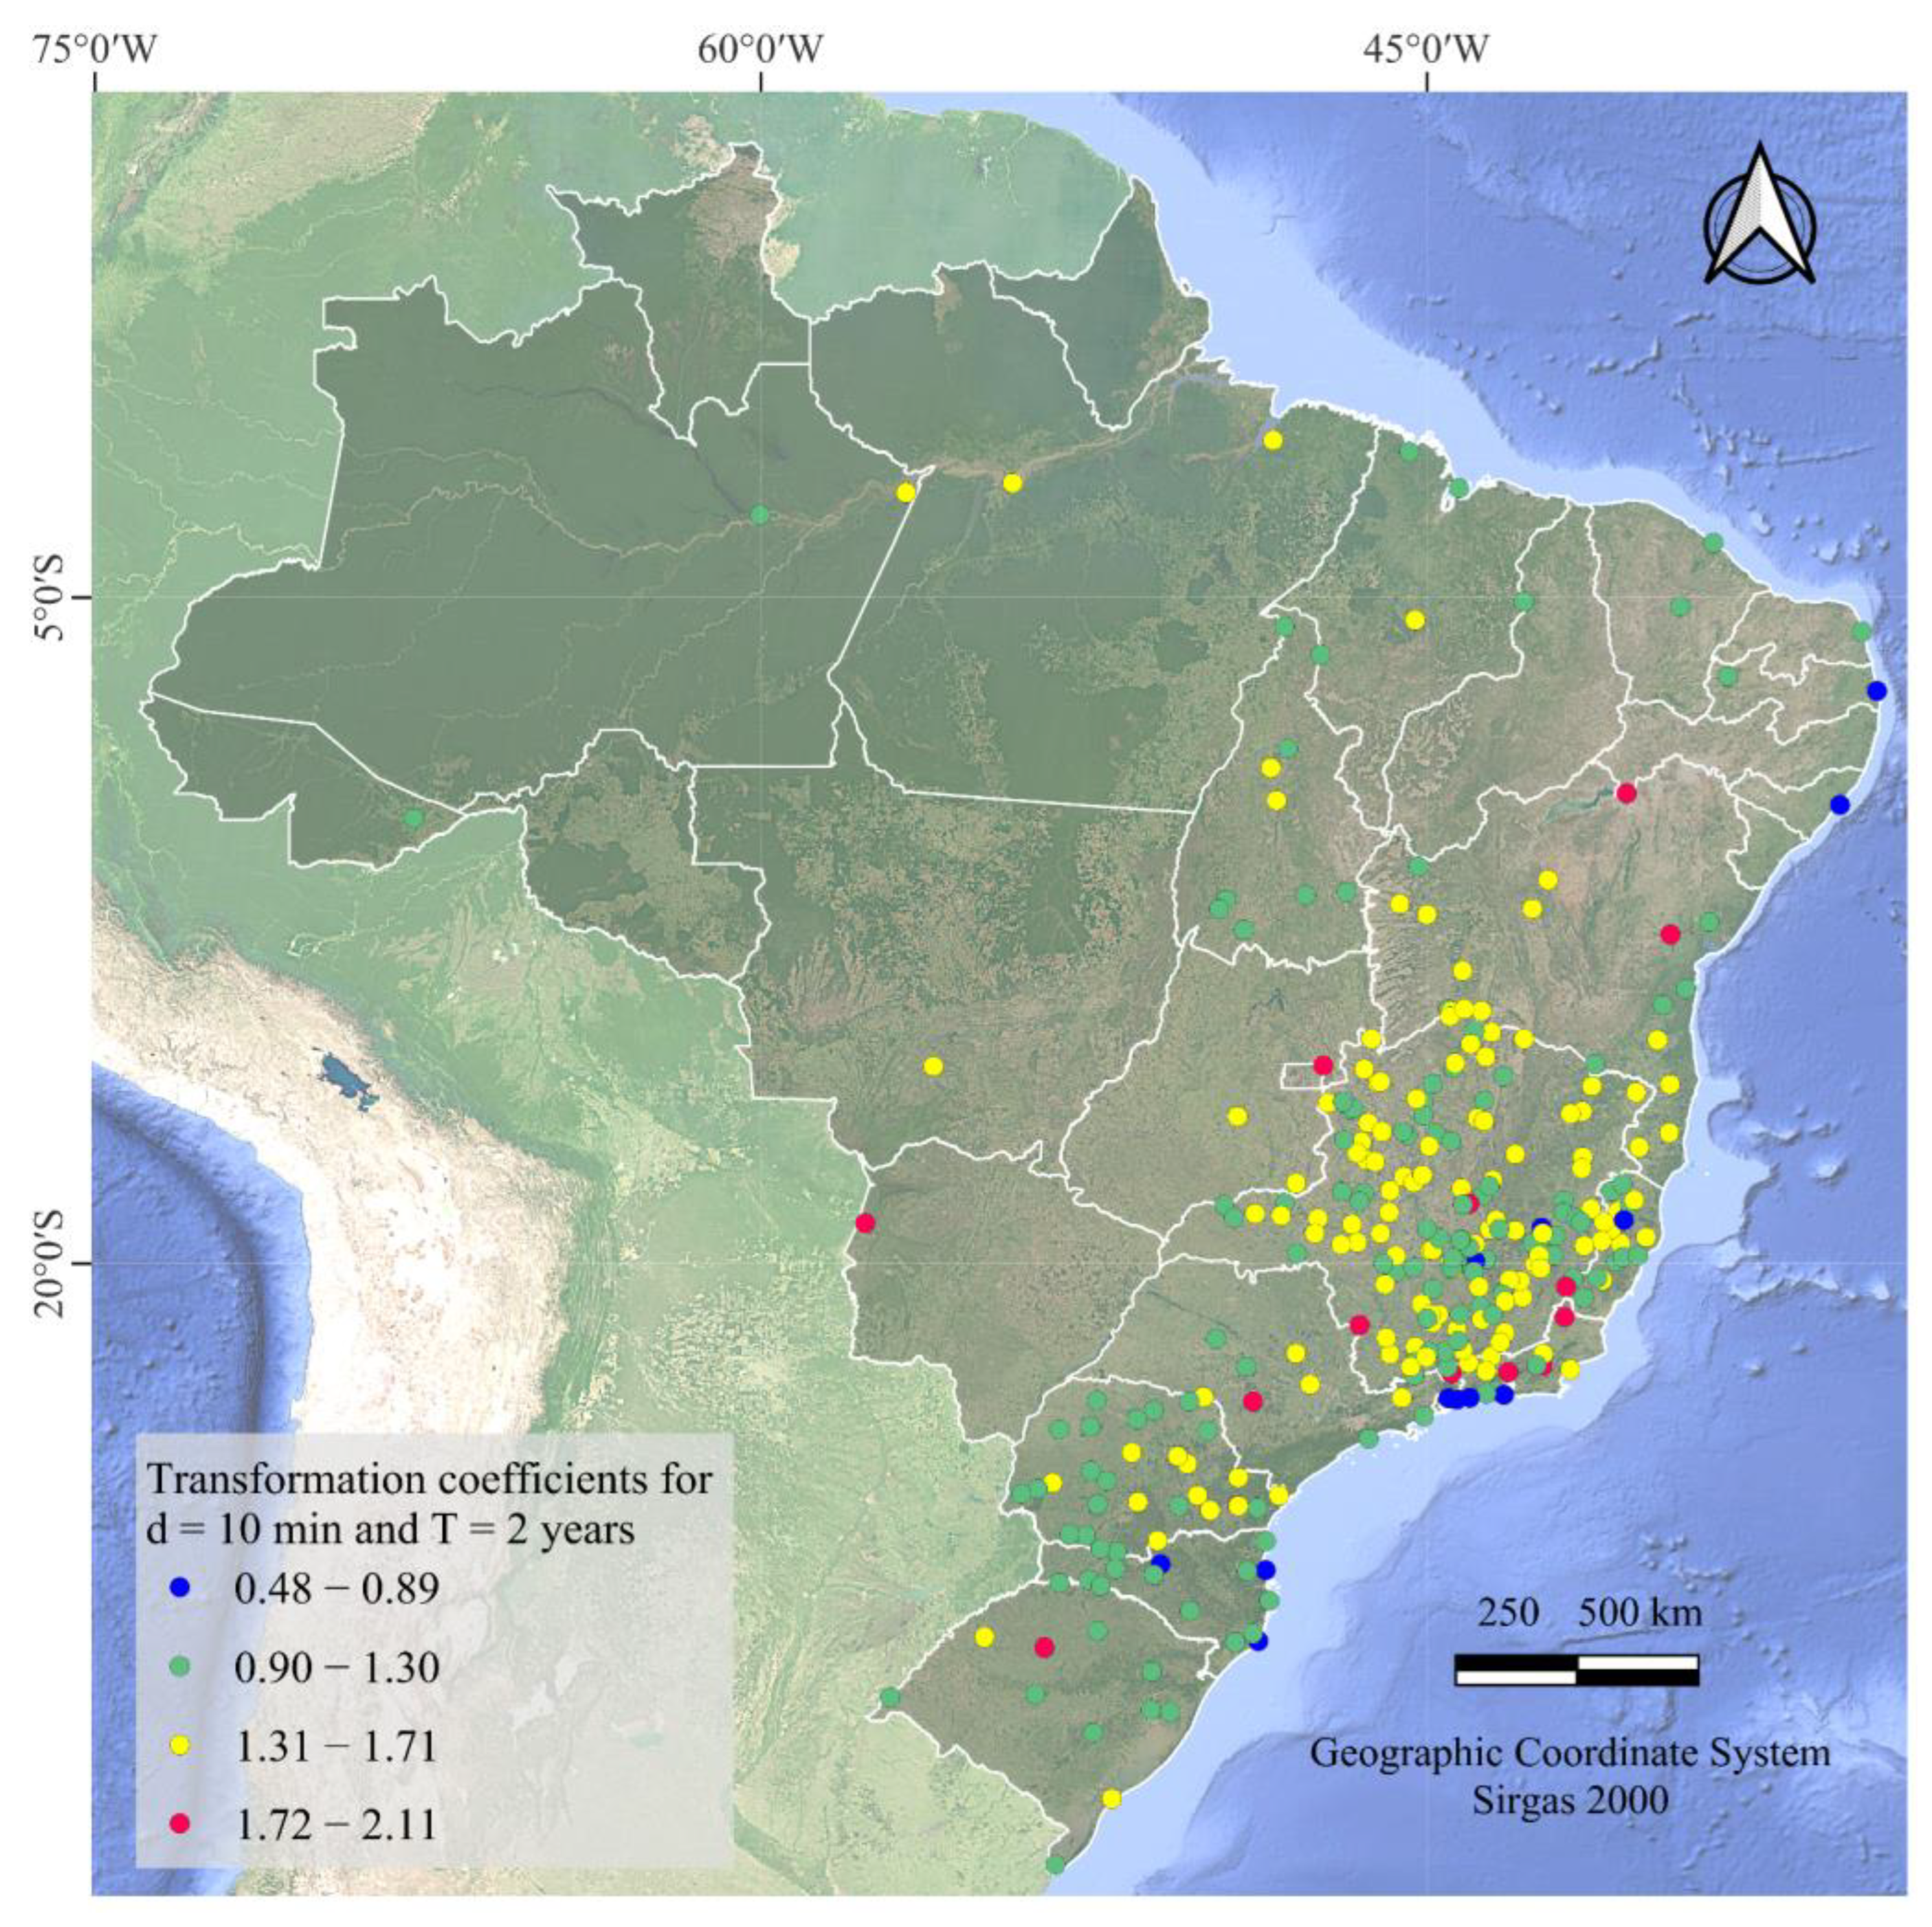
From 373 IDF equations available in the literature, the t c d , T was adjusted in 301 stations. In the remaining stations, there was no daily rainfall data series available coinciding with the period used to adjust the IDF equation as well as incomplete and gapped series. Therefore, in 72 stations, the method’s performance was not assessed. Figure 3 illustrates an example of the values of one of the 96 t c d , T adjusted for the transformation of maximum daily precipitation (in mm) into maximum rainfall intensity (mm/h), with a duration of 10 min and a return period of 2 years ( t c 10 , 2 ) .

3.2. Application of TMDP

3.2.1. hday,T Values

Regarding the PDFs used to establish hday,T, in 35% of the adjustments, GEV was the most suitable, followed by LN2 (33%), GUM (14%), G (10%), and LN3 (8%). As in the present study, GEV has also been showing better performance in other Brazilian locations [22,34,35], proving to be highly regarded in studies related to heavy rainfall.
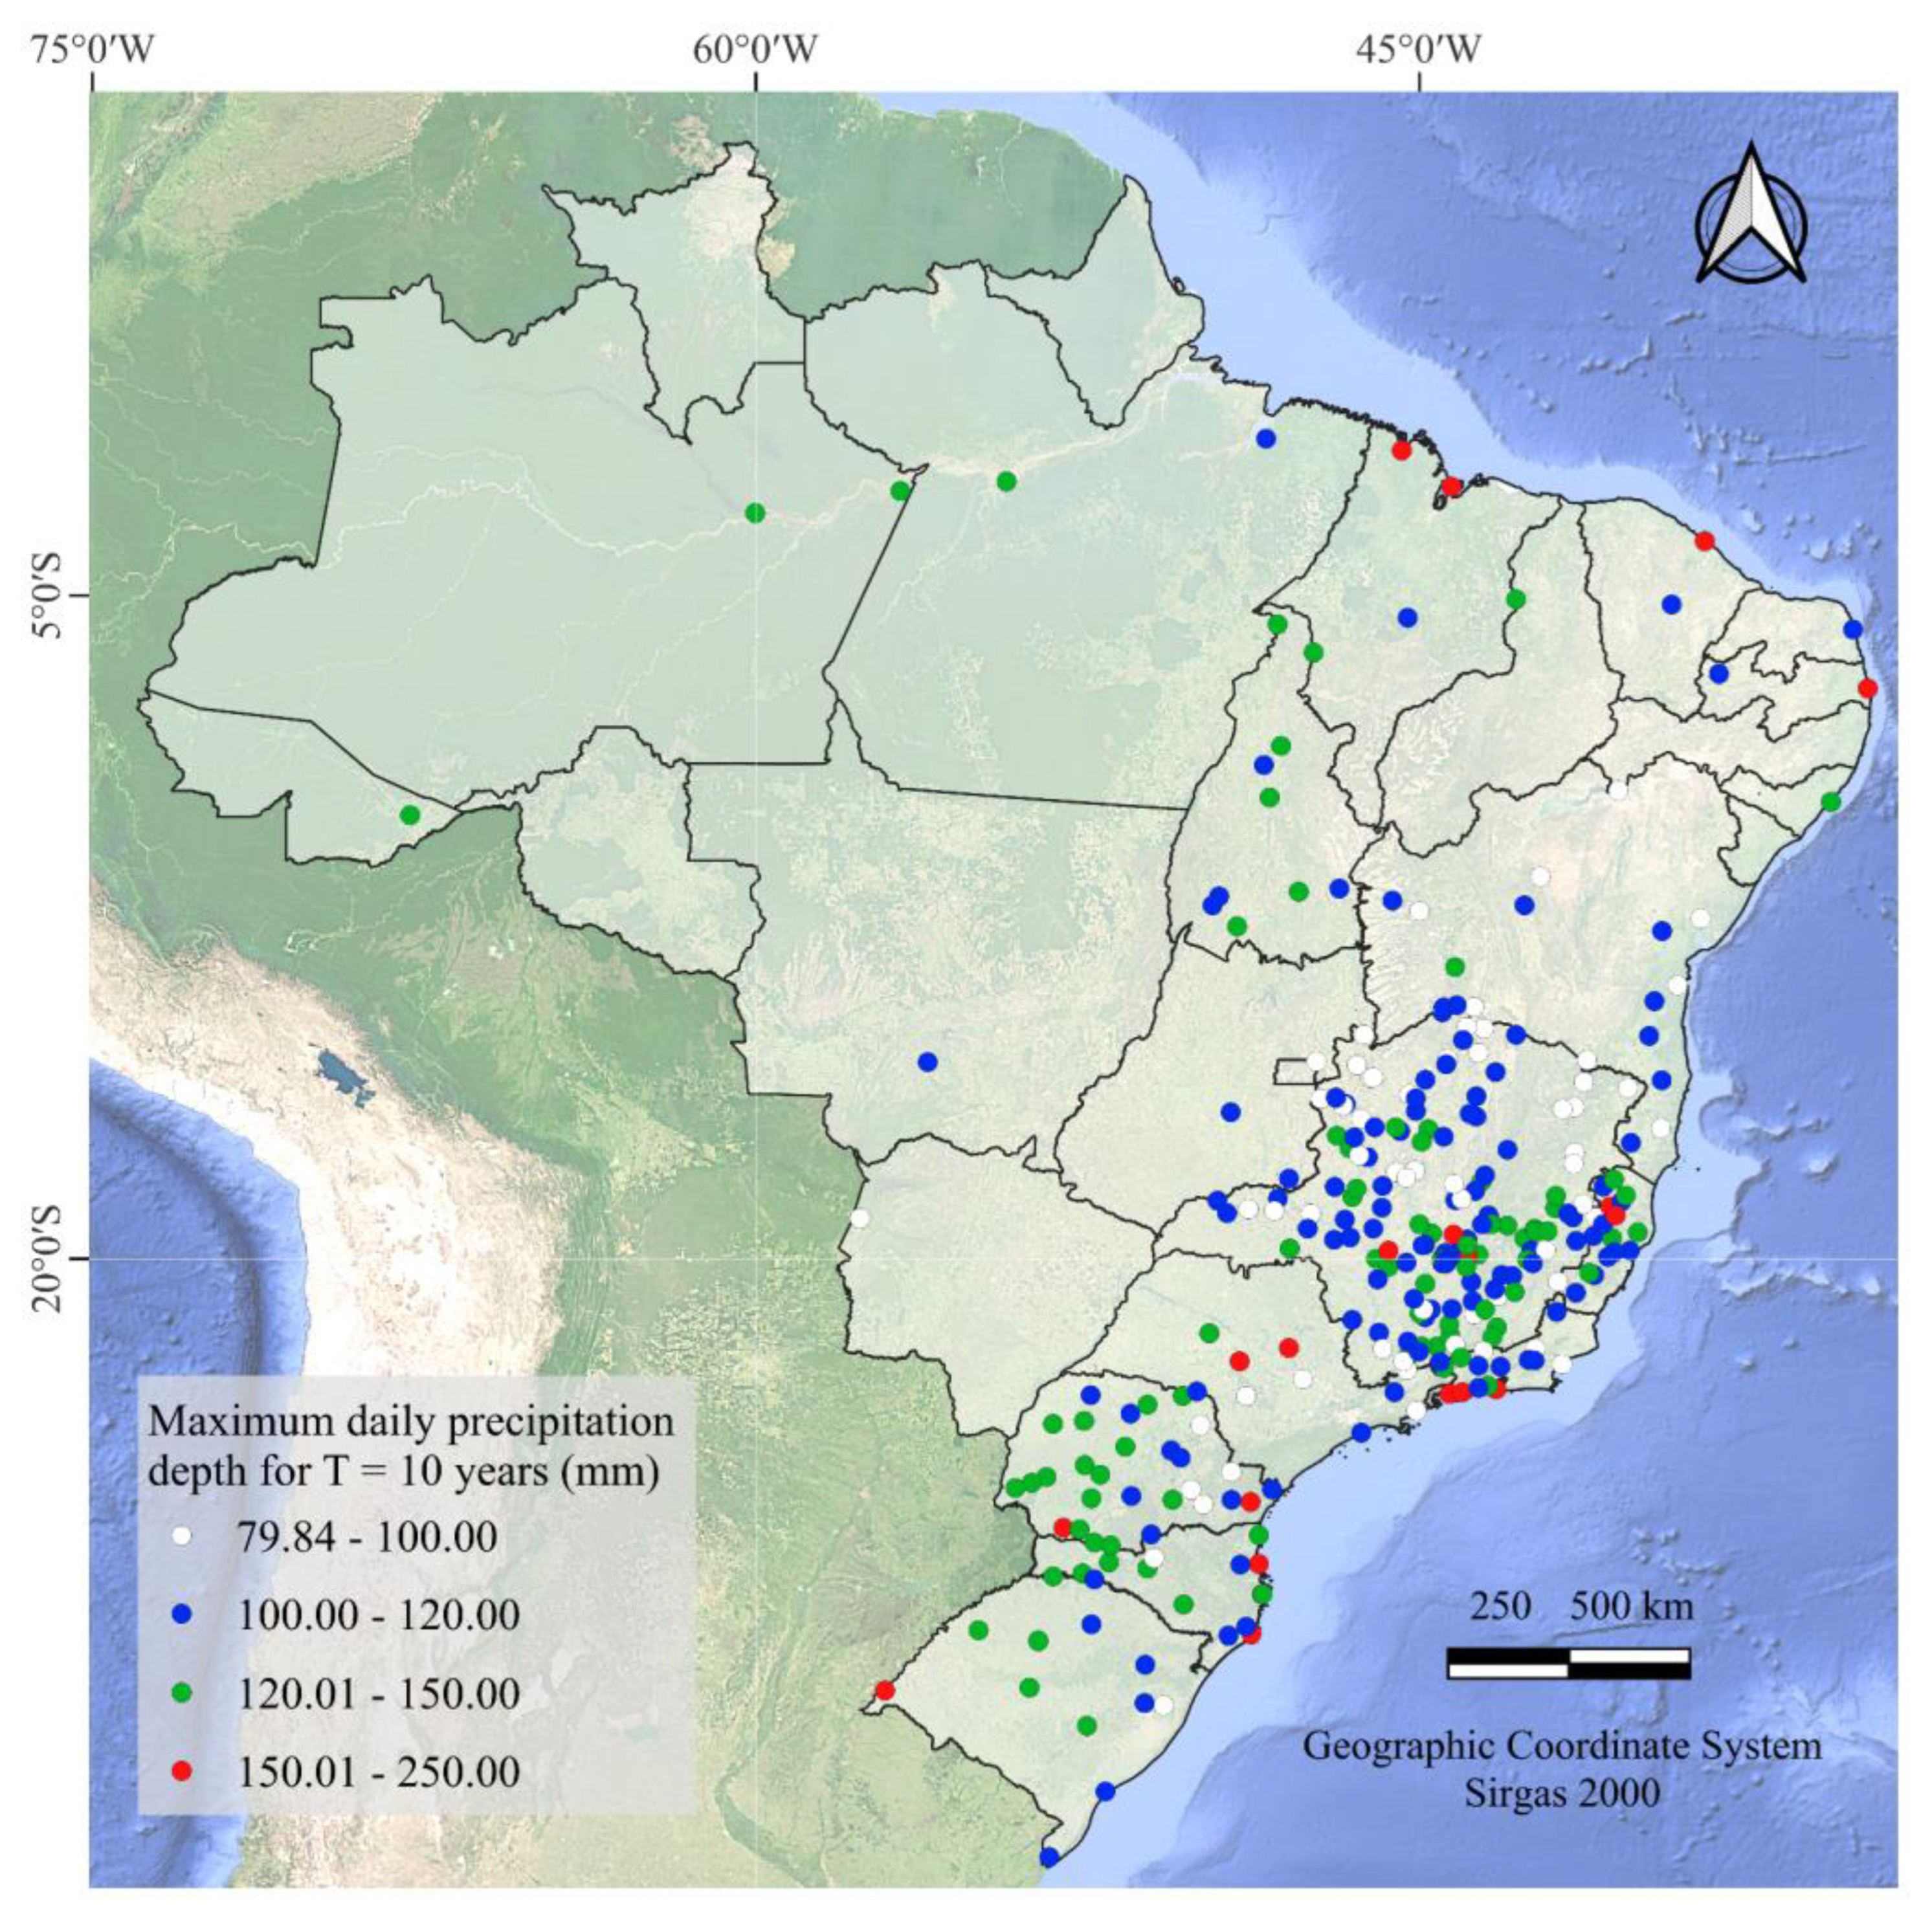
Figure 4 shows, as an example, only the magnitudes of the maximum daily precipitation h d a y , T related to the 10-year return period. h d a y , T of smaller magnitudes, for all combinations of d and T is found mainly in the Northeast Region, in the North of Minas Gerais, and in the Central-West Region. The Brazilian Northeast has semi-arid regions caused by cyclonic air vortices due to the interplateau relief (which hinders the circulation of moist air masses), high temperatures, and low air humidity [36], justifying the lower values. The North of Minas Gerais and the Central-West region have low rainfall rates and higher temperatures, with semi-arid and sub-humid regions [37,38].
Despite the absence of a well-defined spatial pattern, the largest h d a y , T   are mainly in much of the coastal strip in the Southeast Region and the extreme south (Figure 4). The orographic effect in mountain ranges with orientation parallel to the coast, such as the Serra do Mar, allows the occurrence of orographic effects in the coastal strip facing the Atlantic Ocean, increasing the probability of extreme events associated with ocean humidity [35]. The coastal region of the Northeast presents larger rainfall volumes [39], with rainfall better distributed spatially in the states to the north of the region, such as Piauí and Maranhão [36], and the precipitation is related to the intertropical convergence zone, anticyclones, and frontal systems.
In the Southeast region, high magnitudes of h d a y , T happen close to large urban centers such as São Paulo and Belo Horizonte, causing increasingly frequent flooding [40]. In the metropolis of São Paulo, extreme rainfall events are linked to the heat island effect and the local influx of sea breezes [41]. Belo Horizonte suffered great losses caused by the extreme rainfall of 2020, which was attributed to climate change induced by human actions [42].
The extreme south of the country is influenced by mesoscale convective events, formed in part of southern Brazil during the spring, summer, and autumn months, and cold fronts, which are responsible for the occurrence of strong storms, with gusts of wind and highly concentrated rainfall [43].
Furthermore, climate change studies project that rainfall will be increasingly concentrated in the rainy season, and the dry season will increase in regions with well-defined seasons (rainy and dry) [40]. The reduction in projected rainfall occurs mainly in the semi-arid region and its surroundings, reaching a reduction of up to 12% [44]. The increase in maximum daily precipitation is observed in the coastal strip and has already reached around 30% in São Paulo [40,45], due to the associated effects of climate change, urbanization [40], growth of the urban heat island, and air pollution [45].

3.2.2. TMDP and RDD Performances

From the 301 stations analyzed, only 293 (Figure 2 and Figure 3) were able to adjust the IDF equation using the assessed TMDP method. In 8 stations, the adjustment was not performed for one of the following reasons: some data series used to adjust the IDF equation were short; the supporting t c   d , T was not representative in predicting maximum rainfall at these stations, making it impossible to adjust the IDF curve. Alternative methods to the use of sub-daily series do not replace the need for a density of rainfall measurement stations with consistent series [16]. The stations without equation adjustment are mostly in regions with low or medium station density.
The equivalence hypothesis (1:1 relationship) between the results of the reference equations and those adjusted by the TMDP and RDD methods was rejected for the vast majority of stations (98%). Therefore, the equations adjusted by the methods are statistically different from the original IDF equations. This pattern was also observed in Minas Gerais when applying RDD [16].
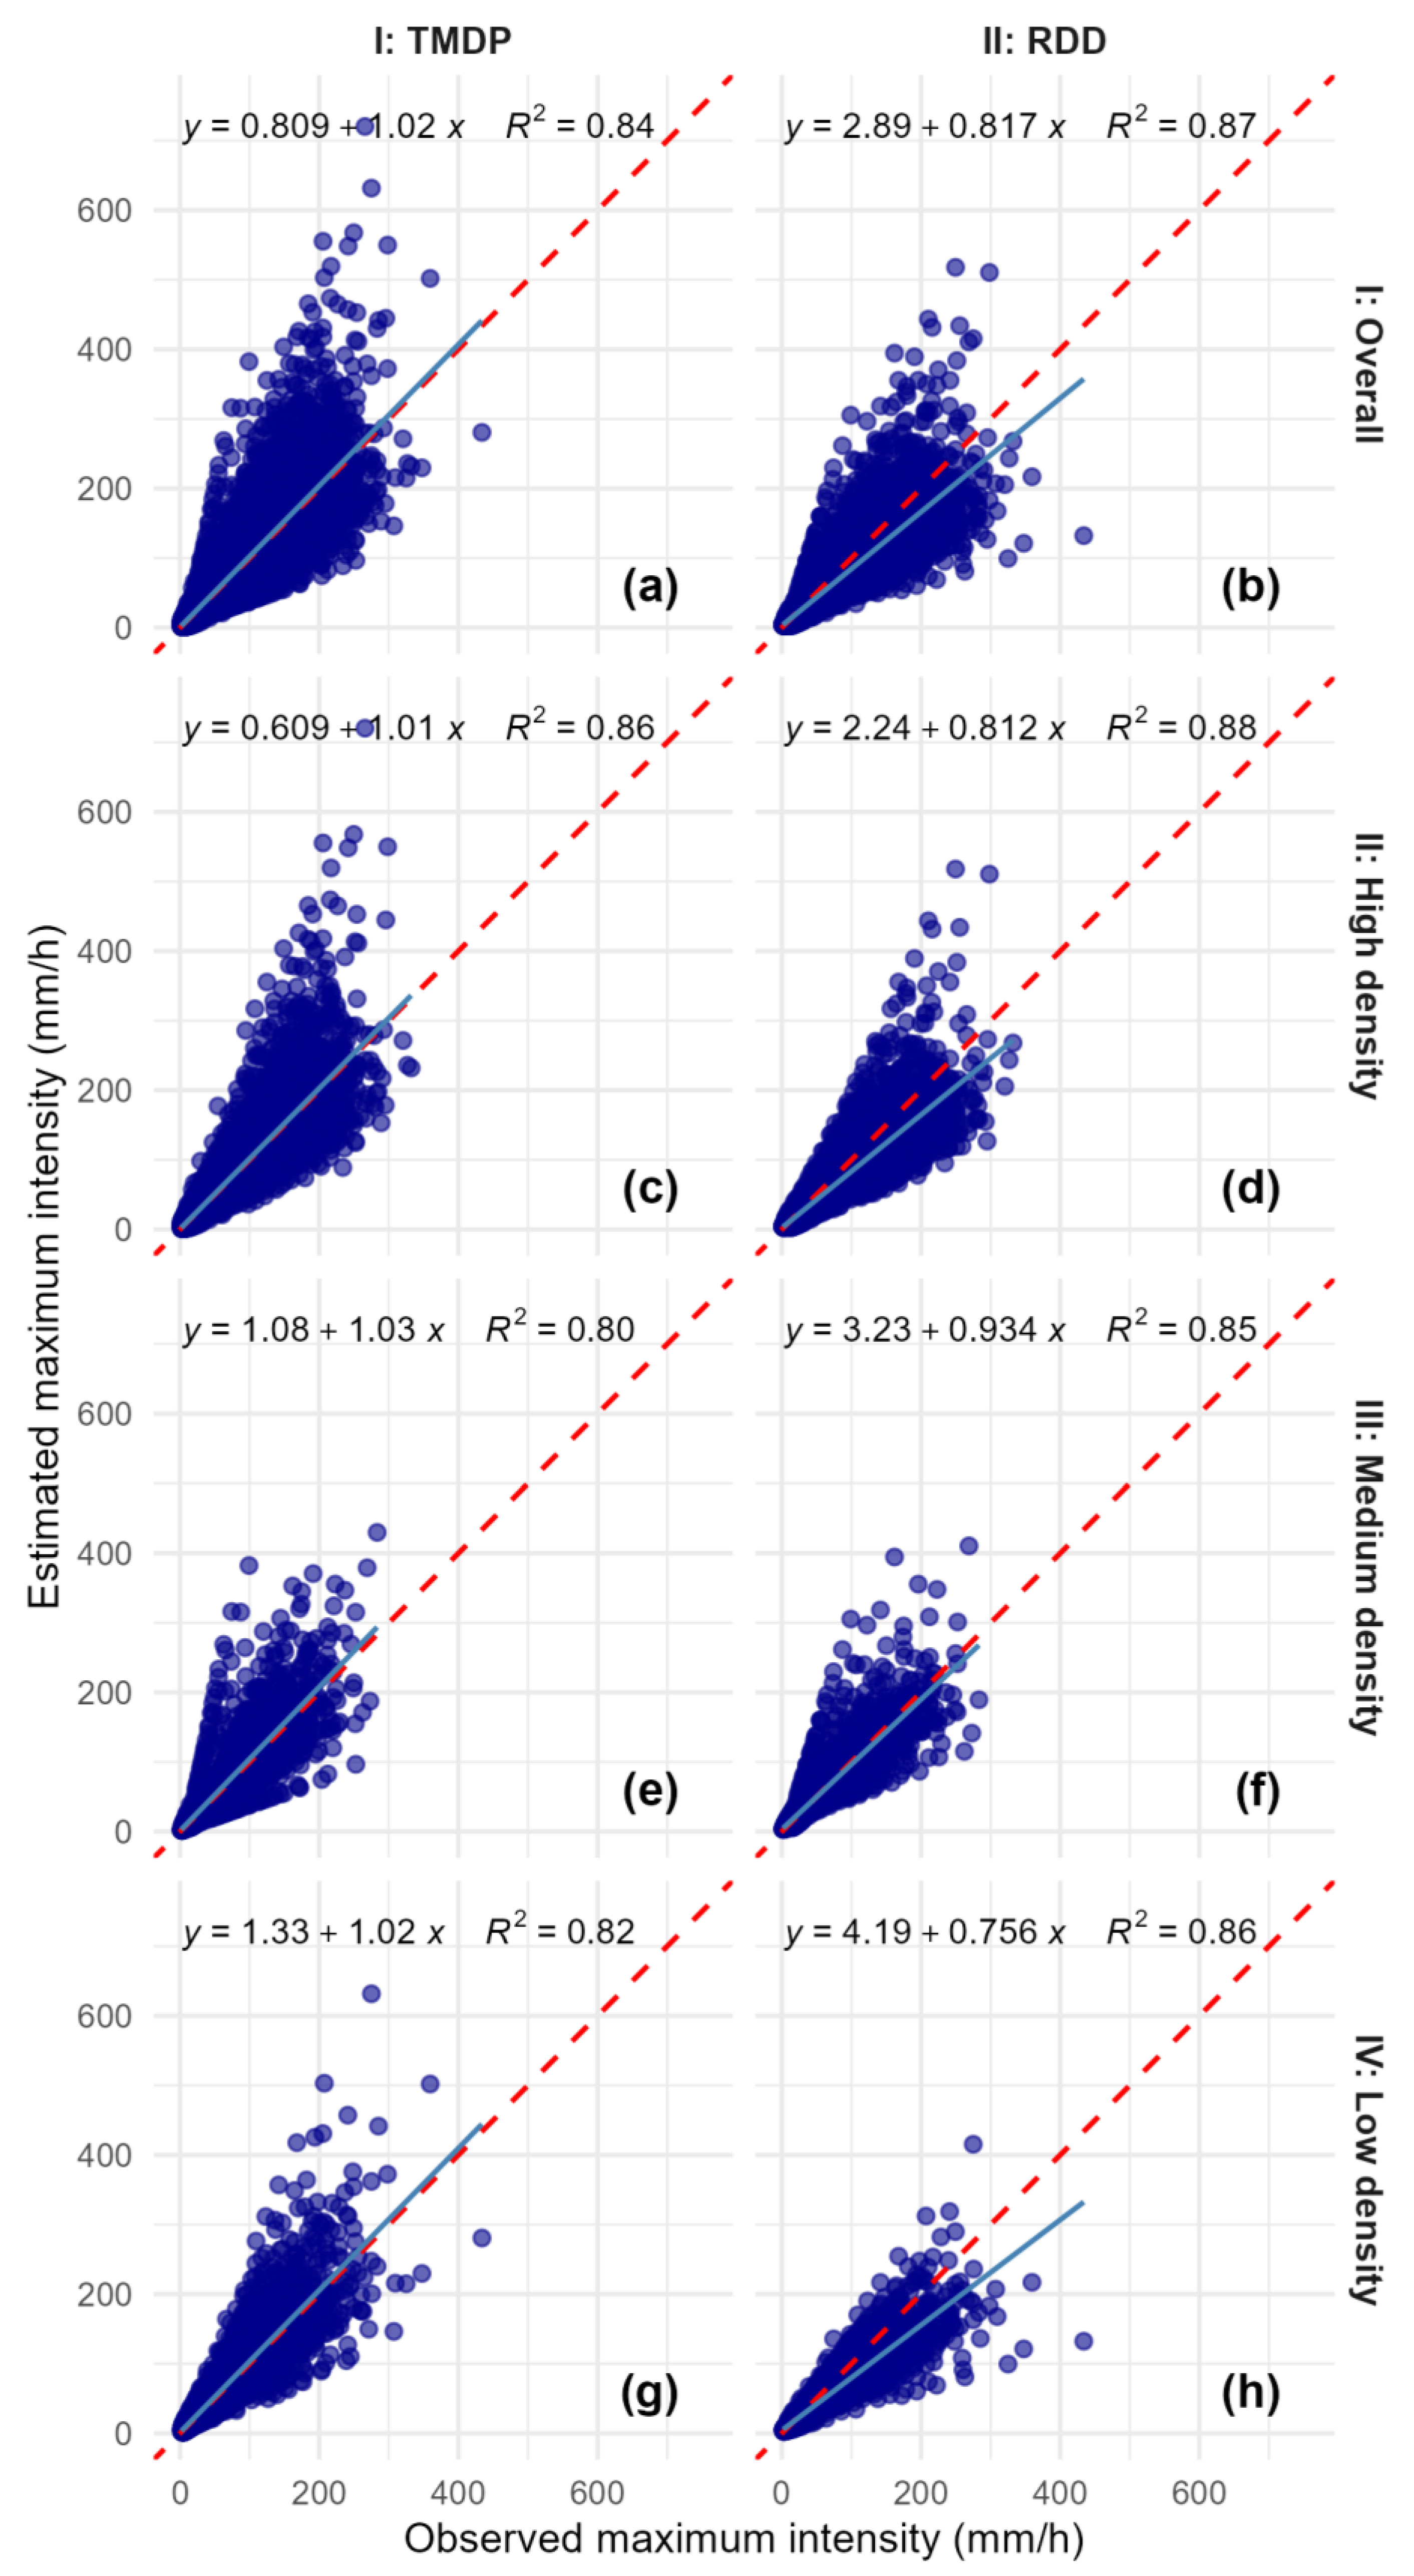
Figure 5 shows the scatter plots between the maximum rainfall intensity values observed and estimated using the IDF equations established by the two methods. The stations are grouped as a whole (Figure 5a,b) and within each station density class: HD (Figure 5c,d), MD (Figure 5e,f), and LD (Figure 5g,h). It can be observed that the slope line is closer to unity for TMDP in all situations (general analysis and by region of application). In the HD (Figure 5c,d) and LD (Figure 5g,h) regions, these were practically equal to unity for the TMDP method, demonstrating the superiority of TMDP over RDD. The data dispersion (R2) was similar for both methods.
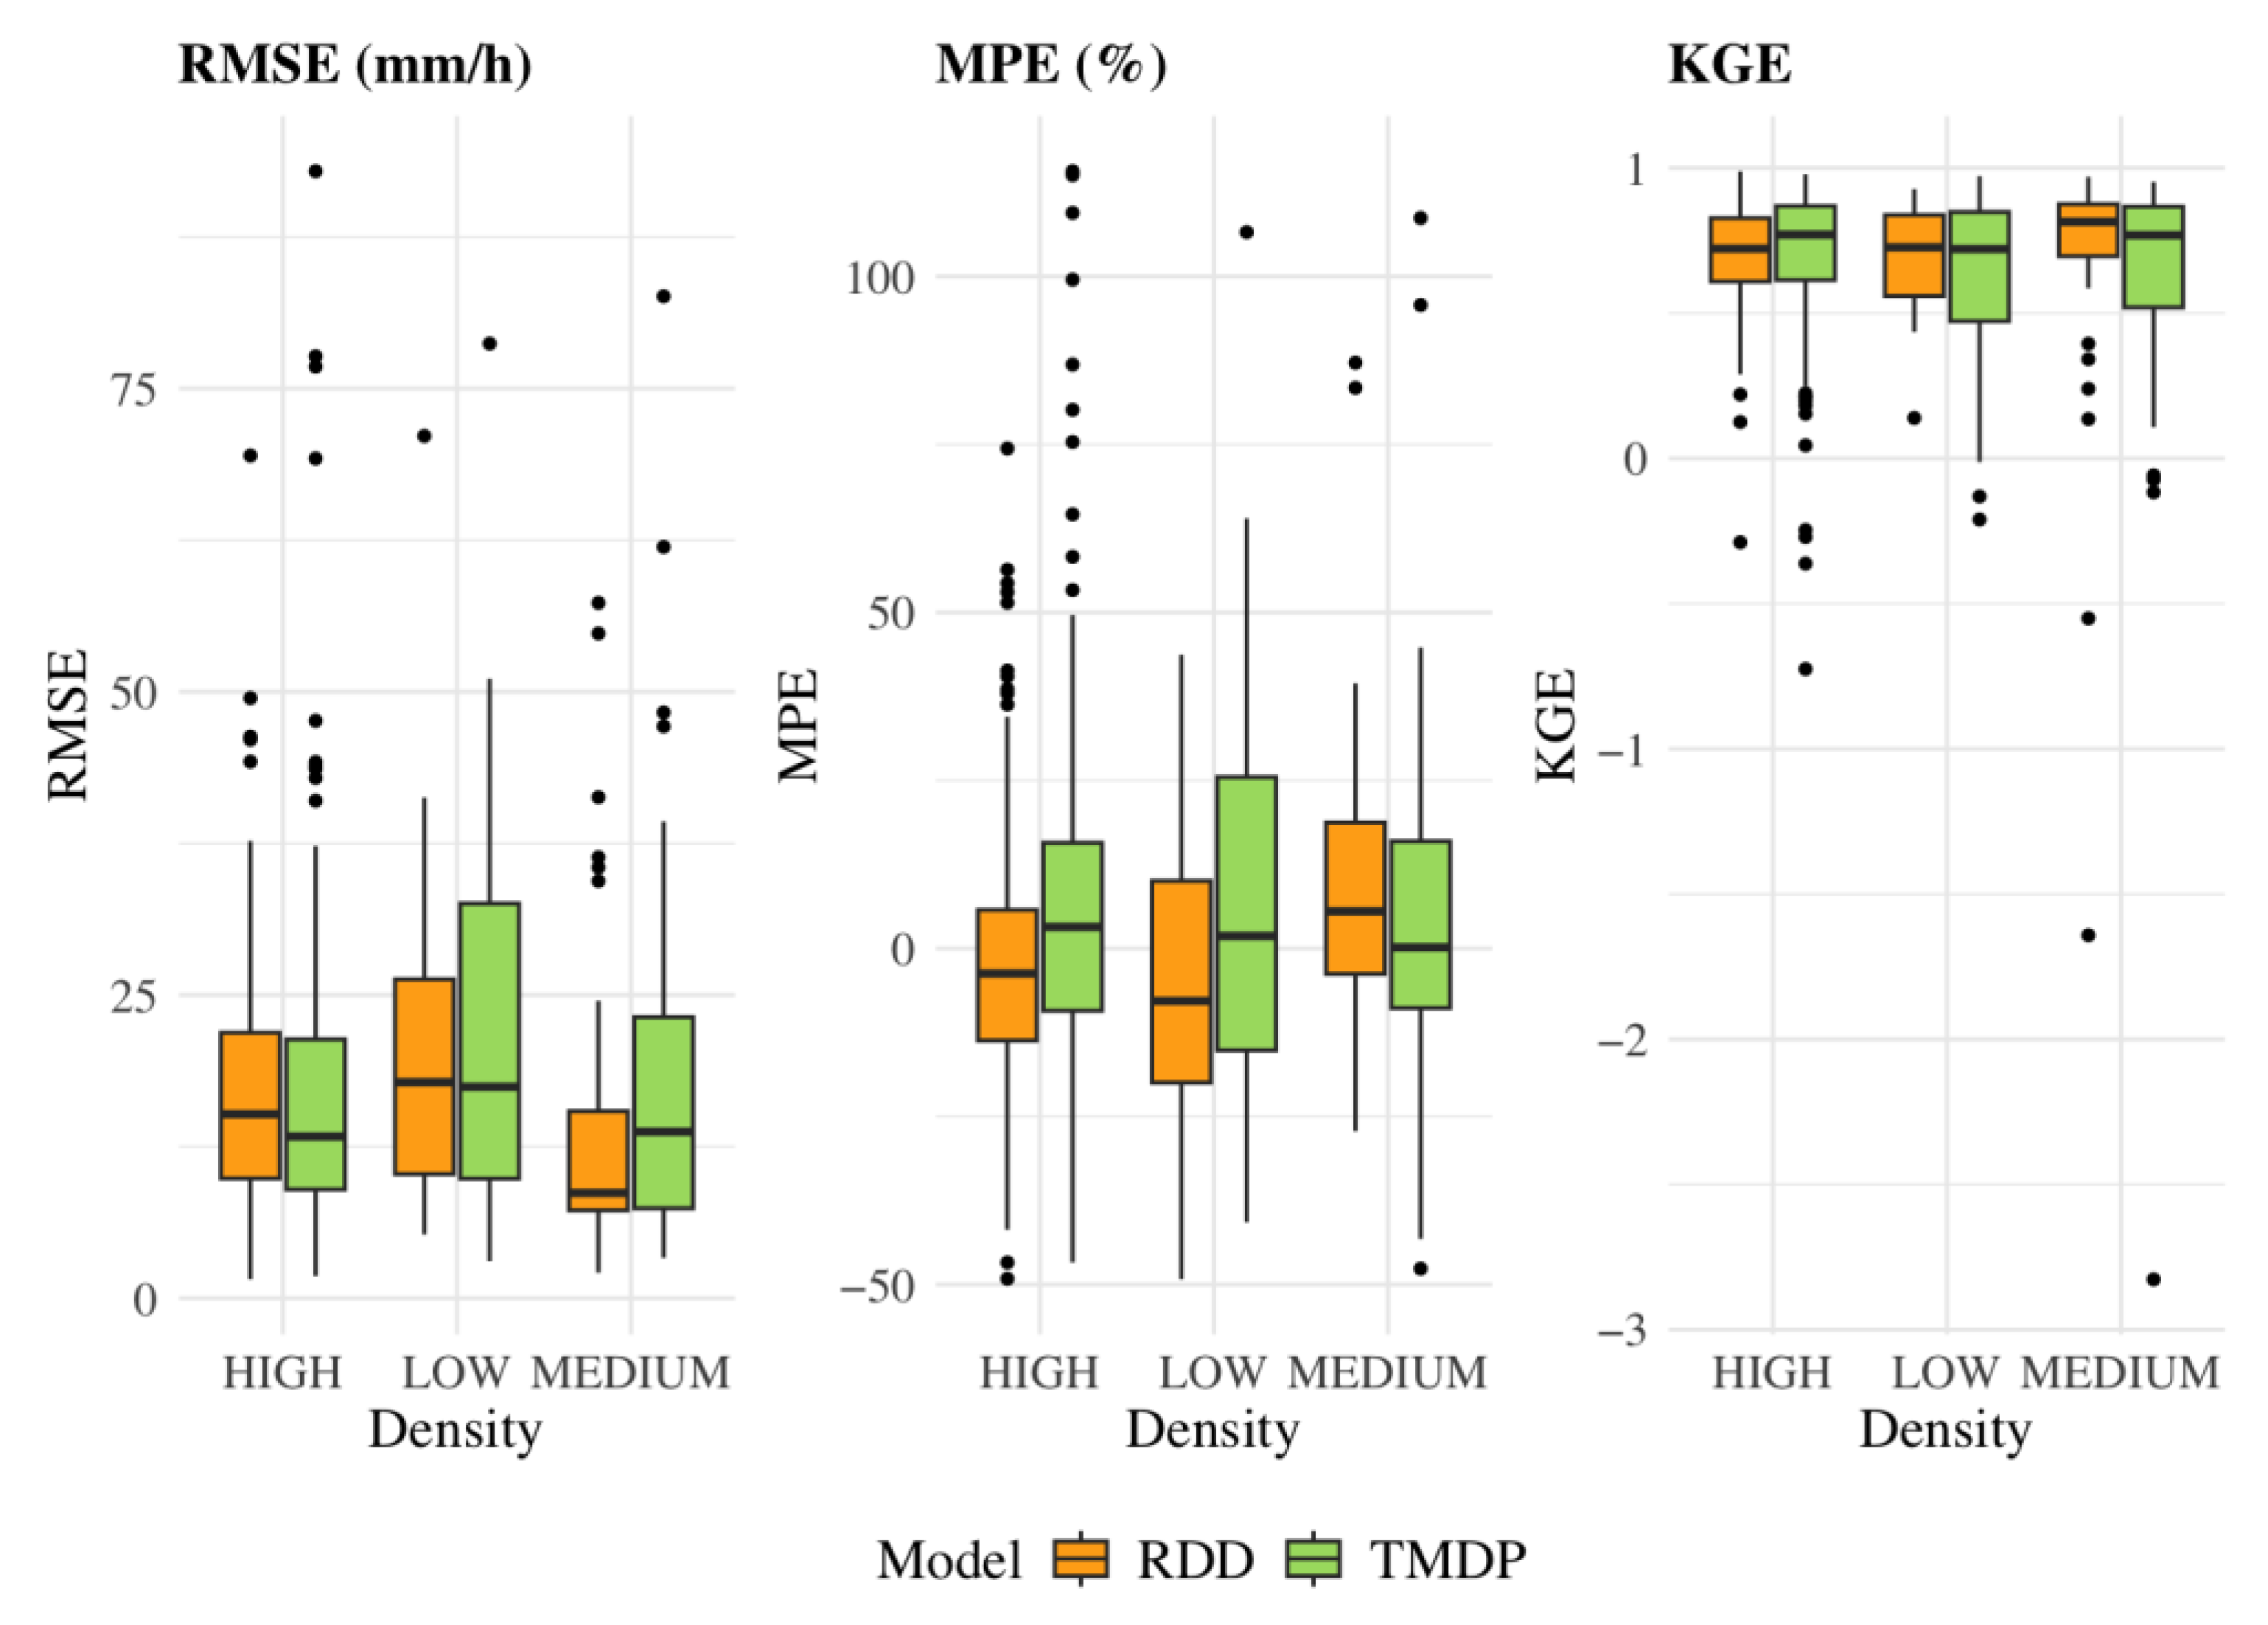
The results of the indices of performance are shown in the notched box plots in Figure 6. Overall, the two methods (TMDP and RDD) perform similarly. The RMSE and MPE were very close among the alternative methods, with notched overlapping for most regions (except for the RMSE of the MD region). The RMSE, for instance, varied from 1 to 90 mm h−1, with an approximate average of 17 mm h−1. The TMDP performed slightly better than the RDD, according to the KGE, due to values closer to unity. Comparatively, the TMDP method had better overall performance. Also, in HD regions, the TMDP, compared to the RDD, the notches of the two box plots do not overlap, showing higher values for the TMDP. Regarding the regional behavior, both performed very similarly in the LD region, which is considered critical regarding the need for information on heavy rainfall. The better performance of TMDP in the HD region indicates a greater spatial dependence of the method’s data for the transformation of maximum daily precipitation. The RDD had a slightly better performance in the MD region, possibly because the relations of the precipitation depths were more suitable for disaggregating the maximum annual daily precipitation layer. The relations of precipitation depths of different durations vary less across seasons. Also, the dc used in the RDD was established using mostly data from the Southeast region, especially from São Paulo [12], which may justify its better performance in the MD region.
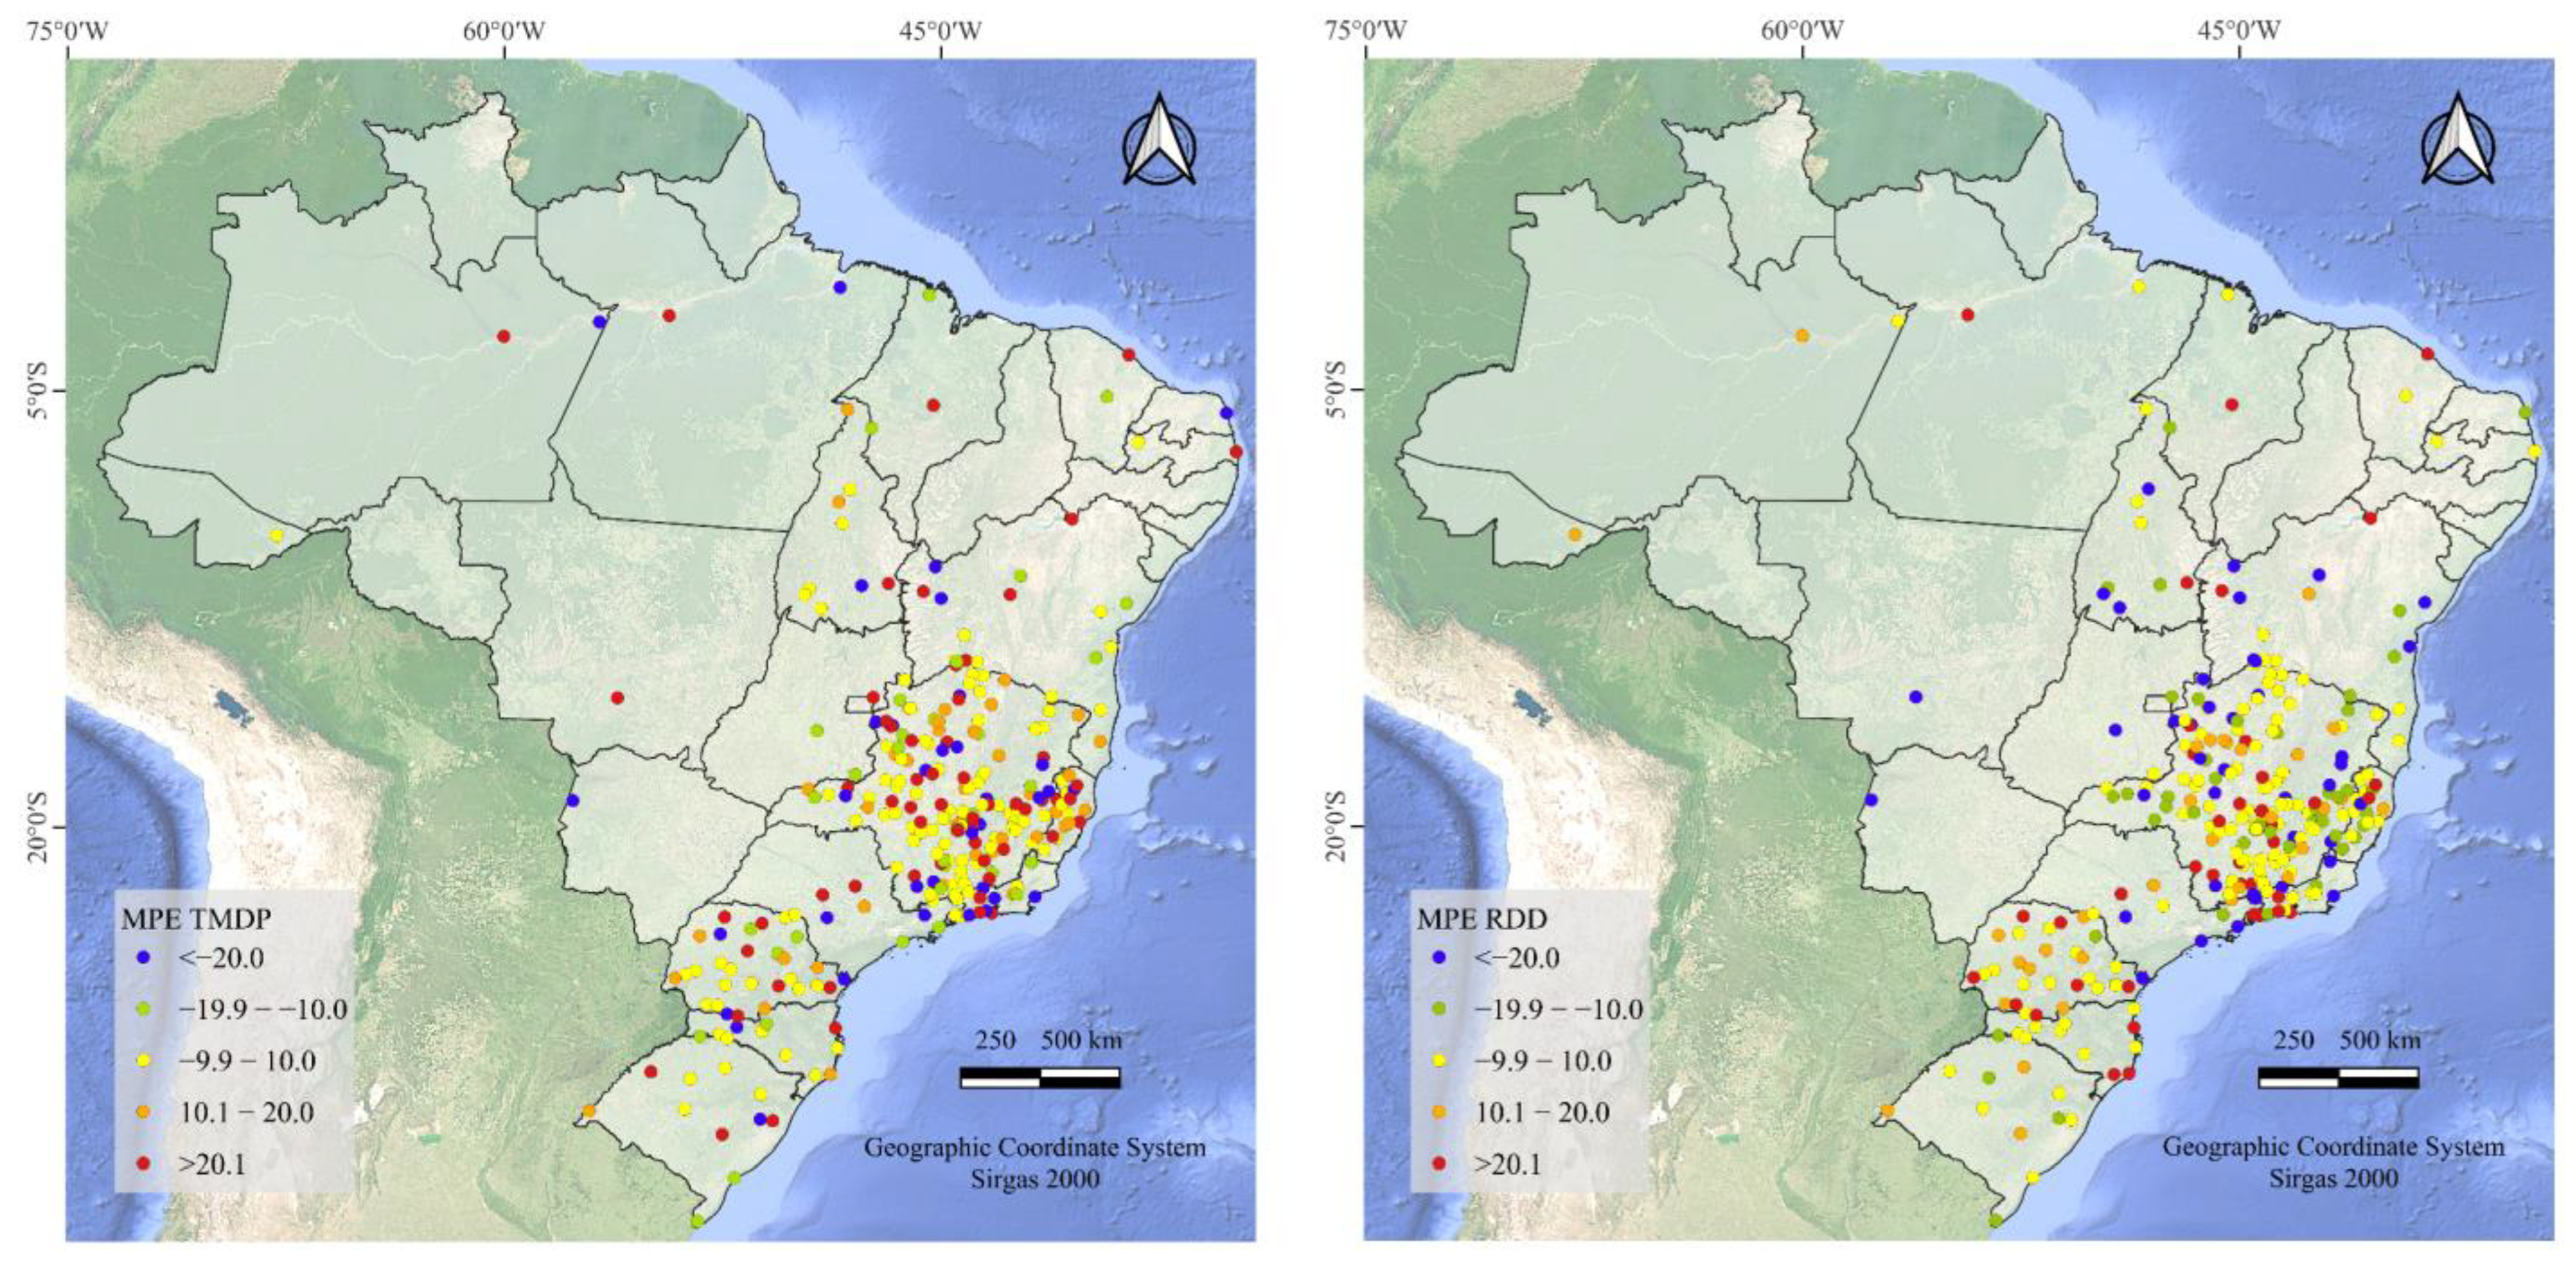
The spatial analysis of the MPE (Figure 7) confirms the similarity between the TMDP and the RDD, with values ranging from −51 to 120%. MPE magnitudes between 6 and 70% were also found in other studies by [13,16,46] when evaluating the equations established with the RDD. Both methods overestimated and underestimated maximum intensities compared to the original IDF. The RDD method’s errors are usually negative, therefore representing a tendency towards underestimation of this method. In the TMDP, overestimation tendencies were predominant, as shown by the MPE (Figure 6) and the regressions (Figure 5). The underestimation of I d , T ^ , mostly due to RDD, is a restriction that must be addressed when using equations established by this method. This is because the design rainfall will be reduced and, consequently, the safety of large-scale hydraulic works, such as structures for flood control and/or water storage, will be reduced. This can be accomplished by adopting a longer return period [13].
Although subtle, the better performance of the proposed methodology (TMDP), especially in places with a high density of data on heavy rainfall (HD region), is likely due to a greater “possibility” that both the support and interest stations have similar patterns of heavy rainfall as a result of their proximity. In a way, this corroborates the initial premise of the TMDP method better representing the regional reality of heavy rainfall with the use of tc. In the LD region, the distance among the stations is greater and the possibility of alternative stations is reduced; consequently, this subjects the region to great differences in the characteristics of heavy rainfall in each station. Considering the great spatial variability of heavy rainfall, and its isolated eventuality [20,21,47], predicting this climate variable becomes quite hard with low information density and information that is very spatially distant from each other.
Another reason for TMDP performing better than RDD is the return period considered when establishing tc. Studies show that applying RDD without considering T can lead to worse estimates of I d , T ^ [14,16]. Figure 8 presents, for a specific return period, the relationship between rainfall intensities and their duration changes for different locations. When RDD is used to establish the equations, this relationship is kept the same regardless of the location, resulting in IDF curves that differ only in the magnitude of the events, that is, they are parallel to each other. Applying TMDP minimizes this error, resulting in curves that maintain the local specificities of the behavior of rainfall intensities as a function of their duration.
Among other advantages of the TMDP method, the tc directly transforms the maximum daily precipitation into maximum rainfall intensity associated with sub-daily durations, i.e., direct and easy application. The transformation coefficients are also not applied using the cascade effect of RDD, which potentially reduces estimation errors.
Even though small, the proposed TMDP method showed improvements compared to the RDD method. Furthermore, for this work to be even more applicable, and to corroborate the reliability of its application, it is recommended to continually define hydrologically homogeneous areas for each tc, since they have similar extreme rainfall patterns across seasons [8,14]. The estimation of extreme rainfall events plays a pivotal role in the design and safety assessment of hydraulic structures. Traditional IDF equations derived from long-term pluviographic records are often considered the most reliable source of input data for such purposes [11]. The estimation of IDF equations through alternative methods poses inherent challenges, as statistical equivalence between models derived from pluviographic records and those obtained from alternative approaches is rarely observed. Such dissonance stems from the limited availability of rainfall data and the complex dynamics governing extreme precipitation processes, particularly due to the pronounced spatial and temporal variability [16,22,40]. While these alternative approaches expand spatial coverage, the TMDP often tends to overestimate rainfall intensities when compared to local observational data. From a conservative engineering perspective, such overestimation may be perceived as a safety-enhancing factor. Nevertheless, systematic overestimation can lead to unnecessarily oversized infrastructure, resulting in inflated construction and maintenance costs, as well as potential inefficiencies in resource allocation. This raises the question of proportionality between the safety margin and the economic feasibility of the project. One pragmatic solution proposed in the literature is the adjustment of the design return period when using alternative estimation methods. The implementation of this adjustment requires a prior and rigorous assessment of potential systematic errors associated with the proposed estimation methods, as such biases directly influence the reliability and applicability of the adjusted design parameters [13].
Regionalization based on hydrometeorological information, for example, can help to identify regions with similar characteristics of intense rainfall [48], which can reduce statistical errors. Future studies testing the proposed method may benefit from incorporating cluster analysis that extends beyond the mere geographical proximity of rain gauges, thereby evaluating the potential similarity in terms of extreme rainfall or broader climatic characteristics. Although the ideal scenario for such an approach involves the use of time series that are temporally consistent and comparable in length, this is not possible in the Brazilian scenario. This condition is essential to mitigate the risk of identifying dissimilarities that stem solely from temporal inconsistencies rather than genuine differences in rainfall behavior. Addressing these considerations could enhance the robustness and applicability of the method across diverse climatic and spatial contexts. Anyway, some studies have demonstrated a similarity in the magnitudes of extreme rainfall events associated with geographical proximity, which may explain the promising performance of the proposed method [28,41].

4. Conclusions

The method proposed in this work, entitled Transformation of the maximum daily precipitation layer (TMDP), was shown to be capable of transforming the maximum daily precipitation layer into maximum sub-daily rainfall intensities. To this end, it was based on the use of known intense rainfall equations and the maximum daily precipitation depths to establish transformation coefficients associated with different durations and return periods ( t c d , T ).
By applying TMDP to Brazil, it was possible to adjust 301 t c d , T obtained from rainfall stations with a known IDF equation. The performance of TMDP was evaluated by establishing IDF equations using the closest station as a support station for locations that already have an IDF. Its performance was also compared to the disaggregation method Rainfall Depth-Duration (RDD), the most widely used in Brazil.
The results showed that TMDP and RDD showed similar errors in the estimation of the average maximum rainfall intensity, ranging from 1 to 90 mm h−1, and averages of 17 mm h−1. TMDP was better in the global analysis and, especially, in the regions with the highest density of IDF equations.

Author Contributions

Conceptualization, R.A.C. and L.T.d.A.; methodology, L.T.d.A., R.A.C., M.C.A. and I.P.T.; validation, L.T.d.A. and I.P.T.; formal analysis, L.T.d.A., R.A.C., M.C.A. and I.P.T.; writing—original draft preparation, L.T.d.A., R.A.C., M.C.A. and I.P.T.; writing—review and editing, L.T.d.A., R.A.C., M.C.A. and I.P.T.; visualization, L.T.d.A. and I.P.T.; supervision, R.A.C.; funding acquisition, R.A.C. All authors have read and agreed to the published version of the manuscript.

Funding

This research was funded by the Coordenação de Aperfeiçoamento de Pessoal de Nível Superior—CAPES [grant number 001]; the Conselho Nacional de Desenvolvimento Científico e Tecnológico—CNPq [grant number 305262/2021–1]; and the Fundação de Amparo à Pesquisa e Inovação do Espírito Santo–FAPES [grant number 996/2022].

Data Availability Statement

The original contributions presented in this study are included in the article. Further inquiries can be directed to the corresponding author.

Conflicts of Interest

The authors declare no conflicts of interest.

References

  1. Moura Cardoso do Vale, T.; Helena Constantino Spyrides, M.; De Melo Barbosa Andrade, L.; Guedes Bezerra, B.; Evangelista da Silva, P. Subsistence Agriculture Productivity and Climate Extreme Events. Atmosphere 2020, 11, 1287. [Google Scholar] [CrossRef]
  2. Wang, J.; Zhang, Y.; Li, K.; Zhang, Z.; Chen, C. Gully Internal Erosion Triggered by a Prolonged Heavy Rainfall Event in the Tableland Region of China’s Loess Plateau. Int. Soil Water Conserv. Res. 2023, 11, 610–621. [Google Scholar] [CrossRef]
  3. Chhetri, T.B.; Dhital, Y.P.; Tandong, Y.; Devkota, L.P.; Dawadi, B. Observations of Heavy Rainfall and Extreme Flood Events over Banke-Bardiya Districts of Nepal in 2016–2017. Prog. Disaster Sci. 2020, 6, 100074. [Google Scholar] [CrossRef]
  4. Ma, S.; Shao, X.; Xu, C. Landslides Triggered by the 2016 Heavy Rainfall Event in Sanming, Fujian Province: Distribution Pattern Analysis and Spatio-Temporal Susceptibility Assessment. Remote Sens. 2023, 15, 2738. [Google Scholar] [CrossRef]
  5. Prokop, P.; Wiejaczka, Ł.; Sarkar, S.; Bryndal, T.; Bucała-Hrabia, A.; Kroczak, R.; Soja, R.; Płaczkowska, E. Morphological and Sedimentological Responses of Small Stream Channels to Extreme Rainfall and Land Use in the Darjeeling Himalayas. CATENA 2020, 188, 104444. [Google Scholar] [CrossRef]
  6. Fekete, A.; Sandholz, S. Here Comes the Flood, but Not Failure? Lessons to Learn after the Heavy Rain and Pluvial Floods in Germany 2021. Water 2021, 13, 3016. [Google Scholar] [CrossRef]
  7. Martel, J.-L.; Brissette, F.P.; Lucas-Picher, P.; Troin, M.; Arsenault, R. Climate Change and Rainfall Intensity–Duration–Frequency Curves: Overview of Science and Guidelines for Adaptation. J. Hydrol. Eng. 2021, 26, 03121001. [Google Scholar] [CrossRef]
  8. Yang, Z.; Burn, D.H. Automatic Feature Selection and Weighting for the Formation of Homogeneous Groups for Regional IDF Estimation. J. Hydrol. 2019, 575, 292–307. [Google Scholar] [CrossRef]
  9. Koutsoyiannis, D.; Kozonis, D.; Manetas, A. A Mathematical Framework for Studying Rainfall Intensity-Duration-Frequency Relationships. J. Hydrol. 1998, 206, 118–135. [Google Scholar] [CrossRef]
  10. World Meteorological Organization. Guide to Hydrological Practices: Hydrology from Measurement to Hydrological Information (WMO-No. 168); World Meteorological Organization: Geneva, Switzerland, 2008; ISBN 978-92-63-10168-6. [Google Scholar]
  11. Torres, I.P.; Cecílio, R.A.; de Almeida, L.T.; Abreu, M.C.; da Silva, D.D.; Zanetti, S.S.; Xavier, A.C. Rainfall Intensity–Duration–Frequency Curves Dataset for Brazil. Data 2025, 10, 17. [Google Scholar] [CrossRef]
  12. COMPANHIA DE TECNOLOGIA DE SANEAMENTO AMBIENTAL. Drenagem Urbana: Manual de Projeto, 3rd ed.; CETESB: São Paulo, Brazil, 1986.
  13. Carvalho Abreu, M.; Thebit de Almeida, L.; Bernardes Silva, F.; de Souza Fraga, M.; Bastos Lyra, G.; Souza, A.; da Silva, D.D.; Avelino Cecílio, R. Disaggregation Coefficients for Obtaining Rainfall Intensity-Duration-Frequency Curves: Concepts, Models, Errors and Trends in Minas Gerais, Brazil. Urban Water J. 2023, 20, 1647–1660. [Google Scholar] [CrossRef]
  14. Passos, J.B.d.M.C.; da Silva, D.D.; Lima, R.P.C. Daily Rainfall Disaggregation Coefficients for the Doce River Basin, Brazil: Regional Applicability and the Return Period Influence. Eng. Agrícola 2021, 41, 223–234. [Google Scholar] [CrossRef]
  15. de Bodas Terassi, P.M.; Pontes, P.R.M.; Xavier, A.C.F.; Cavalcante, R.B.L.; de Oliveira Serrão, E.A.; Sobral, B.S.; de Oliveira-Júnior, J.F.; de Melo, A.M.Q.; Baratto, J. A Comprehensive Analysis of Regional Disaggregation Coefficients and Intensity-Duration-Frequency Curves for the Itacaiúnas Watershed in the Eastern Brazilian Amazon. Theor. Appl. Climatol. 2023, 154, 863–880. [Google Scholar] [CrossRef]
  16. Abreu, M.C.; Cecílio, R.A.; Pruski, F.F.; de Almeida, L.T.; dos Santos, G.R.; Zanetti, S.S.; Pereira, S.B.; Silva, D.D. Daily Rainfall Disaggregation to Estimate the Intensity-Duration-Frequency Relationship in Minas Gerais State, Brazil. Braz. Arch. Biol. Technol. 2022, 65, e20210694. [Google Scholar] [CrossRef]
  17. Damé, R.d.C.F.; Teixeira-Gandra, C.F.A.; Villela, F.A.; dos Santos, J.P.; Winkler, A.S. Analysis of the Relationship Intensity, Duration, Frequency of Disaggregated Daily Rainfall in Southern Rio Grande Do Sul, Brazil. Eng. Agrícola 2014, 34, 660–670. [Google Scholar] [CrossRef]
  18. Back, Á.J.; Pola, A.C. Relações Entre Precipitações Intensas de Diferentes Durações de Videira, Santa Catarina. Tecnol. e Ambient. 2016, 22, 125–135. [Google Scholar] [CrossRef]
  19. Dorneles, V.R.; Damé, R.d.C.F.; Teixeira-Gandra, C.F.A.; Méllo, L.B.; Ramirez, M.A.A.; Manke, E.B. Intensity-Duration-Frequency Relationships of Rainfall through the Technique of Disaggregation of Daily Rainfall. Rev. Bras. Eng. Agrícola e Ambient. 2019, 23, 506–510. [Google Scholar] [CrossRef]
  20. dos Anjos, R.S.; Nóbrega, R.S.; de Araújo, F.E.; Rocha Filho, G.B. Spacial Distribution of Rain Types in Pernambuco with the Usage of Remote Sensing. J. Hyperspectr. Remote Sens. 2016, 6, 154–163. [Google Scholar] [CrossRef]
  21. Szwed, M. Variability of Precipitation in Poland under Climate Change. Theor. Appl. Climatol. 2019, 135, 1003–1015. [Google Scholar] [CrossRef]
  22. Abreu, M.C.; Cecílio, R.A.; Pruski, F.F.; dos Santos, G.R.; De Almeida, L.T.; Zanetti, S.S. Critérios Para Escolha de Distribuições de Probabilidades Em Estudos de Eventos Extremos de Precipitação. Rev. Bras. Meteorol. 2018, 33, 601–613. [Google Scholar] [CrossRef]
  23. de Mello, C.R.; Viola, M.R.; de Mello, J.M.; Silva, A.M. Continuidade Espacial de Chuvas Intensas No Estado de Minas Gerais. Ciência e Agrotecnol. 2008, 32, 532–539. [Google Scholar]
  24. Back, Á.J.; Henn, A.; Oliveira, J.L.R. Heavy Rainfall Equations for Santa Catarina, Brazil. Rev. Bras. Ciência do Solo 2011, 35, 2127–2134. [Google Scholar] [CrossRef]
  25. Denardin, J.E.; Freitas, P.L. de Características Fundamentais Da Chuva No Brasil. Pesqui. Agropecuária Bras. 1982, 10, 1409–1416. [Google Scholar]
  26. Fendrich, R. Chuvas Intensas Para Obras de Drenagem (No Estado Do Paraná), 1st ed.; Champagnat: Curitiba, Brazil, 1998. [Google Scholar]
  27. Freitas, A.J.; da Silva, D.D.; Pruski, F.F.; Pinto, F.A.; Pereira, S.B.; Gomes Filho, R.R.; Teixeira, A.F.; Baena, L.G.N.; Mello, L.T.A.; Novaes, L.F.d. Equações de Chuvas Intensas No Estado de Minas Gerais, 1st ed.; Companhia de Saneamento de Minas Gerais: Belo Horizonte, Brazil, 2001. [Google Scholar]
  28. da Silva, D.D.; Pinto, F.R.L.; Pruski, F.F.; Pinto, F.A. Estimativa e Espacialização Dos Parâmetros Da Equação de Intensidade-Duração-Freqüência Da Precipitação Para o Rio de Janeiro e o Espírito Santo. Eng. Agrícola 1999, 19, 11–21. [Google Scholar]
  29. da Silva, D.D.; Gomes Filho, R.R.; Pruski, F.F.; Pereira, S.B.; Novaes, L.F. de Chuvas Intensas No Estado Da Bahia. Rev. Bras. Eng. Agrícola e Ambient. 2002, 6, 362–367. [Google Scholar] [CrossRef]
  30. da Silva, D.D.; Pereira, S.B.; Pruski, F.F.; Gomes Filho, R.R.; Lana, Â.M.Q.; Baena, L.G.N. Equações de Intensidade-Duração-Freqüência Da Precipitação Pluvial Para o Estado de Tocantins. Eng. na Agric. 2003, 11, 7–14. [Google Scholar]
  31. Agência Nacional de Águas Sistema de Informação Hidrológicas—Hidroweb. Available online: https://www.snirh.gov.br/hidroweb/ (accessed on 3 February 2020).
  32. Zambrano-Bigiarini, M. hydroGOF: Goodness-of-Fit Functions for Comparison of Simulated and Observed Hydrological Time Series; R Package Version 0.3-10. 2017. Available online: https://cran.r-project.org/ (accessed on 28 August 2021).
  33. R Core Team. R: A Language and Environment for Statistical Computing; R Foundation for Statistical Computing: Vienna, Austria, 2018. [Google Scholar]
  34. Junqueira Júnior, J.A.; de Mello, C.R.; Alves, G.J. Eventos Extremos de Precipitação No Alto Rio Grande, MG: Análise Probabilística. Rev. Bras. Eng. Agrícola e Ambient. 2015, 19, 301–308. [Google Scholar] [CrossRef]
  35. Lima, A.O.; Lyra, G.B.; Abreu, M.C.; Oliveira-Júnior, J.F.; Zeri, M.; Cunha-Zeri, G. Extreme Rainfall Events over Rio de Janeiro State, Brazil: Characterization Using Probability Distribution Functions and Clustering Analysis. Atmos. Res. 2021, 247, 105221. [Google Scholar] [CrossRef]
  36. Silva, C.B.; Oliveira, L.F.C. Relação Intensidade-Duração-Frequência de Chuvas Extremas Na Região Nordeste Do Brasil. Rev. Bras. Climatol. 2017, 20, 267–283. [Google Scholar] [CrossRef]
  37. Martins, F.B.; Gonzaga, G.; dos Santos, D.F.; Reboita, M.S. Classificação Climática de Köppen e de Thornthwaite Para Minas Gerais: Cenário Atual e Projeções Futuras. Rev. Bras. Climatol. 2018, 1, 129–156. [Google Scholar] [CrossRef]
  38. Reboita, M.S.; Rodrigues, M.; Silva, L.F.; Alves, M.A. Aspectos Climáticos Do Estado de Minas Gerais. Rev. Bras. Climatol. 2015, 17, 209–229. [Google Scholar] [CrossRef]
  39. Back, Á.J. Alternative Model of Intense Rainfall Equation Obtained from Daily Rainfall Disaggregation. RBRH 2020, 25, e2. [Google Scholar] [CrossRef]
  40. Marengo, J.; Valverde, M.; Obregon, G. Observed and Projected Changes in Rainfall Extremes in the Metropolitan Area of São Paulo. Clim. Res. 2013, 57, 61–72. [Google Scholar] [CrossRef]
  41. Vemado, F.; Pereira Filho, A.J. Severe Weather Caused by Heat Island and Sea Breeze Effects in the Metropolitan Area of São Paulo, Brazil. Adv. Meteorol. 2016, 2016, 8364134. [Google Scholar] [CrossRef]
  42. Dalagnol, R.; Gramcianinov, C.B.; Crespo, N.M.; Luiz, R.; Chiquetto, J.B.; Marques, M.T.A.; Neto, G.D.; de Abreu, R.C.; Li, S.; Lott, F.C.; et al. Extreme Rainfall and Its Impacts in the Brazilian Minas Gerais State in January 2020: Can We Blame Climate Change? Clim. Resil. Sustain. 2022, 1, e15. [Google Scholar] [CrossRef]
  43. Sanches, F.; Verdum, R.; Fisch, G.; Gass, S.L.B.; Rocha, V.M. Extreme Rainfall Events in the Southwest of Rio Grande Do Sul (Brazil) and Its Association with the Sandization Process. Am. J. Clim. Chang. 2019, 08, 441–453. [Google Scholar] [CrossRef]
  44. Pousa, R.; Costa, M.H.; Pimenta, F.M.; Fontes, V.C.; de Brito, V.F.A.; Castro, M. Climate Change and Intense Irrigation Growth in Western Bahia, Brazil: The Urgent Need for Hydroclimatic Monitoring. Water 2019, 11, 933. [Google Scholar] [CrossRef]
  45. Silva Dias, M.A.F.; Dias, J.; Carvalho, L.M.V.; Freitas, E.D.; Silva Dias, P.L. Changes in Extreme Daily Rainfall for São Paulo, Brazil. Clim. Change 2013, 116, 705–722. [Google Scholar] [CrossRef]
  46. Back, Á.J.; Oliveira, J.L.R.; Henn, A. Relações Entre Precipitações Intensas de Diferentes Durações Para Desagregação Da Chuva Diária Em Santa Catarina. Rev. Bras. Eng. Agrícola e Ambient. 2012, 16, 391–398. [Google Scholar] [CrossRef]
  47. Manke, E.B.; Teixeira-Gandra, C.F.A.; Damé, R.d.C.F.; Nunes, A.B.; Neta, M.C.C.C.; Karsburg, R.M. Seasonal Intensity-Duration-Frequency Relationships for Pelotas, Rio Grande Do Sul, Brazil. Rev. Bras. Eng. Agrícola e Ambient. 2022, 26, 85–90. [Google Scholar] [CrossRef]
  48. Goyal, M.K.; Shivam, G.; Sarma, A.K. Spatial Homogeneity of Extreme Precipitation Indices Using Fuzzy Clustering over Northeast India. Nat. Hazards 2019, 98, 559–574. [Google Scholar] [CrossRef]
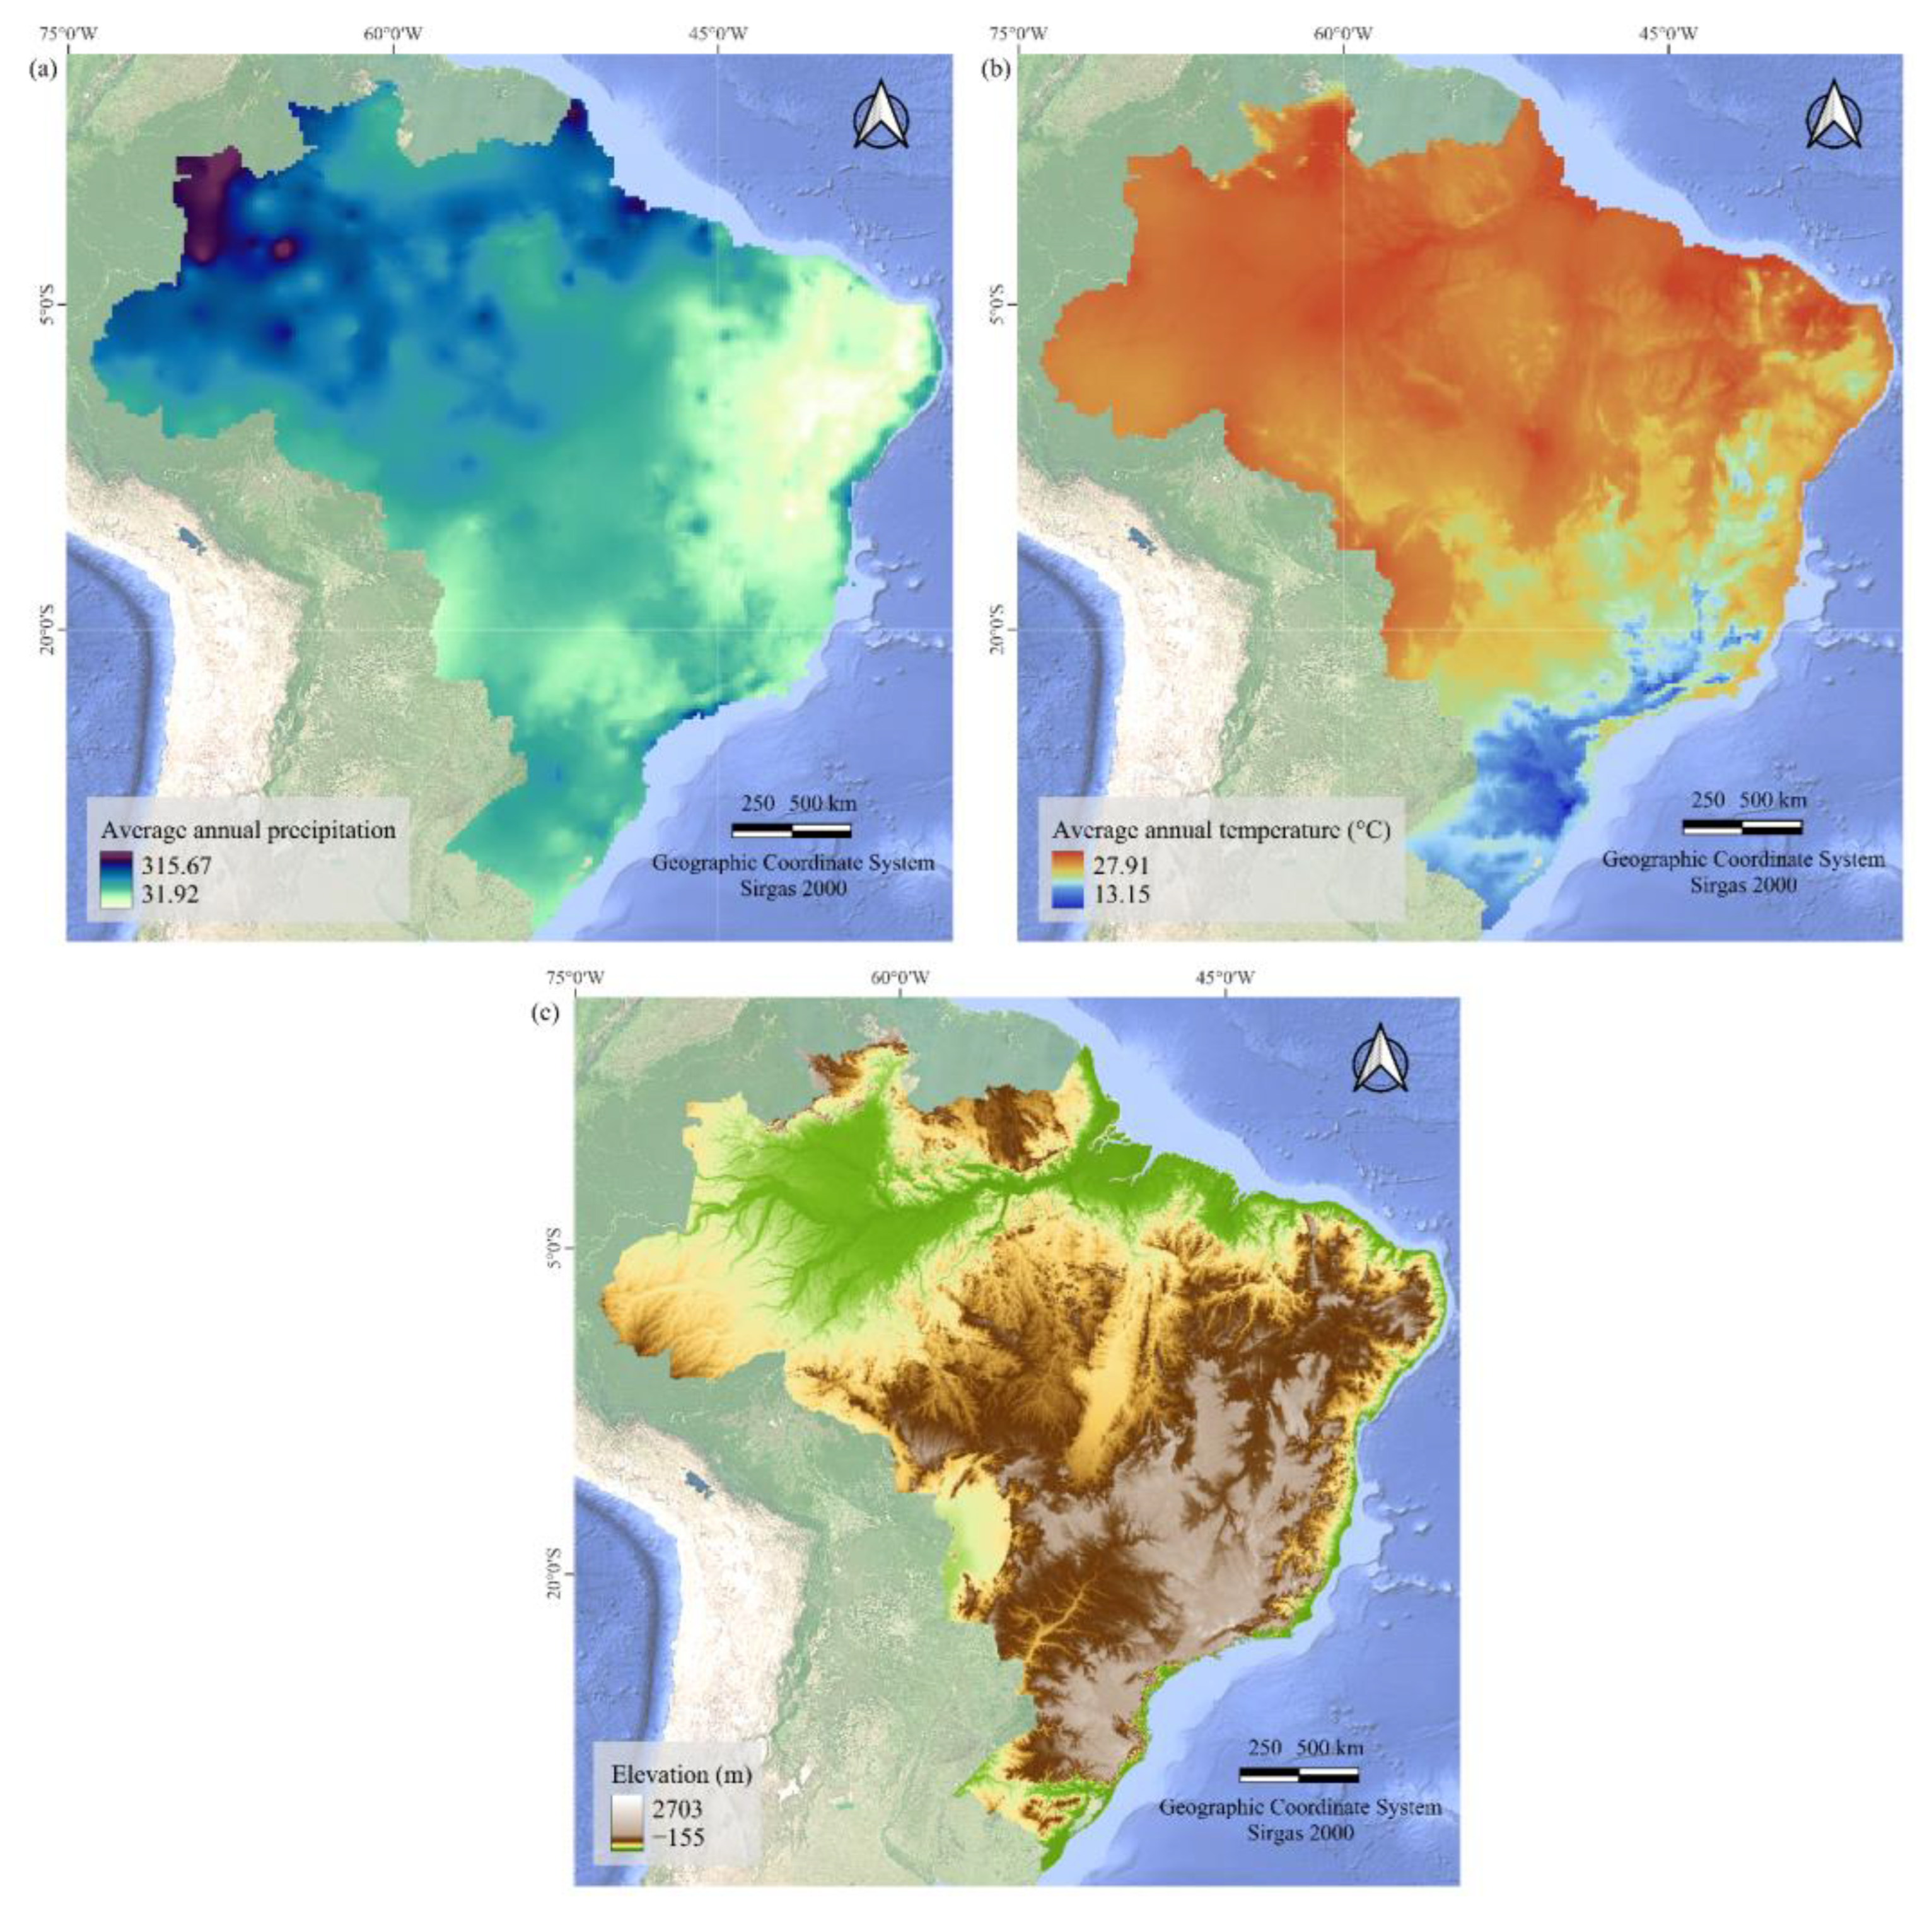
Figure 1. Spatial distribution of (a) annual total precipitation, (b) annual mean air temperature, and (c) digital elevation model (DEM) across Brazil. Precipitation and temperature data from WorldClim versão 2.1 (1970–2000). The DEM data from GMTED2010 (Global Multi-resolution Terrain Elevation Data 2010).
Hydrology 12 00211 g001
Figure 2. Location of rainfall stations classified according to their density with established IDF equations.
Hydrology 12 00211 g002
Figure 3. Transformation coefficients for converting maximum daily precipitation into average maximum rainfall intensity with a 10-min duration and a 2-year return period ( t c 10 , 2 ) .
Hydrology 12 00211 g003
Figure 4. Spatialization of the maximum probable daily precipitation depth for a 10-year return period.
Hydrology 12 00211 g004
Figure 5. Scatter plot of rainfall intensity obtained by applying the original IDF equations and those established through TMDP (panels a,c,e,g) and RDD (panels b,d,f,h), considering the station groups: all stations (a,b), stations in the region with high density—HD (panels c,d), stations in the region with medium density—MD (panels e,f), and stations in the region with low density—LD (panels g,h).
Hydrology 12 00211 g005
Figure 6. Results of the indices of performance, on average, for TMDP and RDD models.
Hydrology 12 00211 g006
Figure 7. Mean Percentage Error (MPE) for estimating rainfall intensities caused by the application of the TMDP and RDD methods.
Hydrology 12 00211 g007
Figure 8. IDF curves for 5 different locations, and 10-year return periods: original equations (a), established through TMDP (b), and established through RDD (c). The intensity (y-axis) is presented on a logarithmic scale.
Hydrology 12 00211 g008
Table 1. Disaggregation coefficient (dc) for the transformation of maximum daily precipitation [12].
24 h/1 d12 h/24 h10 h/24 h8 h/24 h6 h/24 h4 h/24 h2 h/24 h1 h/24 h50 min/1 h40 min/1 h30 min/1 h20 min/30 min10 min/30 min5 min/30 min
1.140.850.820.780.720.540.480.420.740.910.810.70.540.34
Disclaimer/Publisher’s Note: The statements, opinions and data contained in all publications are solely those of the individual author(s) and contributor(s) and not of MDPI and/or the editor(s). MDPI and/or the editor(s) disclaim responsibility for any injury to people or property resulting from any ideas, methods, instructions or products referred to in the content.