Article

Simulating Effectiveness of Low Impact Development (LID) for Different Building Densities in the Face of Climate Change Using a Hydrologic-Hydraulic Model (SWMM5)

Institute of Hydraulic and Water Resources Engineering, Technical University of Darmstadt, Franziska-Braun-Straße 7, 64287 Darmstadt, Germany
*
Author to whom correspondence should be addressed.
Hydrology 2025, 12(8), 200; https://doi.org/10.3390/hydrology12080200
Submission received: 13 May 2025 / Revised: 15 July 2025 / Accepted: 29 July 2025 / Published: 31 July 2025
(This article belongs to the Topic Water Management in the Age of Climate Change)

Abstract

To date, few studies have been published for cities in Germany that take into account climate change and changing hydrologic patterns due to increases in building density. This study investigates the efficiency of LID for past and future climate in the polycentric agglomeration area Frankfurt, Main (Central Germany) using observed and projected climate (model) data for a standard reference period (1961–1990) and a high emission scenario (RCP 8.5) as well as a climate protection scenario (RCP 2.6), under 40 to 75 percent building density. LID elements included green roofs, permeable pavement and bioretention cells. SWMM5 was used as model for simulation purposes. A holistic evaluation of simulation results showed that effectiveness increases incrementally with LID implementation percentage and inverse to building density if implemented onto at least 50 percent of available impervious area. Building density had a higher adverse effect on LID efficiency than climate change. The results contribute to the understanding of localized effects of climate change and the implementation of adaption strategies to that end. The results of this study can be helpful for the scientific community regarding future investigations of LID implementation efficiency in dense residential areas and used by local governments to provide suggestions for urban water balance revaluation.

1. Introduction

Due to population density, concentration of infrastructure and increases in building density (sealed surfaces), cities are more than ever vulnerable to the consequences of climate change, such as heavy rain, heat waves and floods. This is why municipalities and cities should pursue strategies to reconcile redensification measures and climate resilience [1,2].
Densification leads to further sealing of surfaces which brings about negative environmental impacts, emphasizing the need for more preservation and management of urban greenspace [3]. Redensification can be understood as constructional adaption or adjustment which increases building density. The municipal guidelines for the redensification strategies for Frankfurt (Main) declare that redensification has benefits such as a higher capacity utilization of existing structures and building redevelopment and does not cause additional costs for land acquisitions [4]. Ref. [5], too, investigates the potential of densifying neighborhoods for sustainable urban development as resource and transport efficiency and undeveloped land out of town can be preserved as natural environment.
However, urbanization and densification cause shifts of the micro-climate due to land-use changes [6,7,8]. Combined with changes from global warming, the local climate of urban areas changes to a greater degree than non-urbanized areas [9]. Shifts in the hydrologic cycle resulting from these changes include more frequent extreme precipitation events [10] as well as prolonged periods of drought [11,12] depending on regional and seasonal settings. As extreme events increase in frequency and intensity, the anticipated changes are generally larger in Europe and Japan than in USA and Australia [10]. During the heat summers of 2018 and 2019, the city of Frankfurt, Main (Germany) has experienced the highest annual mean temperature nationwide (2018: 12.9 °C) and the highest extreme temperature in the state of Hesse (2019: 40.2 °C) with an average degree of sealing of 56.86% within the settlement areas [13,14]. During these extreme scenarios, especially sealed surfaces within urban settlements either redistribute the water volume to a significant extent or prevent the available water from infiltrating or evaporating from lower ground layers [15]. Experimental observations and urban hydrological modeling have proven that those changes lead to higher runoff peaks and a flashy runoff response in the case of extreme precipitation and as an amplifier for the urban heat island (UHI) considering hot and dry periods [16,17,18,19].
These changes in the hydrologic cycle call for future-oriented strategies to recirculate the water resources especially in urban areas to prevent threats to human life, infrastructure and socio-economic factors [15]. Even though the values and limits of Nature-Based Solutions (NBSs), which is the umbrella concept that also includes Low Impact Development (LID), has been studied with regard to climate change [20,21,22,23], ref. [24] found that several barriers hinder the evidence-based integration of such measures into international, national and local climate and development policy and practice. While ref. [25] identified fourteen studies (up to the year 2017) in their systematic literature review that examine how LID systems designed to meet historic performance standards can be resilient to future climate change, only two of those were carried out on LID-facility or building scale. Ref. [26], too, recommends further research to understand how Blue-Green Infrastructure performs at smaller urban scales such as building- and street level.
A concept that is often discussed, but not often enough employed by planners and engineers in Germany so far, is the so-called Sponge City, designed to infiltrate, store and release water within the urban boundaries in accordance with the natural hydrologic cycle. Structural measures within a Sponge City can include elements of LID. LID elements as an alternative to grey infrastructure elements serve as a tool to mitigate the effects of increased impervious surfaces [27].
One characteristic of urban areas is the building density, a relatively high share of impervious area compared to surrounding areas within a catchment. Building density has however not itself been looked at as a criterion closely enough when it comes to assessing effectiveness of strategies that aim at counter-acting manmade hydrologic changes. Since ref. [28] performed a bibliometric analysis of the research on Sponge City in 2021, analyzing online searches for keywords in addition to “Sponge City”, the terms “building density” or “impervious area share” have rarely been linked as keywords in combination with that concept when scanning the scientific literature these days. Combined searches of “Sponge City/Low Impact Development” and “building density” as keyword yielded too few/insufficient critical strikes in Google Scholar and Scopus. This shows that when Sponge City practices (SCPs) are analyzed in the scientific literature, the specific role of building density, especially under changing climate scenarios, has not been investigated worthy enough, even though the substantial land requirements for mitigation techniques have been flagged [29]. One example is presented by [19] who did compare hydrological changes assessment based on different development densities and found that urbanization in a residential catchment more than doubles the total runoff volume. However, the analysis was based on sub-hourly hydro-meteorological data of the past and could not provide an insight into future settings regarding climate changes. A few examples were published in 2021 on the topic of densification effects on urban hydrology and microclimate: ref. [30] investigated the impacts of densification and climate change on sustainable urban drainage systems in a residential area in Munich (Germany) and found that it is in fact possible to enhance the water balance and gain new living space simultaneously if a sustainable urban planning strategy is implemented that includes future-oriented stormwater management. This study was based on single-event modelling only and thus did not account for the duration between precipitation events (which is important for antecedent soil moisture content (AMC), long-term storage and groundwater recharge) or distinct temperature differences throughout the seasons (which has huge effects on vegetated LID elements). In general, few results for the effects of LID implementation based on long-term monitoring or simulation for the future in Germany exist. Most hydrologic models available only account for single or multiple rainfall events.
The research needs for longer time studies to investigate the performance of LID has been identified before [31]. Refs. [8,32] compared micro-climatological modelling outcomes on district and block level for different densification and green intervention scenarios (green roofs and green facades) as well as energy-demands for large-scale densification potential and found that while mean radiant temperature (MRT) and surface temperature could significantly be reduced, the implemented green infrastructure measures had no impact on cold air volume flow (CAVF). But they both did not analyze LID elements that focus on a direct enhancement of the water balance on these scales.
When considering LID implementation as one way to cope with increases in building density, and thus adverse effects for the urban hydrologic cycle, covering a greater area with LID might present a logic consequence. However, as for example [33], applying a cost-effectiveness indicator (CEI), found, that more implementation area with LID was not necessarily more efficient, the impact of building density on LID efficiency certainly requires more investigative approaches, especially under changing climate scenarios. Further, different spatial scales for LID implementation itself have been investigated [32,34,35,36]. Small-scale NBSs, including many LID elements, are usually applied to a specific location such as a single building or a street [37]. But not enough research has been conducted that investigates the efficiency of LID on this smallest of scales within a residential district, a single street. From their systematic literature review on the potential of Blue-Green Infrastructure as a climate change adaption strategy, ref. [26] finds a potential explanation of why most of the literature so far has considered large urban scales. They see reasons for this in models’ lack of accuracy, prediction adequacy and a possibility to retrofit only large-scale applications. While small-scale adaption measures have been critically judged for their insufficiency during large events resulting from climate change [38], the realizability of larg(er)-scale LID implementation could however be increasingly challenging due to concurrent decreases of space allowances. Further, implementation of LIDs over a larger area (city scale) may not be feasible [39]. So, there is a need to analyze the impacts of LID on such a small scale in order not to disregard potential of improving the hydrological balance here. Especially, since for the study area of interest, ref. [40] has found that, to a large extent, densification occurs in settings of previously low-density residential areas with single-family homes and is not limited to places of high accessibility.
While ref. [20] actually recognizes space limitation as the major problem in the implementation of LIDs in denser urban areas, refs. [41,42] question whether the construction of Sponge Cities, including LID, will be able to solve a majority of urban stormwater issues that will arise in the future in light of mentioned impacts at all.
Primarily, international research in the field has focused on flood mitigation and thus on the reduction in runoff volume and/or peak discharge rate as main criterion for efficiency of LID assessment [20,23,43,44,45,46]. This is, however, not a holistic approach for an efficiency analysis. Since LID relies heavily on infiltration and evapotranspiration [27], this study also analyzes the efficiency of LID implementation based on more elements of the hydrologic balance (runoff reduction, infiltration, evapotranspiration and storage) rather than just on a reduction of surface runoff. LIDs can be adjusted in response to climate change, and thus be more efficient compared to conventional grey infrastructure if they are designed to take account of rainfall characteristics projected for future climate change scenarios [23]. But can they also adjust to further building density increases as urban settlements are predicted to cover 4–5% of global land area by 2050 [47], by which point almost 70% of the world’s population will live in cities [48]? With a continuous decline in space allowances and a distinct spatial variability in terms of practicability of LID implementation, it can be of special interest to analyze the efficiency of LIDs directed at water balance enhancement on a single street scale under various percentages of building density increase.
The aim of this study is to answer the question if under mentioned changing conditions LID can still be an effective tool to mitigate the consequences of changing hydrologic patterns on a very small scale. This objective is achieved by investigating the combined quantitative hydrological impact of building density increase and LID measures on a fictive street within a residential neighborhood in Frankfurt (Hesse), Germany. Just recently, the US real estate service provider Jones Lang LaSalle (JLL) published an analysis, which ascribes Frankfurt the highest climate change risk score amongst investigated cities all over Germany up to the year 2050, meaning risks through heat or heavy rain are estimated to be very high here [49]. While few similar studies exist that are based on historic data, this investigation is one of the first to apply a bias-adjusted Germany-wide, regionalized climate dataset for the timeframe “far future”, as the effectiveness of a certain type of LID is also dependent on the consideration of rainfall patterns during the regulation of optimal LID parameters.
Three LID elements of the rainfall-runoff model SWMM5 were analyzed for different scenarios within a street in a residential district as SWMM has less often been used on a local, district-level scale. Further existing gaps regarding its application as a potential “Sponge City model” were to be identified. As there has been no prior assessment of the impact of building density on the efficiency of LID implementation in this region at this point, the simulations are run for a fictional study site at first. The results can be used to investigate a real study site in a follow-up study. This enables the buildup of the model to be of low complexity. When simulating hydrological changes and assessing potential solution strategies for a trend towards major implications, it is important to compare the results to historical timeseries to gauge their impact. This is demonstrated here using a standard reference period and allows for a better insight and a direct comparison of future changes upon our infrastructure resilience.
The research results of this study can be helpful for the scientific community regarding future investigations of LID implementation efficiency on real study sites as well as for local industries and city planning regarding existing structures and future city concepts, both under the impact of building density increase.

2. Materials and Methods

2.1. Storm Water Management Model (SWMM)

In this study the software EPA SWMM Version 5.2 was used for modeling runoff and changes in the hydrological balance with respect to the sponge city approach (runoff reduction, infiltration and storage capacity). SWMM5 models hydrologic-hydraulic processes based on input variables for retention, infiltration, storage, utilization, purification and discharge.

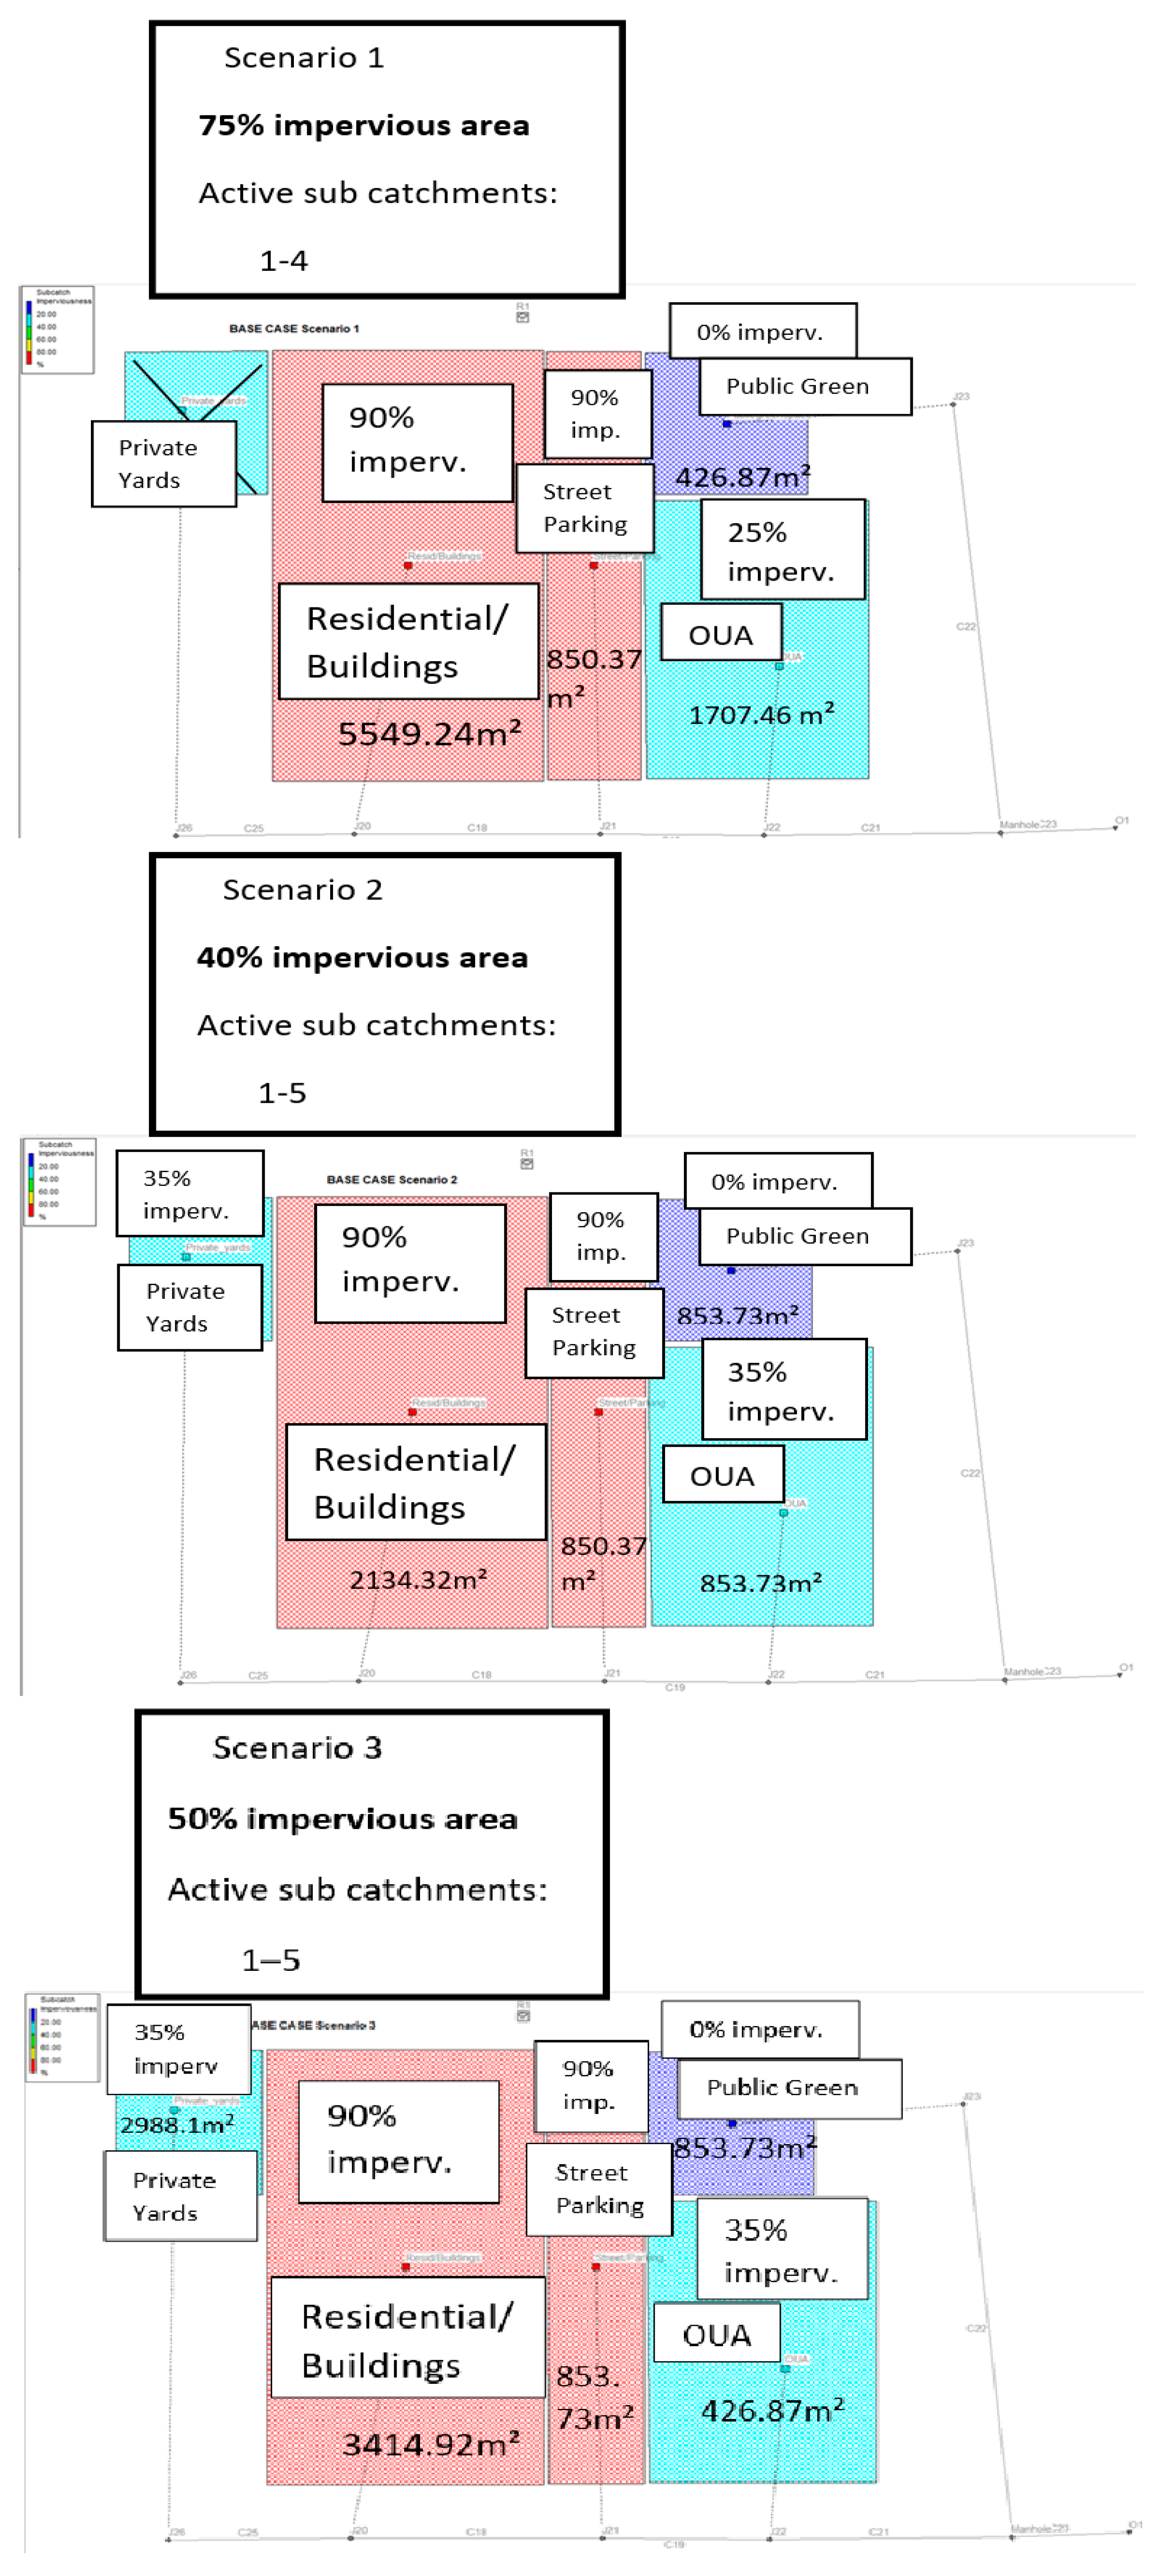
2.2. Study Site Description and Delineation

Frankfurt (Main) is one of the cities with the highest level of densification within the whole “Rhein-Main” region, characterized by polycentric agglomeration. It is challenging to gauge densification in urban areas as these comprise historic urban centers as well as recently developed housing areas in villages, turned into residential settlements for commuters [40]. The increase in building density can for example be equated with the term (re-)densification as measured and applied by [40] through an indicator called Degree of Possible Change (DPC). Based on changes from one time point to another, they analysed the change in building coverage of existing urban areas to derive the increase in density, i.e., densification:
D e g r e e   o f   P o s s i b l e   C h a n g e = b u i l d i n g   c h a n g e   a r e a b u i l d a b l e   a r e a
Further, existing sites around the world with different shares of built-up areas can be considered as reference points in this study to set three different classes of impervious shares: Dhaka (Bangladesh) as an extreme example for high building-density which could emerge in European areas in the future, as well and Bensheim (Germany) as a representative low-density region within the “Rhein-Main area”. The density characteristics were transferred onto our fictional study site and set three different scenarios (see Figure 1) for two typical sets of residential blocks on a street of 80–100 m in length. All hydrological and physical parameters were chosen to represent a residential site within the Frankfurt region. The site comprises different sub-catchments, which have shares of imperviousness ranging from 0 to 100%. The total area, as well as the paved area from the street and the buildings, were estimated by analyzing Google Maps pictures with the function “span distance”. Using characteristics of existing residential blocks as a template for the fictive study site can make it closer to reality.
LID controls were placed within the existing subcatchments, as this method is suitable for medium-sized study areas [50]. The five subcatchments were further subdivided into pervious and impervious sections. Each subcatchment was modelled as a rectangle and fit with a set slope of 5% and uniform width, which drains to one single outlet channel in the model. Each subcatchment, except for subcatchment “Public Green Space” (which has only pervious surface area), was assigned a specific LID control in all the design scenarios, except for the Base Case. Subcatchment “Private Yards” is only active during simulation Scenarios 2 and 3, as Scenario 1 contains almost no recreational areas.

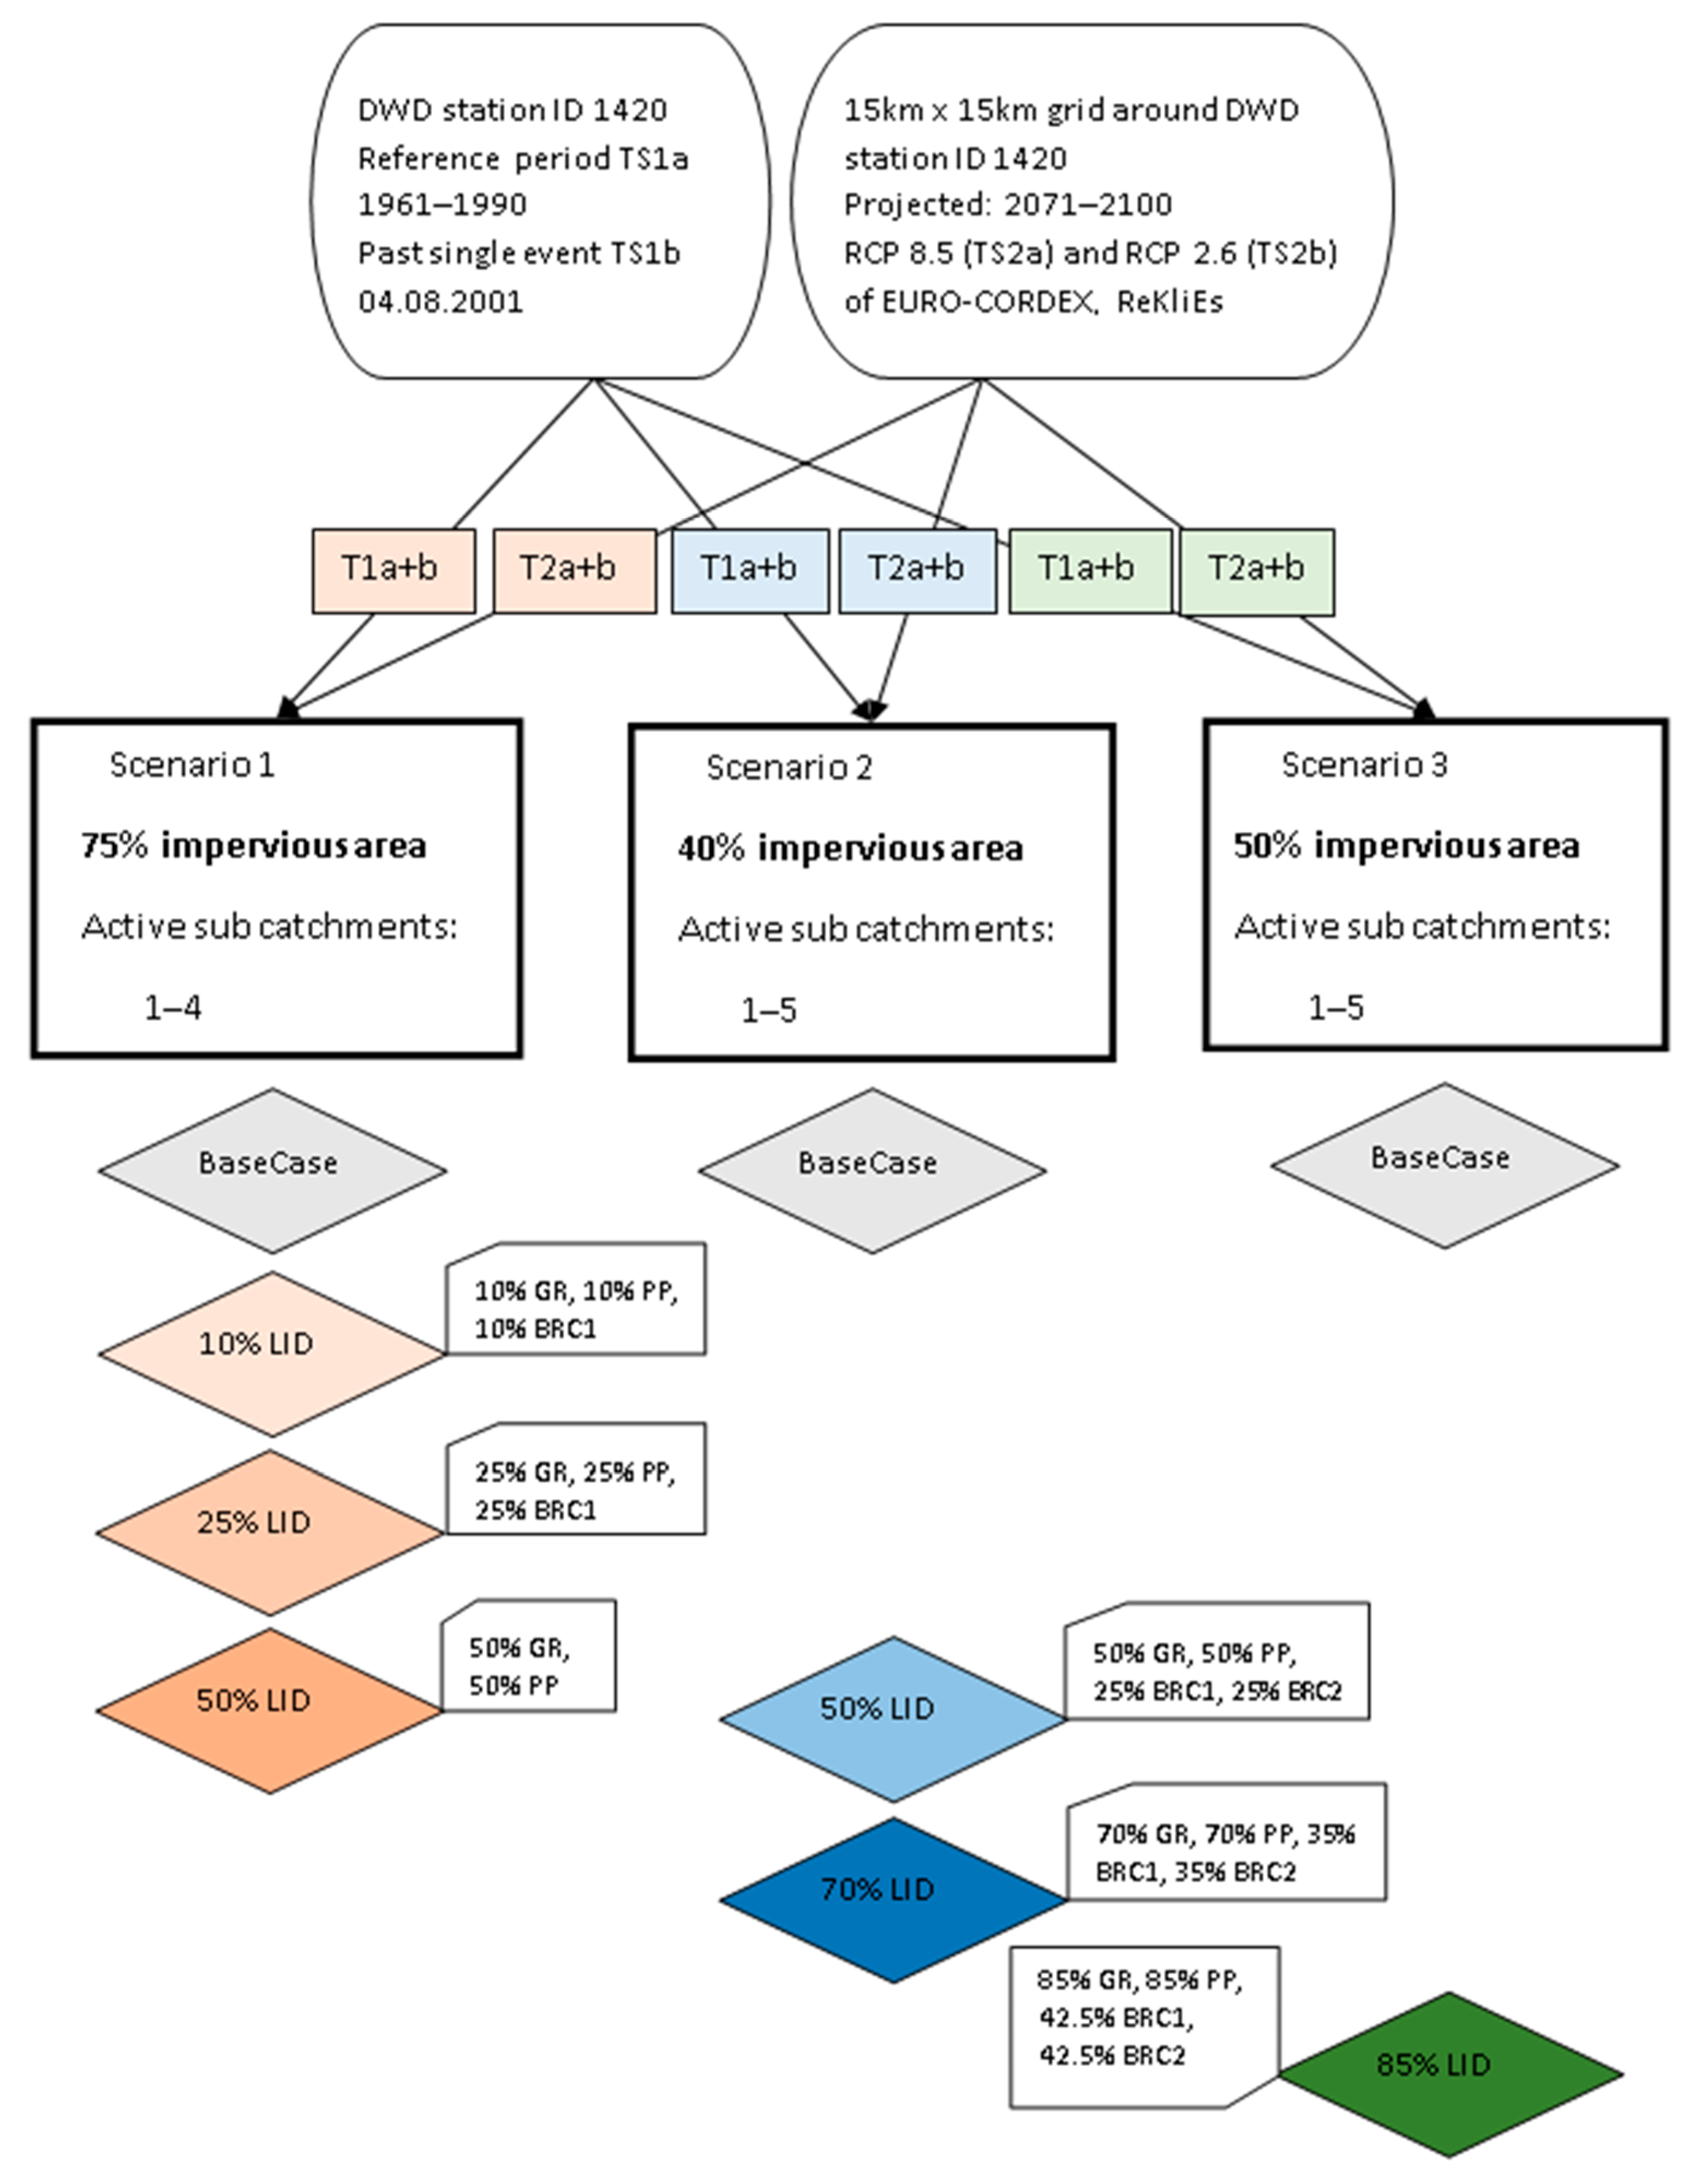
2.3. Design Scenarios

Three scenarios for the implementation of LID controls were analyzed to determine their efficiency. This was a prerequisite for the analysis as the term “urban (district)” is not uniformly defined or numerically specified across regions. The design scenarios are examples for specific planning cases which could typically be implemented in the settlement type “streets with single homes”.
As a real model’s setup our scenarios can be compared to a study area which [51] simulated in SWMM and LISFLOOD-FP. They assessed the performance of mentioned freeware numerical tools to investigate the quality of results of 1D- and 2D-modeling under scarce data availability. Their study area is located in Midwestern Germany, not far from our fictional study site, with similar hydrological and geological characteristics and especially a comparable allocation of land use (street/parking, residential/building, green spaces.
Scenario 1 (75% imperviousness) has LID control implementations of 10%, 25% and 50%. Those percentages were chosen upon personal judgement but are similar to a case study by [52] who analyzed design scenarios of 0, 20, 50 and 100% rooftop conversions for green roof implementation. They found that noticeable hydrologic benefits through LID implementation require an Effective Impervious Area reduction (EIA) threshold value equal to 5% and that the hydrologic performance linearly increases with increasing the EIA reduction percentages. In the authors’ estimation, LID implementation could only have a measurable impact if implemented on at least 10% of the total impervious area and due to competition for area could not be implemented on the entire available impervious surface. A district with high building-density will require significant LID implementation to reapproach the natural water balance during times of extreme weather events and within the study, settings from “absolute minimum action is taken” (10–25% LID) to “a sound basis is created” (50% LID) were simulated. Scenario 2 (40% imperviousness) has LID control implementations of 50% and 70%. This was set to simulate a desired scenario. The set building density of 40% exists for residential districts in Germany and it should be analyzed if sufficient effects with ambitious LID implementation strategies could be achieved. Scenario 3 has a mixed impervious area percentage of Scenarios 1 and 2. To set a highly ambitious example of climate-adaption management, 85% LID control was implemented here. This might not be realistic for mentioned reasons such as competition of areas but might become a scenario without any alternatives in the far future under drastically changing climate and without political and societal promotion. It was analyzed if this high share of LID implementation has a considerably higher positive effect on the water balance compared to the maximum LID percentages in Scenarios 1 and 2. Figure 2 shows the model of the study site and the allocation of total LID control implementation into the three different types used here (GR, PP, BRC). Different colors of the subcatchments represent different ranges of impervious area share in SWMM5. The slope is set at 5% for all three design scenarios. This is to represent sites where heavy rain events will have tremendous effects immediately due to the early peak flow and high runoff volume. Examples for this kind of slope were found in Mid- and Northern Hesse by analyzing a DGM5 which was derived from a DGM1 with inclination angles, freely available via the open data portal of the administration for soil management and geoinformation [53].

2.4. Input Parameters

Hydrologic and physical parameters, as well as characteristics of each LID control, were partly predefined based on the idea of a fictive site with varying building density, as well as derived from acceptable literature references [54], as can be seen in the Supplementary Material, Table S10. Further, several values for LID control parameters and the general model setup require assumptions [55]. Unknown parameters such as vegetative volume, surface roughness, wilting point and suction head were estimated using the SWMM5 Reference Manual [56]. According to the land use land cover type of the subcatchments, Manning coefficient and Depression storage values were determined according to SWMM5’s User Manual. The runoff was modeled by assuming the flow to be steady and Hortons infiltration method was the routing model used. Horton infiltration parameters of the different soil types were taken from [57]. Horton’s infiltration method is utilized as it better represents the infiltration capacity curve compared to methods such as the SCS-CN or the Green-Ampt method [50]. All relevant input parameters and time steps for the model can be found in the Supplementary Material, Tables S10–S12.
By setting daytime average temperatures as direct input data into SWMM5 via a specified time series, SWMM5 will use Hargreaves equation to calculate evapotranspiration based on the temperature data. The ‘evaporation loss’ that is calculated actually represents evapotranspiration from the study site.

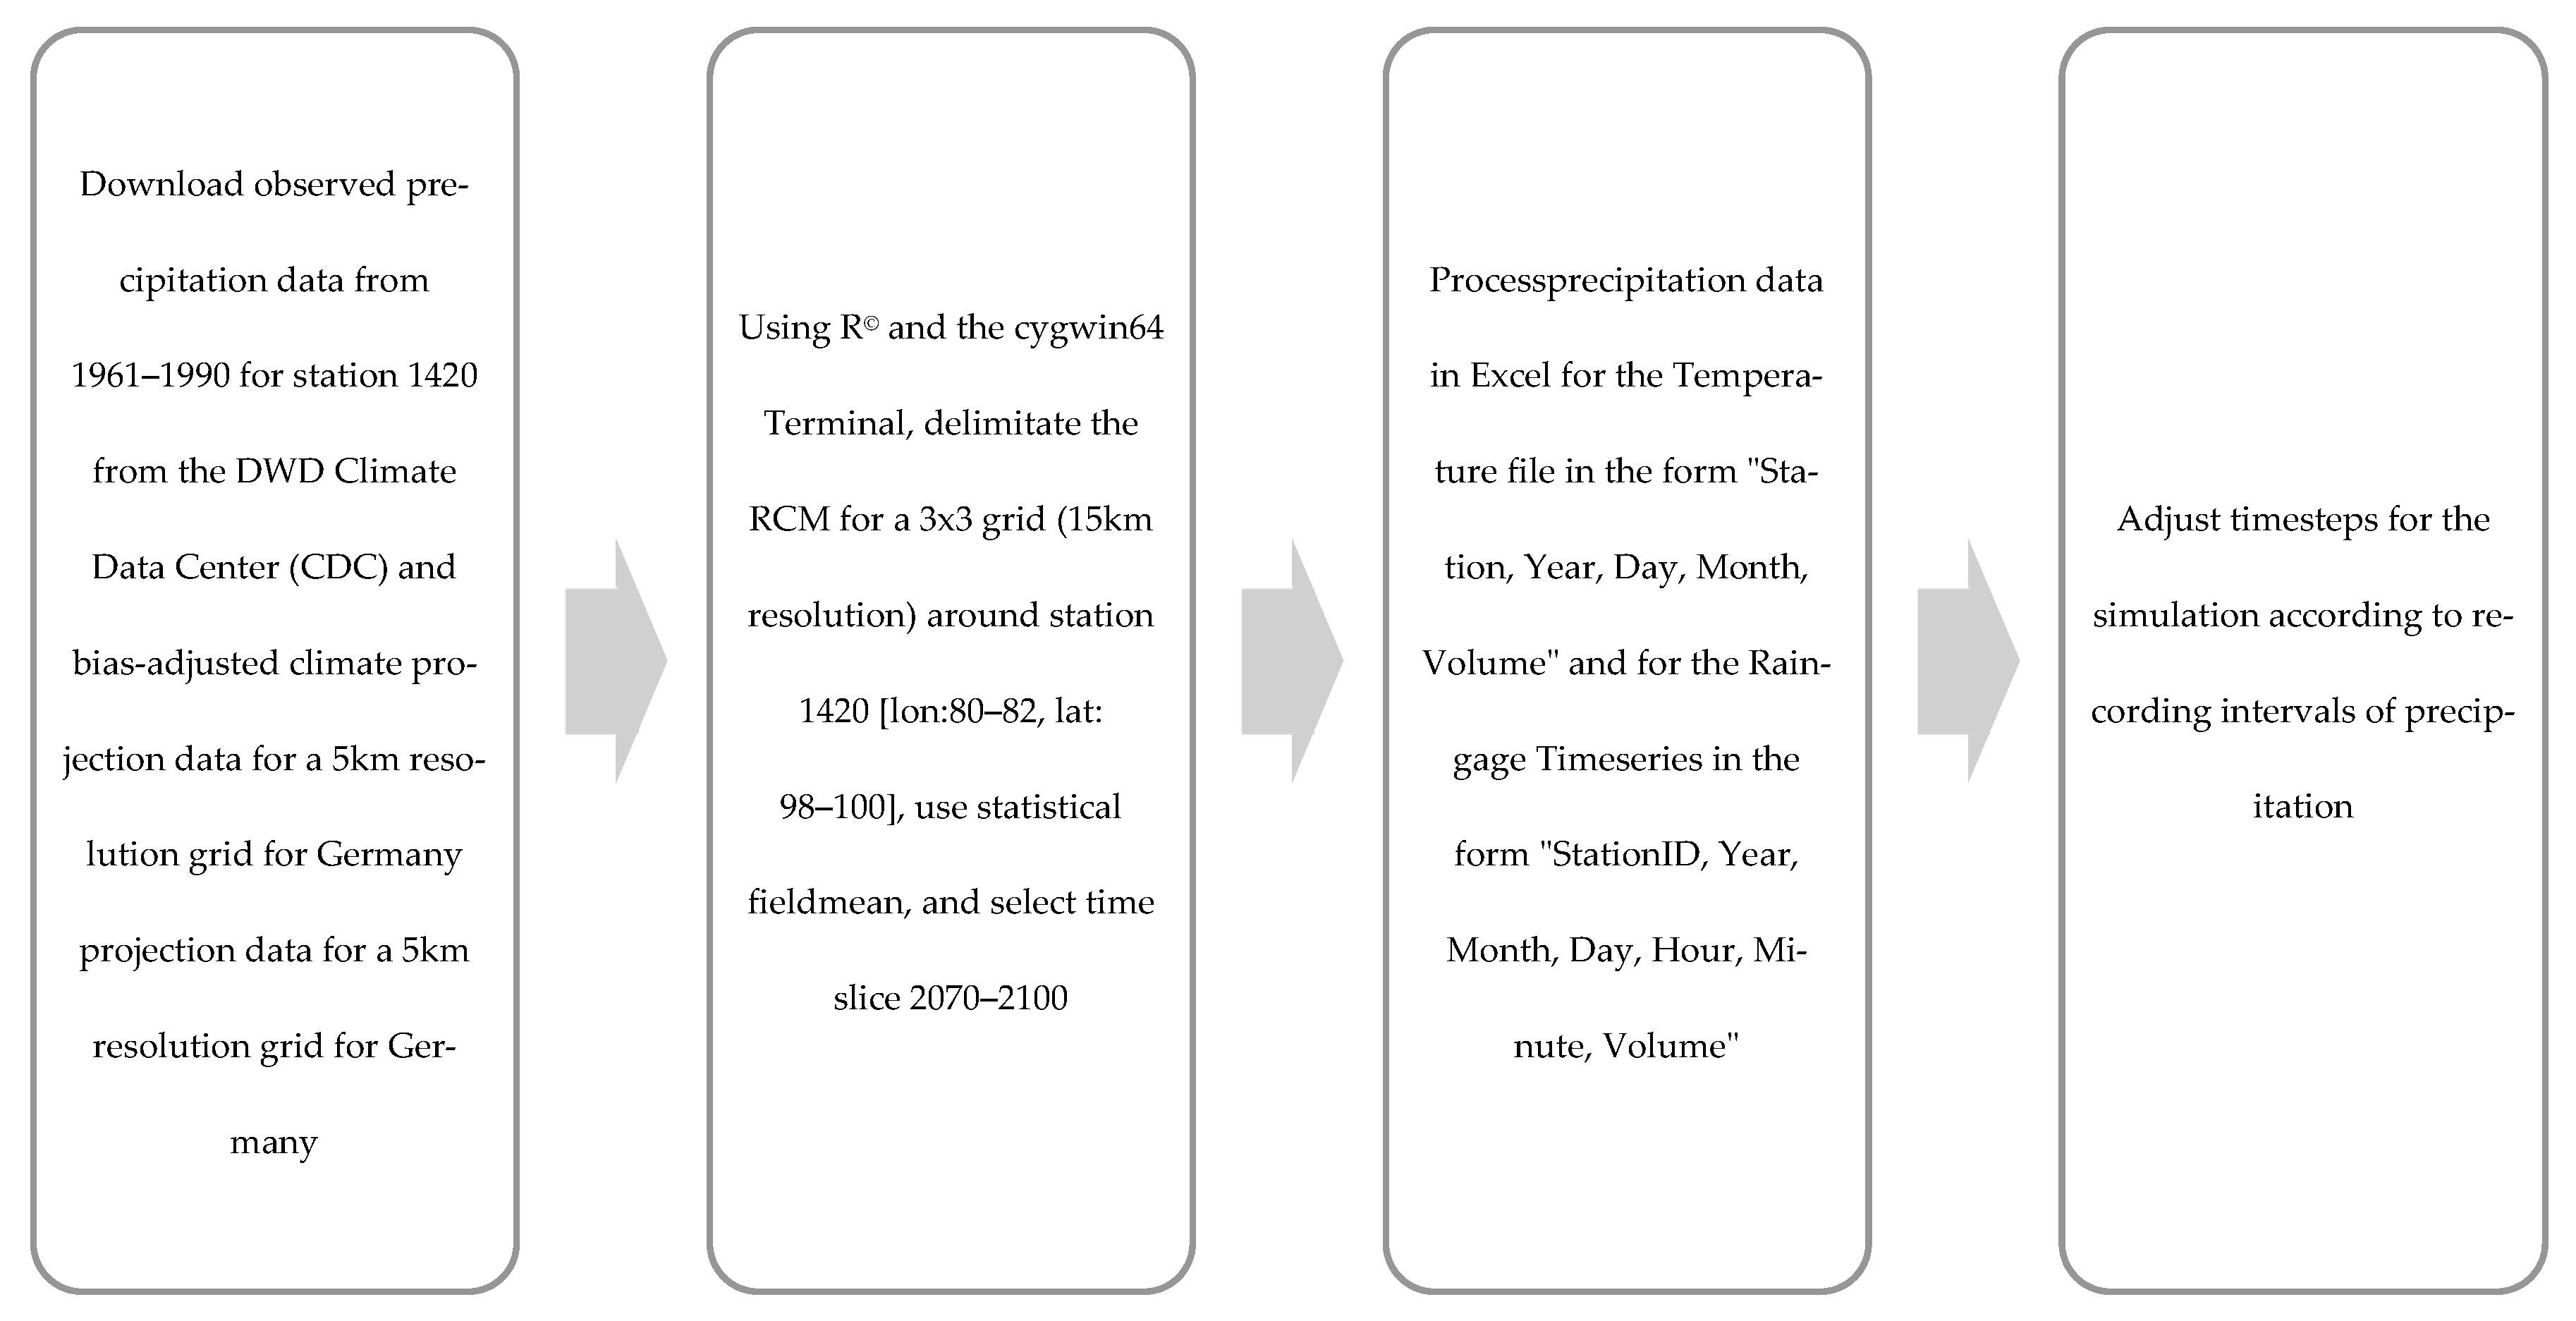
2.5. Preprocessing of Climate Data

The preprocessing of climate (projection) data according to [58] and the implementation into SWMM5 included a translation of station-based data across a grid and are described in Figure 3.

2.5.1. Historic Timeseries

The historic timeseries are derived from the Hydrometeorological Rasterdataset Precipitation Germany (HYRAS) with punctual precipitation depths for the DWD station 1420 (Frankfurt a. Main, Germany). Precipitation depths are available as raster-oriented daily values via the Climate Data Center [59].
Past and future events were analyzed to represent LID implementation for urban existing building stock, as development areas usually are designed as “green districts” in the first place. As briefly addressed in the introduction, the past single event was chosen to intentionally represent a very common and presumable precipitation event, as those are the ones contemporary LIDs or GI-elements are designed for. They are usually not designed for a HQ100 or comparable, but future single precipitation events are expected to significantly increase in intensity and frequency meaning they will also have to withstand heavier “common” precipitation [60]. The past and future multiyear timeseries were chosen to compare the efficiency of LIDs for single and longtime events as there is some disagreement amongst researchers on the question if SWMM5 results are more conclusive for short or longer timeseries [61,62,63].
As climate projections are to be undertaken for longer time periods due to great climate variety of the climate parameters on a decadal scale, the observation periods for potential climate changes should comprise at least 30 years according to the ‘standard reference period’ defined by the World Organization for Meteorology [64]. In this study 30 years were chosen as long timeseries.

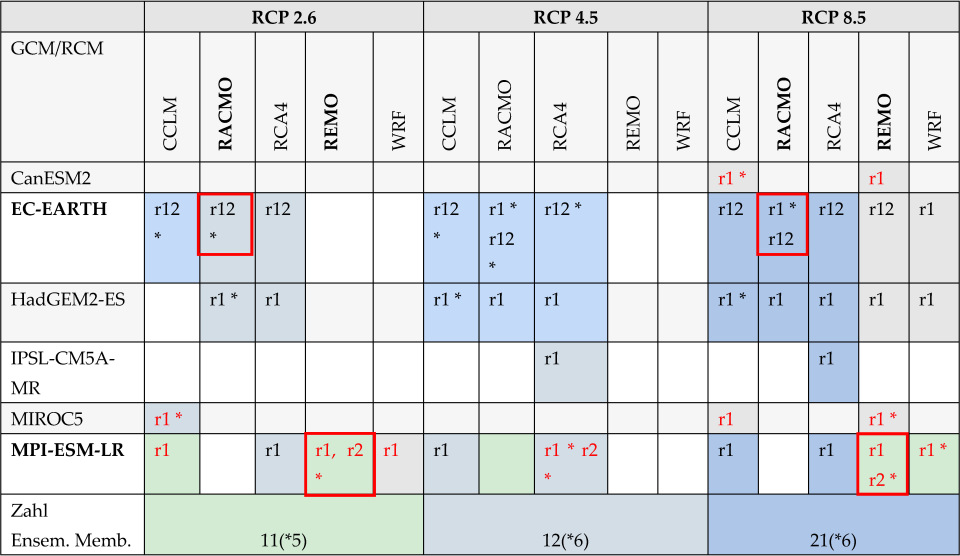
2.5.2. Climate Projections Used in the Model

Climate projections are the result of simulations for the intermediate and far future [61]. The DWD published a core-ensemble for the Representative Concentration Pathways (RCP) 2.6, 4.5 and 8.5 in 2018 as one generation of future climate projections, which were calculated with global and regional climate models (GCMs, RCMs), statistically revised with recalibration [65]. In this study, the historical base period of 1961–1990 was set as a reference for assessing long-term climate change as advocated by the WMO [66]. The RCP 2.6 scenario refers to the concentration of CO2 that delivers global warming at an average of 2.6 W/m2 across the planet. The RCP 8.5 scenario refers to the concentration of CO2 that delivers global warming at an average of 8.5 W/m2 [67]. The bias-adjustment performed by DWD and the BMVI Expertennetzwerk resolves systematic errors that are especially inherent in dynamic climate models [68]. The use of a single cascade of data records cannot sufficiently represent the full range of potential climate developments [68], which is why the ensemble was used. This also enables comparability with similar studies. The projections used here are based on the two GCMs: The European community Earth System Model (EC-EARTH) and the Max Planck Institute Earth System Model (EMP-ESM, low resolution). Simulations for two of the six ensemble members for the RCP 8.5 and RCP 2.6 scenarios were run and the greatest extremes for Scenarios 1, 2 and 3 were used for comparison with the results of the historic data records. The selection of climate data projections is presented in Table 1.
The time horizon of 2070–2100 represents the timeframe “far future” and is chosen to ensure comparability to other studies in the field of climate change adaption.
Ref. [69] performed a quality control for input data for a selection of climate models of the DWD core ensemble 2018, which showed significant errors for climate parameters for water balance assessment. These were intentionally left unexploited in this study. For simulation in SWMM5, two datasets originating from the RCM EURO-CORDEX project (climate model “REMO”: one for RCP 2.6, one for RCP 8.5) and two datasets originating from the RCM ReKliEs project (climate model “RACMO”: one for RCP 2.6, one for RCP 8.5) (see Tables S13 and S14, Supplementary Material) were used. This selection was made based upon the fact that these datasets were considered for further analyses of water budget simulation with LARSIM-ME by the BMVI-Expertennetzwerk [66] before. LARSIM stands for “Large Area Runoff Simulation” and was developed to perform largescale water budget modeling nationwide [70]. As a water budget analysis was also sought in this study, using this selection of climate data models presented an adequate basis.

2.6. Simulations Run and Assessment

The LID controls presented in Section 3 were implemented for the subcatchments and simulations were then run for different designs (building densities) and climate scenarios under varying LID control percentages. Different LID control percentages were implemented to find out if for a set building density, the advantages on the hydrologic balance within the urban district increase proportionally to the LID implementation stage. The LID performance was then analyzed by looking at evaporation- and infiltration-losses, LID drainage, surface runoff reduction and changes in final storage for the investigated site in the Status Report (Water Quantity Section).
The parameters obtained and calculated for the catchment area were controlled by SWMM5’s numerical methods, which use mass, energy, and momentum conservation concepts to explain rainfall-runoff processes. Net change in depth per unit of time is essentially the difference between inflow and outflow rates across the sub-catchment, based on conservation [71]:
d t = i e f q
where i = rate of rainfall + snowmelt (m/s)
e = surface evaporation rate (m/s)
f = infiltration rate (m/s)
q = runoff rate (m/s).
The water balance was calculated at the end of each simulation by analyzing the Runoff Quantity Continuity section of the status report. This displays all parts of the equations below as depth in mm.
General water balance Equation (3) and equation used by SWMM5 (4):
P = E T + R + S
T o t a l   P = S u r f a c e   R u n o f f + E v a p . l o s s + I n f i l t r a t . l o s s + L I D   d r a i n a g e + F i n a l   S t o r a g e I n i t i a l   L I D   S t o r a g e
As mentioned in Section 2.4, SWMM5 can base actual evapotranspiration rates on monthly or daily mean temperatures, according to which timeseries values are implemented. According to [19], there is a good performance of SWMM5 in quantifying the urban evapotranspiration by this method.
When assessing the single elements of the equation, special attention was given to the infiltration capacity and final storage as these two components are most significant in terms of the effectiveness of SCPs. Infiltration capacity should increase, and initial as well as final LID storage needs to be higher compared to pre-development hydrologic conditions.
During a simulation SWMM5 performs a moisture balance according to the Equations (2) and (3). For the simulation analysis a continuity error and flow routing error of <1% was targeted.
After the evaluation of all historic and future timeseries, a comparison was conducted for:
  • Historic reference period (1 January 1960–31 December 1990) vs. Far future (1 January 2071–31 December 2100)
  • Historic single event (4 August 2001) vs. historic reference period (1 January 1961–31 December 1990).
Hydrographs and bar charts were plotted together with storage, infiltration and evapotranspiration.

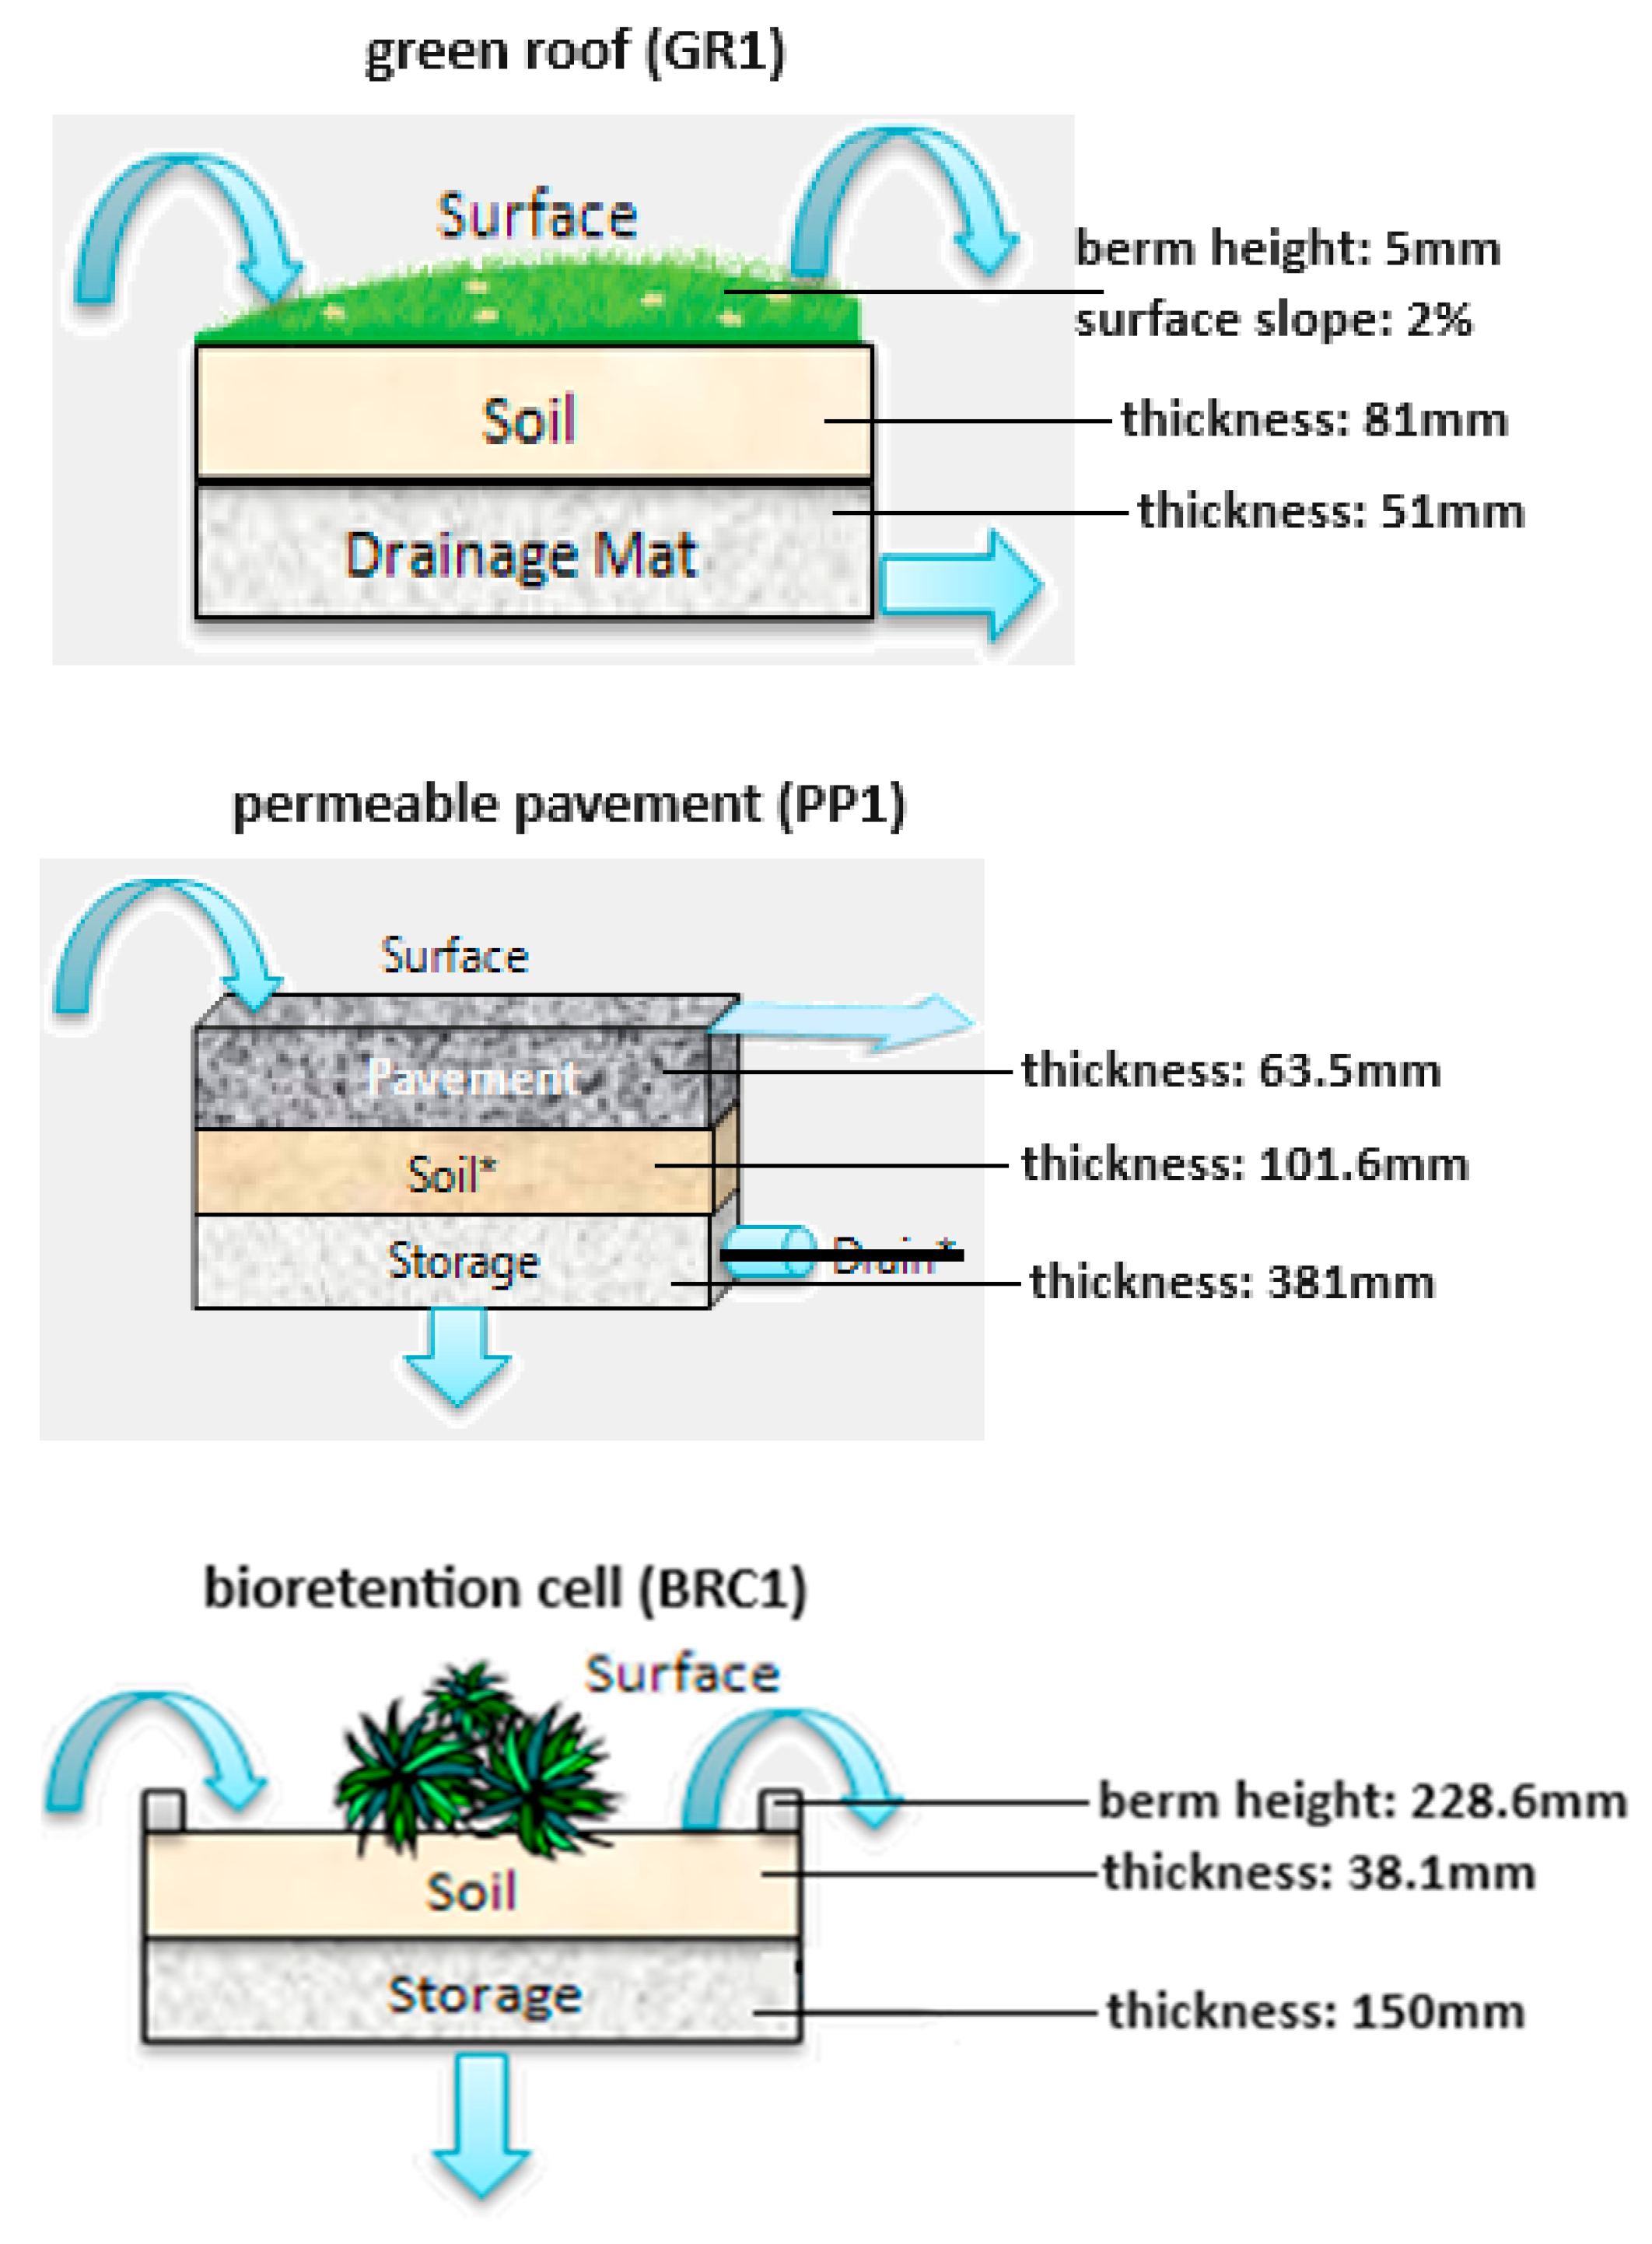
3. Introducing LID Methods

The implementation of LID controls aims at a return back to the pre-development hydrologic state through storage and subsequent infiltration and evapotranspiration of precipitation (SWMM5.org 2019).
In this study three of a total of eight LID controls offered in SWMM5 were chosen to transform the street according to the sponge city approach: green roof (GR), continuous permeable pavement (PP) and bioretention cell (BRC). Those LID elements were chosen since they offer great potential of increasing infiltration and thus enabling groundwater recharge, hydrological processes that become ever more restricted with building density increases. GR and PP do not withdraw effective area but still allow for increasing LID drainage (through infiltration: PP) and evapotranspiration (GR). Bioretention concepts were originally developed for small development sites in the range of 0.4–1.2 ha [72] and help increase filtration, infiltration and recharge or restore base flow and groundwater. Ref. [25] emphasizes that individual LID systems have different drainage or coverage area depending on practical purposes and environmental settings and that therefore more caution is required when LID performance is compared by design type. This underscores an important aspect of the study at hand, namely that certain LID types have limited area to be applied. GR can only harvest water from their set aerial dimensions whilst PP and BRC collect water from larger drainage areas. While streets and rooftops will not drastically decrease in future densification scenarios, applying bioretention systems might become more challenging.
Permeable pavements are especially suitable for urban areas due to low congestion and applicable for foot paths and cycling tracks. Green roofs can be installed on new buildings and partly retrofitted on existing buildings, even if redensification is practiced building upwards. Further, concepts exist already that allow for roof greening on slanted roof systems [73].
According to [55], the basic parameters for soil properties, storage volumes, surface characteristics, and underdrains are essentially the same among green infrastructure devices, regardless of which LID control is being selected for simulation. However, they state that due to the highly localized nature of GI, sizing guidelines are site-dependent and there is no one fits all green infrastructure sizing ratio of drainage area to LID area. For the hypothetic study area, a combination of acceptable literature references [54], guidelines from the SWMM5 user manual [56] and assumed parameter values were therefore used. A detailed table for the LID parameter values and their areal extensions is given in Tables S10 and S11 in the Supplementary Material.
The size design of the LID solutions is among many factors dependent on rainfall patterns, site specific conditions and topography. For the hypothetic study area, the focus was only on the overall implementation percentage regarding the area per subcatchment that replaces impervious surface. In SWMM5 the LID controls are arranged from numerous units, each with identical area per unit. Figure 4 shows the LID controls studied. The set number of units, percentage of subcatchment occupied and surface width per unit constitutes the LID control. The details concerning this are listed in the Supplementary Material (Table S11).

4. Results and Discussion

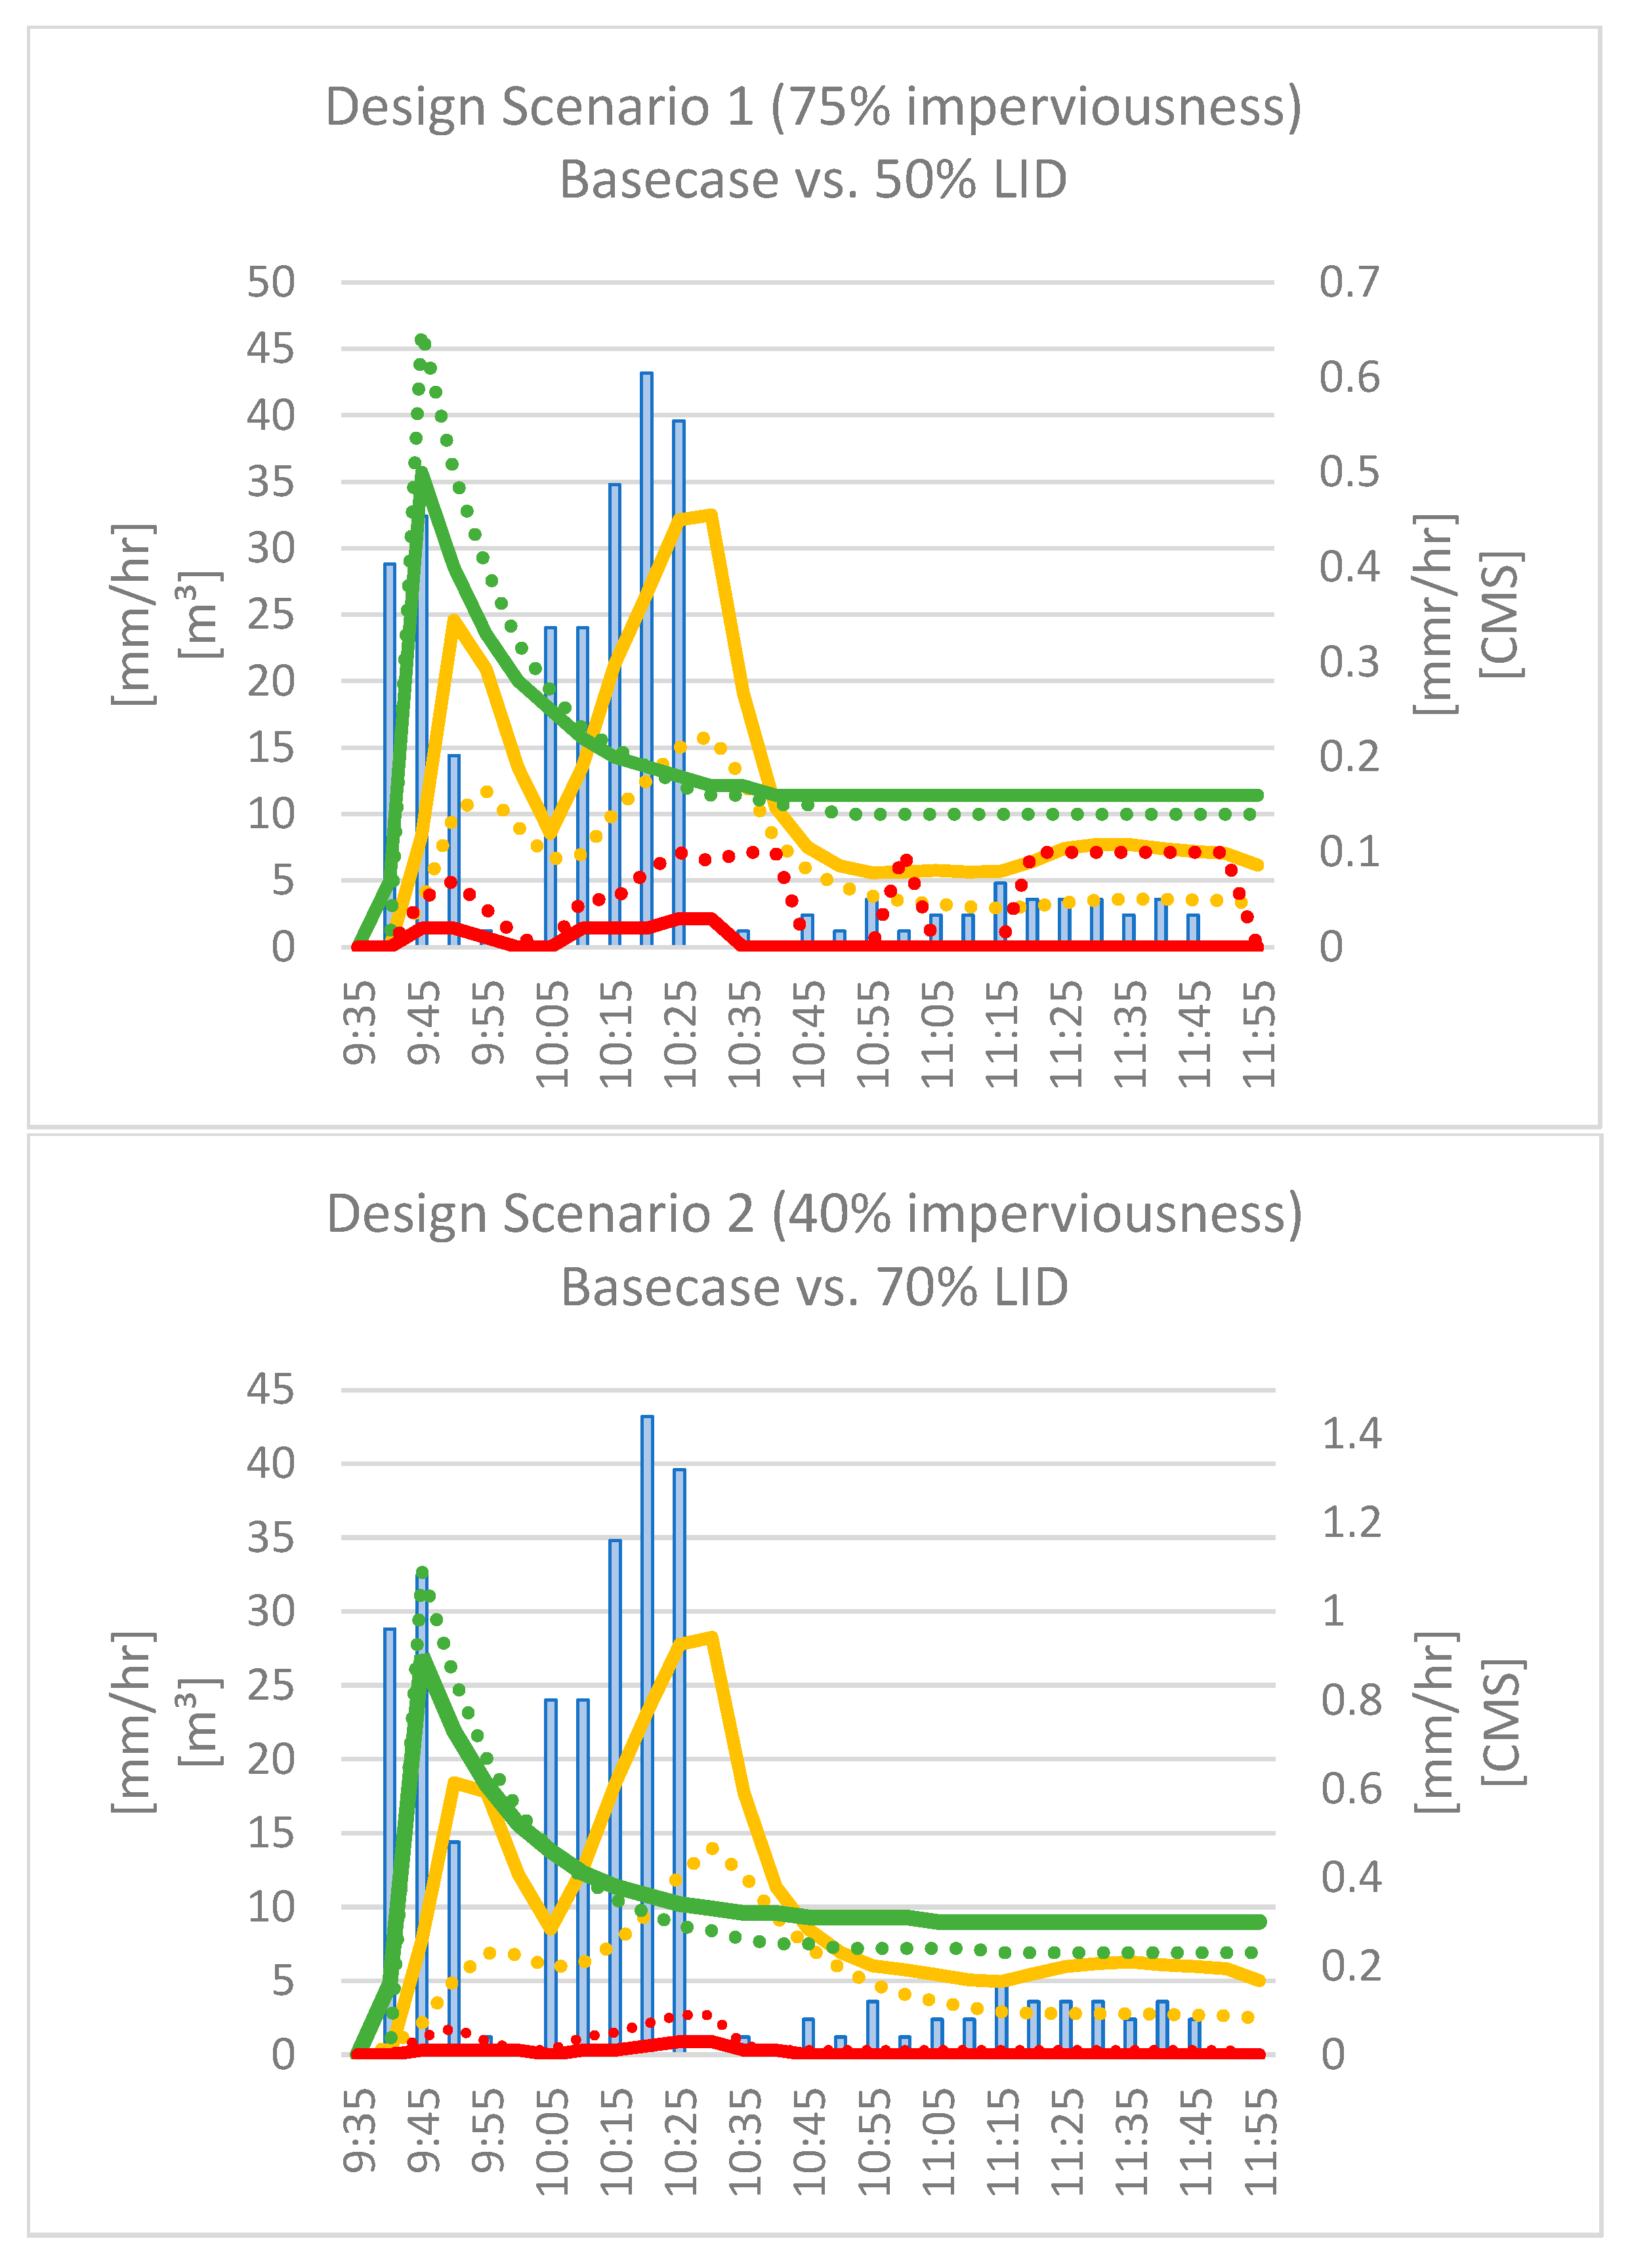
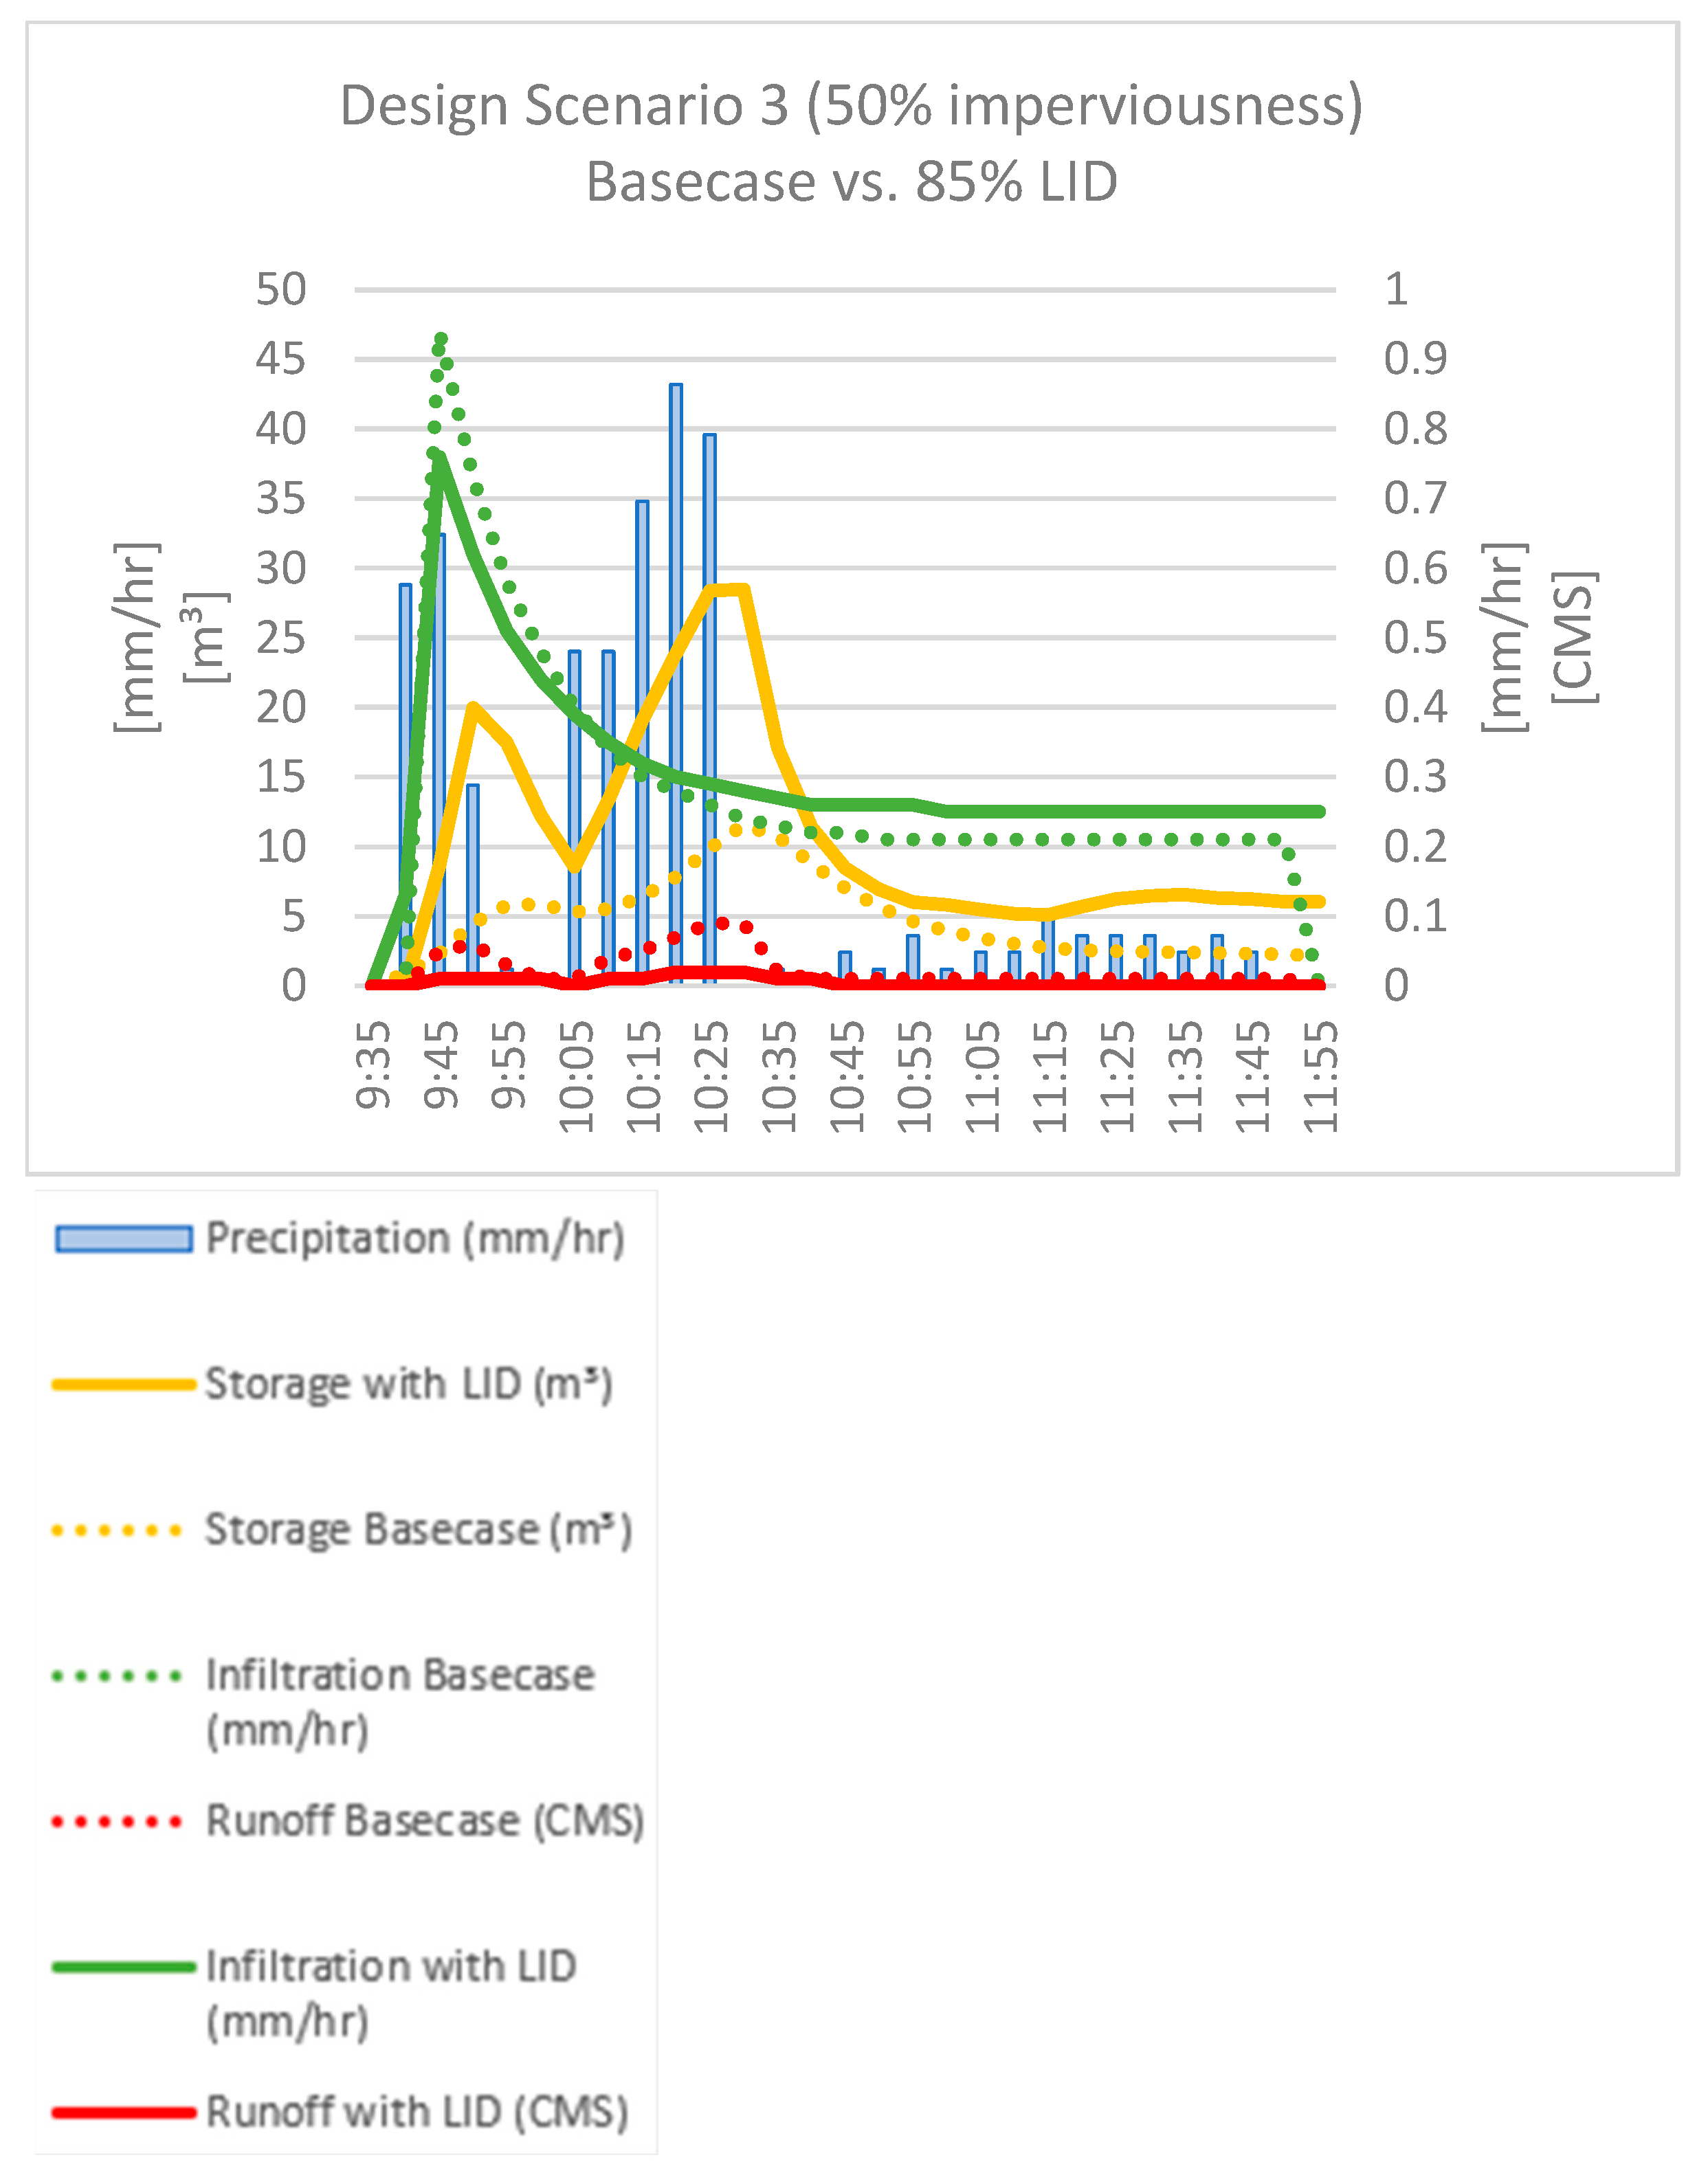
4.1. Hydrological Changes Assessment

The interpretation of results is only possible under consideration of modeling boundaries. Although a fictive study without calibration was simulated, ref. [74] have previously demonstrated that hypothetical LID simulation can deliver valuable results if realistic assumptions are made regarding the model development. Ref. [51] confirmed this finding when they investigated the performance of SWMM for a small watershed with scarce data availability and found acceptable results for flood modeling based on a 100-year rain event relative to a (flood) reference map. SWMM5 has been reported to perform well in both low and high rainfall conditions, which could be confirmed.
The “initial LID storage” results from the initial saturation of each LID being set to two percent. As expected, for every design scenario the simulation with maximum LID implementation percentage yielded the best results with respect to the LID efficiency and thus the benefits for the water balance. Therefore, the following sections analyze the design scenarios for the maximum LID implementation percentage compared to the corresponding Base Cases in further detail and do not go into detail for the other simulations:
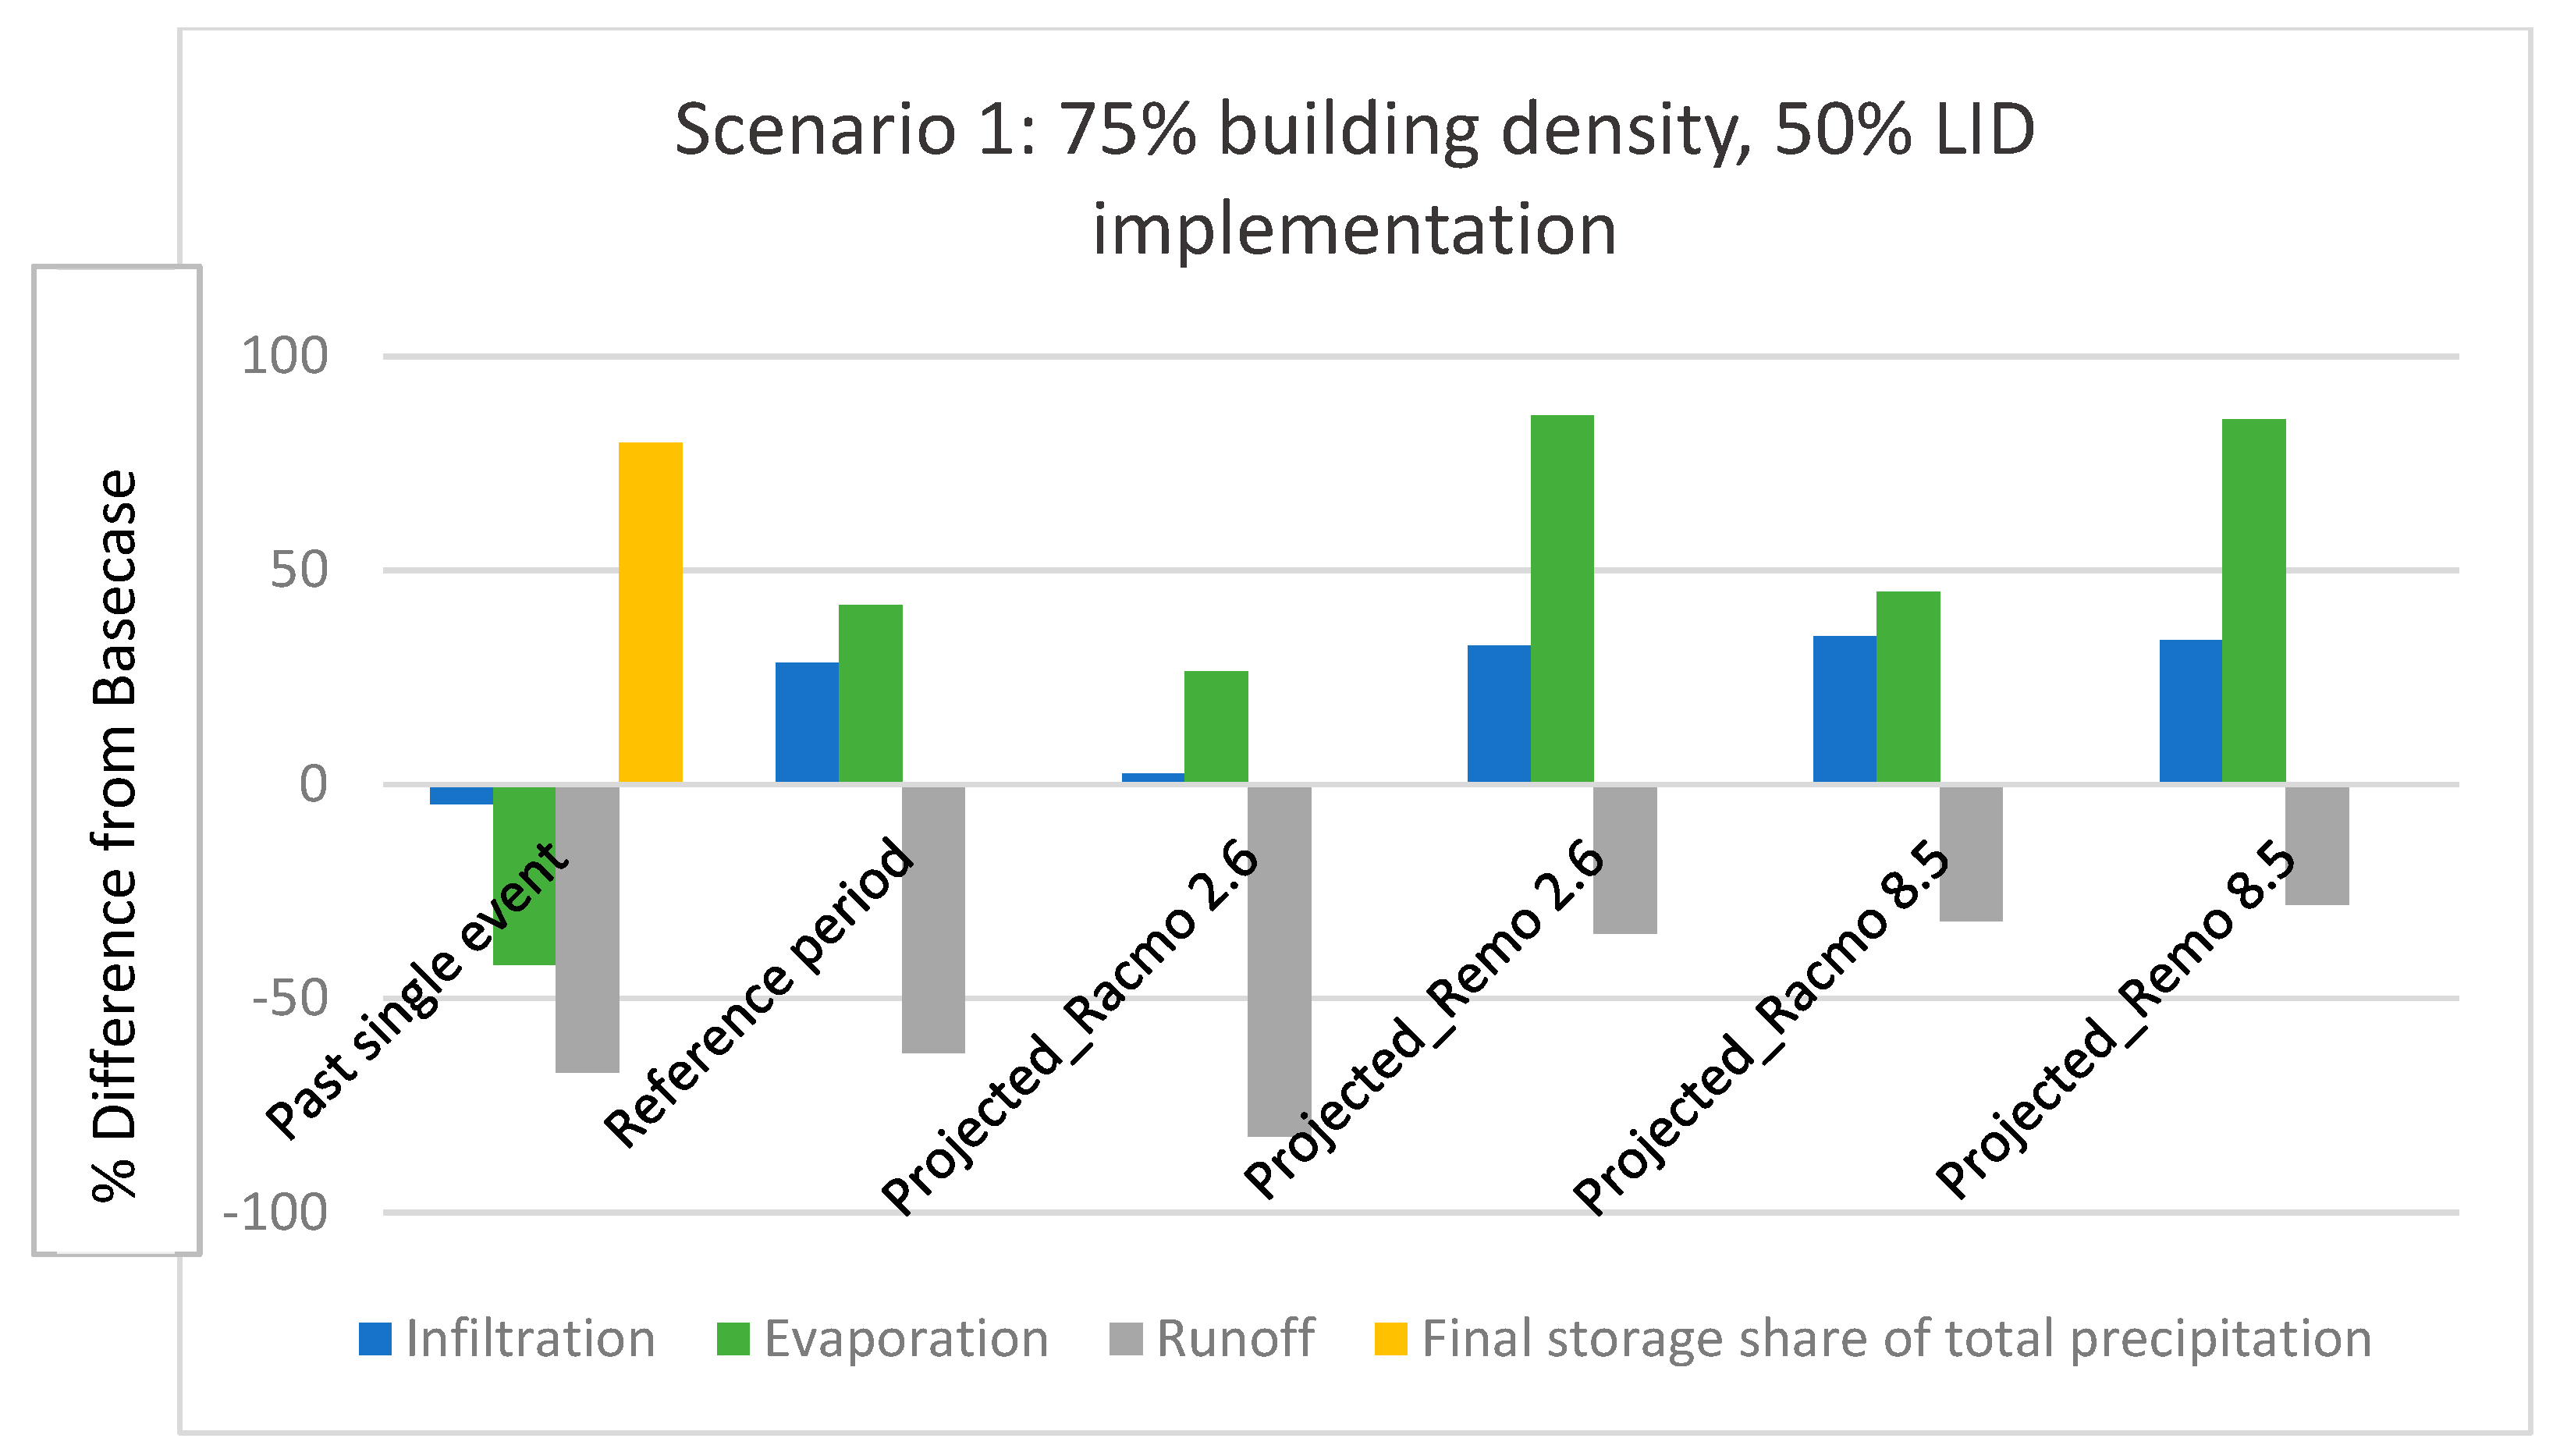
  • Design Scenario 1 (75% impervious area): Base Case vs. 50% LID implementation.
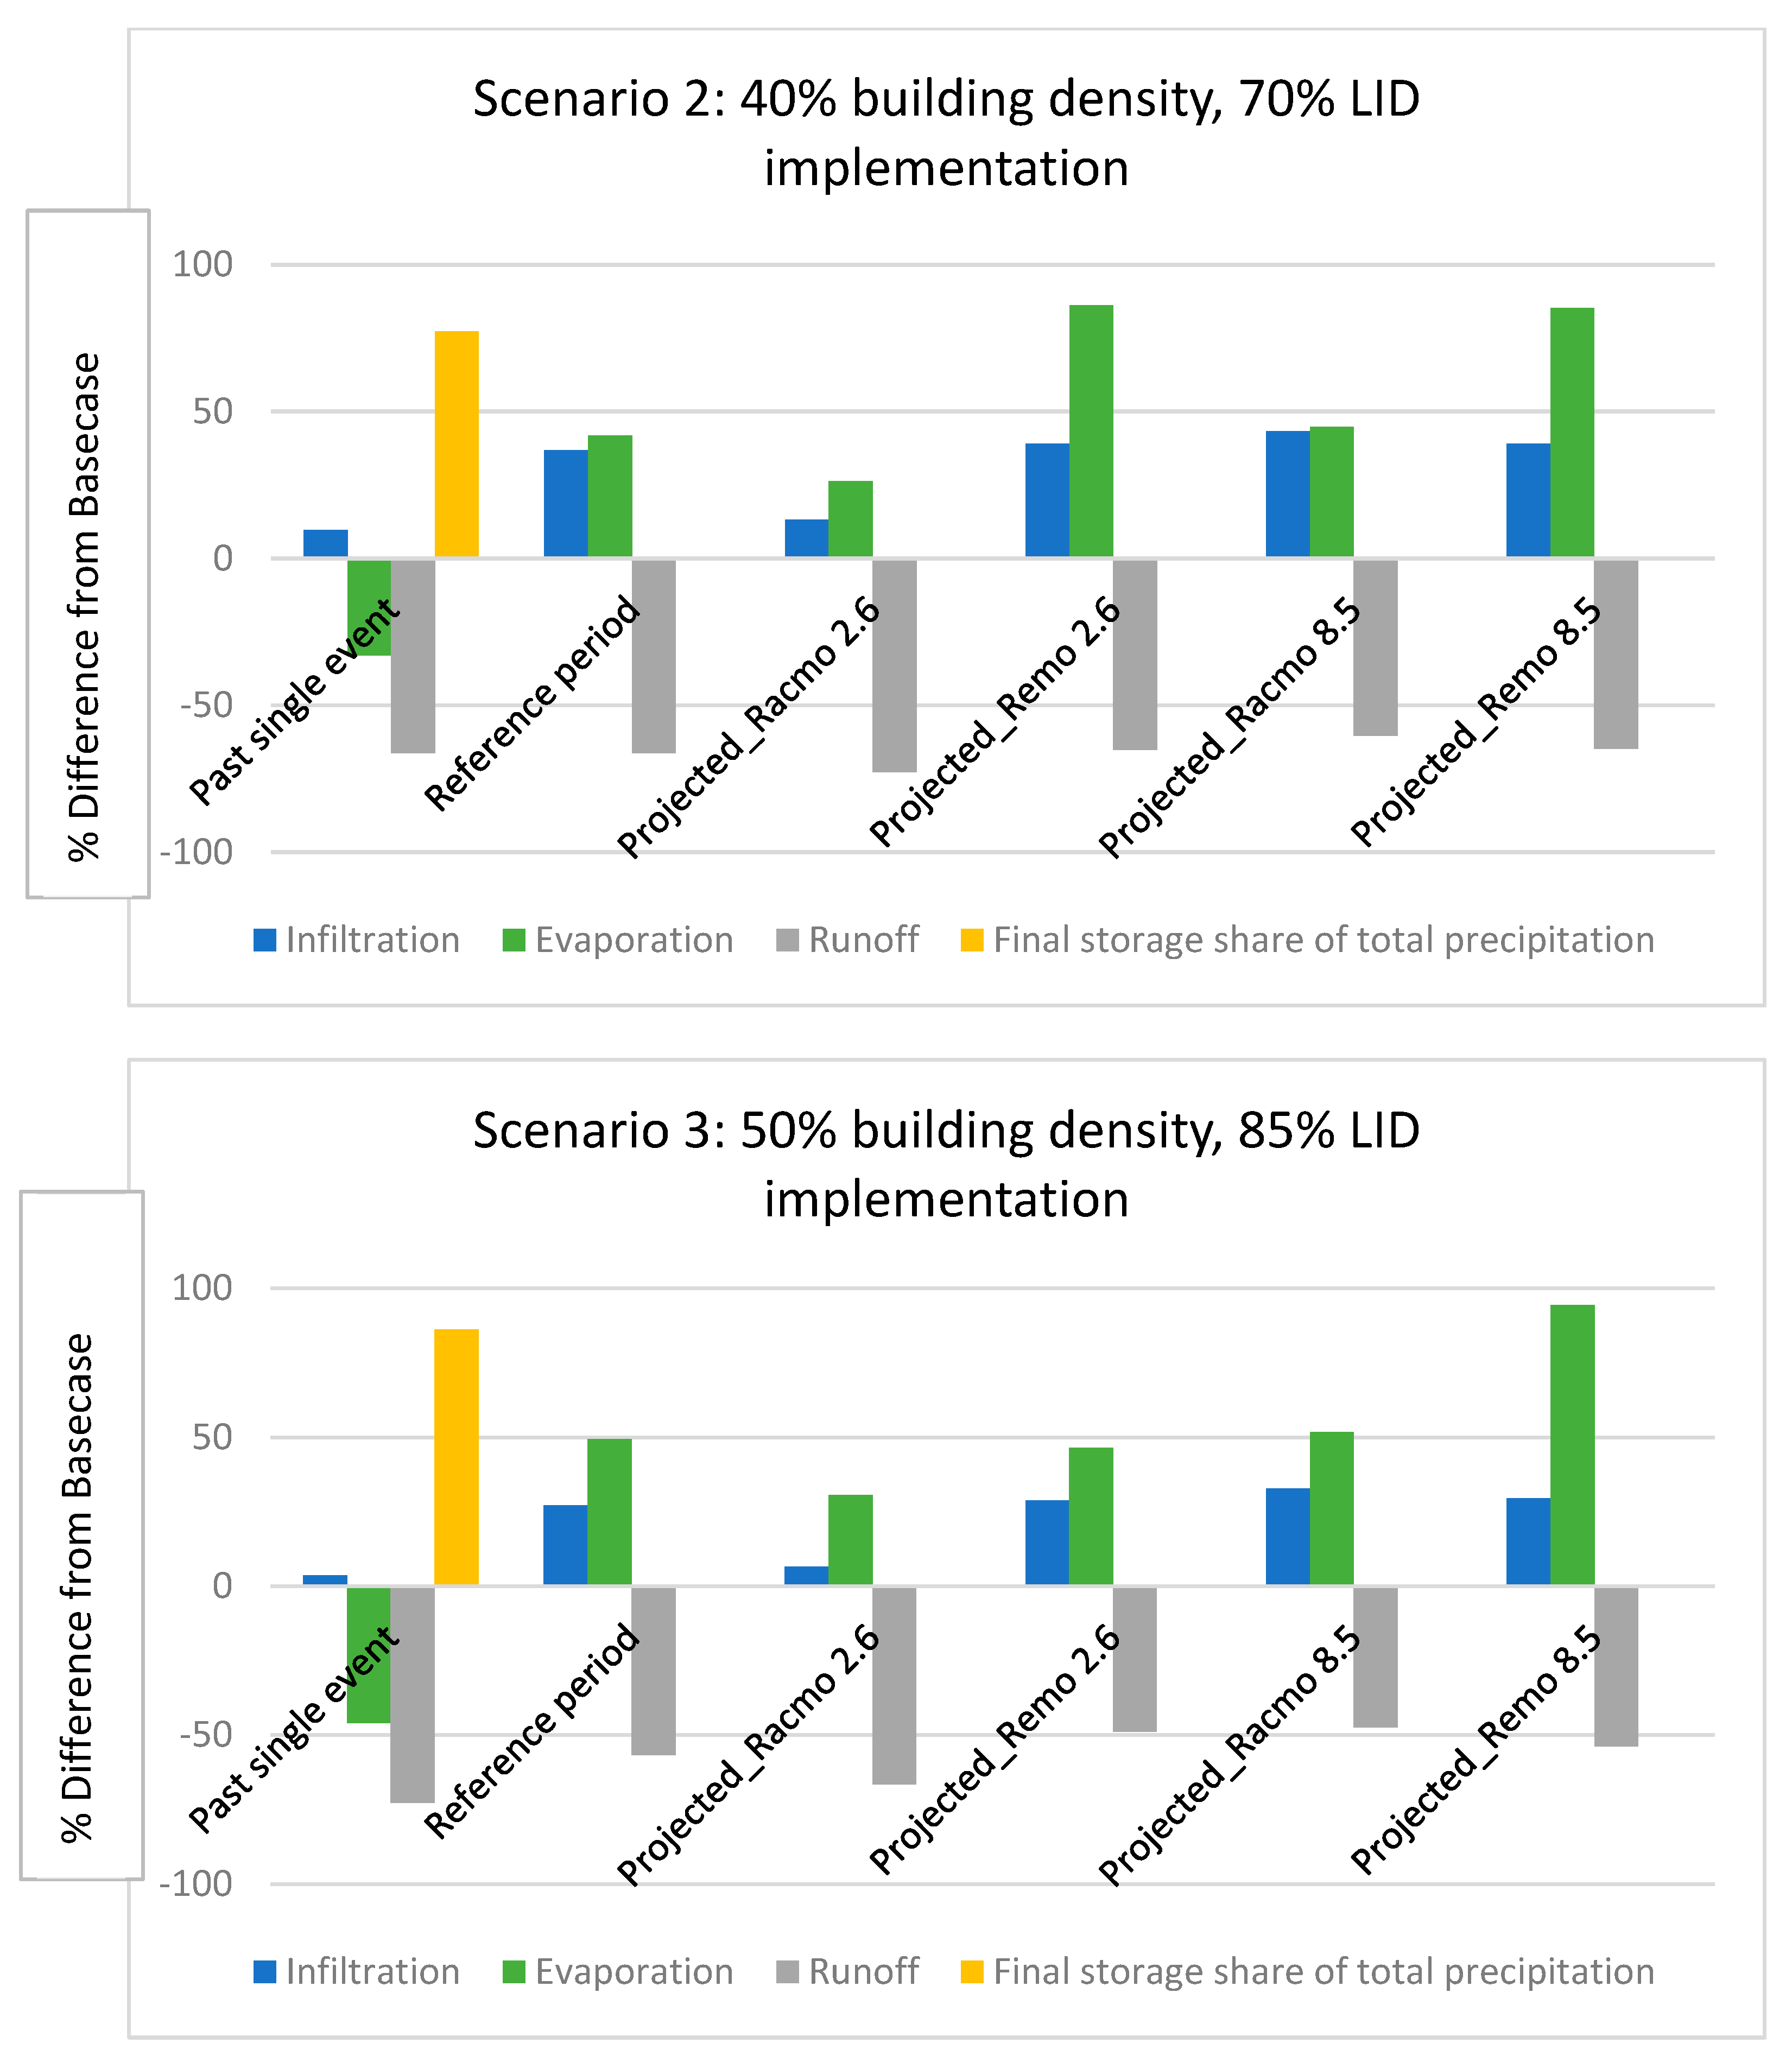
  • Design Scenario 2 (40% impervious area): Base Case vs. 70% LID implementation.
  • Design Scenario 3 (50% impervious area): Base Case vs. 85% LID implementation.
The most important result from all simulations was that when LID effectiveness for the different building densities was compared, Scenario 1 (highest building density) performed poorly compared to all other settings in Design Scenarios 2 and 3, even if the overall LID implementation percentage was higher than in settings during Scenarios 2 and 3. Further, results showed that building density had a larger impact on LID efficiency than climate change and the higher the building-density, the lower the impact LID controls had on the water balance. This was unexpected, but is an interesting finding, as ref. [75] also found that future socio-economic factors, such as rapid population growth and densification, had a higher impact on stormwater quality than climate change scenarios (RCP 2.6, RCP 8.5). As desired, Design Scenario 2 presented the highest effectiveness of LID implementation. With a LID implementation onto minimum 50 percent of available impervious area, for all three design scenarios effects of at least 28 percent in runoff-reduction, 32 percent infiltration increase, 22 percent evapotranspiration increase and an extremely broad range of zero to 7000 percent final storage increase was observed. Design scenario 2 performed best according to these results, with 40% impervious area, which was considered for LID implementation. Since only the Basecase, 50%- and 70% LID implementation were analyzed in this scenario, this study recommends a LID implementation of at least 50% for small-scale urban settlements that are designated for further densification. These findings are in a similar range to the ones by [52] who found optimal conditions for hydrological benefits through LID implementation for an Effective Impervious Area (EIA) reduction at 36%. Further, the results lie within a similar range as the ones presented by [30] who modeled a best-case scenario for green-roof, permeable pavement and raingarden implementation with >80% impervious area reduction, using simulated climate change data (RCP 8.5, return period T = 50) for single events. They obtained a surface runoff reduction of 51.8%, a storage increase of 308.5% and an infiltration increase of 43.9% compared to the “status quo scenario”.
As the efficiency of LIDs for stormwater management (volume and peak flow reduction) has been associated before with the level of imperviousness, the results from the single event (08/2001) concur with the finding of [76] that runoff reduction and peak flow reduction increase linearly with reduced imperviousness. The results from Design Scenarios 1 and 2 were equally good considering their impacts on the water balance reapproaching a natural state, when 50 percent LID control was implemented. As 70 percent LID implementation might not always present as a realizable method when it comes to competition for financial or areal resources, but rather represents a desired scenario for active climate adaption management, a setting with 50 percent LID implementation on at least 50 percent of available impervious area is recommendable to achieve satisfying results.

4.2. Results of Historic Timeseries

4.2.1. Single Event

Every past single event simulation presented a decrease in surface runoff and overall a positive impact on the hydrologic balance, meaning a tendency to the pre-development state was attained, compared to the Basecase. All simulations with LID implementation showed a relatively high share in final storage, increasing incrementally relative to the LID percentage implemented. This was anticipated, as water stored from a single precipitation event should be of use for the area in dry periods. This trend is accompanied by relatively low values of infiltration, as seepage into native soil is attained over the course of months and years. Evapotranspiration was computed based on average daytime temperatures, which “only” varied by +/−4 °C during the past single event as opposed to high variations from seasonal trends in a multiyear timeseries. Final storage is increased especially after single events and of use there and then. It is not stored within the LID controls over the course of years due to limitations in construction but is released as seepage into native soil or evapo(transpi)ration where possible. This way it can help to recover groundwater levels or decrease urban heat islands.

4.2.2. Multiyear Timeseries

Results of all the multiyear simulations demonstrated efficiency of LID implementation with increases in infiltration, evapotranspiration and storage, incrementally to the LID percentage implemented. The low final storage at the end of the entire 30-year period is reasonable and to be explained with a steady seepage into native soil (PP, BRC), which in SWMM5 means a “loss” in the storage layer, on the one hand. On the other hand, water is “lost” from storage due to surface evaporation (GR). These two components are however beneficial for the transformation towards a sponge city district as they forestall soils from drying up and urban heat islands from emerging due to insufficient humidity. The component “final storage” should therefore be seen more as an interim storage throughout the long timespan of 30 years.
Figures S1–S3 in the Supplementary Material show precipitation and temperature, storage, infiltration and evapotranspiration over the reference period (1961–1990). A maximum daytime average temperature of 28.2 °C (28 January 1976) and a maximum precipitation volume of 109.7 mm/d (9 August 1981) was detected. For all three design scenarios with varying building densities and maximum LID implementation percentage, the benefits regarding changes in the water balance presented themselves in the following order:
  • Runoff reduction
  • Evapotranspiration increase
  • Infiltration increase
  • Final storage increase/initial LID storage increase.
The results of the single- and multiyear historic timeseries were compared to other studies that analyzed short and long duration rainfall and event-based and continuous simulation [77]. The results from this study agree with the findings that, overall, LID provides a greater decrease in the rate of flood volume for short duration events compared to long durations. However, as the results from this study demonstrate different shifts for the water balance components in the single- and multiyear timeseries (i.e., infiltration, evaporation), the authors from this study do not agree with the conclusion that LID is in general better suited for event-based simulation. Rather, the findings from these studies suggest that a clear target needs to be defined prior to implementation of how LID (combinations) are intended to recover the hydrologic balance and a detailed catchment assessment is necessary, as proposed by [57] to evaluate these distinctions.

4.3. Results of Projected (Future) Timeseries

The results of the four multiyear simulations using projection data demonstrated the efficiency of LID implementation, incrementally to the LID percentage implemented. However, the results show distinct changes compared to the reference period. All four projections assume an increase in overall precipitation volume for the 30-year period in the far future. However, no increase in maximum daily precipitation volume compared to the reference period was observed. Maximum daytime average temperature increases in all four projections compared to the reference period, which causes an increase in evapotranspiration and a decrease in runoff reduction when LID is implemented. In almost all simulations with LID implementation, number one benefit in terms of water balance changes is the evapotranspiration increase. Also, there is more variance for the water balance components (WBC) between the simulations within each design scenario. While the simulations of the reference period presented results for WBC that varied in the range of ten percentage points at the max between the three design scenarios with maximum LID implementation percentage, results for the climate projection simulations vary by more than 70 percentage. For almost all simulations amongst the three design scenarios the benefits regarding changes in the water balance presented themselves in the following order:
  • Evapotranspiration increase
  • Runoff reduction
  • Infiltration increase
  • Final storage increase/initial LID storage increase.
As visible from Figure 5 and Figure 6, best results for the water balance were obtained for Design Scenario 2, considering building density comparison. The results display the impacts LID implementation could have on the water balance in the far future. Among the climate projection scenarios, the datasets originating from the RCM ReKliEs project yielded the most impressive results during simulation, attributable to their discrimination for temperature and precipitation intensity compared to the reference period. The RCP scenarios 2.6 and 8.5 are therefore presented in an exemplary way for all future scenarios simulated in this study.
For all future climate scenarios, a higher cumulative precipitation volume over the 30-year period and overall increases in infiltration, storage and evapotranspiration were observed under LID implementation. Evaluations of the maximum (single) precipitation events within the 30-year period can be found in the Supplementary Material (Figures S4–S13).
A significant increase in daily average temperature could be confirmed from the climate projections for the period “far future” (maximum: daytime average temperature of 33.15 °C for MPI-M-MPI-ESM-LR(r2)-MPI-CSC-REMO2009-ReKliEs, RCP 8.5). This could, on the one hand, offset the benefits of vegetative LID elements, as previous studies have shown how vegetation could suffer from drought stress in summer due to increasing evapotranspiration [78,79]. To compensate for these problems, deep substrates and a mixture of vegetation with diverse stress levels is advisable [25]. Unexpectedly, the climate projections contained no increase in maximum daily precipitation volume for the 15 km × 15 km grid cell around DWD station 1420. On the one hand, this can explain the reduced impact that LID has on surface runoff reduction for the 2071–2100 simulations—where there is less precipitation incoming, less needs to be diverted or stored. On the other hand, this explains partly why other components in the water balance need to increase (evapotranspiration). This finding also strengthens the basic assumption that future weather extremes are not only to be expected in the form of heavy rains and floods but also as long-lasting periods of no precipitation at all and therefore that analyzing the future local water balance in a holistic way is crucial.
As visible from Figure 1, no BRCs were implemented in Scenario 1 with maximum LID implementation. This was due to the presumption that their implementation might be impeded for reasons of space limitations in a scenario with 75% building density. Also, Scenario 1 did not perform as well as Scenarios 2 and 3 regarding infiltration. This is for the one hand ascribed to the fact that Scenario 2 had a higher overall LID implementation percentage, but on the other hand can also be traced back to the fact that BRCs play a major role in enhancing infiltration.
Further, the results of Scenario 2 and 3, as presented in the following figures, agree with the findings of [33] that implementing more area with LID is not necessarily more efficient. With differences of 10% in building density and differences of 15% in total LID implementation percentage, Scenario 3 still does not achieve higher infiltration and even less runoff reduction compared to Scenario 2. Rather, these results underline the adverse effects of increasing building density on the overall hydrological balance on the street-scale. Further, in a recent analysis based on a fictive study site, ref. [80] underscored the significance of strategic BRC placement and customization to improve the sustainable stormwater management practices in dense urban areas.
Comparing the procedures and results to other studies focusing on urban stormwater management with SWMM under the usage of climate projection data, this study used an acceptable data preprocessing approach when it comes to selecting GCM, RCM, downscaling and bias-correction (similar procedure: [81]). Also, the results from this study show similar trends regarding beneficial hydrological shifts through LID implementation in future climate settings. They lie within the range of others in terms of total runoff reductions as primary efficiency criterion for the LID implementation: [82] present a total decrease in inflow of 37%, in this study a total runoff reduction of 28–64% for the RCM 8.5 and 34–82% for the RCM 2.6 scenarios was observed.
The results show that per event, especially for maximum precipitation events, infiltration increases with the implementation of LID, independently from shifts in the water balance due to climate change (Figure 5). This is an important finding as on the other hand the results display that storage and evapotranspiration decrease per event in almost any simulation for the 70% LID implementation compared to the Basecase (historic and future scenarios), even though storage and evapotranspiration increase over the course of the 30-year period through LID implementation. This could partly be explained by the maximum storage volume of the subcatchments that is independent of the rainfall intensity.
With reference to our comprehensive presentation of results in the Supplementary Material, the recommendations for efficient future implementation of LIDs on a district-/street-scale of at least 40% and maximum 75% impervious area with similar local or micro-climate include:
  • At least 50% of available impervious area should be used for the implementation of LID elements to achieve a minimum of:
    • 28% in runoff reduction
    • 32% infiltration increase
    • 22% evapotranspiration increase
    • 0.02─7000% final storage increase.
  • Combination of different LIDs is more efficient than implementation of single LID element.
  • Heavy-rain prone and high-density residential regions benefit from an implementation strategy (highest to lowest %):
    • Permeable pavement (on food paths and cycle tracks)
    • Green roof (retrofitting on existing buildings, installation on new buildings)
    • Bioretention cell (where space allowances facilitate this).
  • Drought prone low-density residential regions benefit from an implementation strategy (highest to lowest %):
    • Green roof (retrofitting on existing buildings, installation on new buildings)
    • Bioretention cell
    • Permeable pavement (on food paths and cycle tracks).
  • Initial- and final storage through LIDs can mostly be achieved from single precipitation events and represents an interim storage. Long-lasting effects (multiyear timeseries) from LID implementation appear mostly as increases in infiltration and evapotranspiration and are thus rather important to counteract the Urban Heat Island (UHI) which intensifies through increases in building density. Both trends are vital components of the transformation of a local district towards a “sponge-city-district”.
According to the results, climate change can be responsible for changes in the efficiency of LID implementation regarding evapotranspiration rates and especially runoff reduction. Due to a distinct increase in daytime average temperature within the Frankfurt region, LID implementation will not be as efficient as it would have been during the reference period in terms of runoff reduction, even though the reduced impact relies partly on maximum precipitation events (mm/24 h) turning out less extreme in the case of our climate and geodata. This is clearly visible from the results. However, in terms of infiltration, climate change does not seem to negatively affect the efficiency of LID implementation on a single event basis, but rather increases in infiltration rates occurred in the simulations using the projection data compared to the reference period. Unresolved is the increase in evapotranspiration for the future multiyear simulations opposed to the historic level. It needs to be further investigated if the evapotranspiration increase is solemnly to be explained with the increases in temperature or if the LID implementation plays a role in this WBC shift.
Infiltration could however be increased under changing climate conditions despite the increase in daytime average temperatures. The role of LID implementation on increases in evapotranspiration, as a WBC, under changing climate is not sufficiently resolved at this point. However, the results clearly depicted the captivating role that building density increases play in assessing the question if LID solutions can still contribute positively to the water balance. The results of the GR and BRC performance in this study support the findings of [30] that, only through the high infiltration and storage capacity of engineered soil substrates can the total infiltration in the study location be higher than that of native soils, and thus can negative hydrological impacts in terms of runoff increase through additionally sealed area by buildings be limited. While implementation of PP on a larger scale may be limited due to increased traffic levels and environmental pollution, on a small-scale such as the street investigated in this context, it performed very well in directly reducing surface runoff and increasing infiltration. Ref. [33] also consider this a good choice for local governments due to its potential use for reconstruction in built-up areas. In their opinion, compounds such as Permeable interlocking concrete pavement (PICP) could be gradually applied to roads and parking lots, while GRs may be harder to implement in densely urbanized areas, especially in urban villages.

4.4. Further Discussion

As with any simulation, the consistency of input data strongly influences the accuracy of real runoff-, infiltration and evapotranspiration prediction. According to Patil and Chaudhary the most significant variables in a densely urbanized area are land use and land cover, which were not further specified in the study at hand due to the hypothetic approach [83].
Since a hypothetic study area was assessed, the model was not calibrated with historical data. Therefore, it is subject to discussion to which end an optimization of model parameters could simulate the hydrologic behavior more precisely. As soil moisture and rainfall are both variables diversifying in time and space it is especially difficult to set initial conditions of the model for the hypothetic study site. Further, the model possessed no routing/hydraulics, in terms of a sewerage system, for the LID elements which would take into account retention, overflow and more precise results for infiltration. This is planned for a follow-up study with real-world data of the study location. For the past timeseries a so-called “warm-up period” is certainly beneficial and could have been chosen with one precipitation event out of the 30-year timeseries as the single event and the years ahead could have been used within the 30 years as “warm up period”. For simulations of the far future, however, it is even more difficult to identify accurate distributions of rainfall and initial soil moisture, and this may increase the uncertainties of the hydrological model outputs [84,85]. For reasons of comparability, setting a warm-up period is only useful if done so for both timeframes.
Also, the SWMM5 engine assumes constant rainfall values over each following time interval for user-entered time series [86]. In the case of precipitation events that increase in intensity and frequency in the future, this can lead to imprecise results in the water balance assessment and the analysis of flow stability, if the reporting- and wet weather timestep are not considered accordingly because peaks and valleys that are computed from the timeseries may be missed.

4.4.1. Plausibility/Likelihood of Predicted Precipitation Events

The simulation outcomes of the past timeseries are plausible and acceptable, as measured rainfall data was used. Results from climate model projections, however, are generally fraught with uncertainty [87]. This is due to practical as well as scientific reasons, such as the need for longer time series for a backed trend-identification and the fact that a lot of extreme events occur on a very small spatial scale where meteorological measurement is insufficiently constituted [60]. Further, precipitation changes are not homogeneously distributed spatially [88].
The final report of the BMVI Expertennetzwerk [66] evaluated the climate model data used for the projections before the bias-adjustment and drew the following conclusions for the RCMs RACMO and REMO analysed also in this study:
  • RACMO shows a slight underestimation of all precipitation percentiles regardless of the GCM used. The type of distribution is very similar to that of the HYRAS data set (reference period).
  • REMO shows a good conformity with HYRAS mean values, however aberrations are way too high.
In 2020, the Bavarian State Office for the Environment (neighboring federal state of the selected study area in south Germany) also evaluated the plausibility of the climate projection data used in the DWD ensemble [88]. Even though they analysed older datasets from 2009 and 2015 (which have been updated by now) their rating is important for the conclusions of our analysis:
  • RACMO shows deviances in annual dynamics compared to the reference period.
  • REMO showed significant “precipitation drifting” (divergence between reference and projection data) on a regional and local scale. For a larger scale like median values for Bavaria, however, the REMO-projections could still be used.
Even though the bias-adjustment could correct those problems for the climate variables precipitation and temperature, the findings above should be considered for the evaluation of the results of our study.

4.4.2. Holistic Water Balance Assessment for Analysis of Efficiency of LID Controls

One inveterate obstacle in developing a Sponge City model in general, and with SWMM5 especially could be the fact that due to land use changes and climate change the water yield no longer presents a constant in the hydrologic balance for regional assessment.
A further congestion of rural areas is not reconcilable with changes in the hydrologic cycle that occur due to climate change. Results from the Basecase simulations of Scenario 1 have illustrated this—95% from the past single- and 74% from the 30-year timeseries incoming water is transferred to surface runoff. Also, certain LID elements are directly influenced by man-made landscape features and only installable on specific urban fabrics: green roofs, for example, require suitable rooftops, permeable pavement is preferred for areas of low traffic [62,89]. Also, unexpected results in LID performance (for example one LID performs better then another, even though the implementation percentage is lower) can occur from differences in LID parameters such as more diffuse spatial patterns or a higher infiltration and storage capacity of engineered soil substrates compared to native soils. Performing a sensitivity analysis can provide a better understanding of such results.
As ref. [28] point out, there certainly exist some integrated models to evaluate urban water resources management (such as SWMM5), but there is room for development of integrated models for Sponge City [90]. First approaches of combining GIS and SWMM5 through GISWATER exist [91].
One needs to keep in mind that, even with the positive results of simulations and models such as this and real study site ones pledging a high efficiency of SCPs, they might fail to deliver to their full potential due to ad-hoc planning and implementation [92]. It has been a well-accepted fact that the selection of LID measures needs to correspond to local characteristics and a project’s target [37]. Therefore, the implementation of SCPs needs to be part of an integrative and interactive process for all stakeholders from the very start. Users of results of this efficiency analysis need to decide in advance if they want to consider a worst-case scenario (RCP 8.5, severe building density increase) or a climate protection scenario (RCP 2.6, redensification through, e.g., the addition of stories on already existing buildings) when planning adaption strategies and measurements such as the implementation of Low Impact Development. After all, ref. [93] found that using small-scale LID installations tends to be more cost-effective than using large-scale LIDs.

5. Conclusions and Outlook

5.1. Conclusions

As extreme events will increase in frequency and intensity, changes to our current urban water management are vital to society and economy, especially in areas with high building density. Since densification occurs in Hesse especially in residential areas with single-family homes, this also means that as base estimates, fundamental tendencies regarding LID efficiency under building density increase can be insightful and helpful. As numerous heavy rain events have shown in the past and current timeframe, cities within the Mid-European climate zone are generally not well prepared for future changes in the hydrologic cycle and traditional, grey, infrastructure is not sufficiently resilient when it comes to extreme droughts or flooding [94,95]. The results presented in this study underscore the efficiency of redevelopment measures and support previous studies regarding the potential to address both causes and consequences of climate change. Positive effects of LID implementation could be simulated upon the water balance at urban district level for every building-density Scenario (1–3) of historic and future timeseries. This shows that even if building-density increases in the future, LID-implementation strategies remain an effective measure to counteract the disadvantages for the urban water balance. The efficiency of the LID controls increased incrementally with the overall implementation percentage and partly with a decrease in building density. Recommendations were deduced for future LID implementation in urban regions with varying building density percentages. However, what counts as effective depends on the perspectives and needs of those involved and concept-specific metrics need to be mapped out.

5.2. Outlook

Practical tools to simulate the effects of redensification on climate protection and climate adaption have been developed in the field of architecture and city planning. The Collaborative Design Platform (CDP) simulates changes in greenhouse gas emissions, energy demand and micro-climate when analog interventions within a virtual development are carried out [1]. Similarly, such analyses and consequential adaptions strategies should be applied in the field of urban hydrology to counteract or at least embank irreversible effects on the water balance through increases in building density under changing climate. The construction of a unique simulation software, which combines simulation of hydrologic processes and their interference with the operation of GI and compensates for shortcomings of SWMM5 on the topic, could promote the understanding and implementation of SCPs.
If integrated models for sponge cities exist, including all hydrological vital input data and process visualizations, the performance of GI can be identified on further spatial scales.
There are no final propositions regarding the extent of climatic changes which is why adaption strategies can only be implemented based on the spectrum of preferably all available model simulations. Also, as the approach presented here remains explorative, it allows for a more nuanced view by which to investigate the reasons of how and why LID efficiency is affected by redensification and climate change. Follow-up studies should, therefore, include entire ensembles of climate projection data and real-world topographical data for calibration to provide even better courses of action.

Supplementary Materials

The following supporting information can be downloaded at: https://www.mdpi.com/article/10.3390/hydrology12080200/s1.

Author Contributions

Conceptualization, B.S. and H.S.; methodology, H.S.; software, H.S.; validation, B.S. and H.S.; formal analysis, B.S. and H.S.; investigation, B.S. and H.S.; resources, H.S.; data curation, H.S.; writing—original draft preparation, H.S.; writing—review and editing, B.S. and H.S.; visualization, H.S.; supervision, B.S.; project administration, B.S. All authors have read and agreed to the published version of the manuscript.

Funding

This research received no external funding.

Data Availability Statement

All research data is provided and linked within the Supplementary Material.

Conflicts of Interest

The authors declare no conflicts of interest.

Abbreviations

The following abbreviations are used in this manuscript:
BGIBlue-Green-Infrastructure
BCBase Case
BRCBioretention Cell
GRGreen Roof
LIDLow Impact Development
PPPermeable Pavement
RCPRepresentative Concentration Pathway
SCPSponge City Practice
SWMMStormwater Management Model

References

  1. Zentrum für Stadtnatur und Klimaanpassung (ZSK). Nachverdichtung im Kontext des Klimawandels–Schlussbericht. 2022. Available online: https://www.zsk.tum.de/fileadmin/w00bqp/www/PDFs/2022.12.20-_NV_Schlussbericht_barr.pdf (accessed on 28 July 2025).
  2. Kabisch, N.; Horn, H.; Stadler, J.; Bonn, A. Nature-Based Solutions to Climate Change Adaption in Urban Areas; Springer International Publishing: Cham, Switzerland, 2017; pp. 1–11. [Google Scholar] [CrossRef]
  3. Pauleit, S.; Ennas, R.; Golding, Y. Modeling the environmental impacts of urban land use and land cover change—A study in Merseyside, UK. Landsc. Urban Plan. 2005, 71, 295–310. [Google Scholar] [CrossRef]
  4. City of Frankfurt, Main. Department of Planning and Living (Dezernat IV—Planen und Wohnen). 2021. Available online: https://www.stadtplanungsamt-frankfurt.de/show.php?ID=20549&psid=qrog9v59mao3s9fgf9vdnbr2b1 (accessed on 9 November 2024).
  5. Emilsson, T.; Ode Sang, Å. Impacts of Climate Change on Urban Areas and Nature-based Solutions for Adaption. In Nature-Based Solutions to Climate Change Adaptation in Urban Areas; Kabisch, N., Korn, H., Stadler, J., Bonn, A., Eds.; Theory and Practice of Urban Sustainability Transitions; Springer: Berlin/Heidelberg, Germany, 2017. [Google Scholar] [CrossRef]
  6. Paul, S.; Ghosh, S.; Mathew, M.; Devanand, A.; Karmakar, S.; Niyogi, D. Increased Spatial Variability and Intensification of Extreme Monsoon Rainfall due to Urbanization. Sci. Rep. 2018, 8, 3918. [Google Scholar] [CrossRef] [PubMed]
  7. Li, Y.; Schubert, S.; Kropp, J.P.; Rybski, D. On the influence of density and morphology on the Urban Heat Island intensity. Nat. Commun. 2020, 11, 2647. [Google Scholar] [CrossRef] [PubMed]
  8. Loibl, W.; Vuckovic, M.; Etminan, G.; Ratheiser, M.; Tschanett, S.; Österreicher, D. Effects of Densification on Urban Microclimate—A Case Study for the City of Vienna. Atmosphere 2021, 12, 511. [Google Scholar] [CrossRef]
  9. Liu, J.; Niyogi, D. Meta-analysis of urbanization impact on rainfall modification. Sci. Rep. 2019, 9, 7301. [Google Scholar] [CrossRef]
  10. Mhyre, G.; Alterskjær, K.; Stjern, C.W.; Hodnebrog, Ø.; Marelle, L.; Samset, B.H.; Sillmann, J.; Schaller, N.; Fischer, E.; Schulz, M.; et al. Frequency of extreme precipitation increases extensively with event rareness under global warming. Sci. Rep. 2019, 9, 16063. [Google Scholar] [CrossRef]
  11. Ionita, M.; Nagavciuc, V.; Scholz, P.; Dima, M. Long-term drought intensification over Europe driven by the weakening trend of the Atlantic Meridional Overturning Circulation. J. Hydrol. Reg. Stud. 2022, 42, 101176. [Google Scholar] [CrossRef]
  12. Büntgen, U.; Urban, O.; Krusic, P.J.; Rybníček, M.; Kolář, T.; Kyncl, T.; Ač, A.; Koňasová, E.; Čáslavský, J.; Esper, J.; et al. Recent European drought extremes beyond Common Era background variability. Nat. Geosci. 2021, 14, 190–196. [Google Scholar] [CrossRef]
  13. City of Frankfurt, Main. Adaption Strategy of Frankfurt, Main 2.0 Department for Climate, Environment and Women. 2022. Available online: https://energiemanagement.stadt-frankfurt.de/Service/Dokumente/Anpassungsstrategie-Klimawandel.pdf (accessed on 9 November 2024).
  14. General Association of the Insurers (Gesamtverband der Versicherer, GDV). Study on Sealing Degrees: Ludwigshafen Is the City in Germany with the Highest Degree of Sealed Surfaces. Updated 2023. 2021. Available online: https://www.gdv.de/gdv/medien/medieninformationen/versiegelungsstudie-ludwigshafen-ist-die-am-staerksten-versiegelte-stadt-in-deutschland--133126 (accessed on 9 November 2024).
  15. Oral, H.V.; Carvalho, P.; Gajewska, M.; Usino, N.; Masi, F.; van Hullebusch, E.D.; Kazak, J.K.; Exposito, A.; Cipolletta, G.; Andersen, T.R.; et al. A review of nature-based solutions for urban water management in European circular cities: A critical assessment based on case studies and literature. Blue-Green Syst. 2020, 2, 112–136. [Google Scholar] [CrossRef]
  16. Cheng, S.; Wang, R. An approach for evaluating the hydrological effects of urbanization and its application. Hydrol. Process. 2002, 16, 1403–1418. [Google Scholar] [CrossRef]
  17. Burns, D.; Vitvar, T.; McDonnell, J.; Hassett, J.; Duncan, J.; Kendall, C. Effects of suburban development on runoff generation in the Croton River basin, New York, USA. J. Hydrol. 2005, 311, 266–281. [Google Scholar] [CrossRef]
  18. Jang, S.; Cho, M.; Yoon, J.; Yoon, Y.; Kim, S.; Kim, G.; Kim, L.; Aksoy, H. Using SWMM as a tool for hydrologic impact assessment. Desalination 2007, 212, 344–356. [Google Scholar] [CrossRef]
  19. Guan, M.; Sillanpää, N.; Koivusalo, H. Modelling and assessment of hydrological changes in a developing urban catchment. Hydrol. Process. 2015, 29, 2880–2894. [Google Scholar] [CrossRef]
  20. Pour, H.S.; Wahab, A.K.A.; Shahid, S.; Asaduzzaman, M.; Dewan, A. Low impact development techniques to mitigate the impacts of climate-change-induced urban floods: Current trends, issues and challenges. Sustain. Cities Soc. 2020, 62, 102373. [Google Scholar] [CrossRef]
  21. Pyke, C.; Warren, M.P.; Johnson, T.; LaGro, J.; Schargenberg, J.; Groth, P.; Freed, R.; Schroeer, W.; Main, E. Assessment of low impact development for managing stormwater with changing precipitation due to climate change. Landsc. Urban Plan. 2011, 103, 166–173. [Google Scholar] [CrossRef]
  22. Wang, M.; Feng, S.; Ikram, R.M.A.; Chen, T.; Sun, C.; Chen, B.; Rao, Q.; Jin, H.; Li, J. Assessing the Performance and Challenges of Low-Impact-Development under Climate-Change: A Bibliometric Review. Sustainability 2023, 15, 13616. [Google Scholar] [CrossRef]
  23. Zhou, Q.; Leng, G.; Huang, M. Impacts of future climate change on urban flood volumes in Hohhot in northern China: Benefits of climate change mitigation and adaptions. Hydrol. Earth Syst. Sci. 2018, 22, 305–316. [Google Scholar] [CrossRef]
  24. Seddon, N.; Chausson, A.; Berry, P.; Girardin, C.A.J.; Smith, A.; Turner, B. Understanding the value and limits of nature-based solutions to climate change and other global challenges. Philos. Trans. R. Soc. B 2020, 375, 1794. [Google Scholar] [CrossRef]
  25. Sohn, W.; Kim, J.; Li, M.; Brown, R. The influence of climate on the effectiveness of low impact development: A systematic review. J. Environ. Manag. 2019, 236, 365–379. [Google Scholar] [CrossRef]
  26. Almaaitah, T.; Appleby, M.; Rosenblat, H.; Drake, J.; Joksimovic, D. The potential of Blue-Green Infrastructure as a climate change adaption strategy: A systematic literature review. Blue-Green Syst. 2021, 3, 223–248. [Google Scholar] [CrossRef]
  27. Eckart, K.; McPhee, Z.; Bolisetti, T. Performance and implementation of low impact development—A review. Sci. Total Environ. 2017, 607–608, 413–432. [Google Scholar] [CrossRef]
  28. Luo, P.; Zha, X.; Zhu, W.; Wang, S.; Lyu, J.; Zhou, M.; Huo, A.; Wang, Z. A bibliometric analysis of the research on Sponge City: Current situation and future development direction. Ecohydrology 2021, 14, 7. [Google Scholar] [CrossRef]
  29. Qin, Y. Urban Flooding Mitigation Techniques: A Systematic Review and Future Studies. Water 2020, 12, 3579. [Google Scholar] [CrossRef]
  30. Rosenberger, L.; Leandro, J.; Pauleit, S.; Erlwein, S. Sustainable stormwater management under the impact of climate change and urban densification. J. Hydrol. 2021, 596, 126137. [Google Scholar] [CrossRef]
  31. Dietz, M.E. Low Impact Development Practices: A Review of Current Research and Recommendations for Future Directions. Water Air Soil Pollut. 2007, 186, 351–363. [Google Scholar] [CrossRef]
  32. Erlwein, S.; Zölch, T.; Pauleit, S. Regulating the microclimate with urban green in densifying cities: Joint assessment on two scales. Build. Environ. 2021, 205, 108233. [Google Scholar] [CrossRef]
  33. Wu, J.; Yang, R.; Song, J. Effectiveness of low-impact development for urban inundation risk mitigation under different scenarios: A case study in Shenzhen. China Nat. Hazards Earth Syst. Sci. 2018, 18, 2525–2536. [Google Scholar] [CrossRef]
  34. Zhai, J.; Ren, J.; Xi, M.; Tang, X.; Zhang, Y. Multiscale watershed landscape infrastructure: Integrated system design for sponge city development. Urban For. Urban Green. 2021, 60, 127060. [Google Scholar] [CrossRef]
  35. Zhu, Y.; Xu, C.; Yin, D.; Xu, J.; Wu, Y.; Jia, H. Environmental and economic cost-benefit comparison of sponge city construction in different urban functional regions. J. Environ. Manag. 2022, 304, 114230. [Google Scholar] [CrossRef]
  36. Versini, P.-A.; Ramier, D.; Berthier, E.; de Gouvello, B. Assessment of the hydrological impacts of green roof: From building scale to basin scale. J. Hydrol. 2015, 524, 562–575. [Google Scholar] [CrossRef]
  37. Ruangpan, L.; Vojinovic, Z.; Di Sabatino, S.; Leo, L.S.; Capobiano, V.; Oen, A.M.P.; McClain, M.E.; Lopez-Gunn, E. Nature-based solutions for hydro-meteorological risk reduction: A state-of-the-art review of the research area. Nat. Hazards Earth Syst. Sci. 2020, 20, 243–270. [Google Scholar] [CrossRef]
  38. Qin, H.; Li, Z.; Fu, G. The effects of low impact development on urban flooding under different rainfall characteristics. J. Environ. Manag. 2013, 129, 577–585. [Google Scholar] [CrossRef]
  39. Suresh, A.; Pekkat, S.; Subbiah, S. Quantifying the efficacy of Low Impact Developments (LIDs) for flood reduction in micro-urban watersheds incorporating climate change. Sustain. Cities Soc. 2023, 95, 104601. [Google Scholar] [CrossRef]
  40. Jehling, M.; Schorcht, M.; Hartmann, T. Densification in suburban Germany: Approaching policy and space through concepts of justice. Town Plan. Rev. 2020, 91, 217–237. [Google Scholar] [CrossRef]
  41. Chan, F.; Griffiths, J.A.; Higgitt, D.; Xu, S.; Zhu, F.; Tang, Y.; Xu, Y.; Thorne, C.R. “Sponge City” in China—A breakthrough of planning and flood risk management in the urban context. Land Use Policy 2018, 76, 772–778. [Google Scholar] [CrossRef]
  42. Hou, X.; Guo, H.; Wang, F.; Li, M.; Xue, X.; Liu, X.; Zeng, S. Is the sponge city construction sufficiently adaptable for the future stormwater management under climate change? J. Hydrol. 2020, 588, 125055. [Google Scholar] [CrossRef]
  43. Jiang, A.Z.; McBean, E.A. Sponge City: Using the “One Water” Concept to Improve Understanding of Flood Management Effectiveness. Water 2021, 13, 583. [Google Scholar] [CrossRef]
  44. Suja, R.; Sedhan, A.; Rajalakshmi, C.R. Effectiveness of Permeable Pavements and Vegetative Swales for developing Sponge Cities. Water Resour. Manag. 2021. under revision. [Google Scholar] [CrossRef]
  45. Liu, F.; Chen, Y.; Tan, Y.; Cheng, Q.; Lyu, F.; Liu, L.; Su, Y.; Yuan, S.; Xiao, W.; Liu, Z. Hydrological reduction and control effect evaluation of sponge city construction based on one-way coupling model of SWMM-FVCOM: A case in university campus. J. Environ. Manag. 2024, 349, 119599. [Google Scholar] [CrossRef]
  46. Akter, T.; Quevauviller, P.; Eisenreich, S.J.; Vaes, G. Impacts of climate change and land use changes on flood risk management for the Schijn River, Belgium. Environ. Sci. Policy 2018, 89, 163–175. [Google Scholar] [CrossRef]
  47. Kemp-Benedict, E.; Heaps, C.; Raskin, P. Global Scenario Group Futures. Technical Notes; Polestar Series Report No. 9; Stockholm Environment Institute: Stockholm, Sweden, 2002; Available online: https://www.gsg.org/documents/GSGFutures_TechDoc.pdf (accessed on 9 November 2024).
  48. United Nations, World Urbanization Prospects, the 2011 Revision. United Nations Department of Economic and Social Affairs, Population Division. 2012. Available online: https://www.un.org/en/development/desa/population/publications/pdf/urbanization/WUP2011_Report.pdf (accessed on 9 November 2024).
  49. Jones Lang LaSalle (JLL), Research. Climate Risks in German cities—Challenges Through Climate Changes in Urban Areas: Risk, Resilience and Adaption 2024. Available online: https://www.jll.de/de/trends-and-insights/research/klimarisiken-in-deutschen-staedten (accessed on 9 November 2024).
  50. Ekmdaekciouglu, Ö.; Yilmaz, M.; Özger, M.; Tosunoglu, F. Investigation of the low impact development strategies for highly urbanized area via auto-calibrated Storm Water Management Model (SWMM). Water Sci. Technol. 2021, 84, 2194. [Google Scholar] [CrossRef]
  51. Sadeghi, F.; Rubinato, M.; Goerke, M.; Hart, J. Assessing the Performance of LISFLOOD-FP and SWMM for a Small Watershed with Scarce Data Availability. Water 2022, 14, 748. [Google Scholar] [CrossRef]
  52. Palla, A.; Gnecco, I. Hydrologic modeling of Low Impact Development systems at the urban catchment scale. J. Hydrol. 2015, 528, 361–368. [Google Scholar] [CrossRef]
  53. HVBG (Hessische Verwaltung für Bodenmanagement und Geoinformation), Geodaten Online. Available online: https://gds.hessen.de/INTERSHOP/web/WFS/HLBG-Geodaten-Site/de_DE/-/EUR/Default-Start (accessed on 17 July 2024).
  54. Jeffers, S.; Garner, B.; Hidalgo, D.; Daoularis, D.; Warmerdam, O. Insights into green roof modeling using SWMM LID controls for detention-based designs. J. Water Manag. Model. 2022, 1, C484. [Google Scholar] [CrossRef]
  55. McCoutcheon, M.; Wride, D. Shades of Green: Using SWMM LID Controls to Simulate Green Infrastructure. J. Water Manag. Model. 2013, 15, R246-15. [Google Scholar] [CrossRef]
  56. Rossman, L.; Huber, W. Storm Water Management Model Reference Manual Volume I; EPA/600/R-15/162A; Hydrology U.S. EPA Office of Research and Development: Washington, DC, USA, 2015. Available online: https://cfpub.epa.gov/si/si_public_record_report.cfm?Lab=NRMRL&dirEntryId=309346 (accessed on 17 July 2024).
  57. Hewa, G.A.; Hossain, S.; Wella-Hewage, S. A Comparison of Continuous and Event-Based Rainfall–Runoff (RR) Modelling Using EPA-SWMM. Water 2019, 11, 611. [Google Scholar] [CrossRef]
  58. Linke, C.; Zimmer, M. Leitlinien zur Interpretation regionaler Klimamodelldaten des Bund-Länder-Fachgespräches “Interpretation Regionaler Klimamodelldaten”, Potsdam. 2023. Available online: https://lfu.brandenburg.de/sixcms/media.php/9/Leitlinien-Klimamodelldaten.pdf (accessed on 17 July 2024).
  59. Deutscher Wetterdienst (DWD). Messnetzkarten (Meteorological Network Maps), Germany’s National Meteorological Service. 2024. Available online: https://www.dwd.de/DE/leistungen/klimadatendeutschland/messnetzkarten.html?lsbId=343278 (accessed on 17 July 2024).
  60. Pfahl, S.; O’Gorman, P.A.; Fischer, E.M. Understanding the regional pattern of projected future changes in extreme precipitation. Nat. Clim. Change 2017, 7, 423–427. [Google Scholar] [CrossRef]
  61. Deutscher Wetterdienst (DWD). Decadal Climate Predictions, Germany’s National Meteorological Service. 2024. Available online: https://www.dwd.de/EN/climate_environment/climateresearch/climateprediction/decadalprediction/decadalprediction_node.html;jsessionid=DAFBCF243664D221D6A1E1A7C3A41136.live11044 (accessed on 17 July 2024).
  62. Tennis, P.D.; Leming, M.L.; Akers, D.J. Pervious Concrete Pavements Technical Report; Portland Cement Association, Skokie, Illinois, and National Ready Mixed Concrete Association: Silver Spring, MD, USA, 2004; 36p, Available online: https://www.researchgate.net/publication/242722509_Pervious_Concrete_Pavements (accessed on 17 July 2024).
  63. Bhaduri, B.; Minner, M.; Tatolvich, S.; Harbor, J. Long-Term Hydrologic Impact of Urbanization: A Tale of Two Models. J. Water Ressour. Plan. Manag. 2021, 127, 1. [Google Scholar] [CrossRef]
  64. Trewin, B.C. The Role of Climatological Normals in a Changing Climate. World Meteorological Organization WMO/TD No. 1377. 2007. Available online: https://www.google.com/url?sa=i&url=https%3A%2F%2Fwww.researchgate.net%2Fprofile%2FKrastina-Malcheva%2Fpost%2FCalculating_monthly_rainfall_anomaly_when_only_some_months_are_normally_distributed%2Fattachment%2F5cde28b7cfe4a7968da090bc%2FAS%253A759386620305410%25401558063287555%2Fdownload%2FWCDMPNo61_1.pdf&psig=AOvVaw3jl31yInI7LF3AwFIA5YgM&ust=1707645533741000&source=images&cd=vfe&opi=89978449&ved=0CAgQrpoMahcKEwiQ4OrXwaCEAxUAAAAAHQAAAAAQBA (accessed on 17 July 2024).
  65. Deutscher Wetterdienst (DWD). Kernensemble (Core Ensemble) Germany’s National Meteorological Service. 2024. Available online: https://www.dwd.de/ref-ensemble (accessed on 17 July 2024).
  66. Brienen, S.; Walter, A.; Brendel, C.; Fleischer, C.; Ganske, A.; Haller, M.; Helms, M.; Höpp, S.; Jensen, C.; Jochumsen, K.; et al. Klimawandelbedingte Änderungen in Atmosphäre und Hydrosphäre: Schlussbericht des Schwerpunktthemas Szenarienbildung (SP-101) im Themenfeld 1 des BMVI-Expertennetzwerks; appeared in print within subject area 1 of the “BMVI Experts Network”; BMVI: Berlin, Germany, 2020; Available online: https://doi.bafg.de/BfG/2020/ExpNBS2020.2020.02.pdf (accessed on 28 July 2025).
  67. IPCC. Climate Change 2014: Synthesis Report. In Contribution of Working Groups I, II and III to the Fifth Assessment Report of the Intergovernmental Panel on Climate Change; Core Writing Team, Pachauri, R.K., Meyer, L.A., Eds.; IPCC: Geneva, Switzerland, 2014; 151p, Available online: https://www.ipcc.ch/report/ar5/syr/ (accessed on 17 July 2024).
  68. Deutscher Wetterdienst (DWD) Hinweise zur Nutzung von Klimaprojektionen für Deutschland, Germany’s National Meteorological Service. 2024. Available online: https://www.dwd.de/DE/klimaumwelt/klimaforschung/klimaprojektionen/fuer_deutschland/fuer_dtld_nutzungshinweis_node.html (accessed on 17 July 2024).
  69. Nilson, E.; Krahe, P. Deutschlands Wasserbilanz. UmweltMagazin 2021, 51, 32–35. [Google Scholar] [CrossRef]
  70. Bremicke, M. Das Wasserhaushaltsmodell LARSIM-Modellgrundlagen und Anwendungsbeispiele. Freibg. Schriften Zur Hydrol. 2000, 11, 57–59. Available online: https://www.hydrology.uni-freiburg.de/publika/FSH-Bd11-Bremicker.pdf (accessed on 17 July 2024).
  71. Vidya, K.N. Runoff assessment by Storm water management model (SWMM)—A new approach. J. Appl. Nat. Sci. 2021, 13, 142–148. [Google Scholar] [CrossRef]
  72. Davis, A.P.; Hunt, W.F.; Traver, R.G.; Clar, M. Bioretention Technology: Overview of Current Practice and Future Needs. J. Environ. Eng. 2009, 135, 109–117. [Google Scholar] [CrossRef]
  73. Optigrün International. Das Optigrün-Schrägdach (Optigrün Slanted Roof). Available online: https://www.optigruen.de/systemloesungen/schraegdach/uebersicht-schraegdach (accessed on 9 November 2024).
  74. Huber, W.; Cannon, L. Modeling non-directly connected impervious areas in dense neighborhoods. In Proceedings of the 9th International Conference on Urban Drainage, Portland, OR, USA, 8–13 September 2002; Available online: https://cfpub.epa.gov/si/si_public_record_Report.cfm?Lab=NRMRL&dirEntryID=62453 (accessed on 26 September 2024).
  75. Borris, M.; Leonhardt, G.; Marsalek, J.; Österlund, H.; Viklander, M. Source-Based Modeling of Urban Stormwater Quality Respose to the Selected Scenarios Combining Future Changes in Climate and Socio-Economic Factors. Environ. Manag. 2016, 58, 223–237. [Google Scholar] [CrossRef]
  76. Palermo, S.A.; Talarico, V.C.; Turco, M. On the LID systems effectiveness for urban stormwater management: Case study in Southern Italy. IOP Conf. Ser. Earth Environ. Sci. 2020, 410, 012012. [Google Scholar] [CrossRef]
  77. Uchiyama, S.; Bhattacharya, Y.; Nakamura, H. Efficacy Analysis of Urban Planning Scenarios for Flood Mitigation with Low Impact Development Technologies Using SWMM: A Case Study in Saitama City, Japan. IOP Conf. Ser. Earth Environ. Sci. 2022, 973, 012012. [Google Scholar] [CrossRef]
  78. Stovin, V.; Poe, S.; Berretta, C. A modelling study of long term green roof retention performance. J. Environ. Manag. 2013, 131, 206–215. [Google Scholar] [CrossRef]
  79. Vanuytrecht, E.; Van Mechelen, C.; Van Meerbeek, K.; Willems, P.; Hermy, M.; Raes, D. Runoff and vegetation stress of green roofs under different climate change scenarios. Landsc. Urban Plan. 2014, 122, 68–77. [Google Scholar] [CrossRef]
  80. Tameh, S.N.; Gnecco, I.; Palla, A. Analytic hierarchy process in selecting Bioretention Cells in urban residential settlement: Analysing hydrologic and hydraulic metrics for sustainable stormwater management. J. Environ. Manag. 2024, 371, 123142. [Google Scholar] [CrossRef] [PubMed]
  81. Bibi, T.S. Modeling urban stormwater management in the town of Dodola based on landuse and climate change using SWMM 5.1. J. Hydrol. Reg. Stud. 2022, 44, 101267. [Google Scholar] [CrossRef]
  82. Ghodsi, S.H.; Zamatkesh, H.; Goharian, E.; Kerachian, R.; Zhu, Z. Optimal design of low impact development practices in response to climate change. J. Hydrol. 2020, 580, 124266. [Google Scholar] [CrossRef]
  83. Patil, P.J.; Chaudhari, P.S. Using Hydrologic and Hydraulic Modeling Water FlowSimulation in Metamorphic Urban Watershed. Int. J. Innov. Res. Adv. Eng. (IJIRAE) 2014, 1, 2. Available online: https://www.researchgate.net/publication/280597097_Using_Hydrologic_and_Hydraulic_Modeling_Water_Flow_Simulation_in_Metamorphic_Urban_Watershed (accessed on 17 July 2024).
  84. Nikolopoulos, E.I.; Anagnostou, E.N.; Borga, M.; Vivoni, E.R.; Papadopoulos, A. Sensitivity of a mountain basin flash flood to initial wetness condition and rainfall variability. J. Hydrol. 2011, 402, 165–178. [Google Scholar] [CrossRef]
  85. Kwon, H.; Han, D.; Kim, K.B. Exploration of warm-up period in conceptual hydrological modelling. J. Hydrol. 2018, 556, 194–210. [Google Scholar] [CrossRef]
  86. James, R. Considerations for Selecting SWMM5 Time Steps. Online Article, CHI Blog. 2009. Available online: https://www-chiwater-com.translate.goog/Home/blog/65783/considerations-for-selecting-swmm5-time-steps?_x_tr_sl=en&_x_tr_tl=de&_x_tr_hl=de&_x_tr_pto=sc (accessed on 26 April 2024).
  87. Deutschländer, T.; Dalelane, C. Auswertung Regionaler Klimaprojektionen für Deutschland Hinsichtlich der Änderung des Extremverhaltens von Temperatur, Niederschlag und Windgeschwindigkeit Bundesamt für Bevölkerungsschutz und Katastrophenhilfe, Bundesanstalt Technisches Hilfswerk, Deutscher Wetterdienst, Umweltbundesamt. 2012. Available online: https://www.dwd.de/DE/klimaumwelt/klimaforschung/klimaprojektionen/extremereignisse/abschlussbericht-2012.pdf;jsessionid=E8D1AC4BE04D1AAADAB2689E15380439.live11042?__blob=publicationFile&v=1 (accessed on 17 July 2024).
  88. Bayerisches Landesamt für Umwelt (LfU). Das Bayerische Klimaprojektionsensemble-Audit und Ensemblebildung. 2020. Available online: https://www.lfu.bayern.de/publikationen/get_pdf.htm?art_nr=lfu_klima_00169 (accessed on 17 July 2024).
  89. Parkinson, J.N.; Goldenfum, J.A.; Tucci, C.E.M. Integrated Urban Water Management: Humid Tropics; CRC Press: Boca Raton, FL, USA; Unesco Publishing: Boca Raton, FL, USA, 2010; ISBN 978-0-203-88117-0. [Google Scholar]
  90. Xia, J.; Zhang, Y.Y.; Xiong, L.H.; He, S.; Wang, L.F.; Yu, Z.B. Opportunities and challenges of the Sponge City construction related to urban water issues in China. Sci. China Earth Sci. 2017, 60, 652–658. [Google Scholar] [CrossRef]
  91. Allende-Prieto, C.; Méndez-Fernández, B.I.; Sañudo-Fontaneda, L.A.; Charlesworth, S.M. Development of a Geospatial Data-Based Methodology for Stormwater Management in Urban Areas Using Freely-Available Software. Int. J. Environ. Res. Public Health 2018, 15, 1703. [Google Scholar] [CrossRef] [PubMed]
  92. Kuller, M.; Bach, P.M.; Ramirez-Lovering, D.; Deltic, A. Framing water sensitive urban design as part of the urban form: A critical review of tools for best planning practice. Environ. Model. Softw. 2017, 96, 265–282. [Google Scholar] [CrossRef]
  93. Walsh, T.C.; Pomeroy, C.A.; Burian, S.J. Hydrologic modeling analysis of a passive, residential rainwater harvesting program in an urbanized, semi-arid watershed. J. Hydrol. 2014, 508, 240–253. [Google Scholar] [CrossRef]
  94. Helmholtz-Zentrum, Klimanavigator. Heavy Rain in Past, Present and Future. Available online: https://www.klimanavigator.eu/themenportal/100190/index.php (accessed on 9 May 2025).
  95. Hessenschau, zu Wenig Regen. Wasserentnahme im Vogelsbergkreis Seit Montag Verboten 2022. Hessenschau.de. Available online: https://www.stern.de/politik/deutschland/wegen-trockenheit--im-vogelsbergkreis-darf-niemand-mehr-wasser-aus-gewaessern-nehmen-31973366.html (accessed on 12 February 2024).
Figure 1. Flow chart illustrating varying LID control percentages for the three scenarios and assigned past and future time series. Precipitation and temperature data are supplied by (T1, historic) and projected for (T2, future) station ID 1420 of the German Weather Service (DWD). LID-elements analyzed with varying implementation percentage include green roof (GR), permeable pavement (PP) and bioretention cell (BRC). The colored plains beneath the Scenario-Boxes show the overall LID-implementation percentage that were analysed for efficiency in a high-density (Scenario 1), low-density (Scenario 2) and medium-density (Scenario 3) district setting.
Hydrology 12 00200 g001
Figure 2. Study area delineation and design scenarios. Subcatchments (from top left to bottom right): 1. Private Yards, 2. Residential, 3. Street/Parking, 4. Public Green, 5. Other Undeveloped Area (OUA). Total area: 0.85 ha, slope: 5%. Outline does not represent subcatchments quantitively.
Hydrology 12 00200 g002
Figure 3. Preprocessing of climate (projection) data using R©, the cygwin64 Terminal and Excel.
Hydrology 12 00200 g003
Figure 4. LID controls investigated in this study with the substrate and layer thickness. Parameter values are partly taken from the SWMM Reference Manual, partly from acceptable literature (see Table S11). Implementation of a drain for the permeable pavement is optional (*).
Hydrology 12 00200 g004
Figure 5. Past single event evaluation for different building densities: Design Scenarios 1–3 with Basecase vs. maximum LID implementation as defined in Section 2.3 (Design Scenarios). For the single event evaluation evapotranspiration does not play a role as it is calculated from average daytime temperature values which are assumed constant for the duration of the event (here: Evaporation 1.36 mm/day, Evapotranspiration 2.6 mm/day). CMS stands for m3/s.
Hydrology 12 00200 g005aHydrology 12 00200 g005b
Figure 6. Percentage change of parameters ‘infiltration’, ‘evaporation’ and ‘runoff’ when comparing Basecase and maximum LID implementation scenario for all three building densities. As final storage is only meaningful quantifiable for single events, it is represented here as the share [mm] of total precipitation.
Hydrology 12 00200 g006aHydrology 12 00200 g006b
Table 1. Summary of the DWD reference ensemble v2018 and the DWD core ensemble v2018 (marked with an asterisk) with the corresponding global- and regional model-pairs per RCP scenario and illustration of their origin (blue: EURO-CORDEX, green: ReKliEs-De). In red letters are model chains, which were not available for the variable “maximum hourly precipitation per day”. Model chains that were considered for the water balance simulation with LARSIM-ME are hatched. The abbreviations r1, r2 and r12 indicate different realizations in the ensemble of global models. The final selection for this study is indicated by the red boxes. Adopted by Brienen et al. 2020 [66].
Hydrology 12 00200 i001
Disclaimer/Publisher’s Note: The statements, opinions and data contained in all publications are solely those of the individual author(s) and contributor(s) and not of MDPI and/or the editor(s). MDPI and/or the editor(s) disclaim responsibility for any injury to people or property resulting from any ideas, methods, instructions or products referred to in the content.

