Article

Improving Soil Water Simulation in Semi-Arid Agriculture: A Comparative Evaluation of Water Retention Curves and Inverse Modeling Using HYDRUS-1D

by
Ali Rasoulzadeh
1,*,
Mohammad Reza Kohan
2,
Arash Amirzadeh
2,
Mahsa Heydari
2,
Javanshir Azizi Mobaser
1,
Majid Raoof
1,
Javad Ramezani Moghadam
1 and
Jesús Fernández-Gálvez
3,*
1
Department of Water Engineering, Faculty of Agriculture and Natural Resources, Water Management Research Center, University of Mohaghegh Ardabili, Ardabil 56199-11367, Iran
2
Water Engineering Department, Faculty of Agriculture and Natural Resources, University of Mohaghegh Ardabili, Ardabil 56199-11367, Iran
3
Department of Regional Geographic Analysis and Physical Geography, University of Granada, 18071 Granada, Spain
*
Authors to whom correspondence should be addressed.
Hydrology 2025, 12(10), 273; https://doi.org/10.3390/hydrology12100273
Submission received: 17 September 2025 / Revised: 13 October 2025 / Accepted: 19 October 2025 / Published: 21 October 2025

Abstract

Water scarcity in semi-arid regions necessitates accurate soil water modeling to optimize irrigation management. This study compares three HYDRUS-1D parameterization approaches—based on the drying-branch soil water retention curve (SWRC), wetting-branch SWRC (using Shani’s drip method), and inverse modeling—to simulating soil water content at 15 cm and 45 cm depths under center-pivot irrigation in a semi-arid region. Field experiments in three maize fields provided daily soil water, soil hydraulic, and meteorological data. Inverse modeling achieved the highest accuracy (NRMSE: 2.29–7.40%; RMSE: 0.006–0.023 cm3 cm−3), particularly at 15 cm depth, by calibrating van Genuchten parameters against observed water content. The wetting-branch approach outperformed the drying branch at the same depth, capturing irrigation-induced wetting processes more effectively. Statistical validation confirmed the robustness of inverse modeling in reproducing temporal patterns, while wetting-branch data improved deep-layer accuracy. The results demonstrate that inverse modeling is a reliable approach for soil water simulation and irrigation management, whereas the wetting-branch parameterization offers a practical, field-adaptable alternative. This study provides one of the first side-by-side evaluations of these three modeling approaches under real-world semi-arid conditions.

1. Introduction

Dry and semi-arid climates continually face severe water scarcity, making optimal water management an essential priority [1]. The persistent decline of freshwater resources, driven by recurrent droughts, climate change, and unsustainable extraction practices, underscores the urgent need to enhance water-use efficiency in agriculture [2]. Under such critical conditions, adopting scientifically informed and efficient irrigation strategies is vital to sustain crop productivity. Modeling and simulating water movement within irrigated soils provide a powerful framework to predict soil water distribution in the root zone and to optimize both irrigation scheduling and applied volumes [3].
A wide range of numerical models has been developed to simulate unsaturated flow within the soil profile. Among them, HYDRUS-1D has achieved a prominent position due to its accuracy, flexibility, and user-friendly interface [4]. The model solves the nonlinear Richards equation for unsaturated flow and simulates one-dimensional water and solute transport across the soil profile. The validity and reliability of HYDRUS-1D has been confirmed in numerous studies, and has been widely applied at both field and research scales [5]. For instance, HYDRUS-1D has been used to predict spatiotemporal variations in soil water and to evaluate different irrigation regimes. Its robustness and flexibility make it a valuable tool for analyzing complex processes such as infiltration, redistribution, and evaporation [6].
Several examples illustrate its versatility: Xu et al. [7] simulated water, salt, and nitrate movement under different surface irrigation strategies with high accuracy; Arbat et al. [8] optimized subsurface drip line and frequency in rice cultivation; Raoof et al. [9] conducted sensitivity analyses of model input parameters for root water uptake; and Kim et al. [10] validated HYDRUS-1D’s performance under sprinkler irrigation. Similarly, Feng et al. [11] demonstrated its effectiveness in simulating water balance in layered sandy soils, while Etminan et al. [12] applied the DREAM algorithm to quantify parameter and structural uncertainty in soil water predictions. Nouri et al. [13] further evaluated the moment analysis method using HYDRUS results, confirming that higher flow rates and irrigation duration control the horizontal and vertical expansion of the water bulb. Collectively, these studies validate HYDRUS-1D as a reliable tool for simulating soil water dynamics under various irrigation systems.
One of the fundamental properties governing unsaturated flow is the soil water retention curve (SWRC), which describes the relationship between volumetric water content, θ, and matric potential (water suction), h. Notably, the drying and wetting branches of the SWRC are not identical, creating a hysteretic effect with no unique one-to-one relationship between suction and water content [14]. This hysteresis significantly influences infiltration, drainage, and redistribution processes across the soil profile [15]. However, because field measurement of the wetting branch is difficult and time-consuming, most empirical SWRC models are based solely on the drying branch, potentially reducing prediction accuracy during irrigation-driven wetting events [16]. To address this limitation, Shani et al. [17] introduced the drip method, a practical field technique for determining the wetting branch.
Despite the extensive application of HYDRUS-1D, no study has simultaneously compared the drying-branch, field-measured wetting-branch (via the Shani method), and inverse modeling approaches under identical field conditions and evaluation criteria. The present research therefore aims to fill this gap by comparing HYDRUS-1D simulations using: (1) the drying-branch SWRC, (2) the wetting-branch SWRC, and (3) inverse modeling based on field-measured soil water. Model simulations were conducted at two depths (15 cm and 45 cm), and outputs were evaluated against daily field observations to assess predictive performance.
The key contribution of this study lies in its comprehensive, side-by-side evaluation of these three modeling approaches under real semi-arid field conditions, where efficient irrigation management is critical. Unlike previous works that assessed either the drying branch or inverse modeling separately, this research integrates both with field-measured wetting-branch data. In semi-arid systems characterized by high-frequency pulse irrigation, soils are repeatedly rewetted before full drying occurs, meaning the operative θ-h path often follows the wetting side of the SWRC. Accounting for this behavior prevents underestimation of post-irrigation water peaks and timing errors at depth. By integrating field-derived wetting-branch data (via Shani’s method) with inverse parameter estimation through HYDRUS-1D’s Levenberg–Marquardt algorithm, this study establishes a rigorous and practical framework for selecting soil water simulation methods. Although no new hysteresis theory is proposed, the model’s hysteresis is represented following Scott et al. [18] with the Kool and Parker [19] air-entrapment modification, as implemented in HYDRUS. The specific novelty of this work lies in applying field-measured wetting-branch parameters to parameterize HYDRUS-1D and benchmarking their performance against inverse and drying-branch approaches. This comparative framework advances the development of more reliable soil water simulation techniques for irrigation planning in arid and semi-arid agriculture.

2. Materials and Methods

2.1. Study Area

The study was conducted in the Moghan Plain, located in Parsabad County, Ardabil Province, northwestern Iran (Figure 1). This fertile alluvial plain borders the Republic of Azerbaijan and extends between latitudes 39°20′ and 39°42′ N and longitudes 47°30′ and 48°10′ E, with an average elevation of about 45 m above sea level. Owing to its high-quality soils, abundant groundwater, and favorable climate, the Moghan Plain is one of the country’s major agricultural regions. Irrigation water for the area is mainly supplied by the Aras River, whose stable discharge supports extensive mechanized agriculture.
The field experiments were carried out on lands of the Moghan Agro-Industrial Company, one of Iran’s largest agricultural enterprises, managing approximately 70,000 ha of farmland, of which more than 30,000 ha are equipped with modern irrigation systems. The study was performed in Area 7 of the company’s lands across three center-pivot irrigation systems, designated as Fields A, B, and C. Center pivot A has 11 spans covering 86 ha, pivot B has 4 spans covering 16 ha, and pivot C has 4 spans covering 23 ha. All fields were cultivated with forage maize (Zea mays). The Moghan Plain is climatically classified as a semi-arid region.

2.2. Field Studies

At the time of the field campaign, Field B was at the crop development stage, whereas Fields A and C were at germination. To characterize soil physical and chemical properties, both disturbed and undisturbed soil samples were collected from two depth intervals: 0–30 cm (representing 15 cm) and 30–60 cm (representing 45 cm).
Soil water content measurements were performed between 12 and 22 August 2024 (248 h) in Field A, 14 and 22 August 2024 (200 h) in Field B, and 16 and 23 August 2024 (176 h) in Field C. At each site, soil samples were collected daily at fixed monitoring locations using an auger at depths of 15 cm and 45 cm, followed by oven drying for volumetric water content determination. Sampling was conducted once per day, typically between 3:00 and 5:00 p.m., at a single location revisited throughout the study. For each depth, three replicate samples were averaged to obtain one θ value per day.
The 0–60 cm profile was selected based on typical maize root distribution [20], with the 15 cm and 45 cm depths representing near-surface and mid-root-zone conditions, respectively. This design provided a balance between sensitivity to surface fluxes and deeper root-zone processes and yielded sufficient time-series length for inverse calibration in HYDRUS-1D.
Irrigation depths were measured directly using catch-can arrays during each irrigation event and converted to time-varying application rates q(t) (cm h−1). The measured hyetographs were used in HYDRUS-1D as the precipitation/irrigation component of the atmospheric upper boundary. The total applied depth (D) was calculated as D = Σ(qi Δti). Based on recorded rates and durations, applied depths were: Field A: five 15-min pulses at 6.8 cm h−1, Field B: two 15-min pulses at 3.6 cm h−1 and one 15-min pulse at 4.5 cm h−1, and Field C: one 8-min pulse at 7.6 cm h−1
To ensure accurate quantification of local irrigation and rainfall inputs, 1 L containers were placed adjacent to each sampling point to record cumulative precipitation and irrigation.
Finally, the Shani (drip) method was performed in situ at each sampling site to derive the wetting branch of the SWRC. This test provides essential parameters for modeling soil hydraulic behavior under wetting conditions and for characterizing soil response during irrigation cycles.

2.3. Laboratory Analyses

To complement the field observations and provide the necessary inputs for soil water content modeling, soil samples collected from the study fields were analyzed in the laboratory to determine their physical and chemical properties.
Soil texture was determined using the four-point hydrometer method [21]. Soil bulk density ( ρ b ) was measured by oven-drying undisturbed core samples collected with a 100 cm3 sampling cylinder [22], while soil particle density ( ρ p ) was obtained using the pycnometer method [23]. The porosity was then calculated as 1 ρ b ρ p . For the evaluation of chemical properties, electrical conductivity (EC) and pH of the saturated paste extract were measured. In this procedure, each soil sample was brought to a saturated paste consistency using deionized water. After filtration, the EC of the extract was determined with an EC meter (model MI-306, Milwaukee Instruments Inc., Rocky Mount, NC, USA), and the pH was measured using a digital pH meter (model AZ86P3, AZ Instrument Corp., Taichung City, Taiwan) on the same extract.
To determine the SWRC for the drying branch, measurements were conducted over two suction ranges. For low suctions (0–100 cm), undisturbed samples were analyzed using the hanging water column method. For higher suctions (100–15,000 cm), a pressure plate apparatus was used.
Specifically, undisturbed samples were employed at 300 and 1000 cm suction, whereas disturbed samples were used at 3000, 5000, and 15,000 cm suction [24]. These combined measurements provided a complete drying-branch SWRC dataset, essential for HYDRUS-1D parameterization and comparison with wetting-branch and inverse modeling approaches.

2.4. Numerical Modeling

Water movement in unsaturated soil was simulated using the HYDRUS-1D software, which is widely used to model one-dimensional water flow and solute transport in variably saturated soils. Three parameterization approaches were evaluated: (i) the drying branch of the SWRC, (ii) the wetting branch (Shani method), and (iii) inverse modeling. The hysteresis module in HYDRUS was not activated.
The simulated soil profile extended to 60 cm depth with a 1 cm vertical discretization, yielding 61 computational nodes. The upper boundary was defined as an atmospheric boundary condition with surface runoff, and the lower boundary was set to free drainage.
The Richards equation, including a root-water-uptake sink term S(z,t), was solved for each field. Root uptake was deactivated (S = 0) in Fields A and C because these plots were bare during the monitoring period; hence, only potential evaporation acted at the atmospheric boundary. For Field B, root uptake was included using the Feddes reduction function [25] with the built-in Corn parameter set [26], and the normalized root distribution β(z) was defined over 0–60 cm.
Reference evapotranspiration (ET0) was computed internally in HYDRUS-1D using the FAO Penman–Monteith method from the measured meteorological inputs (project option “Meteorological Data—Penman–Monteith”). The resulting potential fluxes were applied as boundary conditions. Transpiration was set to zero for Fields A and C (bare soil), while Field B included transpiration according to the above root-uptake parameters.
A critical step in model setup is the specification of initial conditions. Because it was impractical to measure soil water content at each 1 cm interval, modeling was divided into two sequential phases: a quasi-steady-state phase, and a transient simulation phase.
It was assumed that prior to the experimental period (−∞ < t < t0), the soil system was in quasi-steady-state. The monitoring periods (248 h for Field A, 200 h for Field B, and 176 h for Field C) were then treated as transient conditions. The model was first run to steady state until the simulated terminal water contents matched the observed θ values at 15 cm and 45 cm at the beginning of the transient stage. This steady-state profile was then used as the initial condition for the transient simulation [27,28].

2.4.1. One-Dimensional Richards Equation

Uniform vertical water flow in a variably saturated rigid porous medium is described by a modified form of the Richards equation [29], assuming negligible air-phase effects and no thermal flow contribution:
θ t = x K θ h x + c o s α S    
where h is the water pressure head (L), θ is the volumetric water content (L3 L−3), t is time, x is the spatial coordinate in cm (positive upward), S is the sink term (L3 L−3 T−1), α is the angle relative to the vertical (i.e., α = 0° for vertical flow, 90° for horizontal flow), and K(θ) is the unsaturated hydraulic conductivity (L T−1).
HYDRUS-1D solves Equation (1) using an implicit finite-difference scheme, ensuring numerical stability and accuracy for water transport simulation [30]. To solve Equation (1), the model requires two constitutive relationships, the SWRC, and the K(θ).

2.4.2. Drying Branch of the SWRC

The drying branch of the SWRC was determined from laboratory measurements using the hanging water column and pressure plate apparatus. The soil water retention relationship was described using the van Genuchten [31] model, and unsaturated hydraulic conductivity was represented by the Mualem [32] model, given by:
θ h = θ s θ r 1 + α h n m + θ r         h < 0 θ s                                                                                     h 0                
K θ = K s S e 0.5 [ 1 1 S e 1 m m ] 2
where θ(h) is the volumetric soil water content (cm3 cm−3) at matric suction h (cm); θs and θr are the saturated and residual soil water contents, respectively (cm3 cm−3); α is the inverse air-entry suction parameter (cm−1); n is the curve-shape parameter; m = 1 − 1/n; Ks is the saturated hydraulic conductivity (cm h−1); and Se is the effective saturation, defined as:
S e = θ θ r θ s θ r
The Ks was determined experimentally using the falling-head method on undisturbed soil samples [29].
The van Genuchten parameters were first fitted using RETC software [33] and then imported into HYDRUS-1D.

2.4.3. Wetting Branch of the SWRC

In the wetting branch, soil re-wets after drying and thus exhibits a distinct SWRC compared to the drying curve. The Shani (dripper) method was used to derive this branch. In this field test, water of constant discharge Q drips from a low-height reservoir onto a dry soil surface, producing a circular saturated zone that gradually expands until reaching steady state. Once the radius of the saturated zone stabilizes, steady-state conditions are assumed, allowing use of two-dimensional steady-state flow equations to estimate hydraulic parameters [17]. Figure 2 illustrates the saturated and unsaturated regions.
According to Wooding [34], the hydraulic conductivity function can be expressed as:
K h = K s   e α h
and the infiltration flux q (cm s−1) from the saturated zone is calculated as:
q = Q π   r 2
where r is the radius of the saturated zone (cm) and Q is the discharge rate (cm3 s−1). The flux q depends on soil hydraulic properties and can be expressed as:
q = K s + 4 π 1 r F      
where F is the matric flux potential defined as:
F = 0 K h d h
The first term in Equation (7) represents the flux due to gravitational flow, whereas the second term arises from the flux due to matric head gradients only.
Substituting Equation (5) into Equation (8) and integrating yields:
q = K s + 4 K s π α . 1 r      
By conducting experiments at different discharge rates Q and measuring r, a linear regression of q versus 1/r is obtained allowing estimation of Ks (intercept) and α (slope) from:
α = 4 K s π b      
where b is the slope of the regression line.
Once α and Ks are known, the wetting branch of the SWRC is described by the Brooks and Corey [35] model:
θ = θ r + θ s θ r α h λ             α h 1                           θ s                                                               α h < 1        
where λ is the pore-size distribution index, and the remaining parameters are the same as in the van Genuchten model [31].
To estimate α and λ, one can measure the saturated-zone radius (r) and the distance between the saturate–unsaturated boundary and the boundary between dry and wet soil (i.e., the unsaturated-zone thickness, x) as functions of time t (see Figure 2). For this purpose, the sorptivity coefficient (SC), which is independent of flow geometry, is calculated as follows:
S C = θ r θ s x t 0.5 d θ
After integration:
S C x ( θ s θ r ) t 0.5
Then, x can be obtained as:
x S C θ s θ r t 0.5
If the values of x are plotted against the square root of time ( t 0.5 ), using x on the vertical axis, and a regression line is fitted through the origin, then the slope of that line represents the sorptivity coefficient ( S C θ s θ r ). By obtaining the θs and θr values, one can determine SC. To determine θr, a sample is taken before the field experiment and its water content is measured. After the experiment is completed, a sample is taken from the saturated zone and θs is measured.
The value of α [35] model parameter is calculated from the following equation:
α = 4   μ   K s   b π   ( μ 1 )
The value of µ can be obtained as:
μ = 0.5 C + 1.25 + C + 1.25 2 4 C 0.5
where C is equal to:
C = 1.25 S 2 b θ s θ r
where S denotes sorptivity, which is independent of the flow geometry.
The value of λ can be calculated as follows:
λ = μ 2 2
Once the values of all parameters of the Brooks–Corey model (λ, α, θr, and θs) are known, the wetting branch of the SWRC can be obtained by the Shani [17] method.
Water movement was simulated using HYDRUS-1D [30]. Independent simulations were run using either the drying or wetting branch of the SWRC to assess their respective predictive capabilities. This software employs the Brooks and Corey [35] unsaturated hydraulic conductivity model in the following form:
K θ = K s θ θ r θ s θ r 2 λ + l + 2
where l is a pore-connectivity parameter assumed to be 2.0 in the original study of Brooks and Corey [35] and Ks is used from the Shani method [17].

2.4.4. Inverse Modeling

Inverse modeling was applied to indirectly estimate soil hydraulic parameters (α, n, θr, θs) of the van Genuchten model [31] from transient soil water data. The method minimizes the difference between observed and simulated values through an objective function, optimized via the Levenberg–Marquardt algorithm [36] implemented in HYDRUS-1D.
In this study, the measured and simulated soil water contents at 15 cm and 45 cm depths were used in the objective function. Seventy percent of the data were used for model calibration, and the remaining 30% for validation.

2.5. Statistical Evaluation

Model performance was assessed by comparing simulated and observed soil water contents using three standard statistical indices: root mean square error (RMSE), normalized RMSE (NRMSE), and mean absolute error (MAE) [37,38,39]:
R M S E = 1 n i = 1 n y i y ^ i 2
N R M S E = R M S E y i ¯ × 100  
M A E = 1 n i = 1 n y i y ^ i
where y i is the observed value, y ^ i is the predicted value, and y i ¯   is the mean of observations.
Lower RMSE and MAE values indicate higher model accuracy. NRMSE values were interpreted following Li et al. [38]: NRMSE < 10% = excellent; 10–20% = good; 20–30% = fair; and >30% = poor model performance.

3. Results and Discussion

3.1. Climatic Conditions During the Study Period

Meteorological data from the Parsabad Airport synoptic station were analyzed for the period 12–23 August 2024 (Table 1). The dataset includes daily averages of maximum and minimum air temperature, relative humidity, wind speed, sunshine hours, and net radiation (Rn).
No rainfall occurred during the study period; thus, all soil water content changes were exclusively driven by irrigation, allowing direct evaluation of the soil–irrigation interaction. The climatic variables summarized in Table 1 were used as input data for HYDRUS-1D simulations.

3.2. Physical and Chemical Properties of Soil and Irrigation Water

The physical and chemical characteristics of the soils in Fields A, B, and C were determined at two depths (0–30 and 30–60 cm) (Table 2). The soils in Field A were classified as silty clay loam, while those in Fields B and C were silty clay. Particle density ranged from 2.54 to 2.75 g cm−3, and bulk density varied between 1.23 and 1.53 g cm−3. Porosity showed no significant difference between the two depths, indicating homogeneous soil profiles across 0–60 cm.
Because soil texture and bulk density at 15 cm and 45 cm were nearly identical, the SWRC measured at 15 cm was applied to both depths, assuming similar pore-size distribution and hydraulic behavior.
Soil pH ranged between 6.58 and 7.46, indicating neutral to slightly alkaline conditions suitable for most crops. Electrical conductivity (EC) values varied from 1.0 to 2.27 dS m−1, indicating low salinity. Irrigation water showed EC = 1.23 dS m−1 and pH = 7.3, both within acceptable FAO limits [40].

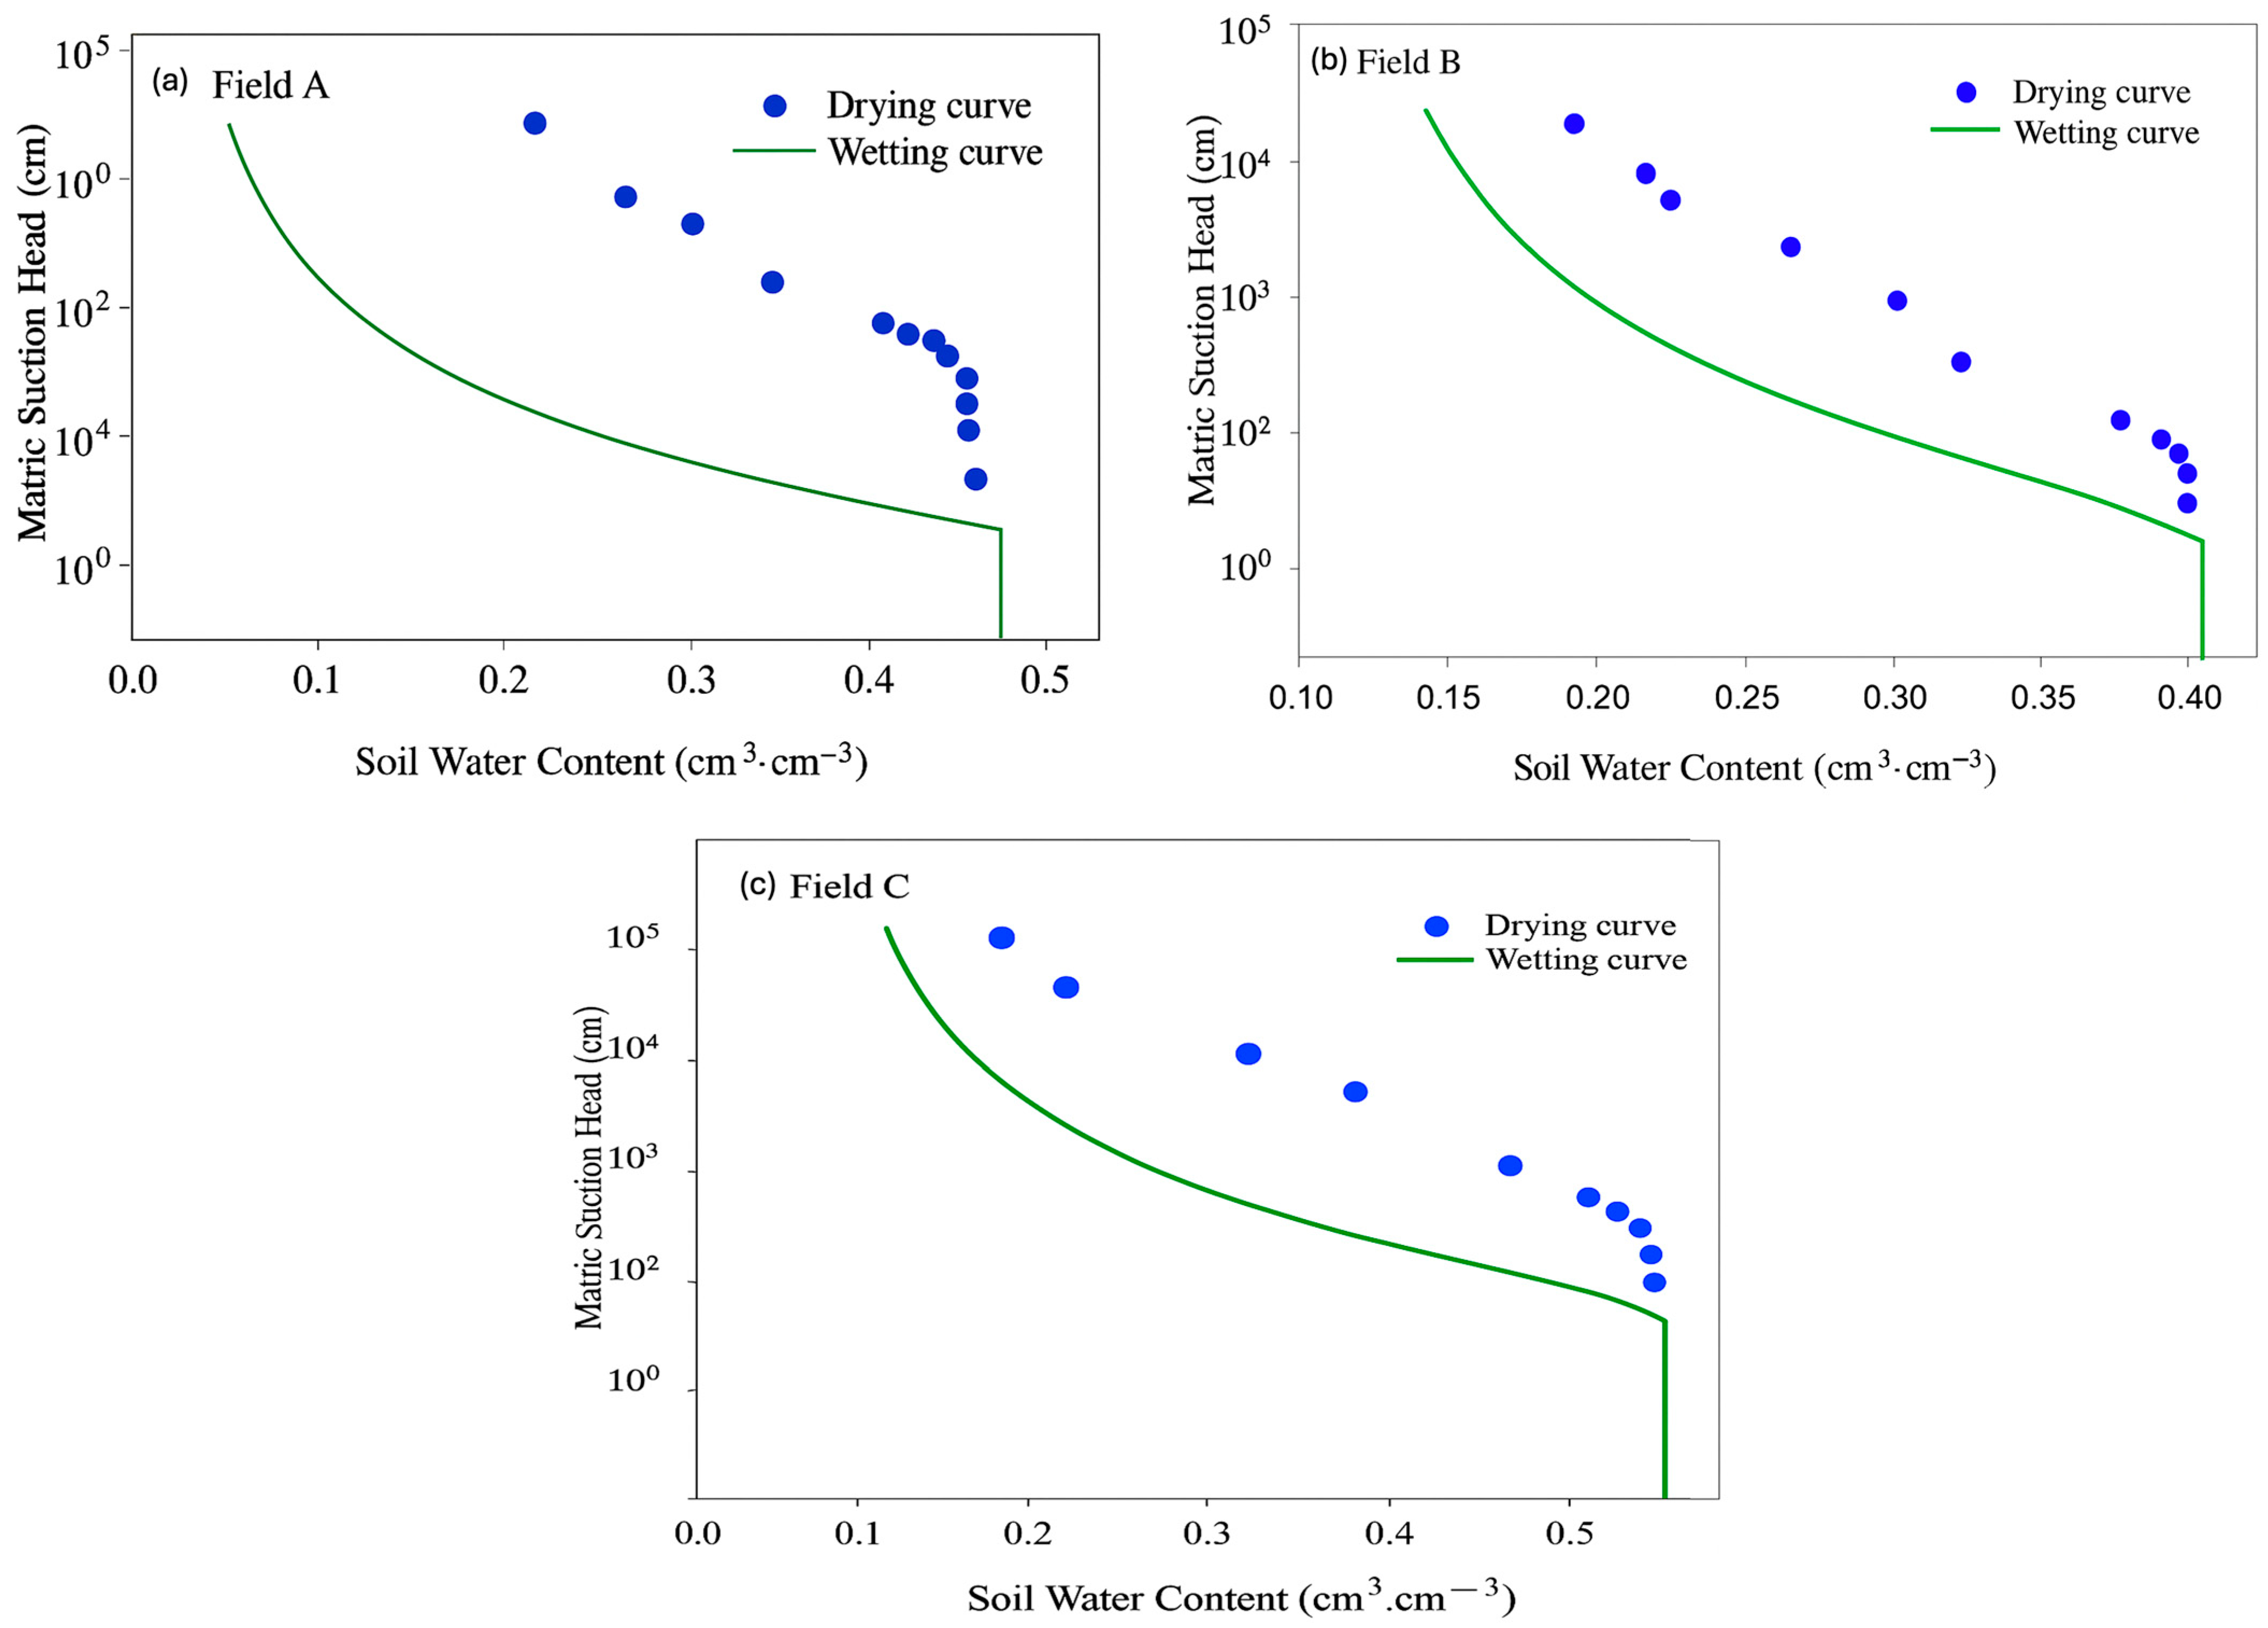
3.3. Drying and Wetting Branches of the SWRC

Figure 3 shows the drying and wetting SWRCs for Fields A, B, and C. The wetting branch was determined using the Shani et al. [17] drip method, while the drying branch was obtained with pressure plate and hanging column experiments. The fitted van Genuchten and Brooks–Corey parameters are listed in Table 3.
It is worth noting that during curve fitting, θr for Field C was truncated to 0.000 by the RETC solver, following default handling for θr < 0.001 cm3 cm−3; this truncation resulted from parameter trade-offs rather than a physically null residual water content.
Both drying- and wetting-branch measurements were performed at 15 cm depth. Given the homogeneous soil properties across 0–60 cm (Table 2), these SWRCs were also applied to simulations at 45 cm.

3.4. Soil Water Content Simulations Using the Drying and Wetting Branches of SWRC

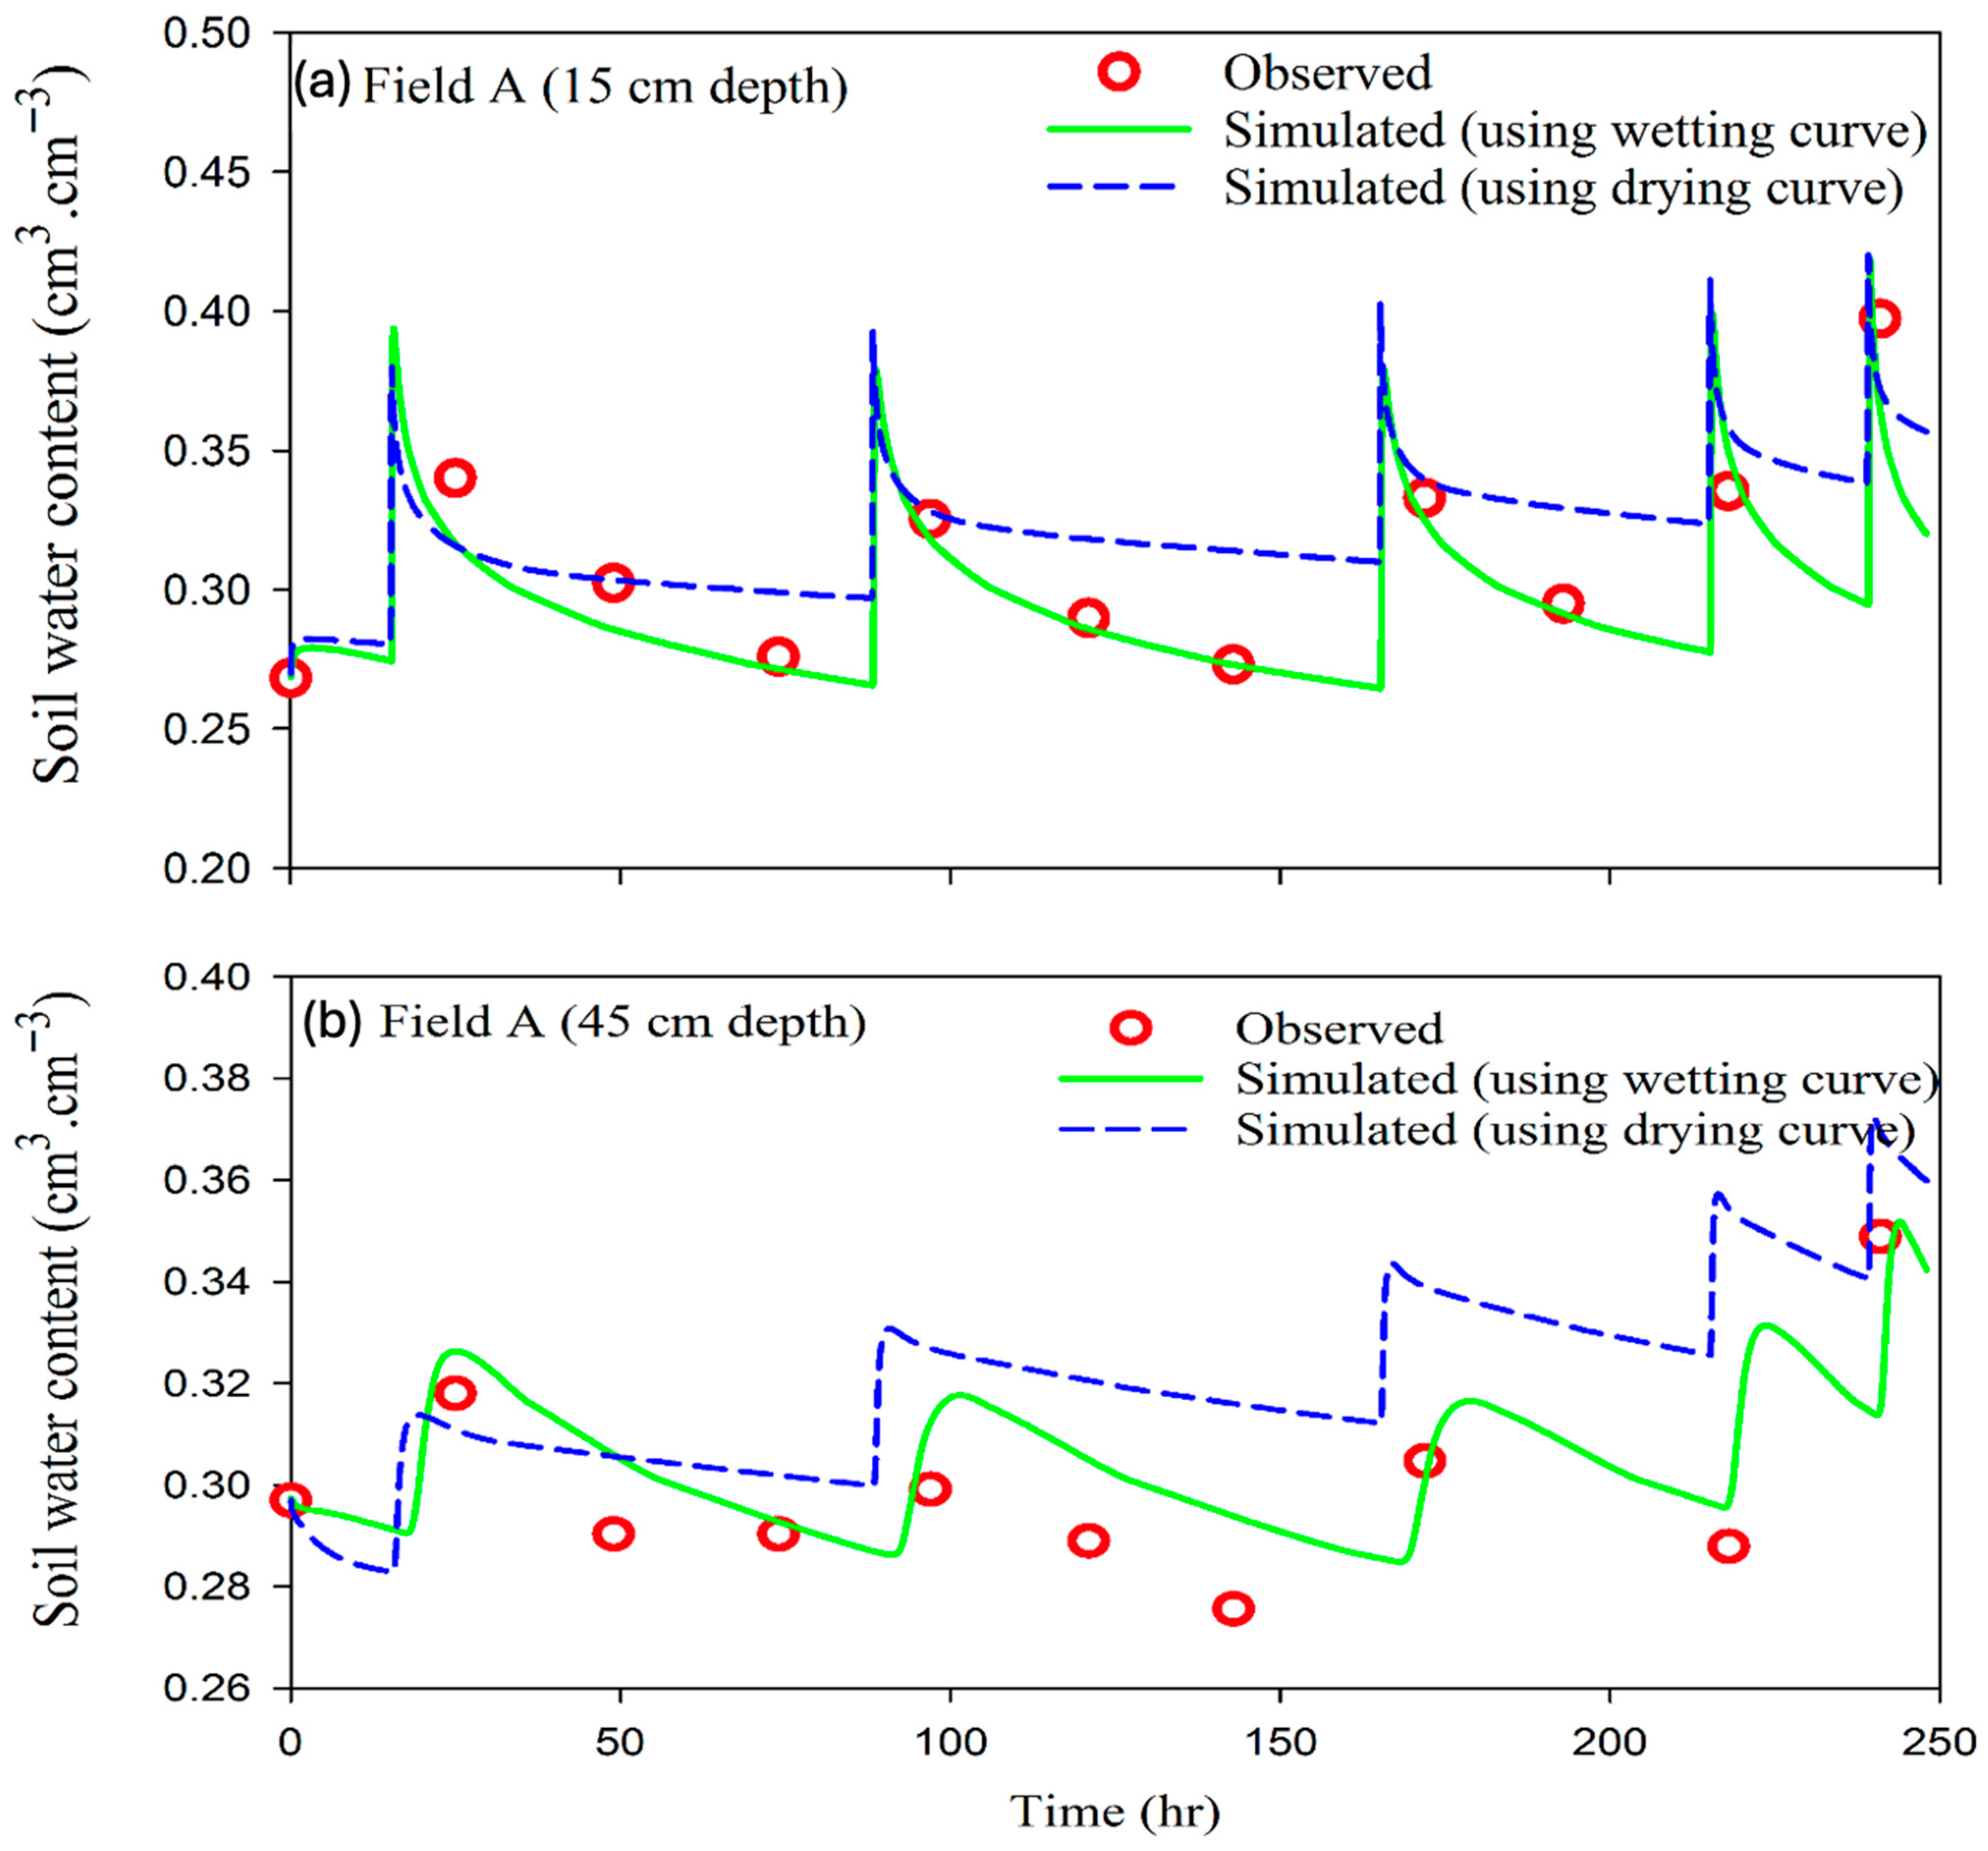
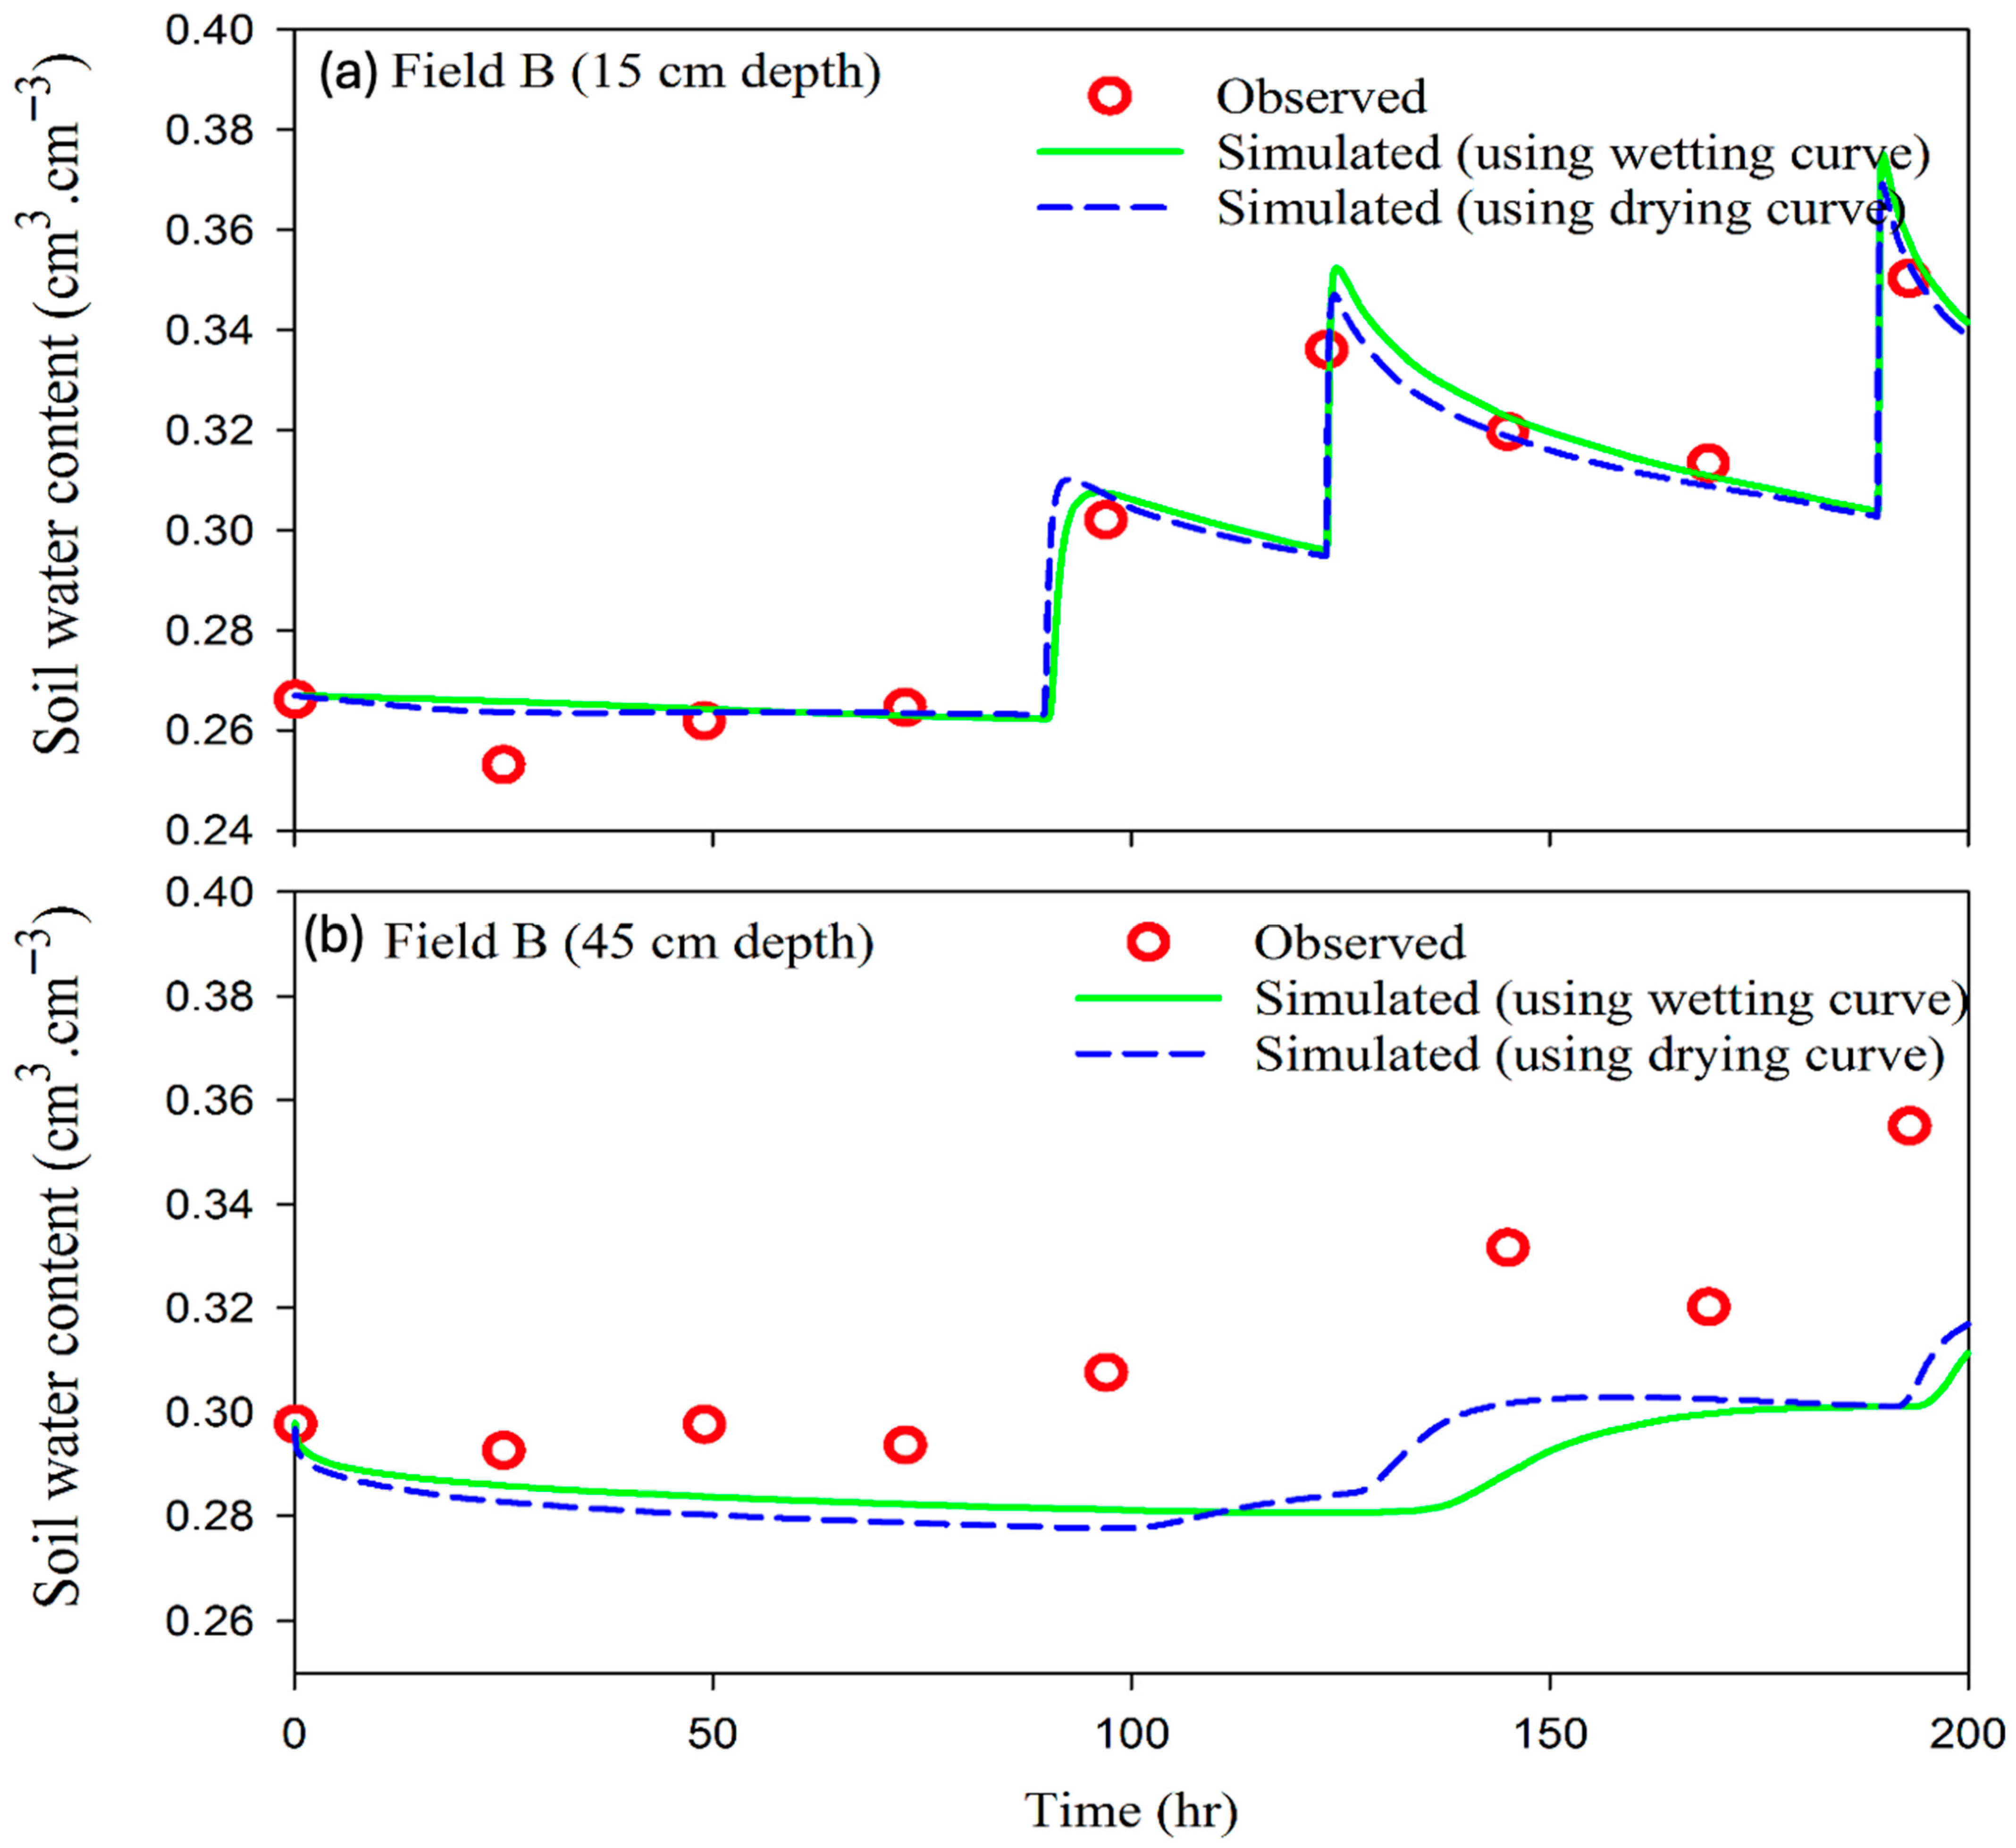
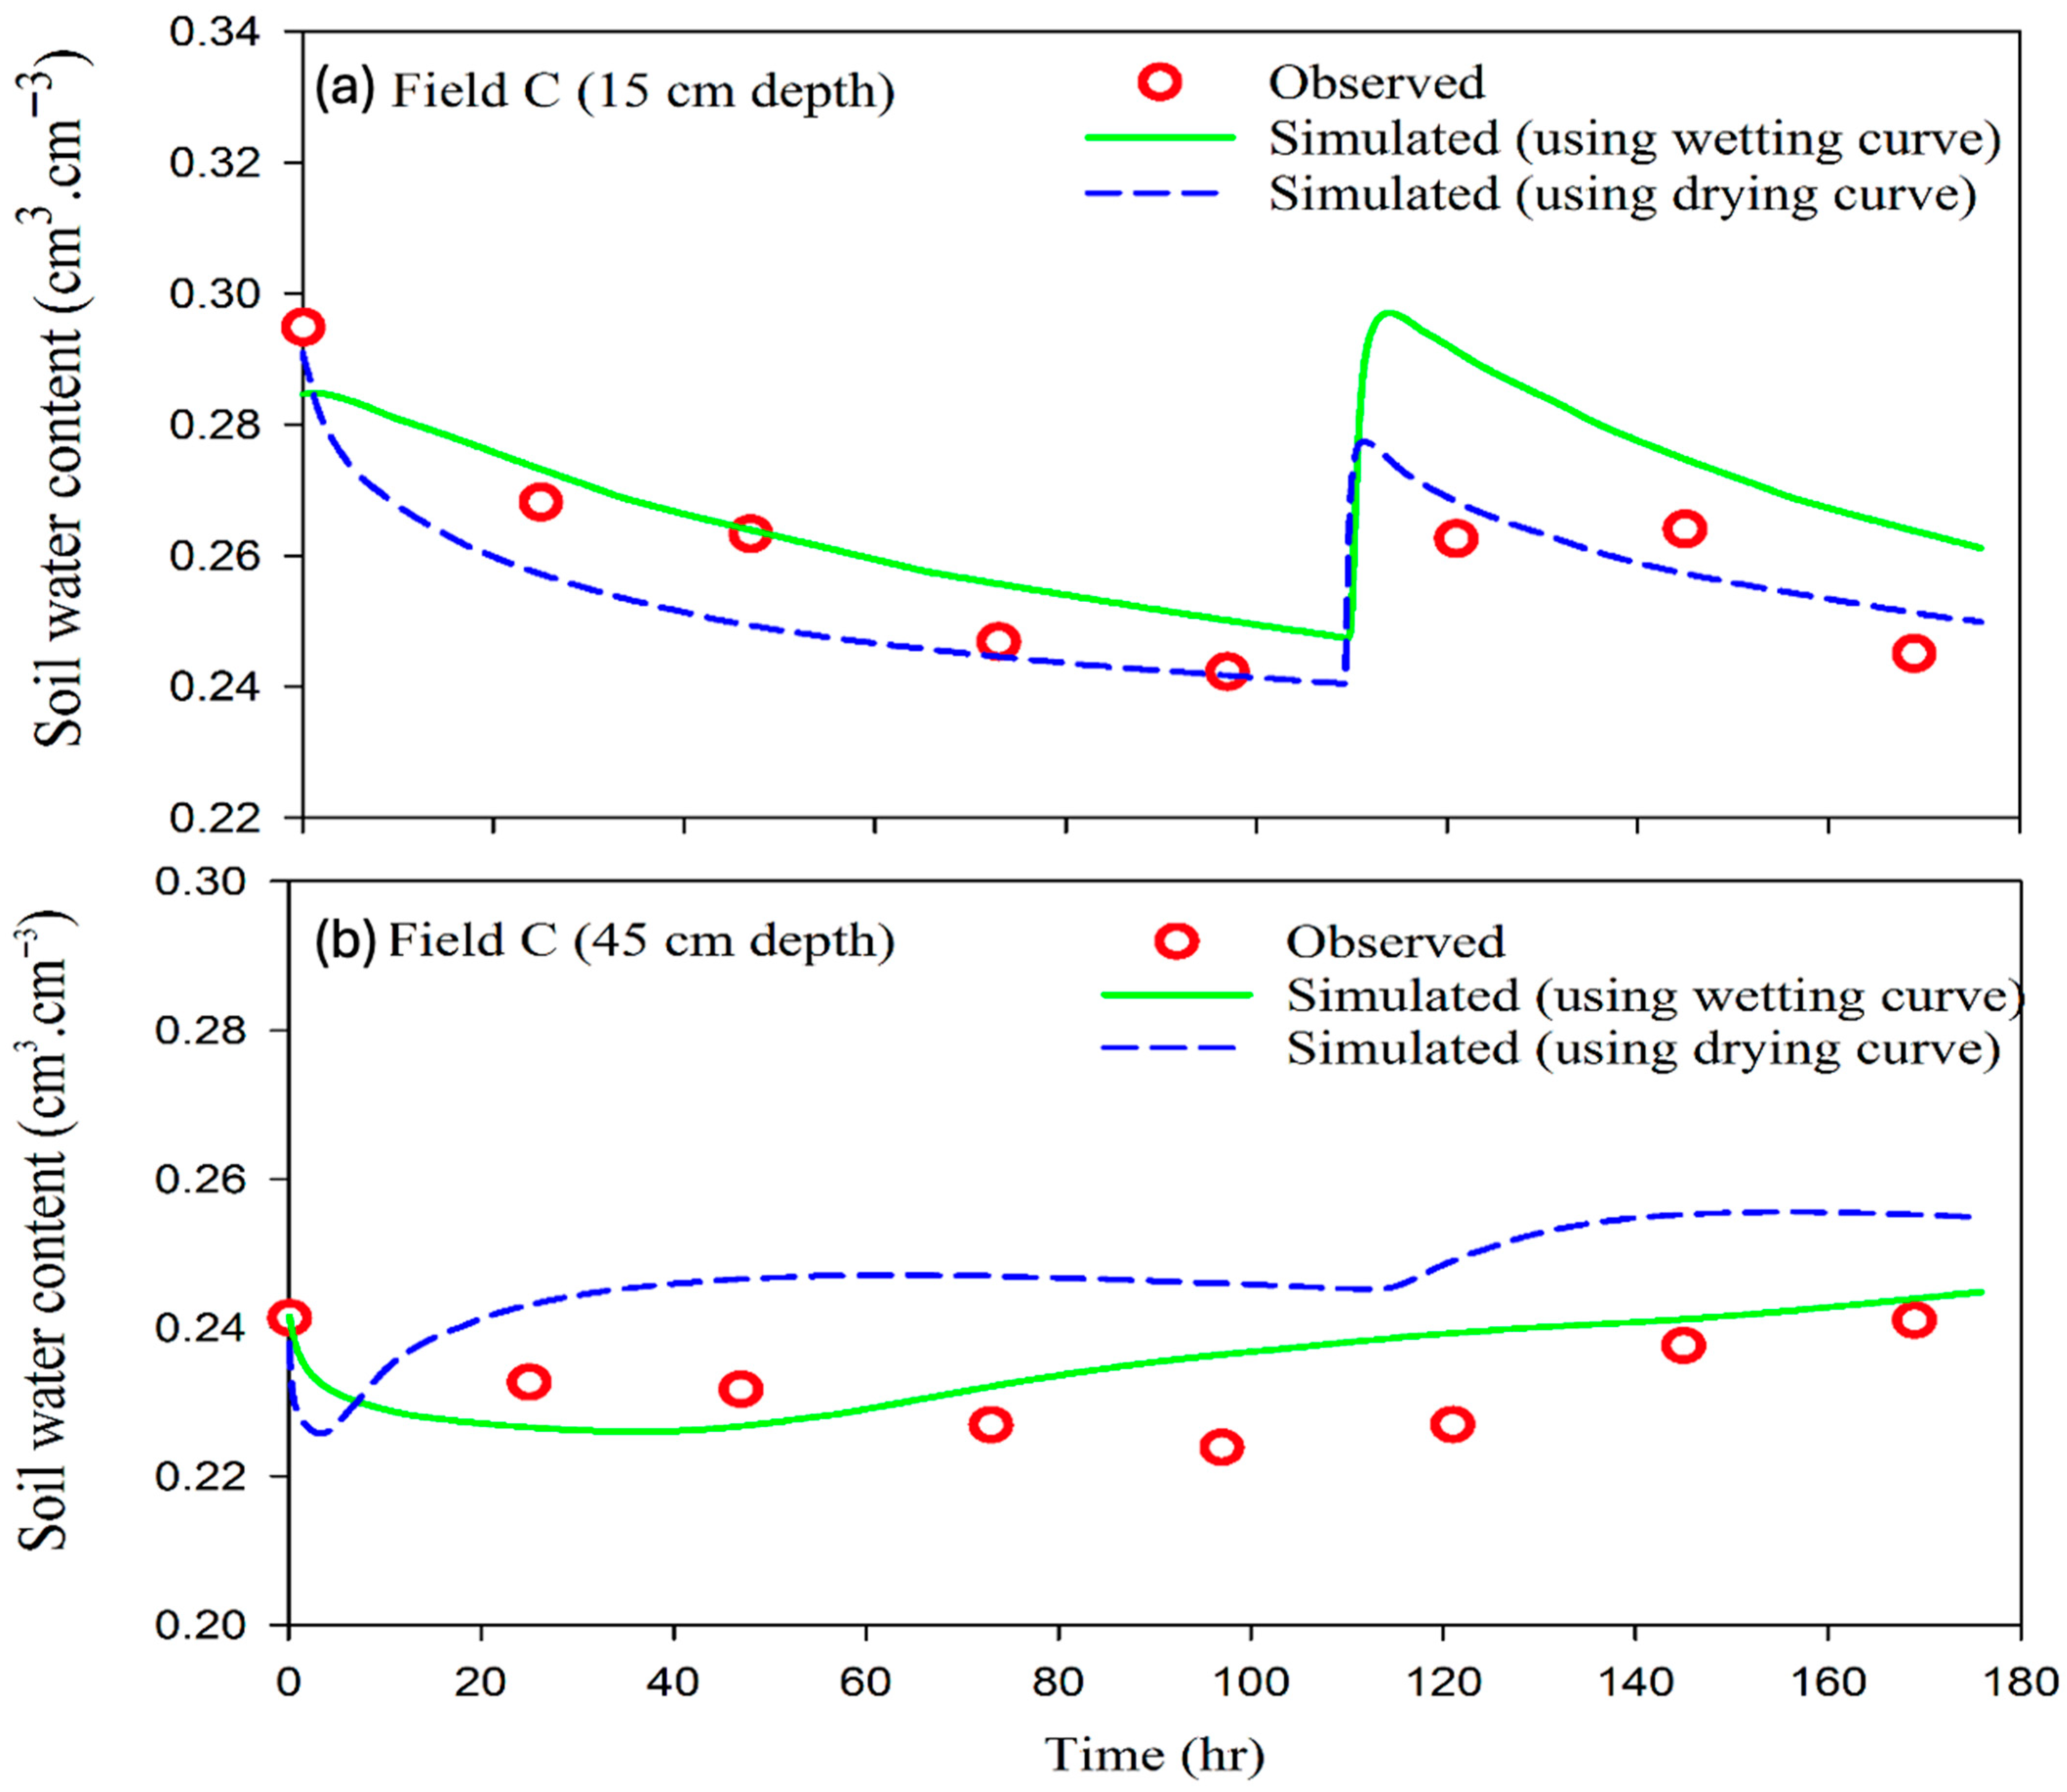
To assess model performance under center-pivot irrigation, HYDRUS-1D simulations were first conducted using drying-branch SWRC parameters (van Genuchten model). Figure 4, Figure 5 and Figure 6 compare observed and simulated soil water contents at 15 cm and 45 cm depths.
Overall, simulations using the drying branch reproduced soil water reasonably well, with better agreement near the surface. At 15 cm depth, Field A achieved NRMSE = 7.48%, classified as “excellent” (NRMSE < 10%), while performance decreased slightly at 45 cm (NRMSE = 10.46%).
Fields B and C achieved excellent agreement (NRMSE < 10%) at both depths (Table 4), although minor deviations occurred at greater depth due to reduced model sensitivity.
For the wetting branch, derived from the Shani method, HYDRUS-1D simulations also closely matched measured data (Figure 4, Figure 5 and Figure 6). Across all sites and depths, NRMSE < 10% (Table 5), confirming excellent performance. RMSE values ranged from 0.003 to 0.022 cm3 cm−3, with the best accuracy at shallow depths.
Simulation accuracy decreased with depth for both approaches, consistent with previous studies. Abdoli et al. [41] and Yu et al. [42] reported that HYDRUS-1D tends to lose accuracy below 40–50 cm, primarily due to reduced parameter identifiability and increasing soil heterogeneity. Chen et al. [43] similarly observed depth-dependent errors linked to unmeasured subsoil variations.
Although treating the 0–60 cm profile as homogeneous simplifies modeling, analysis of Table 2 confirms only minor variations in particle size, bulk density, and porosity, justifying this assumption. Nonetheless, small structural differences at depth could contribute to decreased accuracy.
These results also reveal the novel value of the wetting-branch approach, which more realistically represents the soil’s rewetting behavior during irrigation compared to the drying branch, which characterizes desiccation phases.

3.5. Soil Water Content Simulation Using the Inverse Modeling Approach

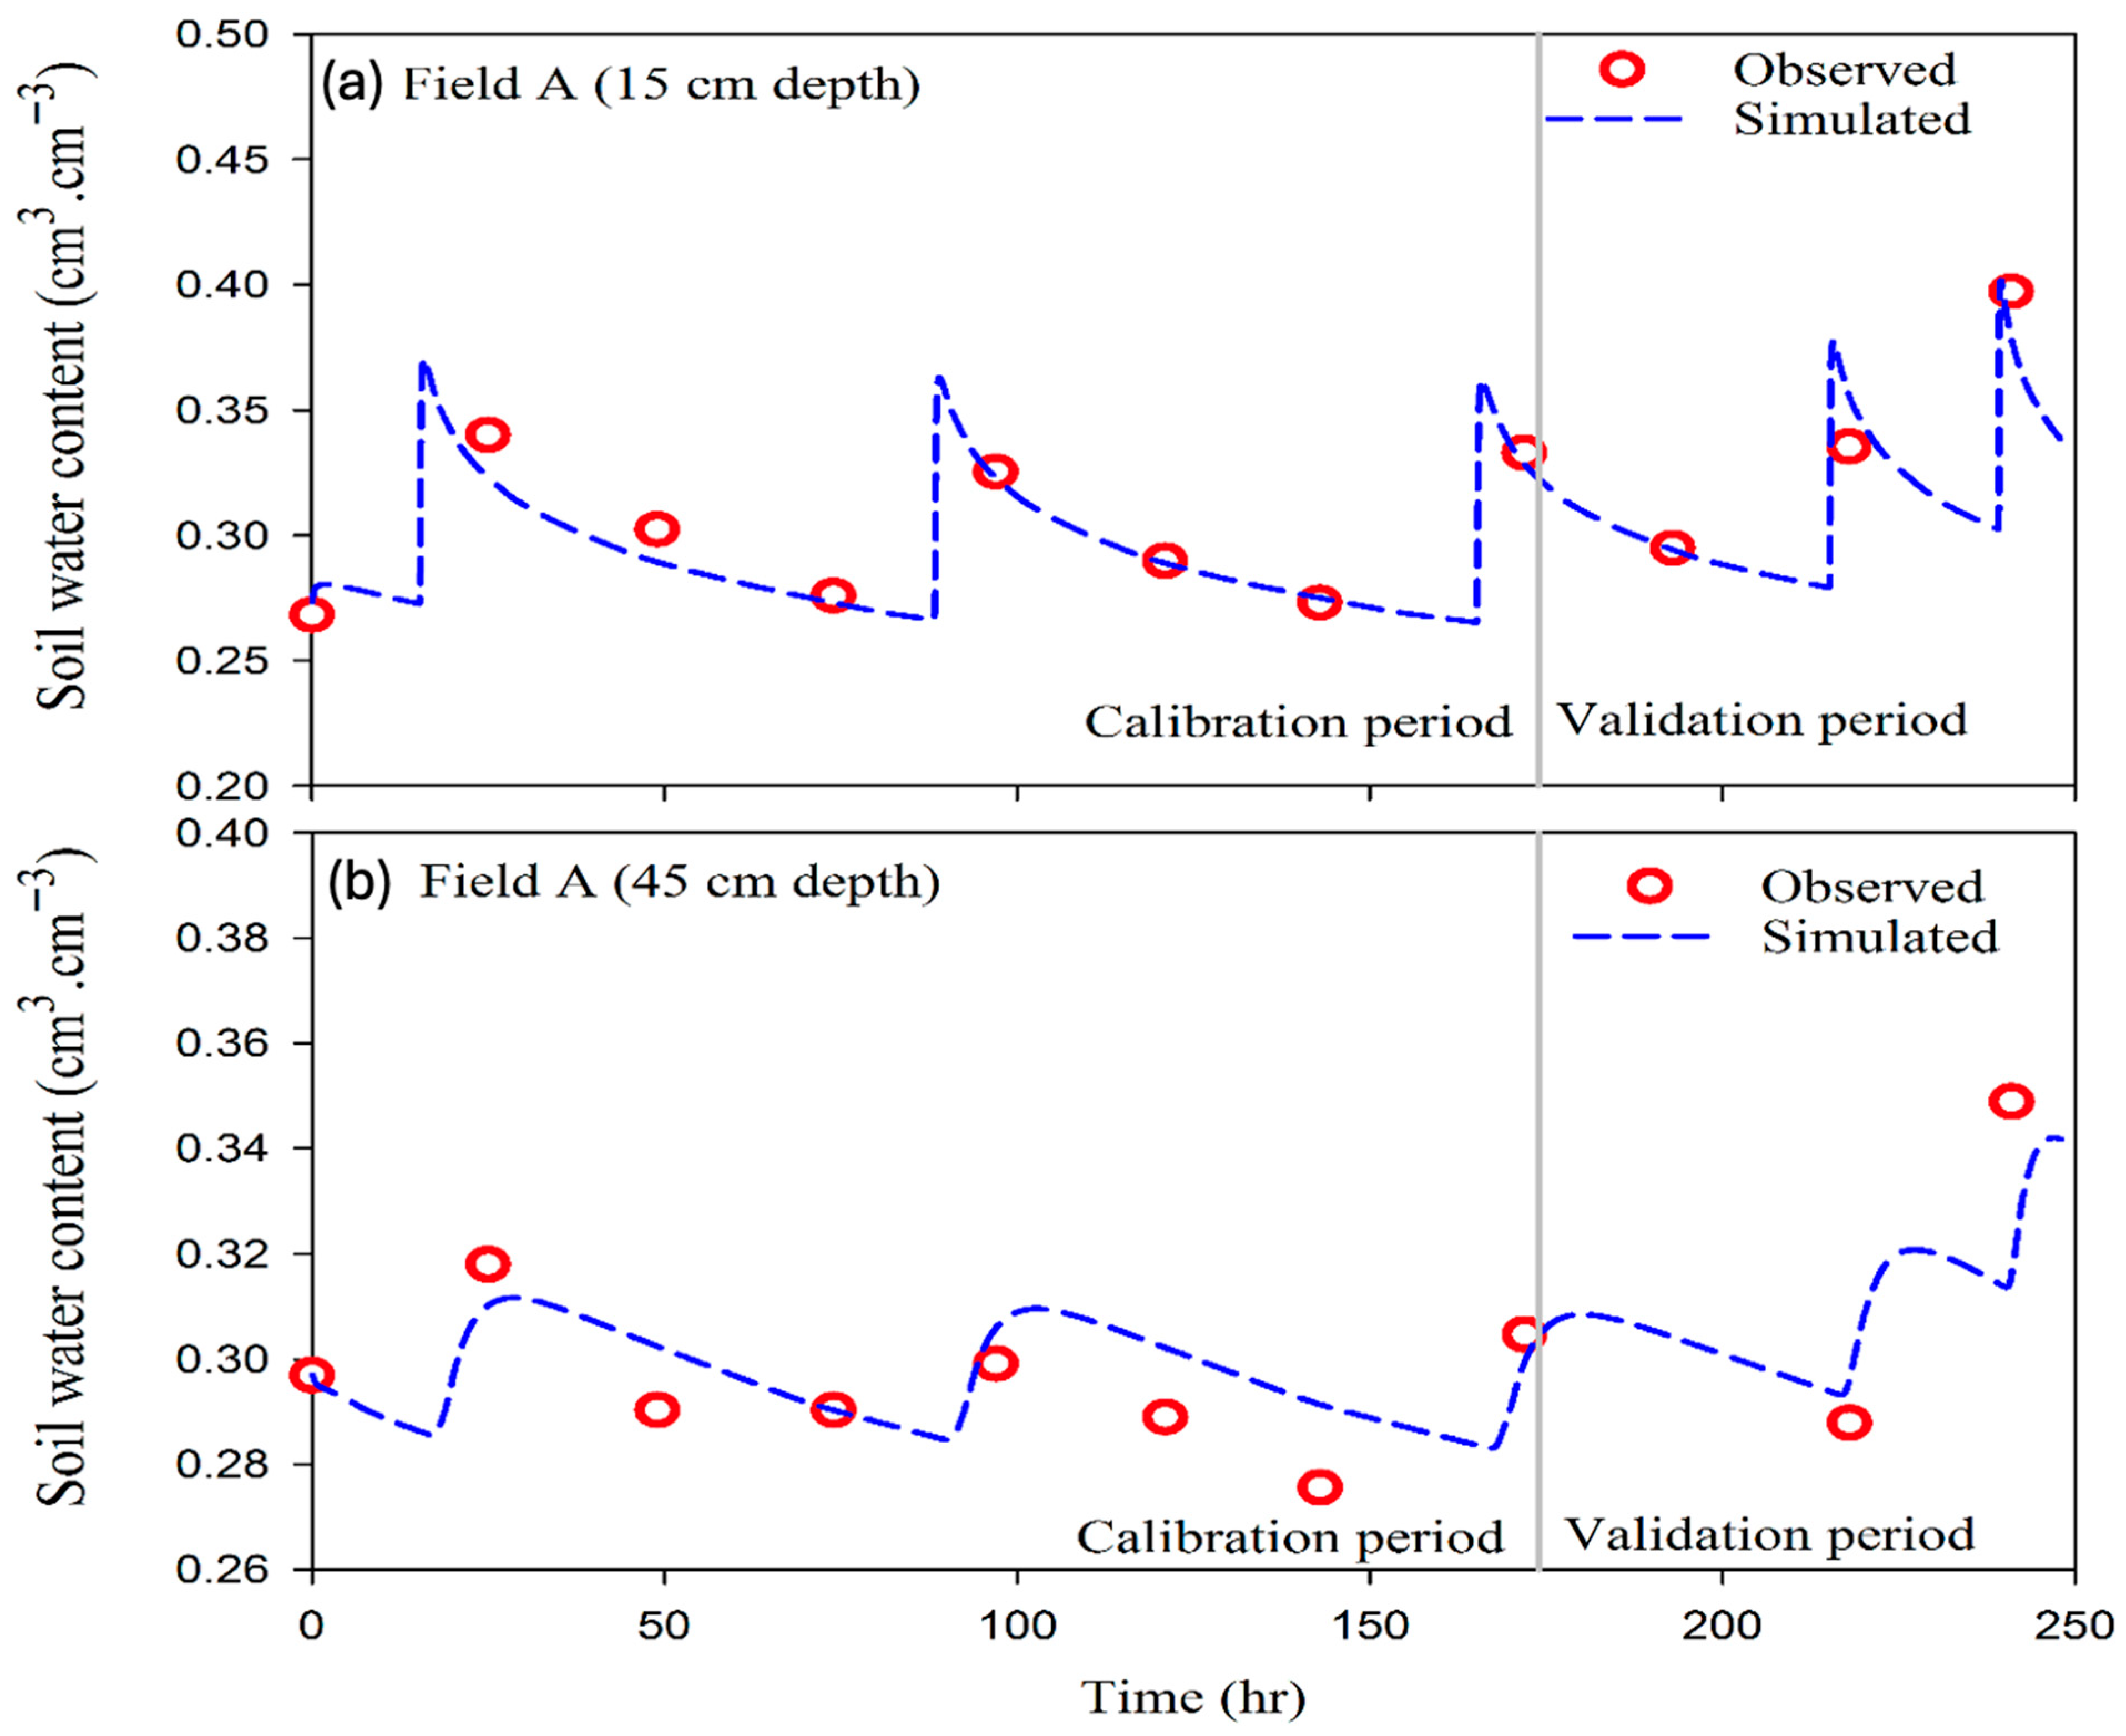
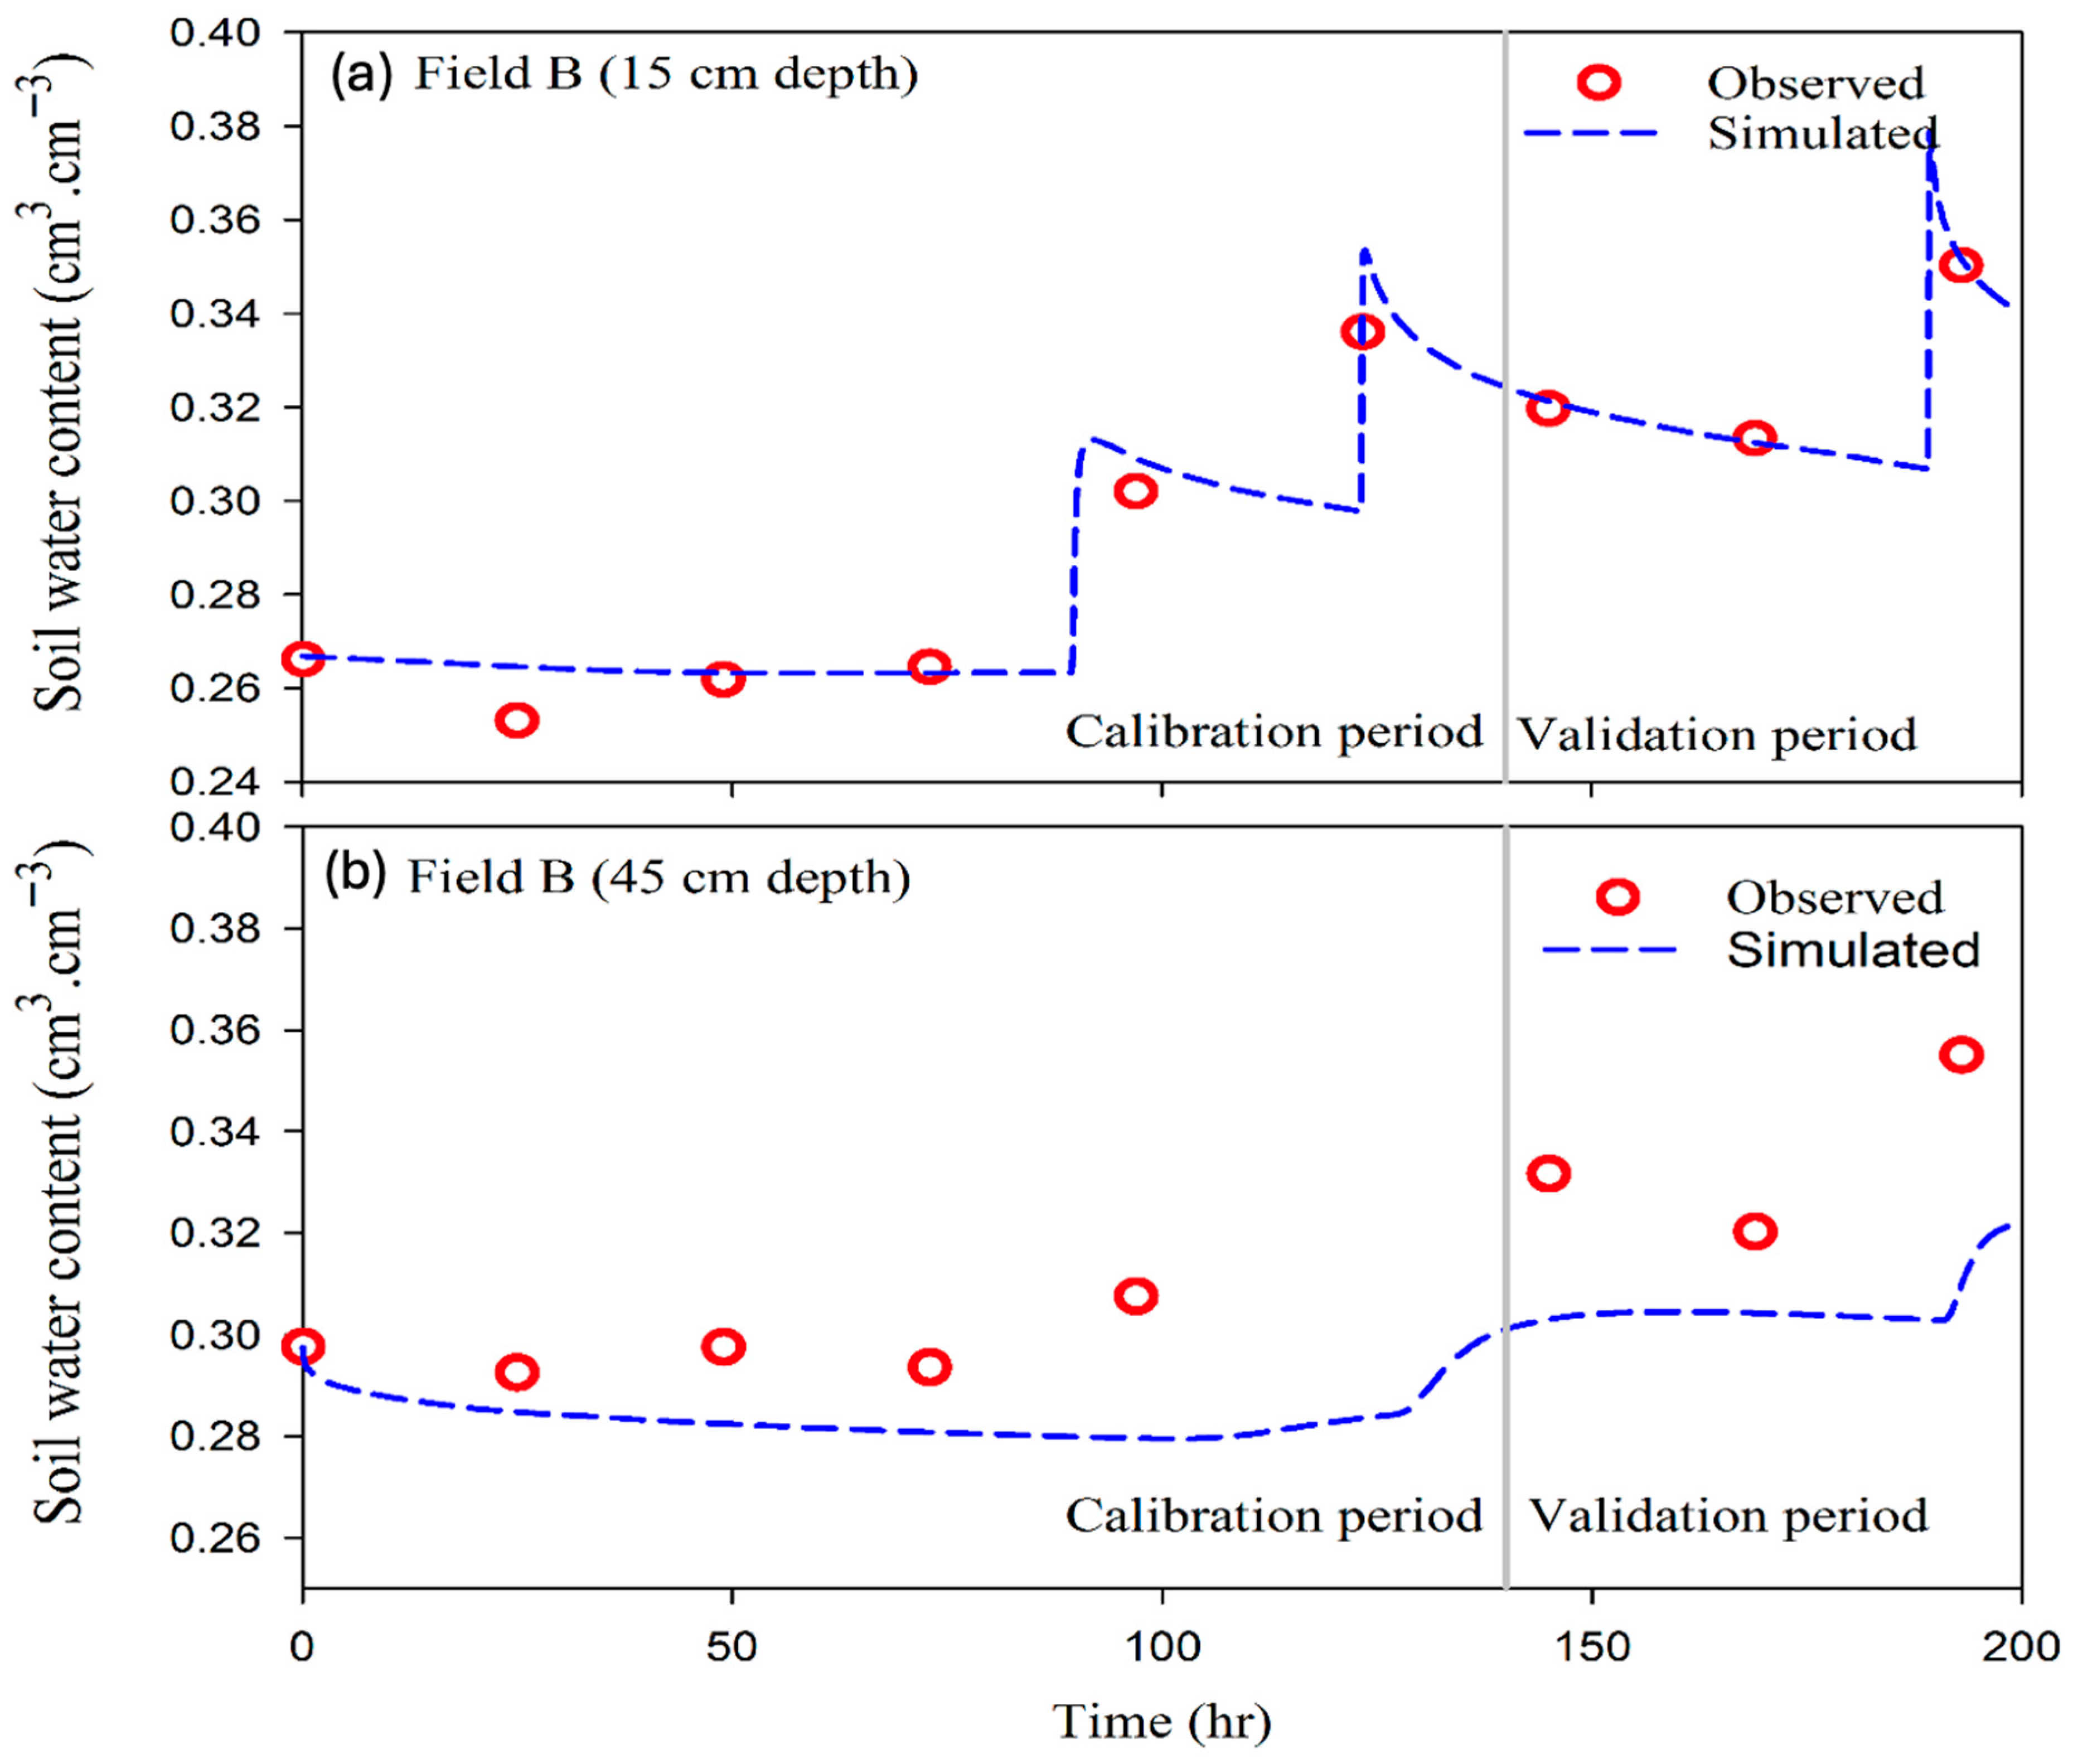
Inverse modeling results for Fields A–C are presented in Table 6 and Figure 7, Figure 8 and Figure 9. In this method, hydraulic parameters were automatically optimized by the Levenberg–Marquardt algorithm. In Field B, the estimated Ks showed high uncertainty (SE > measured value), indicating low model sensitivity; therefore, the measured Ks from the Shani method (21.2 cm h−1) was adopted.
For Fields A and C, five parameters (θr, θs, α, n, Ks) were estimated, while for Field B only four (θr, θs, α, n) were estimated. Standard errors of θr were higher than mean values in all fields, indicating low calibration sensitivity, consistent with findings by Rasoulzadeh and Homapoor Ghoorabjiri [27] and Rasoulzadeh and Yaghoubi [28]. The parameter n showed the greatest sensitivity.
The parameter correlation matrices (Table 7) confirm that most correlations were < 0.90, indicating well-defined minima and reliable parameter estimation. Some moderate inter-parameter dependencies (e.g., θrn in Field B; θrθsα in Field C) reflect intrinsic correlations inherent in the van Genuchten model [44]. To ensure convergence, multiple initial parameter sets were tested, yielding consistent results. Finally, statistical indices for inverse modeling simulations are summarized in Table 8.
Figure 7, Figure 8 and Figure 9 show good agreement between measured and simulated θ for both calibration and validation periods, particularly at 15 cm. Model accuracy decreased with depth but remained acceptable (NRMSE < 10% in all cases).

3.6. Comparison Evaluation Using Taylor Diagrams

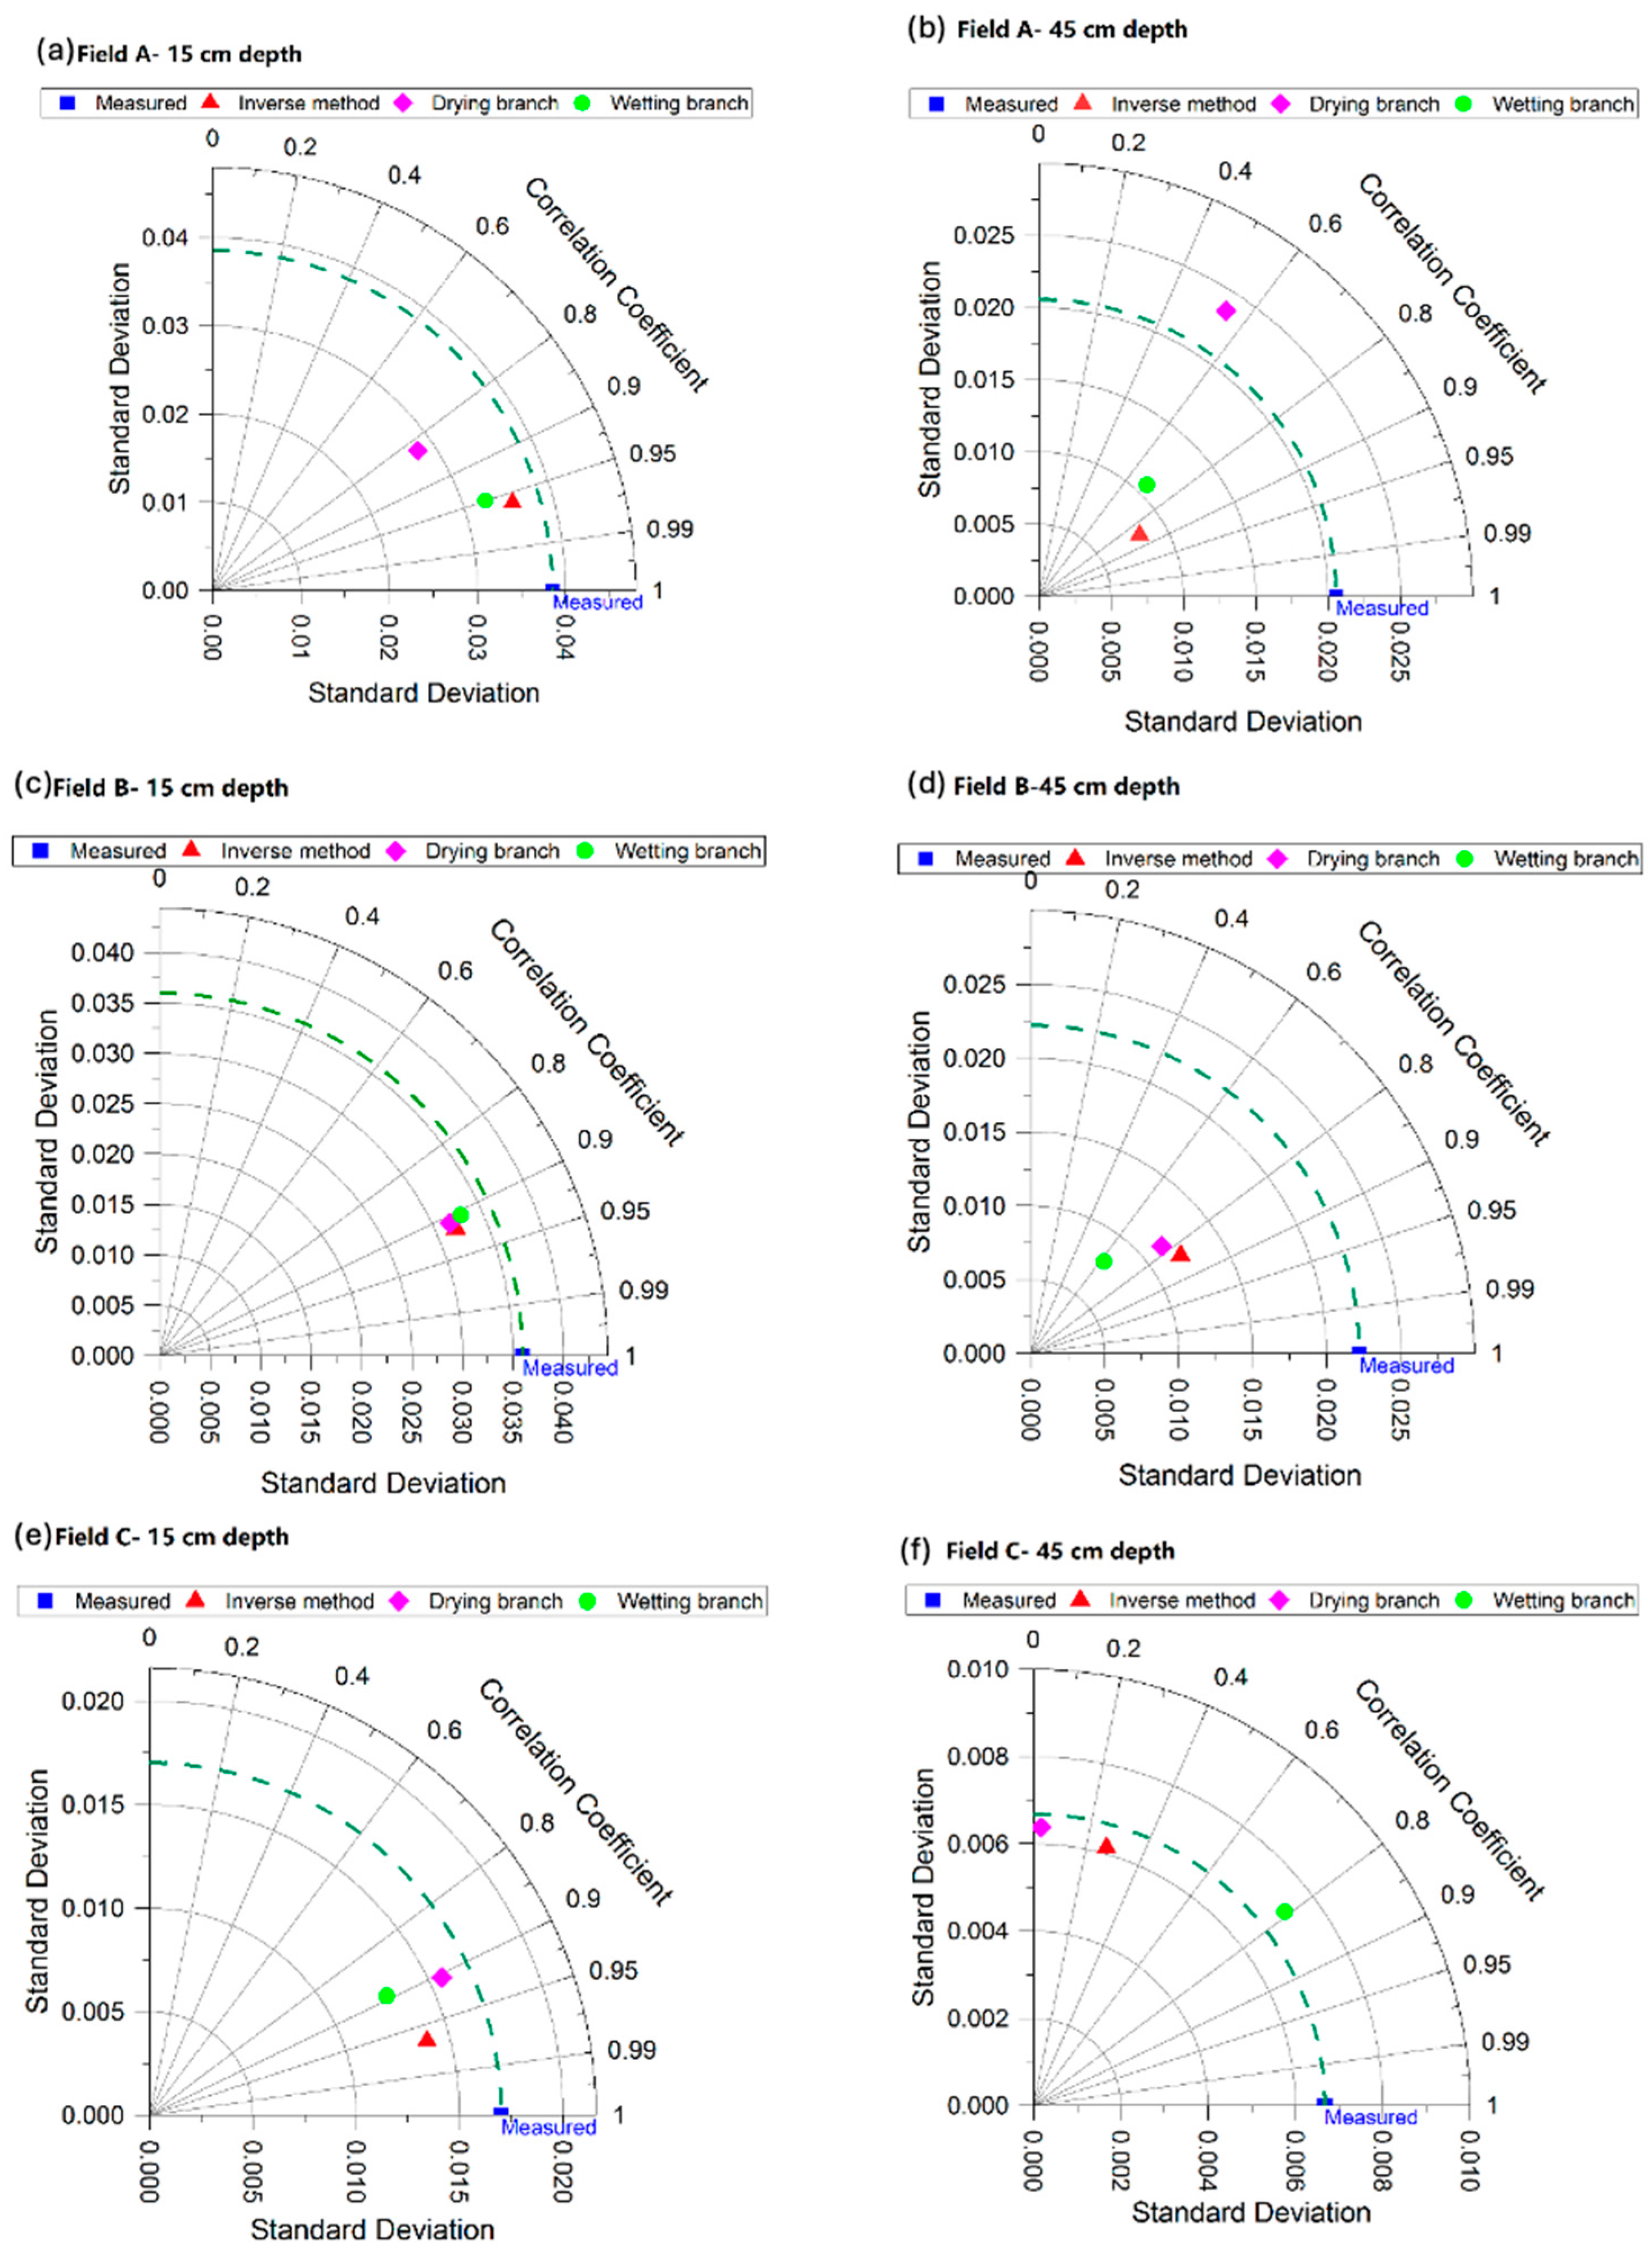
Taylor diagrams (Figure 10) summarize the performance of the three approaches—drying branch, wetting branch, and inverse modeling—at both depths and across all fields.
At 15 cm depth in Field A, both the inverse and wetting approaches showed near-perfect agreement with measured data (r ≈ 0.95–0.96), while the drying branch lagged (r ≈ 0.82). At 45 cm, the inverse approach retained higher correlation (r ≈ 0.85) but underpredicted variability, whereas the drying branch showed poor pattern match (r ≈ 0.50).
In Field B, all three methods performed well at 15 cm (r = 0.91–0.93). At 45 cm, inverse modeling again achieved the best performance (r ≈ 0.83), followed by the drying branch (r ≈ 0.78) and the wetting branch (r ≈ 0.61).
In Field C, at 15 cm, the inverse method exhibited the highest accuracy (r ≈ 0.97), followed by drying and wetting branches (r ≈ 0.90). At 45 cm, however, the wetting branch outperformed both (r ≈ 0.80), confirming its superior representation of irrigation-driven rewetting dynamics.
Overall, the inverse modeling approach produced the most accurate and consistent results, particularly at shallow depths, due to its ability to directly calibrate hydraulic parameters from observed data. The wetting-branch approach provided a strong practical alternative, especially at depth, where direct calibration is less feasible.
These findings align with previous research confirming the effectiveness of inverse modeling in capturing soil water dynamics under field conditions [45,46,47]. The superior performance of the wetting branch in some cases is physically justified: during irrigation events, the active wetting process governs flow and storage, making wetting-curve parameters more representative than those of the drying phase.

4. Conclusions

This study demonstrates that inverse modeling is the most accurate method for simulating soil water dynamics under center-pivot irrigation in semi-arid regions. By directly optimizing the van Genuchten parameters using field data, inverse modeling achieved excellent agreement (NRMSE < 10%), particularly at 15 cm depth.
The wetting-branch SWRC approach, derived from Shani’s drip method, significantly improved predictions compared to the conventional drying branch (e.g., Field A: 4.61% vs. 7.48% NRMSE). Because irrigation actively re-wets previously dry soil, the wetting branch provides a more realistic representation of soil–water dynamics during irrigation events, making it a valuable alternative when inverse modeling is not feasible—especially for deeper soil layers.
The principal innovation of this research lies in the integrated, side-by-side evaluation of three modeling approaches—drying branch, wetting branch, and inverse modeling—under real field conditions in a semi-arid environment. This comparative analysis provides practical insights into their relative accuracies at different depths and identifies complementary applications of each method.
From a water management perspective, the results offer actionable guidance for selecting appropriate modeling strategies under semi-arid irrigation. Inverse modeling, though data- and computation-intensive, delivers precise calibration and is best suited to research and precision irrigation systems. Conversely, the wetting-branch approach, based on straightforward field observations, is more accessible and scalable, offering a practical option for farm-level irrigation scheduling and extension programs.
Overall, the findings highlight that inverse calibration supplemented with wetting-curve data provides a robust framework for optimizing irrigation scheduling and improving water-use efficiency in water-limited agroecosystems. Future research should focus on depth-dependent parameterization, soil heterogeneity, and the integration of real-time soil water sensors to further enhance model reliability for deep-soil simulations and adaptive irrigation management.

Author Contributions

Conceptualization, A.R., M.R.K. and A.A.; methodology, M.H. and J.A.M.; validation, M.R., J.R.M. and J.F.-G.; formal analysis, A.R., M.R. and M.H.; investigation, J.A.M. and J.R.M.; data curation, A.R., A.A. and M.R.; writing—original draft preparation, A.R.; writing—review and editing, A.R. and J.F.-G.; visualization, A.R. and J.F.-G. All authors have read and agreed to the published version of the manuscript.

Funding

Internal funding provide from the University of Mohaghegh Ardabili, no external funding provided.

Data Availability Statement

Data used in this study are available under reasonable request from authors.

Conflicts of Interest

The authors declare no conflict of interest.

References

  1. Lou, B.; Hu, Y.; Li, T.; Liu, Q.; Wang, J.; Dong, X.; Tian, L.; Zhang, X.; Bian, W.; Liu, T. Assessment of saline water irrigation on biomass and quality of alfalfa: A sustainable agriculture perspective. Agric. Water Manag. 2025, 314, 109504. [Google Scholar] [CrossRef]
  2. Muhammed, H.H.; Anlauf, R.; Daum, D. Estimation of Hydraulic Properties of Growing Media from Numerical Inversion of Mini Disk Infiltrometer Data. Hydrology 2025, 12, 100. [Google Scholar] [CrossRef]
  3. Li, J.; Jiao, X.; Jiang, H.; Song, J.; Chen, L. Optimization of irrigation scheduling for maize in an arid oasis based on simulation–optimization model. Agronomy 2020, 10, 935. [Google Scholar] [CrossRef]
  4. Šimůnek, J.; Hopmans, J.W. 1.7 parameter optimization and nonlinear fitting. Methods Soil Anal. Part 4 Phys. Methods 2002, 5, 139–157. [Google Scholar] [CrossRef]
  5. Twarakavi, N.K.C.; Šimůnek, J.; Seo, S. Evaluating interactions between groundwater and vadose zone using the HYDRUS-based flow package for MODFLOW. Vadose Zone J. 2008, 7, 757–768. [Google Scholar] [CrossRef]
  6. Zhang, Y.; Li, X.; Šimůnek, J.; Shi, H.; Chen, N.; Hu, Q. Quantifying water and salt movement in a soil-plant system of a corn field using HYDRUS (2D/3D) and the stable isotope method. Agric. Water Manag. 2023, 288, 108492. [Google Scholar] [CrossRef]
  7. Xu, C.; Zeng, W.-Z.; Wu, J.-W.; Huang, J.-S. Effects of different irrigation strategies on soil water, salt, and nitrate nitrogen transport. Ecol. Chem. Eng. 2015, 22, 589. [Google Scholar] [CrossRef]
  8. Arbat Pujolràs, G.; Cufí Aregay, S.; Duran i Ros, M.; Pinsach i Boada, J.; Puig Bargués, J.; Pujol Planella, J.; Ramírez de Cartagena Bisbe, F. Modeling Approaches for Determining Dripline Depth and Irrigation Frequency of Subsurface Drip Irrigated Rice on Different Soil Textures. Water 2020, 12, 1724. [Google Scholar] [CrossRef]
  9. Raoof, M.; Akbari Baseri, Z.; Rasoulzadeh, A.; Azizi Mobaser, J. Sensitivity analysis of Hydrus software to input data in simulating water movement and root uptake of grass as a reference plant. Water Soil Manag. Model. 2022, 2, 94–107. [Google Scholar] [CrossRef]
  10. Kim, D.H.; Kim, J.; Kwon, S.H.; Jung, K.-Y.; Lee, S.H. Simulation of soil water movement in upland soils under sprinkler and spray hose irrigation using HYDRUS-1D. J. Biosyst. Eng. 2022, 47, 448–457. [Google Scholar] [CrossRef]
  11. Feng, Z.; Miao, Q.; Shi, H.; Feng, W.; Li, X.; Yan, J.; Liu, M.; Sun, W.; Dai, L.; Liu, J. Simulation of water balance and irrigation strategy of typical sand-layered farmland in the Hetao Irrigation District, China. Agric. Water Manag. 2023, 280, 108236. [Google Scholar] [CrossRef]
  12. Etminan, S.; Jalali, V.; Mahmodabadi, M.; Khashei-Siuki, A.; Pourreza Bilondi, M. Assessing the hydraulic parameter’s uncertainty of the HYDRUS model using DREAM method. Water Soil Manag. Model. 2022, 3, 1–15. [Google Scholar] [CrossRef]
  13. Nouri, A.; Sadraddini, A.A.; Samadianfard, S.; Mikaeili, F. Simulation of moisture distribution in different soil textures under a point source using the moment analysis method. Water Soil Manag. Modeling 2024, 4, 167–182. [Google Scholar] [CrossRef]
  14. Elliott, J. Evaluating Parameter Fitting and Model Design for Unsaturated Processes in Peatlands; University of Waterloo: Waterloo, ON, Canada, 2019. [Google Scholar]
  15. Rasoulzadeh, A.; Sepaskhah, A. Advanced Topics in Soil Water Physics; University of Mohaghegh Ardabili: Ardabil, Iran, 2021; ISBN 978-622-7258-86-8. [Google Scholar]
  16. Singh, A.; Verdi, A. Estimating the soil water retention curve by the HYPROP-WP4C system, HYPROP-based PCNN-PTF and inverse modeling using HYDRUS-1D. J. Hydrol. 2024, 639, 131657. [Google Scholar] [CrossRef]
  17. Shani, U.; Hanks, R.; Bresler, E.; Oliveira, C. Field method for estimating hydraulic conductivity and matric potential-water content relations. Soil Sci. Soc. Am. J. 1987, 51, 298–302. [Google Scholar] [CrossRef]
  18. Scott, P.; Farquhar, G.; Kouwen, N. Hysteretic Effects on Net Infiltration. In Advances in Infiltration; American Society of Agricultural Engineers Publication: St. Joseph, MI, USA, 1983; pp. 163–170. [Google Scholar]
  19. Kool, J.; Parker, J.C. Development and evaluation of closed-form expressions for hysteretic soil hydraulic properties. Water Resour. Res. 1987, 23, 105–114. [Google Scholar] [CrossRef]
  20. Varsa, E.; Chong, S.; Abolaji, J.; Farquhar, D.; Olsen, F. Effect of deep tillage on soil physical characteristics and corn (Zea mays L.) root growth and production. Soil Tillage Res. 1997, 43, 219–228. [Google Scholar] [CrossRef]
  21. Bandyopadhyay, K.; Aggarwal, P.; Chakraborty, D.; Pradhan, S.; Garg, R.N.; Singh, R. Practical Manual on Measurement of Soil Physical Properties; Division of Agricultural Physics, Indian Agricultural Research Institute: New Delhi, India, 2012; Volume 62. [Google Scholar]
  22. Jabro, J.D.; Stevens, W.B.; Iversen, W.M. Comparing two methods for measuring soil bulk density and moisture content. Open J. Soil Sci. 2020, 10, 233–243. [Google Scholar] [CrossRef]
  23. Zhu, Z.; Zhou, Y.; Li, X.; Liu, L.; Lu, Y.; Ren, T. Measuring soil particle density using water pycnometer: Influencing factors, errors, and correction. Soil Sci. Soc. Am. J. 2025, 89, e70073. [Google Scholar] [CrossRef]
  24. Rasoulzadeh, A.; Bezaatpour, J.; Mobaser, J.A.; Fernández-Gálvez, J. Performance of a set of soil water retention models for fitting soil water retention data covering all textural classes. Land 2024, 13, 487. [Google Scholar] [CrossRef]
  25. Feddes, R.; Kowalik, P.; Zaradny, H. Simulation of Field Water Use and Crop Yield; Centre for Agricultural Publishing and Documentation: Wageningen, The Netherlands, 1978. [Google Scholar]
  26. Wesseling, J. Steady State Moisture Flow Theory; Program Description; User Manual; Report; The Winand Staring Centre: Wageningen, The Netherlands, 1991; Volume 37. [Google Scholar]
  27. Rasoulzadeh, A.; Homapoor Ghoorabjiri, M. Comparing hydraulic properties of different forest floors. Hydrol. Process. 2014, 28, 5122–5130. [Google Scholar] [CrossRef]
  28. Rasoulzadeh, A.; Yaghoubi, A. Inverse modeling approach for determining soil hydraulic properties as affected by application of cattle manure. Int. J. Agric. Biol. Eng. 2014, 7, 27–35. [Google Scholar] [CrossRef]
  29. Autovino, D.; Bagarello, V.; Caltabellotta, G.; Fusco, M.; Iovino, M. Determining saturated hydraulic conductivity of a repacked loam soil by the simplified falling-head technique: Impact of sieving duration and scraping of exposed surfaces. Soil Water Res. 2024, 19, 210–217. [Google Scholar] [CrossRef]
  30. Šimůnek, J.; Van Genuchten, M.T.; Šejna, M. Recent developments and applications of the HYDRUS computer software packages. Vadose Zone J. 2016, 15, 1–25. [Google Scholar] [CrossRef]
  31. Van Genuchten, M.T. A closed-form equation for predicting the hydraulic conductivity of unsaturated soils. Soil Sci. Soc. Am. J. 1980, 44, 892–898. [Google Scholar] [CrossRef]
  32. Mualem, Y. A new model for predicting the hydraulic conductivity of unsaturated porous media. Water Resour. Res. 1976, 12, 513–522. [Google Scholar] [CrossRef]
  33. Van Genuchten, M.T.; Leij, F.; Yates, S. The RETC Code for Quantifying the Hydraulic Functions of Unsaturated Soils; Robert S. Kerr Environmental Research Laboratory, Office of Research and Development, US Environmental Protection Agency: Ada, OK, USA, 1992. [Google Scholar]
  34. Wooding, R. Steady infiltration from a shallow circular pond. Water Resour. Res. 1968, 4, 1259–1273. [Google Scholar] [CrossRef]
  35. Brooks, R.; Corey, A. Hydraulic Properties of Porous Media. Hydrology Paper No. 3; Civil Engineering Department, Colorado State University: Fort Collins, CO, USA, 1964. [Google Scholar]
  36. Marquardt, D.W. An algorithm for least-squares estimation of nonlinear parameters. J. Soc. Ind. Appl. Math. 1963, 11, 431–441. [Google Scholar] [CrossRef]
  37. Legates, D.R.; McCabe, G.J., Jr. Evaluating the use of “goodness-of-fit” measures in hydrologic and hydroclimatic model validation. Water Resour. Res. 1999, 35, 233–241. [Google Scholar] [CrossRef]
  38. Li, M.-F.; Tang, X.-P.; Wu, W.; Liu, H.-B. General models for estimating daily global solar radiation for different solar radiation zones in mainland China. Energy Convers. Manag. 2013, 70, 139–148. [Google Scholar] [CrossRef]
  39. Zakizadeh Abkenar, F.; Rasoulzadeh, A. Functional evaluation of Pedotransfer functions for simulation of soil profile drainage. Irrig. Drain. 2019, 68, 573–587. [Google Scholar] [CrossRef]
  40. Ayers, R.S.; Westcot, D.W. Water Quality for Agriculture; Food and Agriculture Organization of the United Nations Rome: Rome, Italy, 1985; Volume 29. [Google Scholar]
  41. Abdoli, S.; Rahmati, M.; Ahmadi, H.; Kamali, B.; Groh, J.; Vereecken, H. Interplay of soil moisture memory and soil hysteresis. Authorea Prepr. 2024. [Google Scholar] [CrossRef]
  42. Yu, J.; Wu, Y.; Xu, L.; Peng, J.; Chen, G.; Shen, X.; Lan, R.; Zhao, C.; Zhangzhong, L. Evaluating the Hydrus-1D model optimized by remote sensing data for soil moisture simulations in the maize root zone. Remote Sens. 2022, 14, 6079. [Google Scholar] [CrossRef]
  43. Chen, M.; Willgoose, G.R.; Saco, P.M. Spatial prediction of temporal soil moisture dynamics using HYDRUS-1D. Hydrol. Process. 2014, 28, 171–185. [Google Scholar] [CrossRef]
  44. Dexter, A.; Czyż, E.; Richard, G.; Reszkowska, A. A user-friendly water retention function that takes account of the textural and structural pore spaces in soil. Geoderma 2008, 143, 243–253. [Google Scholar] [CrossRef]
  45. Etminan, S.; Mahmoodabadi, M.; Khashei Siuki, A.; Pourreza Bilondi, M. Investigating the effect of optimizing soil hydraulic parameters with inverse and parametric solution methods in increasing the accuracy of water movement simulation with HYDRUS. Appl. Soil Res. 2021, 9, 15–30. [Google Scholar]
  46. Ritter, A.; Hupet, F.; Muñoz-Carpena, R.; Lambot, S.; Vanclooster, M. Using inverse methods for estimating soil hydraulic properties from field data as an alternative to direct methods. Agric. Water Manag. 2003, 59, 77–96. [Google Scholar] [CrossRef]
  47. Scharnagl, B.; Vrugt, J.; Vereecken, H.; Herbst, M. Inverse modelling of in situ soil water dynamics: Investigating the effect of different prior distributions of the soil hydraulic parameters. Hydrol. Earth Syst. Sci. 2011, 15, 3043–3059. [Google Scholar] [CrossRef]
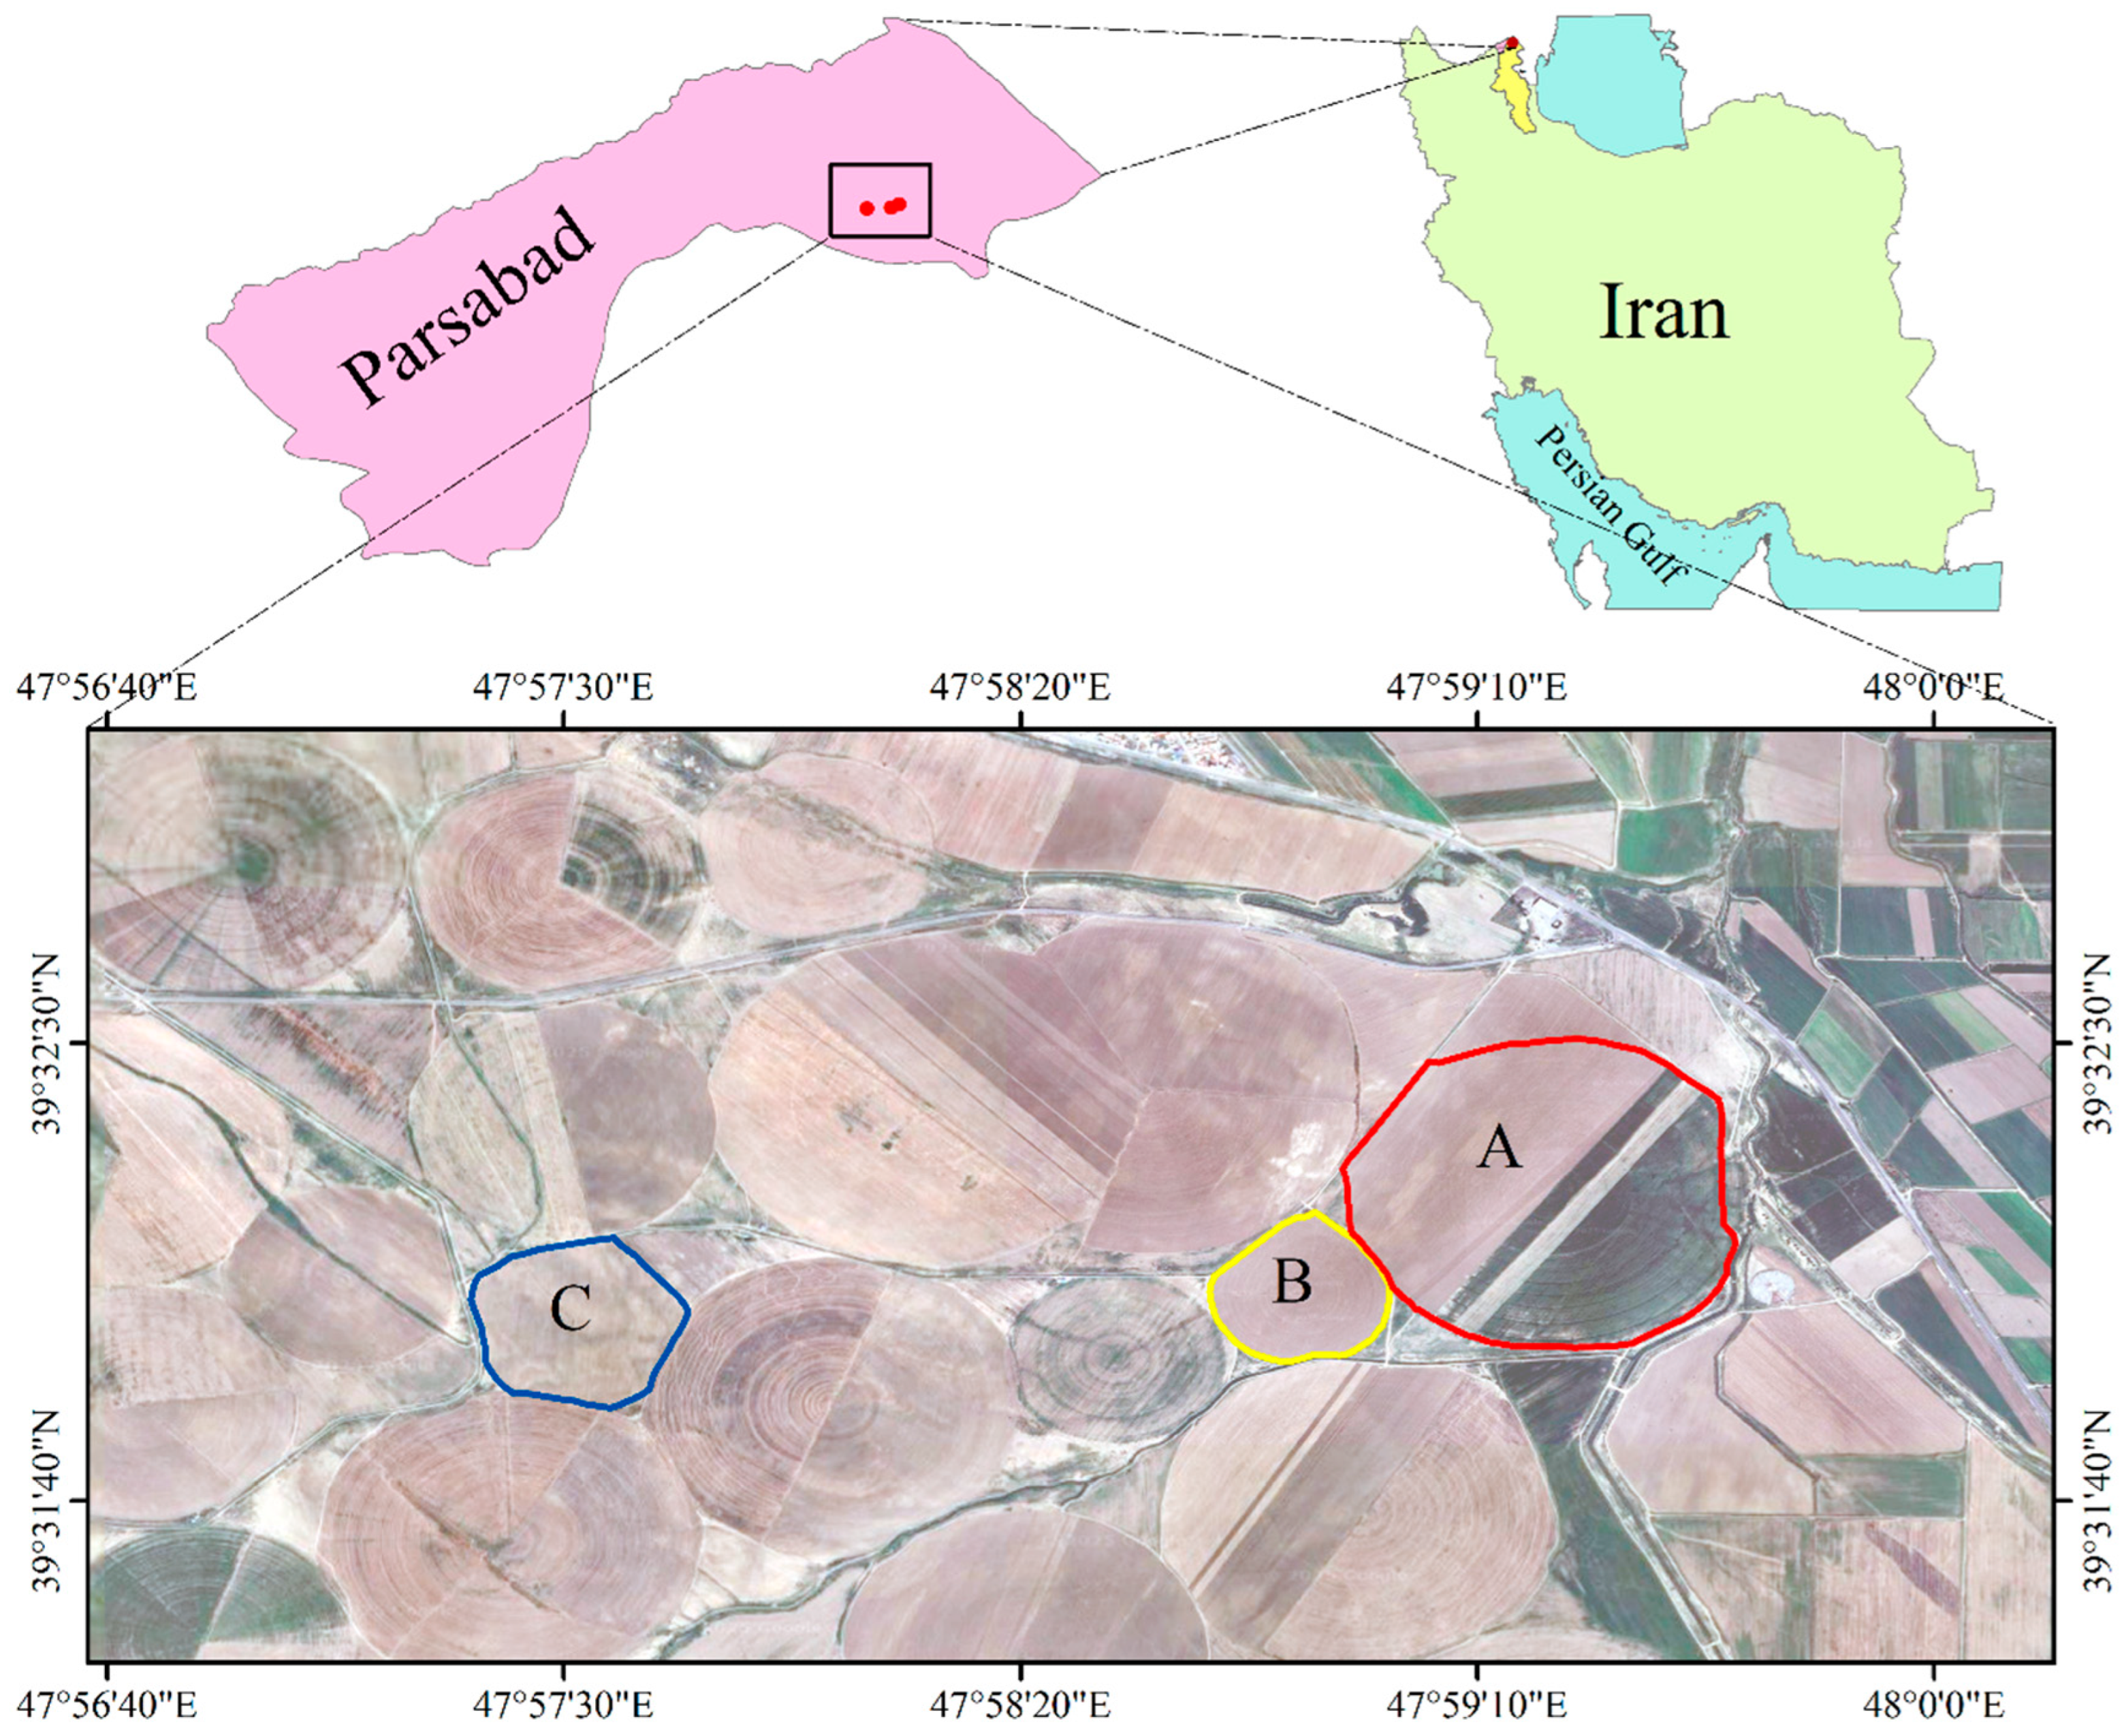
Figure 1. Location of the study area with three center-pivot irrigation systems designated as Fields A, B, and C.
Hydrology 12 00273 g001
Figure 2. Saturated and unsaturated zone in the dripper experiment at the study area.
Hydrology 12 00273 g002
Figure 3. Drying and wetting SWRCs for Fields A, B, and C at 15 cm depth.
Hydrology 12 00273 g003
Figure 4. Observed vs. simulated soil water content under drying and wetting branches for Field A at two soil depths (15 and 45 cm).
Hydrology 12 00273 g004
Figure 5. Observed vs. simulated soil water content under drying and wetting branches for Field B at two soil depths (15 and 45 cm).
Hydrology 12 00273 g005
Figure 6. Observed vs. simulated soil water content under drying and wetting branches for Field C at two soil depths (15 and 45 cm).
Hydrology 12 00273 g006
Figure 7. Comparison between observed and simulated soil water content by HYDRUS-1D using inverse method for Field A at two soil depths (15 and 45 cm).
Hydrology 12 00273 g007
Figure 8. Comparison between observed and simulated soil water content by HYDRUS-1D using inverse method for Field B at two soil depths (15 and 45 cm).
Hydrology 12 00273 g008
Figure 9. Comparison between observed and simulated soil water content by HYDRUS-1D using inverse method for Field C at two soil depths (15 and 45 cm).
Hydrology 12 00273 g009
Figure 10. Taylor diagram of the soil water content simulations (15 cm and 45 cm) for Fields A, B, and C.
Hydrology 12 00273 g010
Table 1. Daily meteorological data (Parsabad synoptic station).
DateWind Speed (m s−1)Max T (°C)Min T (°C)Humidity (%)Sunshine
(h)
Rn
(MJ m−2 d−1)
12 August 20244.3524.815.0628.98.87
13 August 20243.4424.012.4667.28.54
14 August 20243.4427.310.16111.29.97
15 August 20244.5322.813.4873.27.19
16 August 20245.2522.815.2894.27.44
17 August 20245.822.111.37810.49.76
18 August 20242.4520.67.4951.36.68
19 August 20242.5424.613.7864.97.72
20 August 20242.9925.611.3839.69.43
21 August 20242.5427.510.48010.09.57
22 August 20243.4430.08.15911.110.03
23 August 20243.5332.012.46311.79.8
Max T (°C): daily maximum air temperature (highest value during the local 24 h period). Min T (°C): daily minimum air temperature (lowest value during the local 24 h period). Rn (MJ m−2 d−1): daily net radiation at the surface (shortwave + longwave).
Table 2. Physical and chemical soil properties of Fields A, B, and C.
FieldSoil Depth (cm)Soil TextureEC (dS m−1)Soil pH ρ p (g cm−3) ρ b (g cm−3)Porosity
(-)
A0–30Silty Clay Loam2.277.262.571.400.45
30–60Silty Clay Loam2.007.322.611.470.44
B0–30Silty Clay 1.266.882.541.460.42
30–60Silty Clay1.707.462.641.530.42
C0–30Silty Clay2.207.092.751.230.55
30–60Silty Clay1.006.582.731.240.55
Note: ρ p : particle density, ρ b : dry bulk density, EC: electrical conductivity.
Table 3. Parameters of the drying (van Genuchten [31]) and wetting (Brooks–Corey [35]) SWRCs.
MethodParameterField AField BField C
Pressure plate method
(van Genuchten model)
θr0.1510.1890.000
θs0.4600.4300.550
α (1 cm−1)0.0140.0310.007
n1.3041.4361.191
Ks (cm h−1)27.418.610.92
Shani method
(Brooks–Corey model)
θr0.0770.1540.117
θs0.4600.4300.550
α (1 cm−1)0.8350.7660.560
λ0.2830.2440.334
Ks (cm h−1)36.421.219.8
For Farm C, θr was truncated to 0.000 by the RETC solver (default handling θr < 0.001 (cm−3) → 0). This software truncation reflects parameter trade-offs under limited dry-end support and does not imply a physically null residual water content.
Table 4. Statistical indices for drying-branch simulations of soil water content.
FieldDepth (cm)RMSE (cm3 cm−3)MAE (cm3 cm−3)NRMSE (%)
A150.0230.0197.48
450.0310.02610.46
B150.0140.0084.86
450.0260.0228.36
C150.0080.0062.90
450.0170.0167.21
Table 5. Statistical indices for wetting-branch simulations of soil water content.
LocationDepth (cm)RMSE (cm3 cm−3)MAE (cm3 cm−3)NRMSE (%)
A150.0140.0104.61
450.0150.0125.05
B150.0140.0084.87
450.0280.0228.97
C150.0140.0115.36
450.0070.0063.10
Table 6. Estimated van Genuchten parameters and standard errors for Fields A, B, and C (Ks: saturated hydraulic conductivity, θs: saturated water content, θr: residual water content, α and n: shape parameters).
Estimated ParametersField AField BField C
ValueSEValueSEValueSE
θr0.0130.1320.0870.1820.0210.297
θs0.490.0890.4320.0560.3990.139
α (1 cm−1)0.0550.0420.0130.0270.050.088
n1.410.1851.1170.1171.2580.147
Ks (cm h−1)7.82511.476 34.822
Table 7. Correlation matrix of estimated van Genuchten parameters for Field A, B, and C (Ks: saturated hydraulic conductivity, θs: saturated water content, θr: residual water content, α and n: shape parameters).
Field AField BField C
θrθsαnKsθrθsαnθrθsαnKs
θr1.00 1.00 1.00
θs0.111.00 0.391.00 −0.851.00
α0.470.061.00 0.32−0.631.00 0.89−0.881.00
n0.670.40−0.221.00 0.880.450.281.000.150.33−0.141.00
Ks0.220.610.73−0.171.00 0.65−0.740.76−0.471.00
Table 8. Statistical indices for inverse modeling simulations.
FieldDepth (cm)RMSE (cm3 cm−3)MAE (cm3 cm−3)NRMSE (%)
A150.0110.0083.47
450.0140.0104.52
B150.0130.0064.39
450.0230.0197.40
C150.0060.0052.29
450.0090.0073.74
Disclaimer/Publisher’s Note: The statements, opinions and data contained in all publications are solely those of the individual author(s) and contributor(s) and not of MDPI and/or the editor(s). MDPI and/or the editor(s) disclaim responsibility for any injury to people or property resulting from any ideas, methods, instructions or products referred to in the content.