Abstract
This study involved an investigation of the long-term seasonal rainfall patterns in central India at the district level during the period from 1991 to 2020, including various aspects such as the spatiotemporal seasonal trend of rainfall patterns, rainfall variability, trends of rainy days with different intensities, decadal percentage deviation in long-term rainfall patterns, and decadal percentage deviation in rainfall events along with their respective intensities. The central region of India was meticulously divided into distinct subparts, namely, Gujarat, Daman and Diu, Maharashtra, Goa, Dadra and Nagar Haveli, Madhya Pradesh, Chhattisgarh, and Odisha. The experimental outcomes represented the disparities in rainfall distribution across different districts of central India with the spatial distribution of mean rainfall ranges during winter (2.08 mm over Dadra and Nagar Haveli with an average of 24.19 mm over Odisha), premonsoon (6.65 mm over Gujarat to 132.89 mm over Odisha), monsoon (845.46 mm over Gujarat to 3188.21 mm over Goa), and post-monsoon (30.35 mm over Gujarat to 213.87 mm over Goa), respectively. Almost all the districts of central India displayed an uneven pattern in the percentage deviation of seasonal rainfall in all three decades for all seasons, which indicates the seasonal rainfall variability over the last 30 years. A noticeable variation in the percentage deviation of seasonal rainfall patterns has been observed in the following districts: Rewa, Puri, Anuppur, Ahmadabad, Navsari, Chhindwara, Devbhumi Dwarka, Amreli, Panch Mahals, Kolhapur, Kandhamal, Ratnagiri, Porbandar, Bametara, and Sabar Kantha. In addition, a larger number of rainy days of various categories occurred in the monsoon season in comparison to other seasons. A higher contribution of trace rainfall events was found in the winter season. The highest contributions of very light, light rainfall, moderate, rather high, and high events were found in the monsoon season in central India. The percentage of various categories of rainfall events has decreased over the last two decades (2001–2020) in comparison to the third decade (1991–2000), according to the mean number of rainfall events in the last 30 years. This spatiotemporal analysis provides valuable insights into the rainfall trends in central India, which represent regional disparities and the potential challenges impacted by climate patterns. This study contributes to our understanding of the changing rainfall dynamics and offers crucial information for effective water resource management in the region.
1. Introduction
Global rainfall monitoring is a major concern for researchers worldwide on account of climate variability resulting from anthropogenic activities [1,2,3,4]. Climate change, in conjunction with a handful of human-driven activities, steadily increases the concentration of carbon and other greenhouse gases in the lower atmosphere [5]. Such vast climate variability has drawn attention to the need to characterize the amending pattern of global rainfall. The average global rainfall increases and decreases on continental scales [6,7]. The heightened occurrence of extreme rainfall events is a direct result of global warming and climate change. However, the significant alterations in the behavior of hydro-climatic variables do not uniformly impact the global scale; rather, they manifest distinct local variations [8].
Over the past few decades, a multitude of studies have been carried out to elucidate the regional-scale effects of climate change and global warming on rainfall dynamics [9,10,11]. The spatiotemporal variability of rainfall in the regions is responsible for altering the surface soil moisture, groundwater, and the occurrence of flood and drought conditions, which influence crops and food security [12,13]. Long-term hydroclimatic variability and distribution have useful implications for extreme hydrological events like flooding, cloud bursts, and drought along with influences on water resources [14,15,16,17]. Extreme hydrological events have serious repercussions on human life regarding health, the environment, and socioeconomics [18,19,20]. A climatic variability study offers a distinct opportunity to extend the rainfall estimates of past precipitation temporal distribution and allow prior variations and trends on proper time scales [21]. This analysis requires long-term rainfall distribution and intensity trends along with the temporal assignment.
Several studies have provided valuable insights into the spatiotemporal distributions and variability of rainfall within the domain of Indian climatology [5,22]. Recently, India has confronted several excessive rainfall occasions that have led to huge harm to infrastructure and affected the lives of thousands and thousands of people [23,24]. Few studies have shown an increased frequency of precipitation events in several parts of India with a decrease in annual precipitation [25,26]. Nevertheless, several studies conducted at the regional scale have identified certain pockets where long-term rainfall has undergone significant alterations. A recent study observed a diminishing trend in rainfall in areas of northwest India affected by drought [27]. Certain regions of the country have seen a rising trend in the frequency of heavy rainfall events during the southwest monsoon, as noted by some researchers. Conversely, the winter, premonsoon, and post-monsoon seasons have displayed decreasing trends in heavy rainfall events. Another study, which analyzed rainfall data from 1871 to 2002, reported a decrease in monsoon rainfall and an increase in rainfall during the premonsoon and post-monsoon seasons [20,28,29]. A decline in summer monsoon rainfall has been detected in the northeast and northwest regions of the peninsula and in northeastern India [30]. On the flip side, the western coast, central peninsula, and northwest India are exhibiting a contrasting trend, with a noticeable increase in summer monsoon rainfall. Furthermore, an analysis of data covering the period from 1951 to 2000 reveals a significant surge in the frequency of extreme rainfall events. During the monsoon season, there has been a marked decrease in the occurrence of moderate rainfall events in central India. Additionally, there has been a reduction in the number of cyclones originating from the Bay of Bengal, although their intensity has been found to be on the rise.
Different parts of central India have shown high variability in rainfall, including less rainfall, causing drought in some parts of Madhya Pradesh, along with high rainfall in the Gulf region [24,31]. Central India is witnessing the unmistakable effects of climate change, evident in delayed monsoon arrivals accompanied by diminished intensity [32]. Due to climate variability, seasonal variations lead to droughts, flash floods, and water scarcity. The global focus on climate change has emphasized the importance for the scientific community to analyze long-term precipitation trends using statistical methods [30,33]. The comprehensive study of the regional-level characteristics of local rainfall can be achieved through a trend analysis of variability [9,29,34]. A robust method called the innovative trend analysis method (ITAM) has been developed to investigate various aspects of hydrometeorology within the Indian subcontinent to address them effectively [35].
The central theme of this article relates to studying the spatiotemporal variation in rainfall patterns in the central part of India over the last three decades (1991–2020). It addresses the theme of the spatiotemporal variation of rainfall through the use of various researchers, who worked during monsoon season in most of the cases, as well as at a regional scale. The uniqueness of the present study is an examination of the seasonal variability in the distribution of rainfall patterns along with various rainfall intensities at the district level in central India over the last three decades. The distribution of rainfall has been investigated over a combined central Indian region containing distinct subparts i.e., Gujarat and Daman and Diu, Madhya Pradesh, Maharashtra, Goa, Dadara and Nagar Haveli, Chhattisgarh, and Odisha. The objectives are further divided as follows: first, to analyze the long-term (period from 1991 to 2020) seasonal statistics of rainfall pattern; second, to analyze long-term rainfall variability; third, to evaluate the long-term spatiotemporal seasonal percentage deviation of rainfall; fourth, as a sub-objective, to examine the distribution in terms of the spatiotemporal representation of various categories of rainfall events and their percentage contribution. The fifth sub-objective of this article is to present the decadal seasonal percentage deviation in rainfall events. These seasonal analyses have been divided into four temporal zones, i.e., (a) monsoon, (b) premonsoon, (c) post-monsoon, and (d) winter. The seasonal spatiotemporal rainfall trends have been analyzed across distinct categories that encompass conditions of no rain, trace rain, extremely light rain, light rain, moderate rain, heavy rain, and exceptionally heavy rainfall. These distinctions can be instrumental in aiding policymakers to pinpoint regions at risk of droughts and floods. By virtue of this analysis, they will be well-equipped to efficiently allocate their available resources and promptly make informed socioeconomic decisions, thereby ensuring that suitable measures are implemented across the states.
2. Study Area and Dataset
Central India consists of six states and two regions with special administrative status, while Gujarat, Daman and Diu, Maharashtra, Goa, Dadra, and Nagar Haveli are situated in western India. Madhya Pradesh is in the center, and Chhattisgarh and Odisha are situated in eastern India. The Indian Peninsula was originally a part of Gondwana land, and tectonic movements allowed it to merge with the Eurasian Plate, except the Himalayan Indian peninsula is a plateau. Central India contains both the Central Highlands and the Deccan Plateau. The Aravalli mountain ranges run towards southwest India, which is the oldest in India. The Vindhyachal and Satpura mountain ranges rise in eastern Gujrat and north Maharashtra, running east to the southern region of Madhya Pradesh till Chhattisgarh.
Central India is also known for its rich biodiversity, which houses several national parks and wildlife sanctuaries, such as Kanha National Park and Pench Tiger Reserve, contributing to the conservation of endangered species, and with diverse ecosystems ranging from dense forests to fertile plains, supporting the cultivation of various crops. The region houses important rivers like the Narmada, Tapti, and Mahanadi, contributing significantly to the water resources of the country. The region’s central location makes it a hub for transportation and connectivity, playing a crucial role in linking various parts of the country and enabling industrial growth and development, particularly with the establishment of manufacturing units, power plants, and other industries. The region is also rich in minerals, including coal, limestone, bauxite, and more. The study area experiences a tropical-subtropical climate with distinct seasonal variations that are influenced by the monsoon. It is characterized by four predominant seasons: summer (March to May), monsoon (June to September), post-monsoon (October to November), and winter (December to February). The average annual rainfall in the area is approximately 1200 mm. Generally, rainfall decreases from east to west and increases towards the south. While rainfall occurs in most parts of the study area during monsoon months, the cropping pattern in central India is intricately linked to the spatial distribution of rainfall. For instance, in Madhya Pradesh, rice and wheat are popular crops, whereas, in the northern parts of central India, drought-tolerant crops like pearl millet dominate. The study area is divided into four subregions: 1. Gujarat Daman and Diu; 2. Maharashtra, Goa and Dadra, and Nagar Haveli; 3. Madhya Pradesh; 4. Chhattisgarh and Odisha. Figure 1 represents the map of the study region.
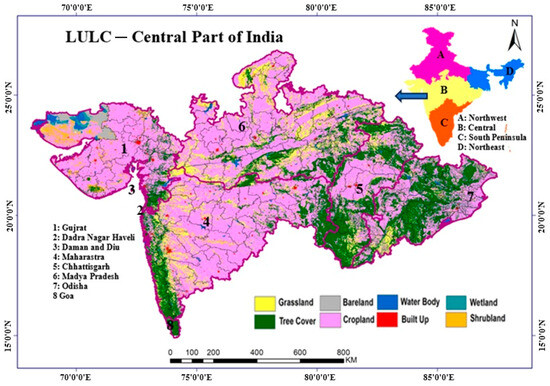
Figure 1.
Geographical location of study area (central India).
For the current study, diurnal rainfall data spanning 30 years from 1991 to 2020 were acquired from the India Meteorological Department (IMD) using a spatial resolution grid of 0.25 × 0.25 degrees. The data were specifically focused on central India and the zonal statistical average within the defined boundary of the study region. These data were processed to perform trend analysis, and any significant trends or patterns over the specified time frame were evaluated [36].
3. Methodology
Human-induced alterations to the landscape, including the expansion of cities, pollution, and extensive modifications to land use, have profoundly transformed local climates and ecosystems. These changes disrupt the delicate balance of nature and exacerbate the challenges associated with climate change, collectively emerging as key factors contributing to shifting rainfall patterns and the heightened prevalence of severe weather events.
Across India, the India Meteorological Department (IMD) has classified four distinct meteorological seasons, which are winter (January–February), premonsoon (March–May), monsoon (June–September), and post-monsoon (October–December). In this study, daily rainfall data were collected and accumulated for all these seasons. To analyze the patterns of seasonal rainfall, statistical examinations were performed, encompassing mean rainfall, deviation in rainfall percentages, the temporal distribution of rainfall, and trend analysis.
Furthermore, spatiotemporal visualization techniques were adopted to visualize the spatiotemporal rainfall variations across the study area. Based on rapid economic development at the national level in the last 30 years, three decadal periods (DTPs) intervals of 10 years—DTP1 (1991–2000), DTP2 (2001–2010), and DTP3 (2011–2020)—were selected for analyzing the rainfall distribution and variability. Figure 2 presents a visual diagram outlining the methodology that was carried out in this study. Other descriptions of the methods used are also presented in subsequent sections.
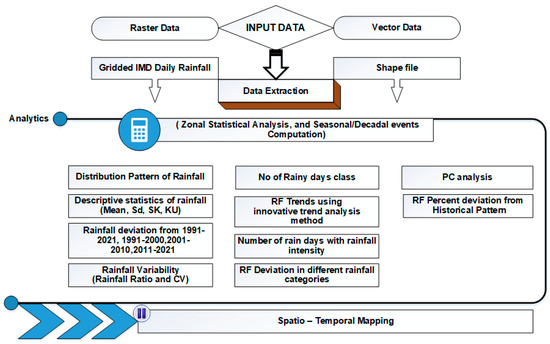
Figure 2.
The schematic flow chart of the methodology.
3.1. Statistical Computation of Long-Term Rainfall Pattern
The assessment of long-term rainfall patterns has entailed the examination of four fundamental statistical parameters: mean, standard deviation, skewness, and kurtosis. These parameters shed light on various facets of the dataset. Mean and standard deviation, which represent the dataset’s central tendency and dispersion, respectively, are fundamental statistical measures. The mean signifies the dataset’s average value, while the standard deviation quantifies the extent to which individual data points deviate from this mean. Skewness serves as a measure for determining the degree of asymmetry within the distribution. In a positively skewed distribution, data are concentrated on the left side of the mean, giving rise to an extended tail on the right. Conversely, in a negatively skewed distribution, data are concentrated on the right side of the mean. Kurtosis is a distribution shape metric that shows whether data points have light tails and flat peaks or heavy tails and jagged peaks. A distribution with positive kurtosis has heavy tails and a sharp peak, whereas a distribution with negative kurtosis has light tails and a flat peak. In statistics and data science, having a thorough understanding of these ideas is crucial for making defensible decisions and conducting thorough data analyses [37].
3.2. Procedure for the Computation of Variability in Long-Term Rainfall Pattern
The coefficient of variation (CV) is a statistical metric used to assess the degree of dispersion of values concerning their mean in a dataset over time [38]. It quantifies this dispersion by expressing the fraction of the standard deviation () to the mean, making it a valuable tool for comparing the level of variability in different rainfall datasets over time, regardless of the significant differences in their mean rainfall values. The calculation of the for seasonal rainfall involved the use of the following expression in Equation (1):
In the given expression, depicts the seasonal rainfall variation in terms of a percentage. It is determined by dividing the of the seasonal rainfall using long-period seasonal mean rainfall () spanning 30 years (1991–2020).
3.3. Procedure for the Decadal Distribution of Rainfall Pattern
The distribution of rainfall patterns is computed based on the normal season rainfall that occurred in different seasons during the long period (30 years) for each district of central India. The long-period seasonal mean rainfall spanning 30 years (LPR30) has been computed for each district of central India, indicating normal seasonal rainfall. The determination of periodic rainfall fluctuation at the regional level for each decade within DTP1, DTP2, and DTP3 involves calculating the percentage difference from the long-term seasonal mean. This is referred to as the deviation from long-period rainfall in percentage (DRP) for the specific deviation period (Equation (2)).
In the equation, represents the seasonal mean rainfall of the district for different decades. The deviation of seasonal rainfall is expressed as a percentage, calculated by comparing the seasonal rainfall () to the long-term seasonal mean rainfall over 30 years. A positive DRP value signifies rainfall above the normal levels, whereas a negative value indicates rainfall below the normal levels for a specific decade.
3.4. Procedure for the Computation of the Number of Rain Days and Decadal Percentage Deviation of Rainfall with Different Intensities
A day is classified as a ‘rainy day’ when the recorded rainfall amount measures 0.1 mm or greater [39]. The study period spans 30 years (1991–2020), during which the average count of days with rainfall is calculated for all the regions in central India across different periods. The rainfall events are classified based on the report published by IMD and are no rain (0 mm/day), trace (0.01–0.04 mm/day), very light rain (0.1–2.4 mm/day), light rain (2.5–7.5 mm/day), moderate rain (7.6–35.5 mm/day), rather heavy rain (35.6–64.4 mm/day), heavy rain (64.5–124.4 mm/day), and very heavy rain (124.5–244.4 mm/day) (https://www.imdpune.gov.in/Reports/glossary.pdf, accessed on 2 February 2024).
The assessment of the contribution from rainy days of varying intensities involves calculating the percentage of days with no rain, trace rain, very light rain, light rain, moderate rain, heavy rain, and very heavy rain in relation to the total number of days throughout the study period.
The distribution of percentage deviation in rainfall events with various intensities (no rainfall, trace rainfall, very light rainfall, light rainfall, and moderate rainfall) is computed based on the mean seasonal rainfall events with different categories that occurred in different seasons during the long period (30 years) for each district of central India. The long-period seasonal mean rainfall events (LPRE30) have been computed for each district of central India, which indicates the normal seasonal rainfall events in various categories. The percentage deviation of seasonal rainfall events with different categories at a district level during each decade of DTP1, DTP2, and DTP3 has been determined by expressing the decadal mean seasonal rainfall events for each category expressed as a percentage difference from the long-term seasonal average of rainfall events, referred to as the deviation from long period rainfall events in percentage of rainfall (DREP) for the specific period of deviation (Equation (3)).
In the equation, represents the seasonal mean rainfall events in any category of various districts for a particular decade.
4. Results, Analysis, and Discussion
4.1. Long-Term Seasonal Rainfall Distribution Pattern
Figure 3a illustrates the spatiotemporal fluctuations in the average regional level rainfall within the central Indian states from 1991 to 2020. Figure 3b displays the seasonal spatiotemporal shifts in mean rainfall at the district level across central India during different seasons, including winter, premonsoon, monsoon, and post-monsoon, spanning from 1991 to 2020.
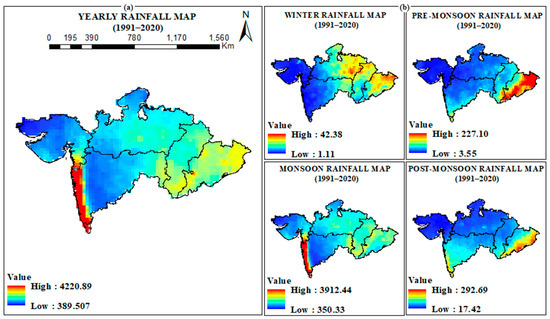
Figure 3.
The long-term spatiotemporal distribution of mean precipitation was observed during (a) yearly mean rainfall patterns over the study period and (b) seasonal mean rainfall patterns (winter, premonsoon, monsoon, post-monsoon seasons) for a period of 30 years (1991–2020) in the districts of central Indian states.
The evaluation of long-term rainfall patterns involves an analysis of key statistical descriptors, encompassing mean, standard deviation, skewness, and kurtosis. Table S1 presents a summary of these statistical descriptors calculated for the seasonal time series rainfall data from each state in central India over a span of 30 years. On the other hand, Table S2 provides seasonal values of mean rainfall, standard deviation, skewness, and kurtosis for various districts in central India. This analysis provides insights into the characteristics and patterns of rainfall variability in these states and their districts.
The mean values of rainfall (10.19 mm, 45.67 mm, 1515.38 mm, and 96.68 mm), the mean values of standard deviation (16.13 mm, 50.45 mm, 706.90 mm, and 96.97 mm), the mean values of skewness (2.49, 2.32, 0.99, and 1.22), and the mean values of kurtosis (8.65, 8.63, 3.75, and 4.43) are found for various seasons like winter, premonsoon, monsoon, and post-monsoon, respectively, over central India during the study period. The highest (24.19 mm) and lowest (2.08 mm) values of mean rainfall are observed in the states of Odisha and Dadra and Nagar Haveli, respectively, for the winter season. During premonsoon season, the highest (132.89 mm) and lowest (6.65 mm) values of mean rainfall are observed in the states of Odisha and Gujarat, respectively. Nevertheless, the monsoon season in Goa records the highest mean rainfall (3188.21 mm), while Gujarat experiences the lowest (882.66 mm). The highest (213.87 mm) and lowest (30.35 mm) values of mean rainfall are observed in the states of Goa and Gujarat, respectively, for the post-monsoon season. The highest (35.03 mm) and lowest (4.11 mm) values of standard deviation are observed in the states of Odisha, Dadra, and Nagar Haveli, respectively, for the winter season. During premonsoon season, the highest (114.24 mm) and lowest (14.38 mm) values of standard deviation are observed in the states of Goa, Daman, and Diu, respectively. However, the highest (1173.79 mm) and lowest (419.98 mm) values of standard deviation are observed in the states of Goa and Chhattisgarh, respectively, for the monsoon season. The highest (168.32 mm) and lowest (45.45 mm) values of standard deviation are observed in the states of Goa and Gujarat, respectively, for the post-monsoon season. The highest (3.07) and lowest (1.98) values of skewness are observed in the states of Maharashtra and Daman and Diu, respectively, for the winter season. During premonsoon season, the highest (3.72) and lowest (1.43) values of skewness are observed in the states of Goa and Odisha, respectively. However, the highest (1.56) and lowest (0.10) values of skewness are observed in the states of Daman, Diu, and Goa, respectively, for the monsoon season. The highest (1.66) and lowest (0.33) values of skewness are observed in the states of Goa and Dadra and Nagar Haveli, respectively, for post-monsoon season. The highest (12.97) and lowest (1.98) values of kurtosis are observed in the states of Maharashtra and Daman and Diu, respectively, for the winter season. During premonsoon season, the highest (16.91) and lowest (4.74) values of kurtosis are observed in the states of Goa and Odisha, respectively. However, the highest (4.64) and lowest (2.69) values of kurtosis are observed in the states of Odisha and Goa, respectively for the monsoon season. The highest (7.13) and lowest (1.96) values of kurtosis are observed in the states of Goa, Dadra, and Nagar Haveli, respectively, for the post-monsoon season.
Regarding the district level, the highest value of the above-mentioned statistical indicators (mean, standard deviation, skewness, and kurtosis) were observed (Baleshwar: 34.63, Baleshwar: 212.17, South Goa: 3416.28, and Gajapati: 267.44), (Baleshwar: 44.61, Jagatsinghapur: 159.12, South Goa: 1397.94, Gajapati: 259.78), (Patan: 4.75, Thane: 4.83, Koraput: 3.58, and Devbhumi Dwarka: 3.72), (Patan: 24.88, Thane: 25.52, Koraput: 17.49, and Devbhumi Dwarka: 17.93) for winter, premonsoon, monsoon, and post-monsoon seasons, respectively.
However, the lowest value of mean rainfall, standard deviation, skewness, and kurtosis are observed (Navsari: 1.20, Surat: 4.09, Kachchh: 473.22, and, Anand: 19.52), (Gir Somnath: 1.95, Surat: 6.81, Solapur: 236.67, Anand: 27.07), (Singrauli: 0.89, Kendujhar: 0.79, Sindhudurg: −0.17, and The. Dangs: 0.13), (Diu: 1.18, Daman: 1.55, Nanded: 1.68, and Bastar: 1.73) for winter, premonsoon, monsoon, and post-monsoon seasons, respectively.
This analysis provides insights into the geographical distribution and temporal patterns of mean rainfall across the districts within the central Indian states. During the winter and premonsoon season, the maximum mean rainfall was measured up to ranges of 34.63–212.17 mm in the Baleshwar district of the eastern states, i.e., Odisha, while the maximum rainfall (up to 3416.28 mm) was observed at the South Goa district of the southern part of central India in last 30 years. However, the maximum mean rainfall is observed at about 3188.21 in the eastern state, i.e., Goa of central India, during the monsoon season. The eastern state of the central India districts experienced higher mean rainfall during the winter and premonsoon seasons, while, in the case of the monsoon and post-monsoon seasons, a higher mean rainfall was observed in the southern state district of central India during the last 30 years. The lowest rainfall observed in all seasons was in the western state districts (Navsari, Surat, Kachchh, Anand) of central India. During the monsoon season, the maximum rainfall is observed in the southern state district, namely, South Goa, while the minimum rainfall is also observed in western state districts. Contrary to the above, it can be concluded that rainfall has not been evenly distributed in the districts of central India throughout all seasons of the last 30 years. Overall, eastern Ghats received comparatively higher on-average rainfall annually than other states of central India.
4.2. Statistical Characteristics of the Rainfall Variability
Figure 4 illustrates the geospatial volatility in the seasonal rainfall of central India for a 30-year-long period, expressed using the CV, which represents the degree of variation in seasonal rainfall across different locations within central India, offering insights into the heterogeneity and spatial patterns of rainfall variability. The larger CV indicates the larger spatial variability of rainfall during the investigation period. In general terms, a higher value of CV is more responsible for climate change occurrence in a region over a long-term period. Very drastic variability in the rainfall pattern was observed in the western and southern states of central India, comprising Gujarat and Maharashtra, in the premonsoon and winter seasons. However, during the post-monsoon season, higher variability was also found in Chhattisgarh, the northern part of Madhya Pradesh, and some parts of Odisha state. Initially, higher variability in rainfall was observed in Gujarat state compared to other parts of central India. However, very low variability was observed in the eastern state of Odisha in central India during the monsoon season, while moderate rainfall pattern variability was found in the Maharashtra and Chhattisgarh states. Generally, the eastern region of central India experiences the most consistent rainfall during the monsoon season. Nevertheless, a significant variation in rainfall variability is observed in Odisha and some parts of Chhattisgarh during the winter season. As a result, moderate rainfall variability is observed during the winter and post-monsoon seasons over the southern, eastern, and northern states of central India (Maharashtra, Madhya Pradesh, and Chhattisgarh).
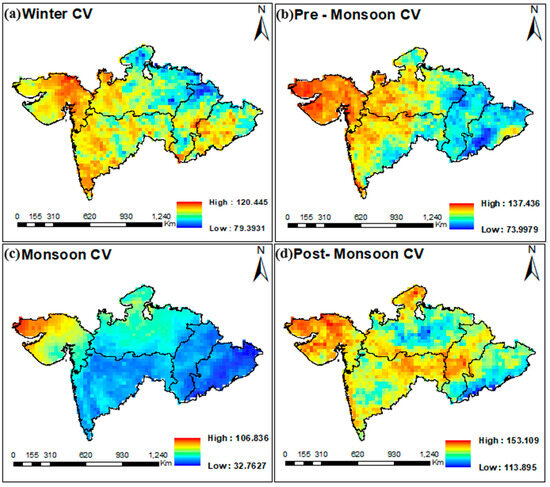
Figure 4.
Long-term distribution of the coefficients of variation observed during the (a) winter, (b) premonsoon, (c) monsoon, and (d) post-monsoon seasons for a period of 30 years (1991–2020) in central India.
4.3. Statistical Characteristics of Decadal Seasonal Rainfall Deviation
The percentage of seasonal rainfall fluctuation at the district level in the different sub-periods of 1991–2000 (DTP1), 2001–2010 (DTP2), and 2011–2020 (DTP3) for various seasons (premonsoon, monsoon, post-monsoon, and winter) was computed against the long-term mean of rainfall in 30 years (LPR30) from 1991 to 2020 to study the spatiotemporal variation percentage of rainfall fluctuation. Figure 5 shows how the rainfall percentage varies spatiotemporally at the district level in various seasons for three decadal periods. Table S3 depicts the percentage deviation of mean rainfall over the study period at the district level. Positive percentage deviation depicts the increasing trends of rainfall patterns from the normal rainfall, while negative deviation of the rainfall pattern depicts a declining rainfall pattern in that specific location.
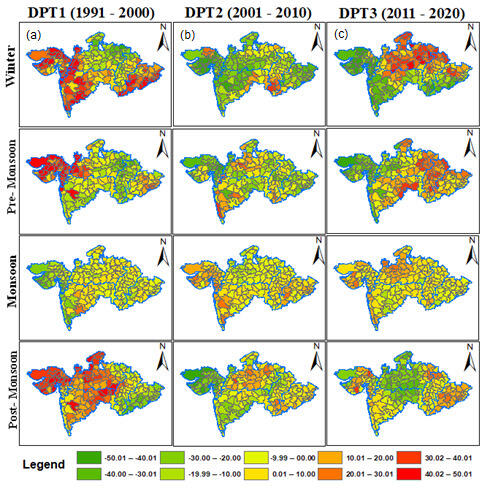
Figure 5.
Percentage deviation of rainfall in (a) 1991–2000 (DTP1), (b) 2001–2010 (DTP2), and (c) 2011–2021 (DTP3) for the winter, premonsoon, monsoon, and post-monsoon seasons for different district levels in central India.
Noticeable variations were observed in different seasons and districts during DTP1 (winter, premonsoon seasons, and post-monsoon), and the region exhibited the most significant negative percent deviation in mean rainfall, particularly evident in Rewa, Anuppur, Bametara, Kandhamal, Malkangiri, and Koraput districts. The higher positive changes are observed during these seasons in the Puri, Nandurbar, Sangli, Mahesana, Jhabua, Ahmadabad, Ahmadnagar, and Mahesana districts. DTP3, in winter, saw higher negative deviations in the Gujarats and Navsari districts and higher positive deviations in Madhya Pradesh’s Chhindwara district. During the premonsoon season, DTP2 showed the highest negative deviations in Panch Mahals and Gujarat and the highest positive deviations in Ratnagiri, district of Maharashtra. In the premonsoon season, DTP3 exhibited negative deviations in Gujarat’s Devbhumi Dwarka and positive deviations in Chhattisgarh’s Bametara district. During the monsoon, DTP1, DTP2, and DTP3 displayed favorable rainfall variations compared to other seasons, with the maximum negative deviations (−34.38%, −16.59%, and −14.12%) being found in Kolhapur, Agar Malwa, and Solapur, and the highest positive deviations (20.58%, 28.04%, and 27.96%) in Solapur, Porbandar, and the Agar Malwa district, respectively. In contrast, DTP1, in the monsoon season, showed significantly negative deviations in Kolhapur, while the highest positive deviations were found for DPT2 in the Porbandar district. In DTP3, in the monsoon season, a moderate percentage rainfall deviation occurred.
In the monsoon season, the increasing pattern of rainfall has been observed significantly (above the normal rainfall) in most of the districts of central India from DTP1 to DPT3. In DPT1, only 44 districts experienced above-normal rainfall; however, this would increase to 107 and 122 during DTP2 and DTP3. The depression in the rainfall pattern is mostly observed during DTP3 in the northern part of central India. The decline in the rainfall pattern is observed in the western, southern, and eastern parts of central India during the winter season in DPT1, while the northern part is mostly affected in DPT3. The western part of central India is significantly depressed during the premonsoon season in DPT1. However, the eastern part and its surrounding regions were majorly affected by the decline in rainfall patterns during the pre-monsoon season in DTP3. For DTP1, the whole of central India experienced a negative rainfall pattern except for some eastern parts in the post-monsoon season. During the monsoon season, almost all districts of central India showed an increasing and successive trend in rainfall patterns during all three decades, which is an indication that monsoon rainfall variability has been occurring over the Indian region. The northern part of central India, which is a part of Bundelkhand and Chhattisgarh, has observed a decrease in rainfall patterns in DTP3. This indicates a natural water crisis in these areas that may persist into the future until the arrival of the monsoon season. The drought scenario in western Gujarat has significantly improved in recent decades. Moreover, a degree of significant improvement is observed in Maharashtra state; however, southeast Maharashtra is still facing a water crisis due to a decrease in rainfall annually. It was observed that the southeastern part of Chhattisgarh is also going through retardation of annual precipitation, which indicates a possible future water crisis in this region. Overall, the rainfall condition has improved significantly in the Gujarat state over the successful periods of DPT1, DPT2, and DPT3.
4.4. Statistical Characteristics of the Rainfall Events with Intensities and Their Percentage Contribution
Figure 6 portrays the visuals of the spatiotemporal variation of rain days at the district level over 30 years in central India during different seasons (winter, premonsoon, monsoon, and post-monsoon) and the above-mentioned five rainfall intensities/categories. Table S4 depicts the number of the various category rainfall events that occurred during the study period for each district.
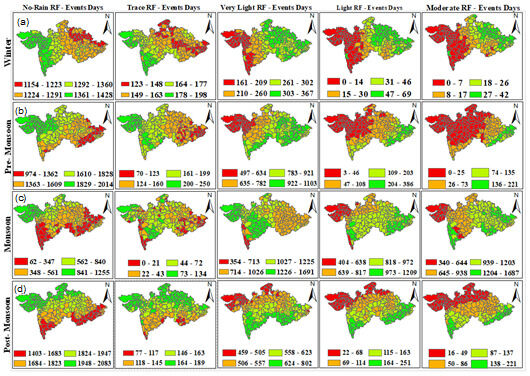
Figure 6.
Long-term distribution of all rain events of various categories that occurred at the district level in central India over 30 years for the (a) winter, (b) premonsoon, (c) monsoon, and (d) post-monsoon seasons.
This comprehensive analysis of the rainfall events categorized by intensity across various districts in central India found intriguing seasonal fluctuations. In the winter season, it became evident that the occurrence of rainfall events was at its nadir in Kendujhar, Odisha, whereas it reached its zenith in Morbi, Gujarat. During 30-year intervals, it was noted that Madhya Pradesh, Gujarat, and southern Maharashtra experienced the highest occurrence of days with no rainfall events in the winter season. In contrast, when examining trace rainfall events in winter, Puri, Odisha, exhibited a significant scarcity, while Sangli, Maharashtra, witnessed a notable abundance. Shifting our focus to very light rainfall events in the winter season, a pattern emerged that showcased their scarcity in North Goa, Goa, and their profusion in Balrampur, Odisha. Likewise, when we examined light rainfall events during this season, they appeared to be sparingly distributed in Bhavnagar, Gujarat, while they manifested abundantly in Dindori, Madhya Pradesh. However, the most striking contrast was observed in the category of moderate rainfall events, with Gujarat’s Bhavnagar, the Tapi district, registering the fewest occurrences, while Odisha’s Baleshwar district reported the highest numbers during the winter months.
As we transitioned to the premonsoon season, a similar pattern of variations emerged. Mayurbhanj, Odisha, stood out with the lowest occurrence of rainfall events, while Porbandar, Gujarat, exhibited the highest frequency. For trace rainfall instances in the premonsoon season, Puri, Odisha, was the least affected, whereas Jamnagar, Gujarat, experienced the most occurrences. In the very light rainfall category during the premonsoon season, Jamnagar, Gujarat, witnessed the least, while Kendujhar, Odisha, recorded the highest number of events. Light rainfall events in this season were noticeably sparse in Devbhumi Dwarka and Porbandar, Gujarat, but plentiful in Mayurbhanj, Odisha. Similarly, in the moderate rainfall category during the premonsoon season, Surat, Gujarat, saw the fewest instances, while Mayurbhanj, Odisha, reported the highest.
Transitioning to the monsoon season, Sangli, Maharashtra, emerged with the lowest occurrence of no rainfall events, while Porbandar, Gujarat, stood out with the highest count. For trace rainfall events in the monsoon season, North Goa and Subarnapur, Odisha, experienced the fewest occurrences across central India, whereas Kachchh, Gujarat, boasted the highest frequency. Very light rainfall events were scarce in South Goa, Goa, but abundant in Solapur, Maharashtra. In the light rainfall category, Devbhumi Dwarka, Gujarat, registered the least occurrences, while Sangli, Maharashtra, reported the most. Finally, in the moderate rainfall category during the monsoon season, Devbhumi Dwarka, Gujarat, recorded the fewest events, while Sindhudurg, Maharashtra, documented the highest.
As we extended our analysis into the post-monsoon season, Valsad, Gujarat, continued to have the lowest number of no-rainfall events in central India, while Aravalli, Gujarat, exhibited the highest frequency. In the trace rainfall category, North Goa, Goa, had the least, whereas Neemuch, Madhya Pradesh, had the most occurrences. Very light rainfall events were notably scarce in Aravalli, Gujarat, but they flourished in East Nimar, Madhya Pradesh. Regarding the light rainfall category, Banaskantha, Gujarat, had the fewest occurrences, while South Goa, Malkangiri, reported the highest. Lastly, in the moderate rainfall category during the post-monsoon season, Patan, Gujarat, recorded the least, while South and North Goa, logged the most events.
Figure 7 presents the percentage contribution of the total number of rainfall events in various categories against the total number of days during the study period at a district level over the central India region for different seasons. The contributions of the mean percentage of no-rainfall events have been observed as 74%, 61%, 15%, and 61% during the winter, premonsoon, monsoon, and post-monsoon seasons, respectively, in the entirety of central India. However, the mean percentage contributions of trace rainfall events were 9.04%, 5.86%, 1.07%, and 7.10% for winter, premonsoon, monsoon, and post-monsoon seasons, respectively. The mean percentage contributions were also noted for very light rain events (14.66%, 28.58%, 29.01%, and 24.09%), light rainfall (1.54%, 3.01%, 22.64%, and 4.15%), moderate rainfall (0.78%, 1.37%, 26.92%, and 2.78%), rather heavy rainfall (0.02%, 0.06%, 3.46%, and 0.22%), heavy rainfall (0.00%, 0.02%, 2.04%, and 0.07%) during the winter, premonsoon, monsoon, and post-monsoon seasons, respectively, in the entirety of central India. The number of heavy rainfall events that occurred was 3, 114, 8794, and 362 during the winter, premonsoon, monsoon, and post-monsoon seasons, respectively. The number of heavy rainfall events has increased during the last two decades.
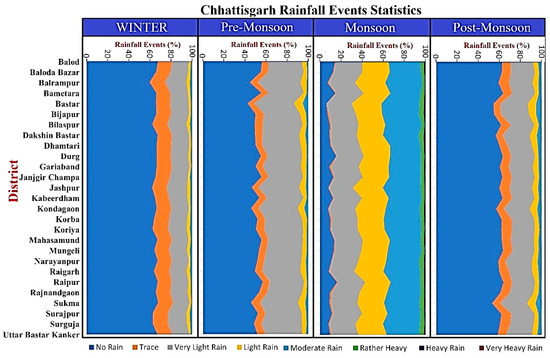
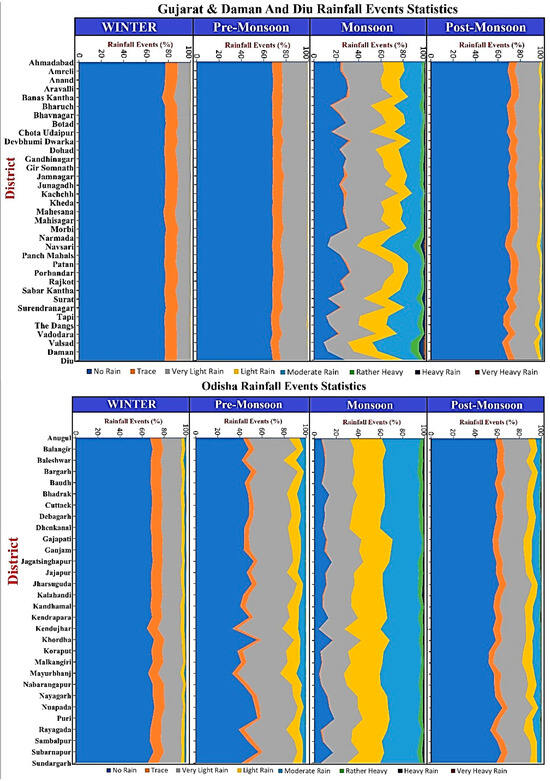
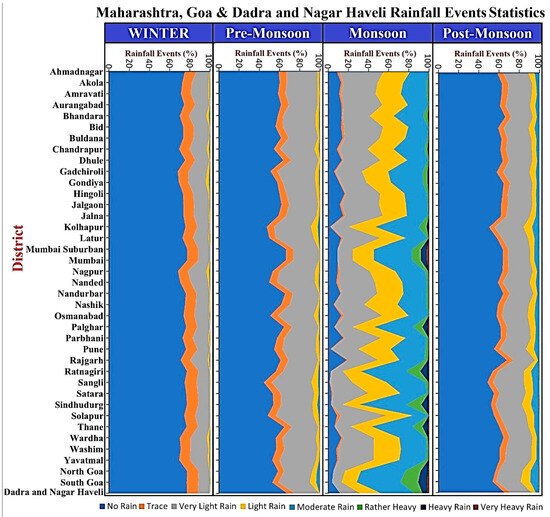
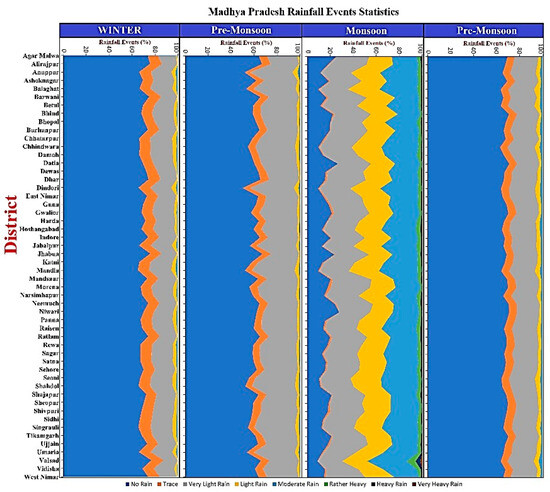
Figure 7.
The long-term seasonal percentage distribution of various rainfall events against the mean number of rainy days in stacked chart columns from 1991 to 2020 at district level in central India Chhattisgarh, Gujarat and Daman and Diu, Maharashtra, Goa and Dadra and Nagar Haveli, Odisha, and Madhya Pradesh, respectively.
4.5. Statistical Characteristics of Decadal Deviation in the Rainfall Intensities
The district-level analysis of spatiotemporal changes in rainfall event frequencies, categorized by different rainfall intensities, was conducted for each season in central India over three distinct decades (DPT1, DPT2, and DPT3). This analysis provides insights into the distribution and temporal patterns of rainfall events, categorized by their intensity, across the districts within central India during different seasons, which is provided in Section 3.2. In Figure 8, Figure 9 and Figure 10, the seasonal percentage deviations over three decades for various categories of rainfall events are presented, comparing them to the corresponding category means at the district level in central India during the study period of DPT1, DPT2, and DPT3, respectively. These visual representations provide a clear depiction of the percentage distribution and variability of rainfall intensities across these regions during different seasons.
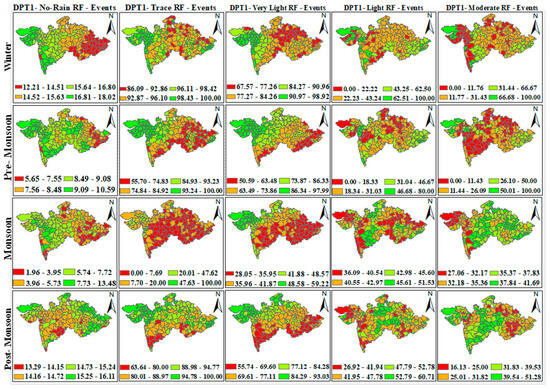
Figure 8.
Decadal distribution of percentage rainfall deviation in various rainfall categories for periods of 1991–2000 (DTP1) in all seasons in central India.
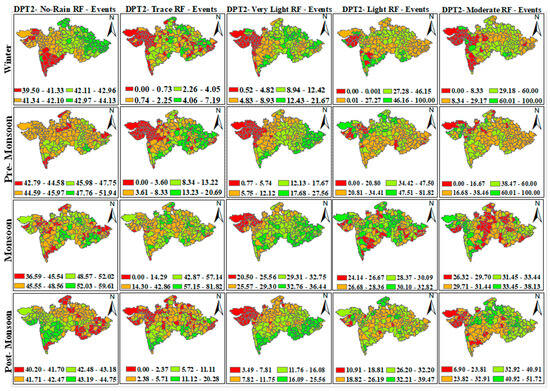
Figure 9.
Decadal distribution of percentage rainfall deviation in various rainfall categories for periods of 2001–2010 (DTP2) in all seasons in central India.
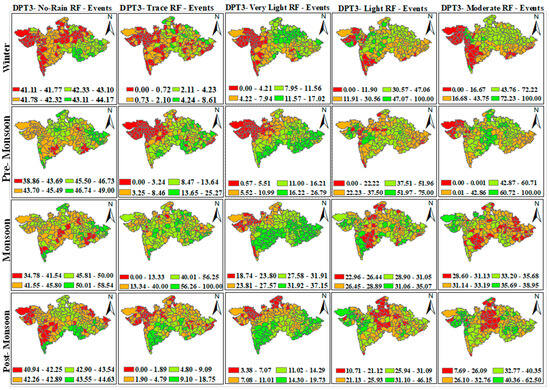
Figure 10.
Decadal distribution of percentage rainfall deviation in various rainfall categories for periods of 2011–2020 (DTP3) in all seasons in central India.
The uplift trend ranges (12.21% to 18.02%) have been detected in the percent deviation of no rainfall events during the winter season over the entire central India for DPT1, with the lowest occurring in the Puri district and and highest in the Kolhapur district, respectively. Meanwhile, in DPT2, during the winter season, a higher percentage of no-rainfall events occurred, ranging from 39.50 to 44.13, with the highest percentage change occurring in Sundargarh and the lowest percentage occurring in the Banas Kantha district of Gujarat. The ranges of percentage deviation in the no-rainfall events vary from 41.11% to 44.17% for the winter season in DPT3, with the lowest in the Morbi district of Gujarat and the highest in the Bijapur district of Chhattisgarh, respectively. For DPT1, an increasing trend ranging from 86.09% to 100.00% has been seen in the percent deviation of trace rainfall events throughout the winter season for the entirety of central India, with the districts of Puri (Odisha) and Sundargarh (Odisha) seeing the highest and lowest percentages, respectively. The winter season and DPT2 revealed an increasing trend in trace rainfall events, ranging from 0.00% to 7.19%. The lower percentage deviation is observed in various districts of Odisha, Gujarat, Madhya Pradesh, Dadra and Nagar Haveli, and Daman and Diu. However, the Panna districts from Madhya Pradesh observed the highest percentage deviation change (7.19%) in trace rainfall events in DPT2 in the winter season. In DPT3, an increasing trend of percentage deviations of trace rainfall events ranging from 0.00% to 8.61% was also observed during the winter season, with the lowest percentage change found in many districts of various states like Odisha, Maharashtra, Madhya Pradesh, Chhattisgarh, Gujarat, Dadra and Nagar Haveli, Daman and Diu, and Goa. The highest percentage deviation in trace rainfall events was found in Sundargarh in Odisha.
The percentage deviation of very light rainfall events for DPT1 during the winter season has been trending upward from 67.57% to 98.92%, with the highest change occurring in Navsari of Gujarat and the lowest change occurring in the Balrampur district of Chhattisgarh. However, very light rain events increased in DPT2 during the winter season, ranging from 0.52% to 21.67%, with the highest and lowest percentage changes in Banas Kantha and the Dangs district of Gujarat, respectively. DPT3 and the winter season also showed an increasing trend in very light rainfall events, which ranged from 0.00% to −17.02%, with the highest percentage change occurring in the Singrauli district of Madhya Pradesh and the lowest percentage change being observed in Anand, Daman, and Kheda.
Increasing behavior in percentage deviation of light rainfall events was observed during the winter season and DPT1, with the highest change occurring in the Satara district of Maharashtra and the lowest change occurring in the various districts of Maharashtra, Gujarat, and Daman and Diu. In DPT2, an increasing pattern in percentage deviation in rainfall events was also found during the winter season, with the highest change occurring in the Porbandar and Solapur districts, while the lowest change is found in various districts of Gujarat, Maharashtra, and Daman and Diu. It is noticeable that the reduction in light rainfall events in many districts of central India is comparable to DPT1. DPT3, during the winter season, also observed an increasing pattern in the percentage deviation of light rainfall events ranging from 0.00% to 100%, with the highest change occurring in the Ahmadabad district of Gujarat and the lowest change being found in many districts of Maharashtra, Gujarat, Goa, and Dadra and Nagar Haveli. The percentage deviation in moderate rainfall events during the winter season and in DPT1 increased, ranging from 0.00% to 100%. The highest change was found in the various districts of Gujarat, Dadra and Nagar Haveli, Maharashtra, Daman and Diu, and Madhya Pradesh, while the lowest change was also found in the various districts of Gujarat, Maharashtra, Goa, Daman and Diu, and Madhya Pradesh. The percentage deviation in moderate rainfall events during the winter season and in DPT2 and DTP3 increased in the negative range (0.00% to 100%).
During the premonsoon season, the positive percentage deviation in no-rainfall events was found in all districts of central India for DTP1, DTP2, and DTP3, with ranges of −5.65% (Puri district of Odisha) to 10.59% (Solapur district of Maharashtra), 42.79% (South Goa) to 51.94% (Koraput district of Odisha), and 38.86% (Koraput district of Odisha) to 49% (Baudh district of Odisha), respectively. It was noticed that the percentage of no-rainfall events decreased over three decades (DPT1, DPT2, and DPT3) in all the districts of central India during the premonsoon season. In the current scenario, the inclination of no-rainfall events is not conducive to reducing the water crises (not more effectively because it is in the premonsoon season) in the central India region.
The positive trend in the percentage deviation of trace rainfall events was observed during all decades (DPT1, DTP2, and DTP3) in the premonsoon season, with ranges of 55.7% (Sundargarh district of Odisha) to 100% (in various districts of Maharashtra, Gujarat, Madhya Pradesh, Dadra and Nagar Haveli, and Daman and Diu), 0.41% (Morbi district of Gujarat) to 20.69% (Nanded district of Maharashtra), and 0.44% (Porbandar district of Gujarat) to 25.27% (Sukma district of Chhattisgarh). However, some districts in DPT2 and DPT3 showed no change in trend for trace rainfall events during the premonsoon season. Regarding percentage deviation, in very light rain events, it increased during the DPT1, DTP2, and DTP3 in the premonsoon season from 50.59% (Kendujhar, Odisha) to 97.99% (Aravalli, Gujarat); 0.77% (Botad district of Gujarat) to 27.56% (Kendujhar district of Odisha); and 0.57% (Devbhumi Dwarka district of Gujarat) to 26.79% (Koraput district of Gujarat), respectively. The increasing percentage of deviation in moderate rainfall events was observed during the DTP1, DTP2, and DTP3 in the premonsoon season with the ranges −4% (Jabalpur district of Madhya Pradesh) to −100% (in three districts of Gujarat namely Kachchh, Banas Kantha, Chota Udaipur); 11.11% (Datia district of Madhya Pradesh) to 100% (in two districts of Gujarat, namely, Mahesana and Gandhinagar); and 20% (Valsad district of Gujarat) to 100% (in Dewas, Madhya Pradesh), respectively. No percentage change in moderate rainfall events was observed in 29, 8, and 17 districts of central India during the pre-monsoon season.
The positive trend in the percentage of deviations in no-rainfall events has been observed during DPT1, DTP2, and DTP3 in the monsoon season, with ranges of 1.96% (Nabarangapur district of Odisha) to 13.48% (Satara district of Maharashtra); 36.59% (Kendujhar district of Odisha) to 59.61% (Nabarangapur district of Odisha); and 34.78% (Kandhamal district of Odisha) to 58.54% (Kendujhar district of Odisha), respectively. The positive percentage deviation in trace rainfall events have been found in DPT1, DTP2, and DPT3 during the monsoon season with the ranges 1.28% (Amravati district of Maharashtra) to 100.00% (some districts of Daman and Diu, Dadra and Nagar Haveli, Madhya Pradesh, Maharashtra, and Gujarat); 14.29% (Puri district of Odisha) to 81.82 (Debagarh district of Odisha); and 9.09% (Debagarh district of Odisha) to 100.00% (South Goa). However, no change in trace rainfall event patterns was observed in 24, 12, and 11 districts of central India for DPT1, DTP2, and DTP3, respectively, during the monsoon season. During the monsoon season, DPT1, DPT2, and DPT3 showed positive percentage deviations in very light rainfall events, from 36.09% (Pune district of Maharashtra) to 33.44% (Puri district of Odisha); 20.50% (Morbi district of Gujarat) to 36.44% (Gajapati district of Odisha); and 18.74% (Porbandar district of Gujarat) to 37.15% (Kandhamal district of Odisha), respectively. A positive trend of percentage deviation in light rainfall events was observed during DPT1, DTP2, and DTP3 in the monsoon season, with ranges from 36.09% (Pune district of Maharashtra) to 51.53% (Puri district of Odisha); 24.14% (Jagatsinghapur district in Odisha) to 32.82% (Nandurbar district of Maharashtra); and 22.96% (Sheopur district of Madhya Pradesh) to 35.07% (Morbi district of Gujarat), respectively. DPT1, DPT2, and DPT3 showed a positive percentage deviation in moderate rainfall events, with ranges from 27.06% (Kachchh district of Gujarat) to 41.69% (Puri district of Odisha); 26.32% (Harda district of Madhya Pradesh) to 38.13% (Jamnagar district of Odisha); and 28.60% (Puri district of Odisha) to 38.95% (Rajkot district of Odisha), respectively, during the monsoon season. There was no change in the percentage deviation of moderate rainfall events found in the Sagar district of Madhya Pradesh.
The long-term percentage deviation of no-rainfall events during post-monsoon season showed a positive behavior for DPT1 (13.29% for district South Goa to 16.11% for district Mayurbhanj, Odisha), DPT2 (40.20% for district Sangli, Maharashtra to 44.75% for district Mumbai Suburban, Maharashtra), and DPT3 (40.94% for district Ahmadnagar, Maharashtra to 44.63% for district Bijapur, Chhattisgarh). The positive percentage deviation of trace rainfall events in DPT1, DPT2, and DTP3 ranged as follows: 63.64% (Sangli district of Maharashtra) to 100.00% (in 17 districts of Maharashtra, Gujarat, Daman and Diu, Odisha, Dadra and Nagar Haveli, Madhya Pradesh, Odisha, and Goa); 0.57% (Neemuch district of Madhya Pradesh) to 20.28% (Sangli district of Maharashtra); and 0.55% (Banas Kantha district of Gujarat) to 18.75% (Kolhapur district of Maharashtra), respectively. No change in the percentage deviation of trace rainfall events was observed in 20 and 24 districts of central India for DTP2 and DTP3 during the post-monsoon season, respectively. In the post-monsoon season, the positive trend of the percentage deviation of very light rainfall events was observed during DTP1, DPT2, and DPT3, with ranges from 55.74% (Sangli district of Maharashtra) to 93.03% (in district Aravalli of Gujarat); 3.49% (Aravalli district of Gujarat) to 25.56% (Sangli district of Maharashtra); and 3.38% (Sabar Kantha district of Gujarat) to 19.73% (Pune district of Maharashtra), respectively. However, the positive trend of the percentage deviation of light rainfall events was observed during DTP1, DPT2, and DPT3 in the post-monsoon season with ranges from 26.92% (Kachchh district of Gujarat) to 60.71% (Raisen district of Madhya Pradesh); 10.91% (Gir Somnath district of Gujarat) to 39.47% (Bhind district of Madhya Pradesh); and 10.71% (Morena district of Madhya Pradesh) to 46.15% (Kachchh district of Gujarat), respectively. The positive percentage deviation in moderate rainfall events also observed during the post-monsoon season in DTP1, DTP2, and DTP3 ranged from 16.13% (Panna district of Madhya Pradesh) to 51.28% (Sehore district of Madhya Pradesh); 6.90% to 51.72% (in the Gir Somnath and Tapi districts of Gujarat); and 7.69% (Sehore district of Madhya Pradesh) to 62.50% (Gandhinagar district of Gujarat), respectively.
5. Conclusions
Human activities and the impact of climate change are, today, the main drivers of natural processes and their associated consequences, especially geoenvironmental hazards. On a global scale, natural disasters such as floods are exacerbated by human impacts. In this context, geospatial technologies, which include tools such as Geographic Information Systems and Remote Sensing or Earth Observation, together with related spatial data analysis techniques, models, and databases, play an important role in the forecasting, prevention, investigation, response, remediation, and management of these risks and their consequences [40].
The present study focuses on conducting a dynamic analysis of the time series data of rainfall spanning 30 years (1991–2020) over central India. This analysis aims to explore and understand the seasonal spatiotemporal rainfall patterns, seasonal rainfall variability, seasonal spatiotemporal trends of rainy days with different intensities from no rain to heavy rain events, spatiotemporal decadal percentage variation in rainfall patterns, and spatiotemporal decadal percentage deviation in rainfall intensities over the study period at the district level in central India with seven subregions, i.e., Gujarat, Daman and Diu, Maharashtra, Goa and Dadra Nagar Haveli, Chhattisgarh, and Odisha.
The spatial distribution of mean rainfall has been found in the districts of states with ranges that vary during the winter (2.08 mm over Dadra And Nagar Haveli with an average of 24.19 mm over Odisha), premonsoon (6.65 mm over Gujarat to 132.89 mm over Odisha), monsoon (845.46 mm over Gujarat to 3188.21 mm over Goa), and post-monsoon (30.35 mm over Gujarat to 213.87 mm over Goa) seasons, respectively. In the decadal observation of seasonal rainfall percentage deviation, almost all the districts of central India showed a mixed (positive and negative) pattern in the percentage deviation of rainfall patterns in all three decades for all seasons, which indicates that rainfall variability has been occurring throughout the central India region over the last 30 years on a decadal basis. A noticeable variation in the percentage deviation of seasonal rainfall patterns has been observed in certain districts, namely, Rewa, Puri, Anuppur, Ahmadabad, Navsari, Chhindwara, Devbhumi Dwarka, Amreli, Panch Mahals, Kolhapur, Kandhamal, Ratnagiri, Porbandar, Bame-tara, and Sabar Kantha. The monsoon season received a higher number of different categories of rainfall events in comparison to other seasons. The maximum number of rainfall events such as no rain trace, very light, light, and moderate are found in the Valsad, Jamnagar, Baudh, Khordha, and Malkangiri districts, with the lesser numbers occurring in the Sangli, Subarnapur, North Goa, and Jamnagar (Patan and Surat) districts during all seasons, respectively. A minimum contribution of about 15.34% of no-rainfall events has been found in the monsoon season, followed by the winter, premonsoon, and post-monsoon seasons, with an average of 53% for each season in the entirety of central India during the study period. A higher contribution of trace rainfall events has been found during the winter season in comparison to others. The higher contribution of very light, light, moderate, rather high, and high rainfall events was found during the monsoon followed by other seasons. The number of no-rainfall events decreased from the mean of the last 30 years in central India during the winter, premonsoon, and monsoon seasons; meanwhile, it increased during the post-monsoon season in DTP1. However, during the last two decades (DPT2 and DPT3), the number of no-rainfall events has increased (reduction in rainfall events is observed) in all the seasons. During the last decade of DTP3, the frequency of trace rainfall events has decreased in all seasons from its mean. In DTP2, the frequency of trace rainfall events has decreased in the winter, premonsoon, and post-monsoon seasons but increased in the monsoon season. The trace rainfall events decrease in the monsoon season during DTP1; meanwhile, they increase in the winter, premonsoon, and post-monsoon seasons. In the last two decades (DTP2 and DPT3), the frequency of very light rainfall events as well as light rainfall has decreased during all seasons, while the increasing tendency of light rainfall events has been found in the pre-monsoon season. In DPT1, the frequency of very light and light rainfall events increased during all seasons, while there was a decreasing tendency of light rainfall events in the pre-monsoon season. The frequency of moderate rainfall events decreased in DPT2 for all seasons except for the monsoon season, and it increased in DTP3 during the winter, pre-monsoon, and post-monsoon seasons.
It is concluded that the western states of central India (Gujarat and Dadra and Nagar Haveli) and the southern (Goa) part of central India experienced minimum and maximum rainfall, respectively, with a diversion of rainfall patterns toward the southern part of central India in the monsoon season. Overall, the increasing trend in rainfall patterns has been observed towards the eastern and southern parts of central India before and after the monsoon season. This examination of the long-term rainfall data with various aspects may help to gain insights into the dynamics of rainfall patterns and their potential implications for central India’s understanding of climate and hydrological systems.
The insights of this study, coupled with spatiotemporal maps, offer valuable information for strategically planning the efficient utilization of water resources, as well as managing climate change, food security, and disaster management. Moreover, this analysis contributes to sustainable district-level water management, ensuring food security and disaster management by acknowledging the influence of climate change on evolving rainfall patterns and the frequency of rainy days during specific seasons in central India. The findings presented in this paper can guide the management of agricultural and other socioeconomic activities, incorporating considerations of the discussed changes in rainfall patterns over the last three decades. There remains a need for more critical evaluations of rainfall variability along with its various intensities for other aspects, such as absolute seasonality (length of dry and wet seasons), the timing of rainfall maxima and minima, and year-to-year variability with different time scales and regions.
Supplementary Materials
The following supporting information can be downloaded at: https://www.mdpi.com/article/10.3390/hydrology11020027/s1.
Author Contributions
D.K.G., J.N.T., N.A., P.K., K.K.D., K.K. and S.S.: Conceptualization, methodology, Algorithm formulation, Investigation, Original draft preparation, and Validation; J.N.T., D.K.G. and P.K.S.: Supervision; N.A., D.K.G., G.P.P., P.K.S., P.K., K.K. and D.K.S.: Reviewing, Editing, and Revision; D.K.G., A.K.S., K.G., K.K. and N.A.: Visualization and Editing. All authors have read and agreed to the published version of the manuscript.
Funding
This research received no external funding.
Data Availability Statement
The datasets are publically available from the India Meteorological Department (https://mausam.imd.gov.in/, accessed on 20 June 2023).
Acknowledgments
The authors acknowledge the India Meteorological Department for providing the data and also acknowledge the Atmospheric Research Laboratory, Department of Physics, Banaras Hindu University, and DS Kothari Post Doctoral Scheme of UGC for providing all kinds of research facilities.
Conflicts of Interest
The authors declare no conflicts of interest.
List of Acronyms
| ITAM | Innovative Trend Analysis Method |
| IMD | India Meteorological Department |
| DTP | Decadal Time Period |
| DTP1 | Decadal Time Period from the year 1991 to 2000 |
| DTP2 | Decadal Time Period from the year 2001 to 2010 |
| DTP3 | Decadal Time Period from the year 2011 to 2020 |
| CV | Coefficient Of Variation |
| SD | Standard Deviation |
| LPR30 | Long-Period seasonal mean Rainfall for 30 years |
| Seasonal mean Rainfall of districts in any decade | |
| DRP | Deviation from long-period Rainfall in Percentage LPRE30: Long-period seasonal mean Rainfall Events for 30 years |
| Seasonal mean rainfall Rainfall Events in any category of various districts for a particular decade. | |
| DREP | Deviation from long-period Rainfall Events in Percentage |
References
- Bhatt, B.C.; Nakamura, K. Characteristics of monsoon rainfall around the Himalayas revealed by TRMM precipitation radar. Mon. Weather Rev. 2005, 133, 149–165. [Google Scholar] [CrossRef]
- Loo, Y.Y.; Billa, L.; Singh, A. Effect of climate change on seasonal monsoon in Asia and its impact on the variability of monsoon rainfall in Southeast Asia. Geosci. Front. 2015, 6, 817–823. [Google Scholar] [CrossRef]
- Yu, Y.; Wang, J.; Cheng, F.; Deng, H.; Chen, S. Drought monitoring in Yunnan Province based on a TRMM precipitation product. Nat. Hazards 2020, 104, 2369–2387. [Google Scholar] [CrossRef]
- Maggioni, V.; Meyers, P.C.; Robinson, M.D. A review of merged high-resolution satellite precipitation product accuracy during the Tropical Rainfall Measuring Mission (TRMM) era. J. Hydrometeorol. 2016, 17, 1101–1117. [Google Scholar] [CrossRef]
- Visweshwaran, R.; Ramsankaran, R.; Eldho, T.; Jha, M.K. Hydrological Impact Assessment of Future Climate Change on a Complex River Basin of Western Ghats, India. Water 2022, 14, 3571. [Google Scholar] [CrossRef]
- Mishra, A.K. Effect of rain gauge density over the accuracy of rainfall: A case study over Bangalore, India. SpringerPlus 2013, 2, 311. [Google Scholar] [CrossRef]
- Sahany, S.; Venugopal, V.; Nanjundiah, R.S. Diurnal-scale signatures of monsoon rainfall over the Indian region from TRMM satellite observations. J. Geophys. Res. Atmos. 2010, 115. [Google Scholar] [CrossRef]
- Siabi, E.K.; Kabobah, A.T.; Akpoti, K.; Anornu, G.K.; Amo-Boateng, M.; Nyantakyi, E.K. Statistical downscaling of global circulation models to assess future climate changes in the Black Volta basin of Ghana. Environ. Chall. 2021, 5, 100299. [Google Scholar] [CrossRef]
- Das, P.K.; Chakraborty, A.; Seshasai, M.V. Spatial analysis of temporal trend of rainfall and rainy days during the Indian Summer Monsoon season using daily gridded (0.5 × 0.5) rainfall data for the period of 1971–2005. Meteorol. Appl. 2014, 21, 481–493. [Google Scholar] [CrossRef]
- Lekshmy, P.; Midhun, M.; Ramesh, R.; Jani, R. 18O depletion in monsoon rain relates to large scale organized convection rather than the amount of rainfall. Sci. Rep. 2014, 4, 5661. [Google Scholar] [CrossRef]
- Sunilkumar, K.; Narayana Rao, T.; Saikranthi, K.; Purnachandra Rao, M. Comprehensive evaluation of multisatellite precipitation estimates over India using gridded rainfall data. J. Geophys. Res. Atmos. 2015, 120, 8987–9005. [Google Scholar] [CrossRef]
- Awasthi, N.; Tripathi, J.N.; Petropoulos, G.P.; Gupta, D.K.; Singh, A.K.; Kathwas, A.K. Performance assessment of Global-EO-based precipitation products against gridded rainfall from the Indian Meteorological Department. Remote Sens. 2023, 15, 3443. [Google Scholar] [CrossRef]
- Awasthi, N.; Tripathi, J.N.; Petropoulos, G.P.; Gupta, D.K.; Singh, A.K.; Kathwas, A.K.; Srivastava, P.K. Appraisal of Climate Response to Vegetation Indices over Tropical Climate Region in India. Sustainability 2023, 15, 5675. [Google Scholar] [CrossRef]
- Zhang, Y.; Li, H.; Reggiani, P. Climate variability and climate change impacts on land surface, hydrological processes and water management. Water 2019, 11, 1492. [Google Scholar] [CrossRef]
- Seguis, L.; Cappelaere, B.; Milesi, G.; Peugeot, C.; Massuel, S.; Favreau, G. Simulated impacts of climate change and land-clearing on runoff from a small Sahelian catchment. Hydrol. Process. 2004, 18, 3401–3413. [Google Scholar] [CrossRef]
- Goderniaux, P.; Brouyère, S.; Fowler, H.J.; Blenkinsop, S.; Therrien, R.; Orban, P.; Dassargues, A. Large scale surface–subsurface hydrological model to assess climate change impacts on groundwater reserves. J. Hydrol. 2009, 373, 122–138. [Google Scholar] [CrossRef]
- Kalugin, A. The impact of climate change on surface, subsurface, and groundwater flow: A case study of the Oka River (European Russia). Water Resour. 2019, 46, S31–S39. [Google Scholar] [CrossRef]
- Liu, H.-L.; Willems, P.; Bao, A.-M.; Wang, L.; Chen, X. Effect of climate change on the vulnerability of a socio-ecological system in an arid area. Glob. Planet. Chang. 2016, 137, 1–9. [Google Scholar] [CrossRef]
- Holman, I.P.; Rounsevell, M.; Shackley, S.; Harrison, P.; Nicholls, R.; Berry, P.; Audsley, E. A regional, multi-sectoral and integrated assessment of the impacts of climate and socio-economic change in the UK: Part I. Methodology. Clim. Chang. 2005, 71, 9–41. [Google Scholar] [CrossRef]
- Xia, X.; Wu, Q.; Mou, X.; Lai, Y. Potential impacts of climate change on the water quality of different water bodies. J. Environ. Inform 2015, 25, 85–98. [Google Scholar] [CrossRef]
- Rahman, S.; Sengupta, D.; Ravichandran, M. Variability of Indian summer monsoon rainfall in daily data from gauge and satellite. J. Geophys. Res. Atmos. 2009, 114. [Google Scholar] [CrossRef]
- Srivastava, P.K.; Pradhan, R.K.; Petropoulos, G.P.; Pandey, V.; Gupta, M.; Yaduvanshi, A.; Wan Jaafar, W.Z.; Mall, R.K.; Sahai, A.K. Long-term trend analysis of precipitation and extreme events over Kosi River Basin in India. Water 2021, 13, 1695. [Google Scholar] [CrossRef]
- Mall, R.K.; Gupta, A.; Singh, R.; Singh, R.S.; Rathore, L. Water resources and climate change: An Indian perspective. Curr. Sci. 2006, 90, 1610–1626. [Google Scholar]
- Kumar, V.; Jain, S.K.; Singh, Y. Analysis of long-term rainfall trends in India. Hydrol. Sci. J. 2010, 55, 484–496. [Google Scholar] [CrossRef]
- Koteswaram, P.; Alvi, S. Trends and periodicities in rainfall at west coast stations in India. Curr. Sci. 1969, 38, 229–231. [Google Scholar]
- Jagannathan, P.; Parthasarathy, B. Trends and periodicities of rainfall over India. Mon. Weather. Rev. 1973, 101, 371–375. [Google Scholar] [CrossRef]
- Saxena, R.; Mathur, P. Recent trends in rainfall and temperature over North West India during 1871–2016. Theor. Appl. Climatol. 2019, 135, 1323–1338. [Google Scholar] [CrossRef]
- Menon, A.; Levermann, A.; Schewe, J.; Lehmann, J.; Frieler, K. Consistent increase in Indian monsoon rainfall and its variability across CMIP-5 models. Earth Syst. Dyn. 2013, 4, 287–300. [Google Scholar] [CrossRef]
- Khan, S.; Kumar, V.; Chaurasia, S. A classed approach towards rainfall forecasting: Machine learning method. Int. J. Swarm Intell. 2018, 3, 276–289. [Google Scholar] [CrossRef]
- Peterson, T.C.; Vose, R.S. An overview of the Global Historical Climatology Network temperature database. Bull. Am. Meteorol. Soc. 1997, 78, 2837–2850. [Google Scholar] [CrossRef]
- Kundu, S.; Khare, D.; Mondal, A.; Mishra, P. Analysis of spatial and temporal variation in rainfall trend of Madhya Pradesh, India (1901–2011). Environ. Earth Sci. 2015, 73, 8197–8216. [Google Scholar] [CrossRef]
- Ramaswami, G.; Datta, A.; Reddy, A.; Quader, S. Tracking phenology in the tropics and in India: The impacts of climate change. In The Implications of Climate Change for Indian Biodiversity: An Overview; 2019; pp. 45–59. [Google Scholar]
- Rahmat, A.; Zaki, M.K.; Effendi, I.; Mutolib, A.; Yanfika, H.; Listiana, I. Effect of global climate change on air temperature and precipitation in six cities in Gifu Prefecture, Japan. In Proceedings of the Young Scholar Symposium on Transdisciplinary in Education and Environment (YSSTEE), Lampung, Indonesia, 9–11 November 2018; Journal of Physics: Conference Series. IOP Publishing Ltd: Bristol, UK, 2019; p. 012070. [Google Scholar]
- Kumar, V.; Shanu; Jahangeer. Statistical distribution of rainfall in Uttarakhand, India. Appl. Water Sci. 2017, 7, 4765–4776. [Google Scholar] [CrossRef]
- Chauhan, A.S.; Singh, S.; Maurya, R.K.S.; Rani, A.; Danodia, A. Spatio-temporal and trend analysis of rain days having different intensity from 1901–2020 at regional scale in Haryana, India. Results Geophys. Sci. 2022, 10, 100041. [Google Scholar] [CrossRef]
- Pai, D.; Rajeevan, M.; Sreejith, O.; Mukhopadhyay, B.; Satbha, N. Development of a new high spatial resolution (0.25 × 0.25) long period (1901–2010) daily gridded rainfall data set over India and its comparison with existing data sets over the region. Mausam 2014, 65, 1–18. [Google Scholar] [CrossRef]
- Duhan, D.; Pandey, A. Statistical analysis of long term spatial and temporal trends of precipitation during 1901–2002 at Madhya Pradesh, India. Atmos. Res. 2013, 122, 136–149. [Google Scholar] [CrossRef]
- Lafon, T.; Dadson, S.; Buys, G.; Prudhomme, C. Bias correction of daily precipitation simulated by a regional climate model: A comparison of methods. Int. J. Climatol. 2013, 33, 1367–1381. [Google Scholar] [CrossRef]
- Guhathakurta, P.; Rajeevan, M.; Sikka, D.; Tyagi, A. Observed changes in southwest monsoon rainfall over India during 1901–2011. Int. J. Climatol. 2015, 35, 1881–1898. [Google Scholar] [CrossRef]
- Tsatsaris, A.; Kalogeropoulos, K.; Stathopoulos, N.; Louka, P.; Tsanakas, K.; Tsesmelis, D.E.; Krassanakis, V.; Petropoulos, G.P.; Pappas, V.; Chalkias, C. Geoinformation Technologies in Support of Environmental Hazards Monitoring under Climate Change: An Extensive Review. ISPRS Int. J. Geo-Inf. 2021, 10, 94. [Google Scholar] [CrossRef]
Disclaimer/Publisher’s Note: The statements, opinions and data contained in all publications are solely those of the individual author(s) and contributor(s) and not of MDPI and/or the editor(s). MDPI and/or the editor(s) disclaim responsibility for any injury to people or property resulting from any ideas, methods, instructions or products referred to in the content. |
© 2024 by the authors. Licensee MDPI, Basel, Switzerland. This article is an open access article distributed under the terms and conditions of the Creative Commons Attribution (CC BY) license (https://creativecommons.org/licenses/by/4.0/).