
Influence of Substrate Concentrations on the Performance of Fed-Batch and Perfusion Bioreactors: Insights from Mathematical Modelling


Abstract
1. Introduction
- Product Yield: This is the mass of product produced from the substrate added. It is desirable to have a higher value.
- Productivity: This is the mass of product produced per bioreactor volume per unit time. This has a major influence on the size of the bioreactor required to produce a specified mass of product in a given time. A higher productivity is more desirable because this results in a smaller bioreactor size.
- Titer: This is the product concentration in the final working volume. It is desirable to have a higher value.
- Wasted Substrate: This is related to the mass of substrate added that is not used in the bioreaction and ends up being wasted, or requiring wastewater treatment. It is desirable to have a lower value of wasted substrate.
- Product Residence Time: This is the mean time that product spends in the bioreactor. It is desirable to have lower product residence times, especially for sensitive products that may be degraded over time.
2. Mathematical Modelling
2.1. Bioreaction Kinetics
2.2. Bioreactor Mass Balances
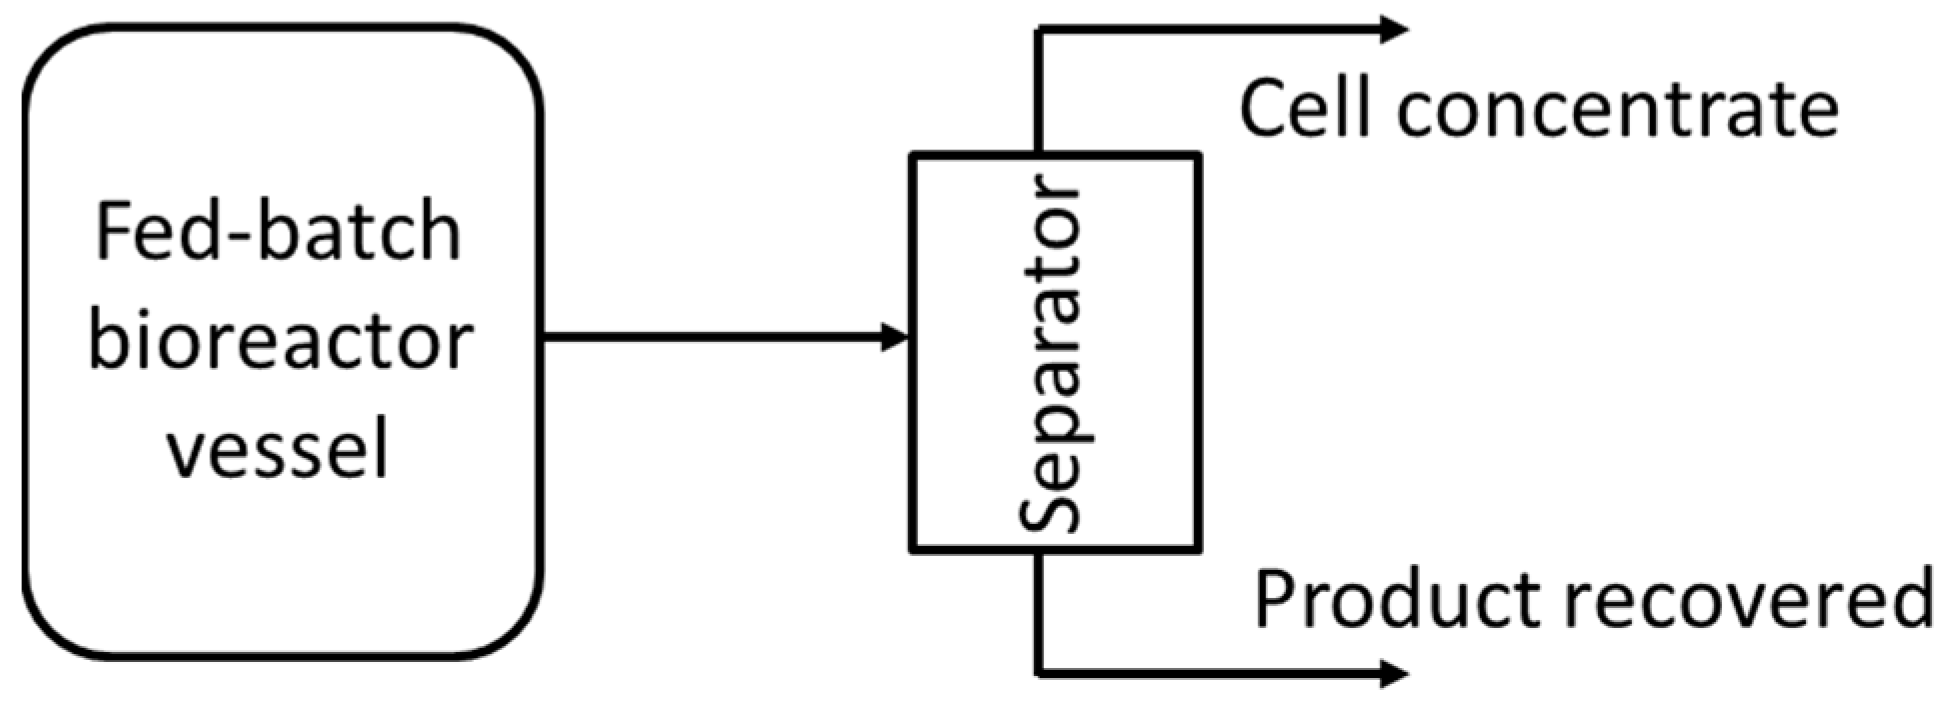
2.2.1. Fed-Batch
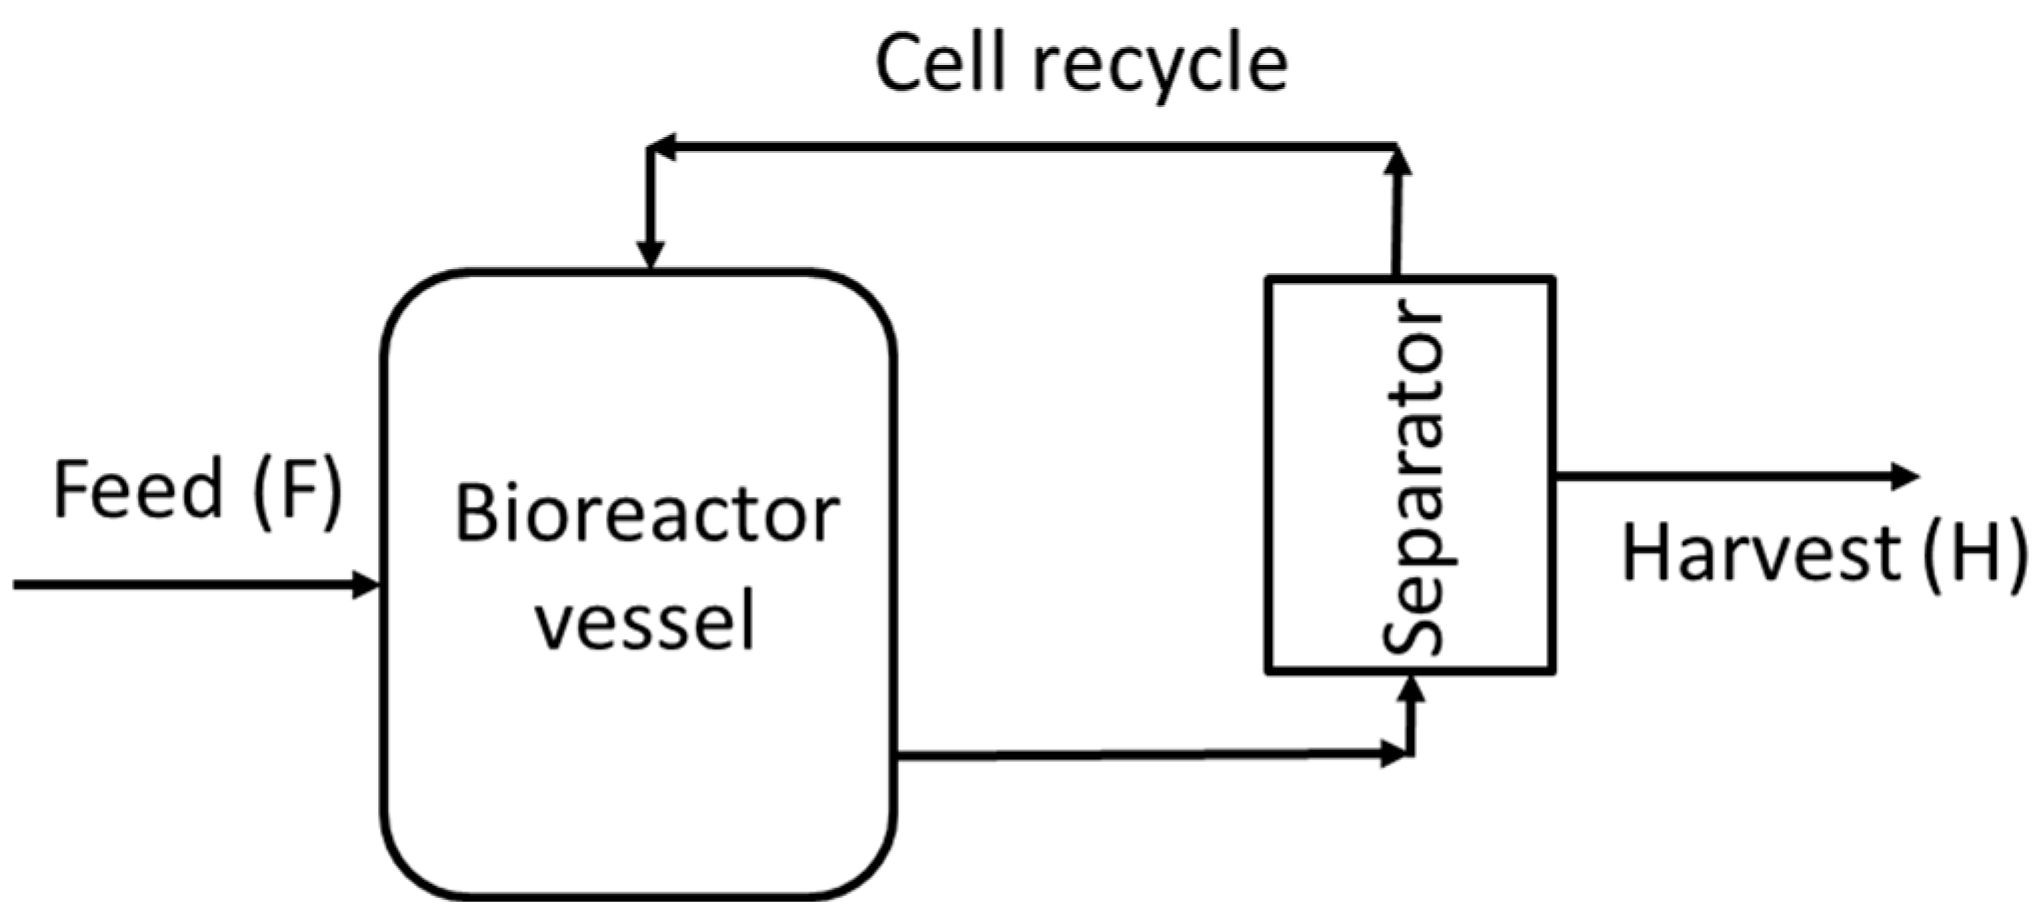
2.2.2. Perfusion
2.3. Product Recovery
2.4. Bioreactor Performance Parameters
- Yield
- Wasted Substrate
- Productivity
- Titer (product concentration)
- Mean Product Residence Time
2.4.1. Yield
2.4.2. Wasted Substrate
2.4.3. Titer
2.4.4. Productivity
2.4.5. Product Mean Residence Time
2.5. Initial Conditions and Model Implementation
3. Results and Discussion
3.1. Effect of Substrate Concentrations on Fed-Batch Bioreactor Performance
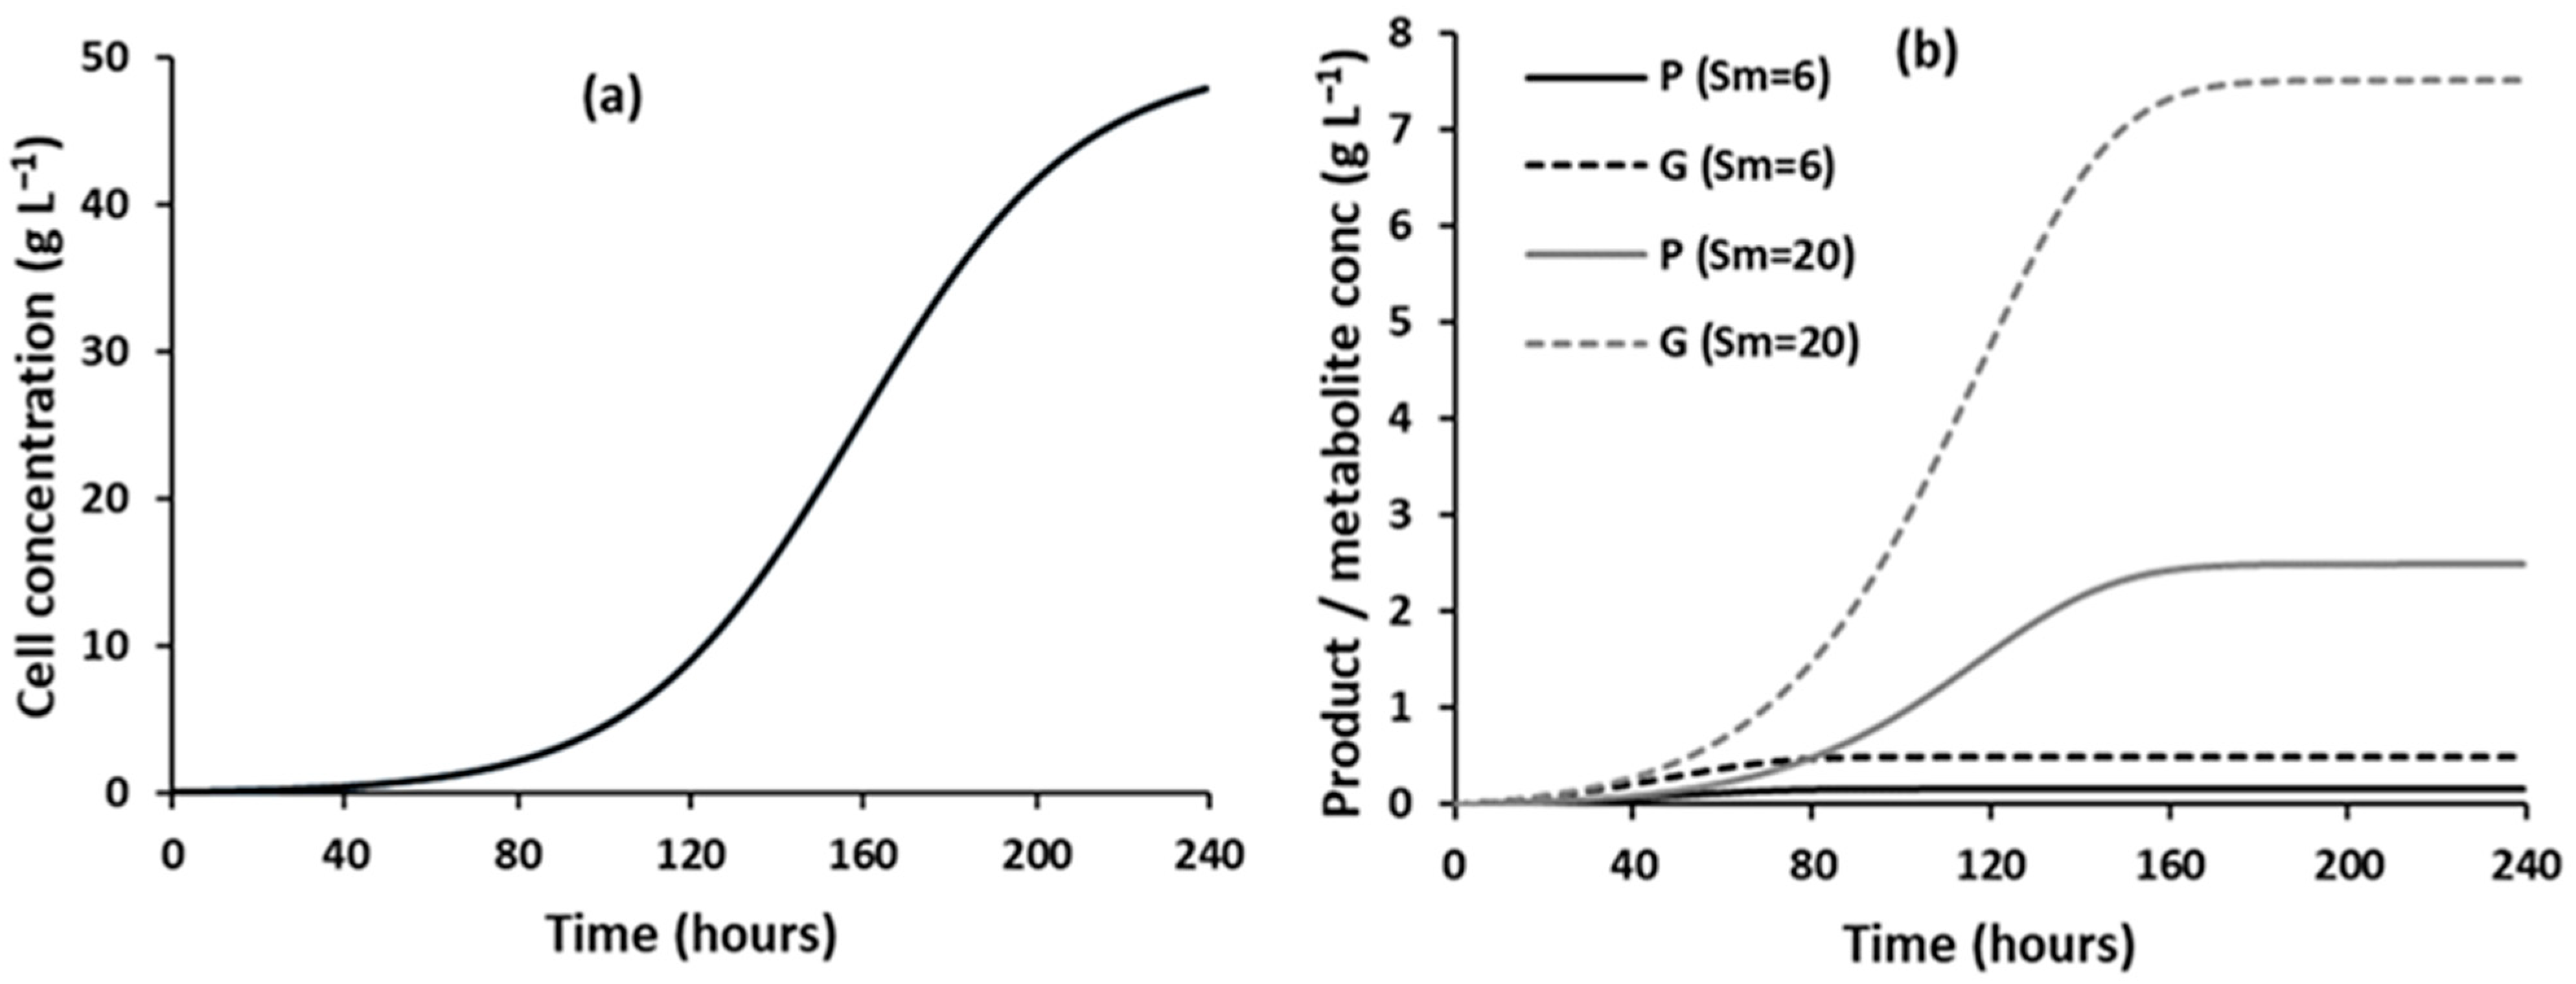
3.1.1. Effect of Substrate Concentrations on the Evolution of Component Concentrations over Time
3.1.2. Effect of Substrate Concentrations on Performance Parameters
3.1.3. Effect of Substrate Concentrations on the Performance of a Fed-Batch Bioreactor Operated in Continuous Mode of Media Addition
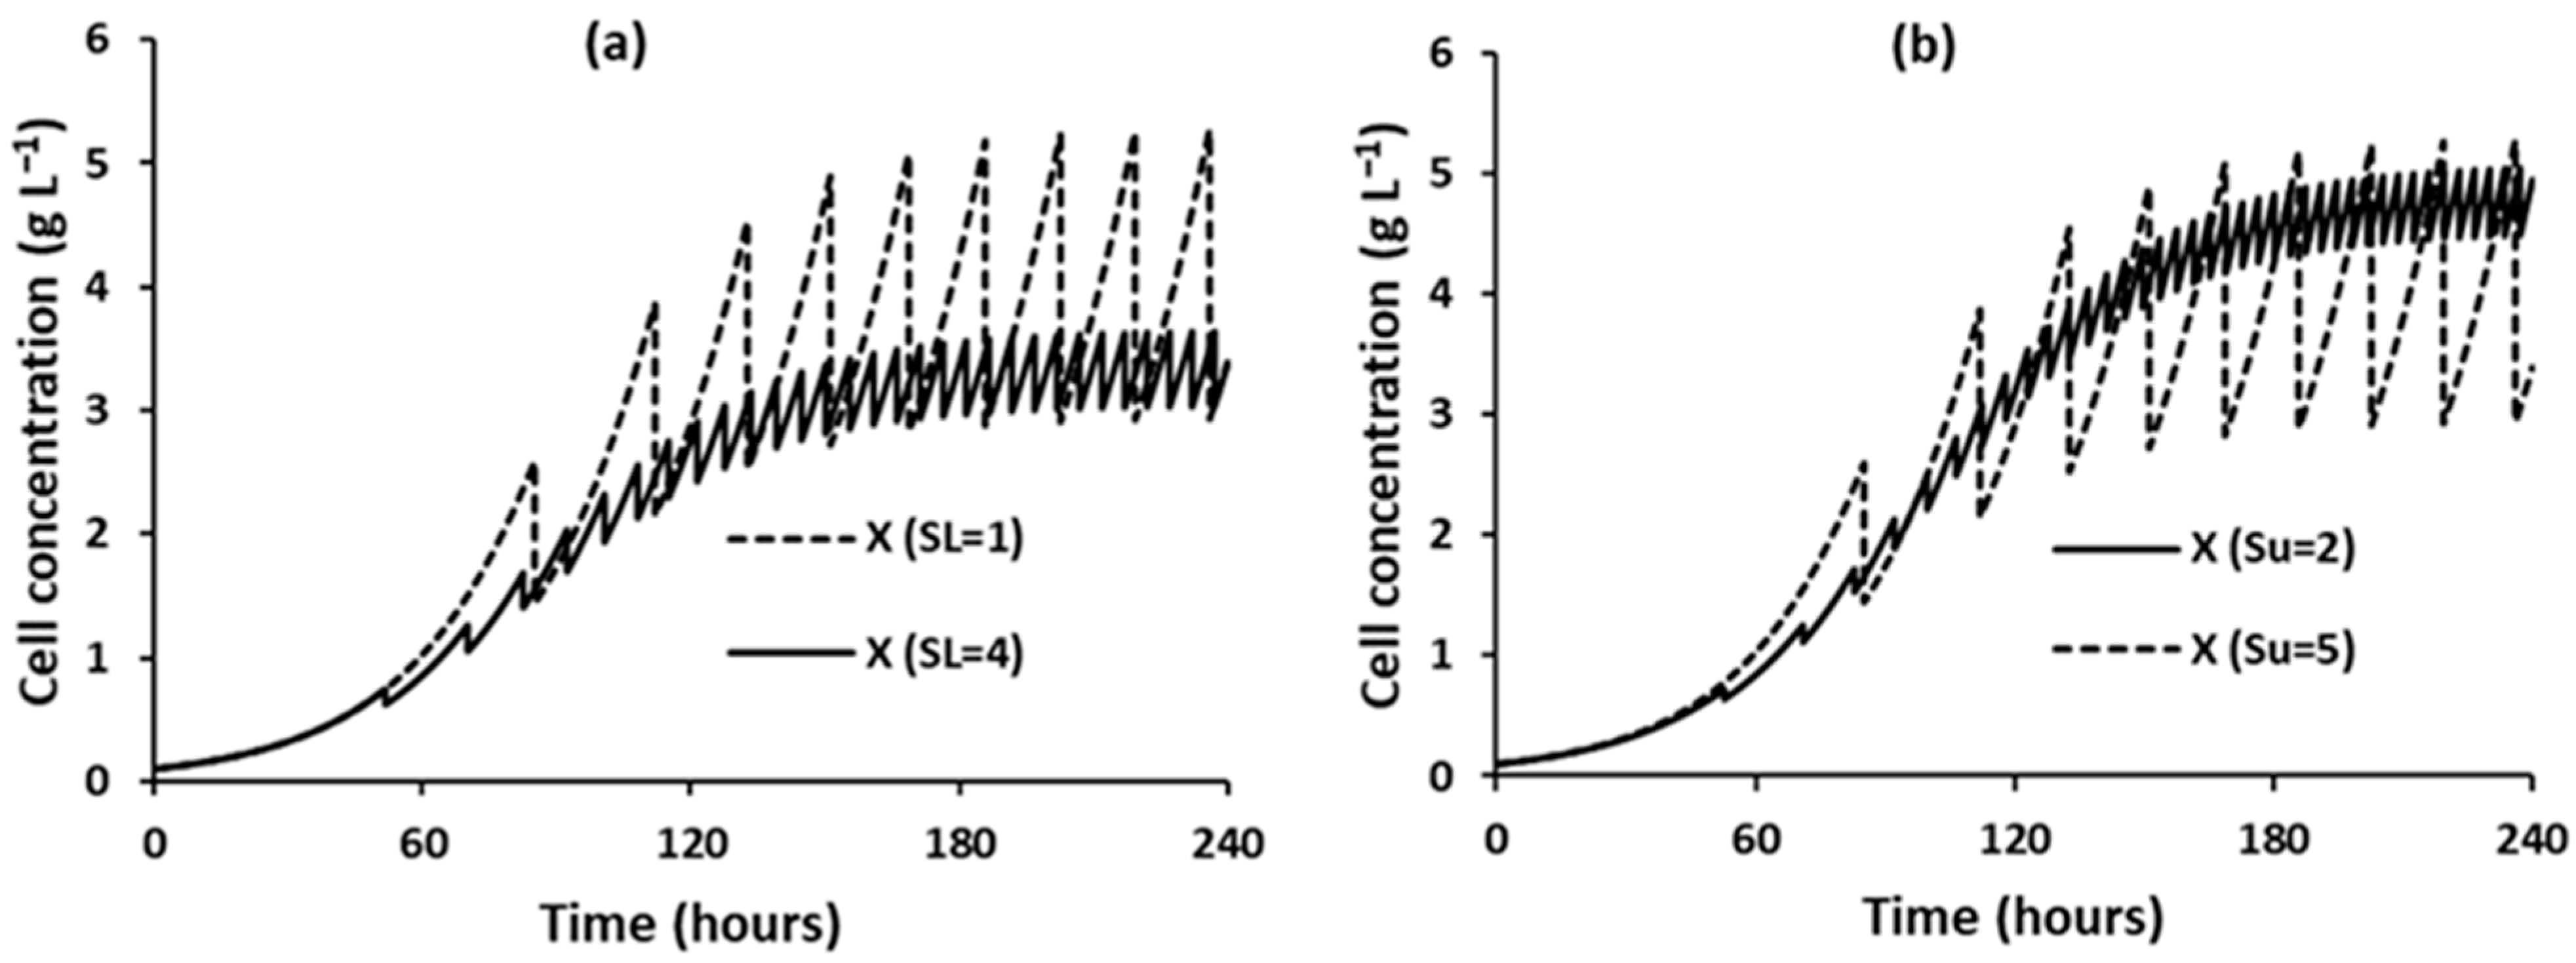
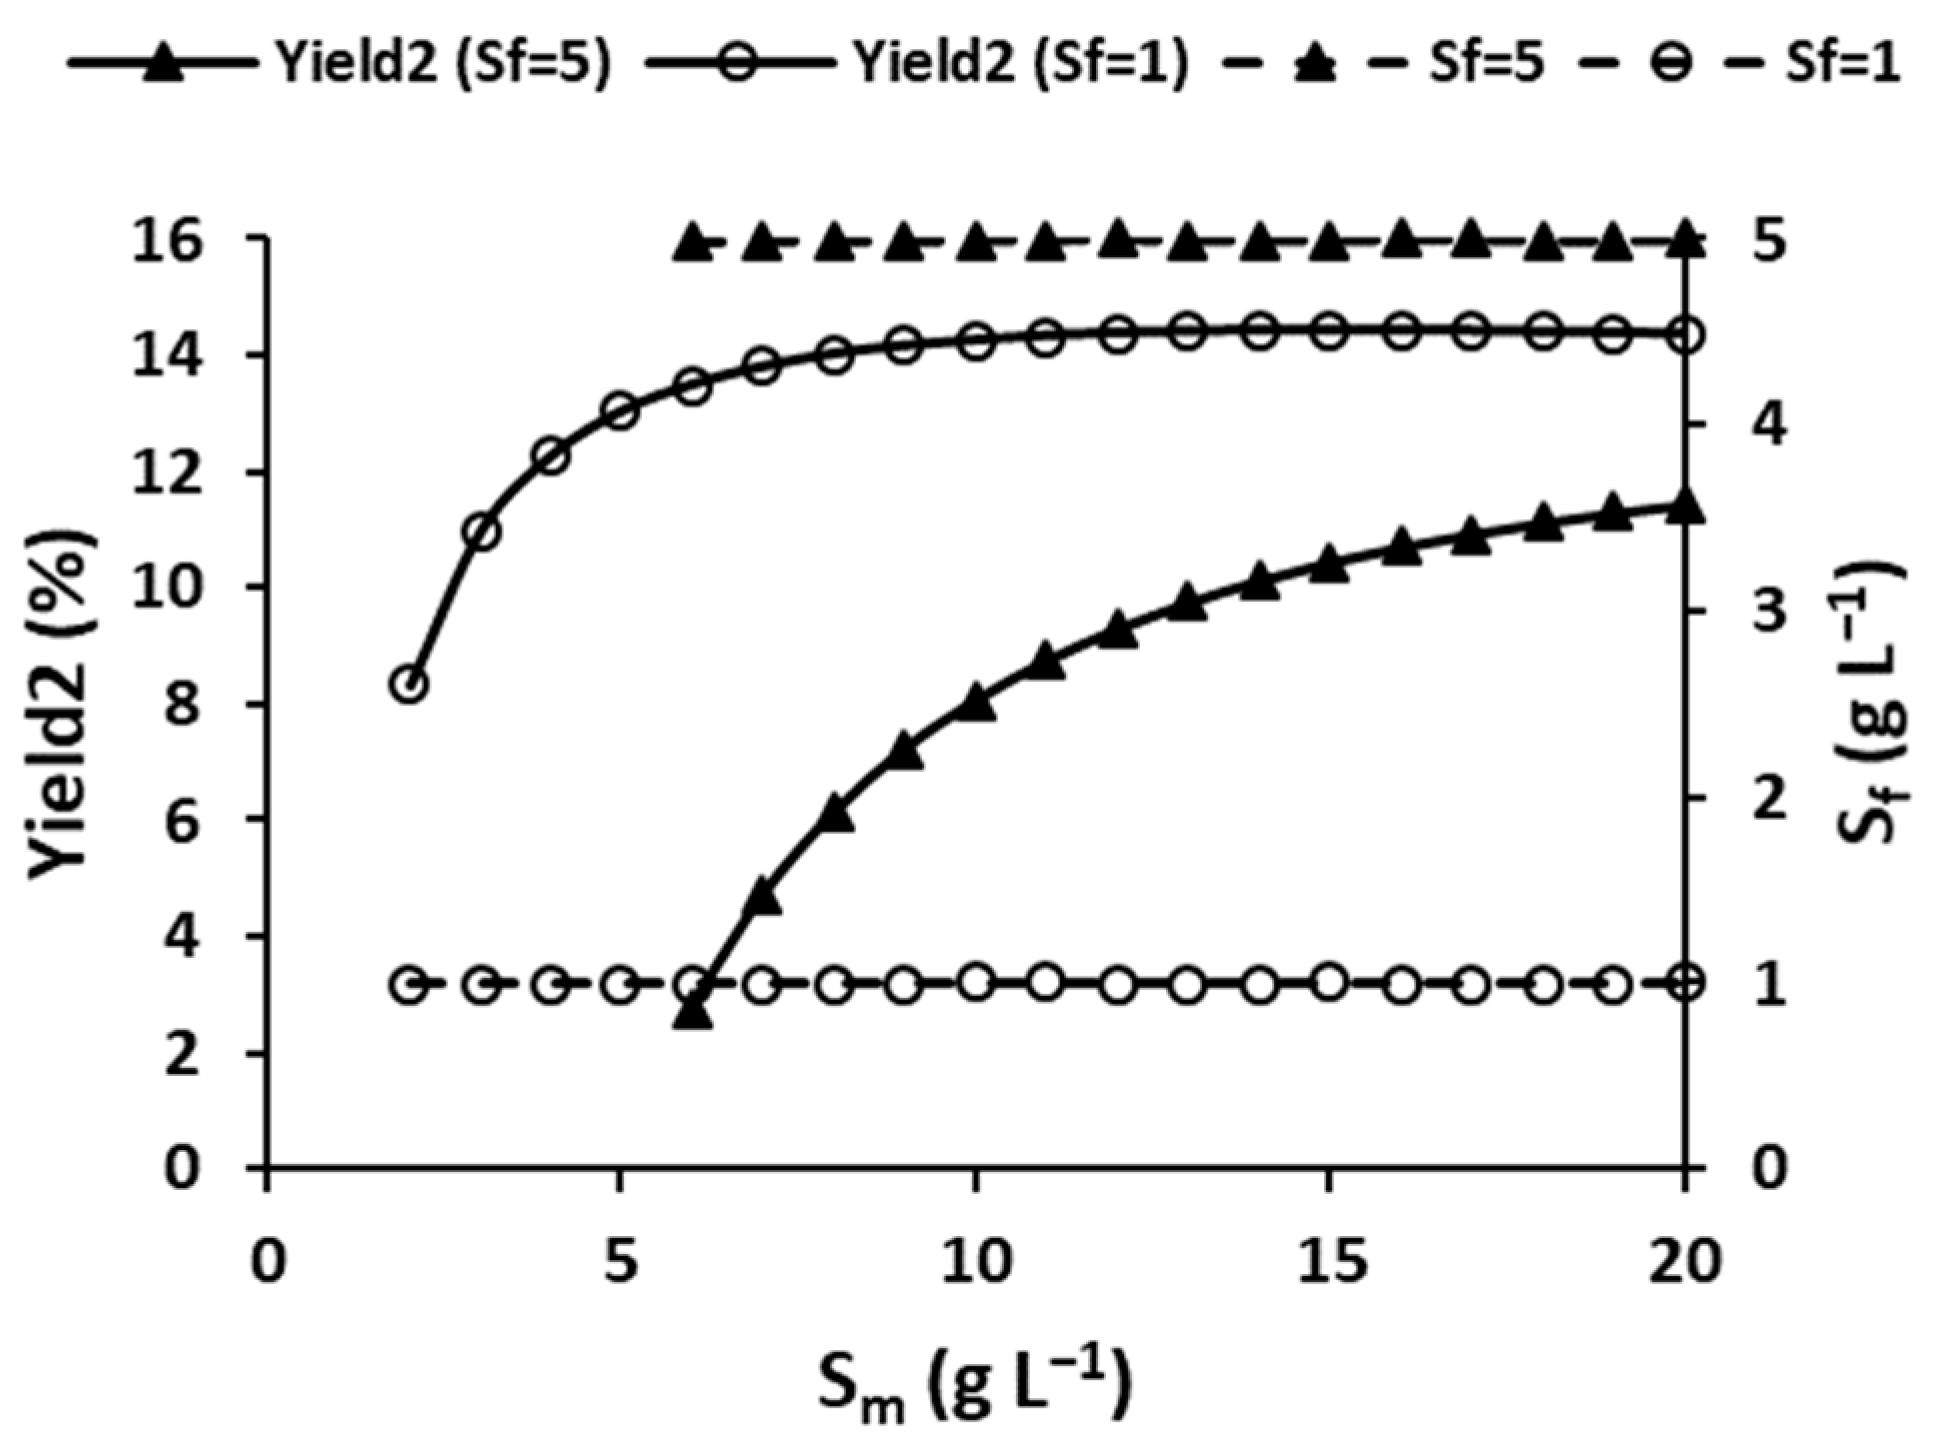
3.1.4. Effect of Rate-Limiting Bioreactor Substrate Concentration
3.2. Effect of Substrate Concentrations on Perfusion Bioreactor Performance
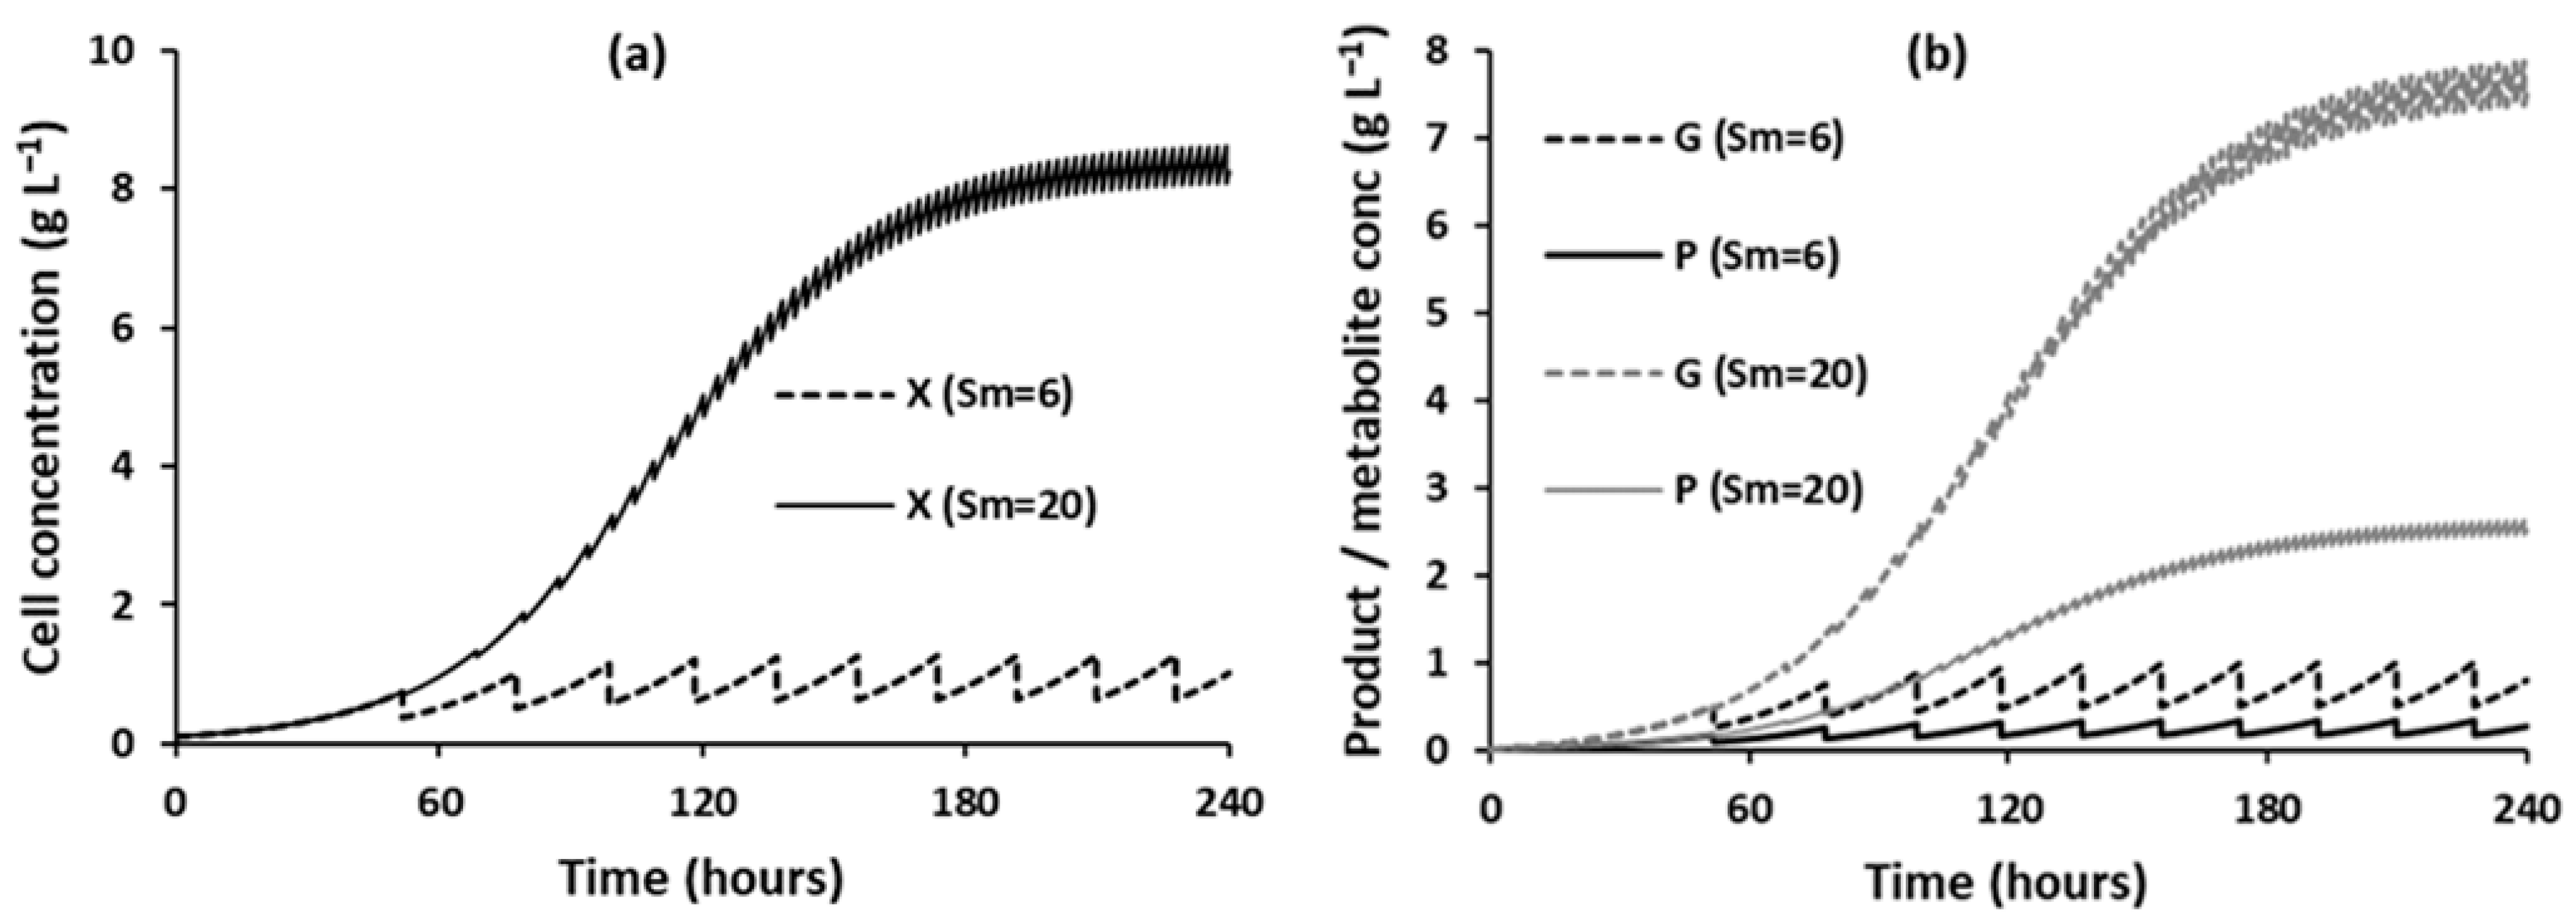
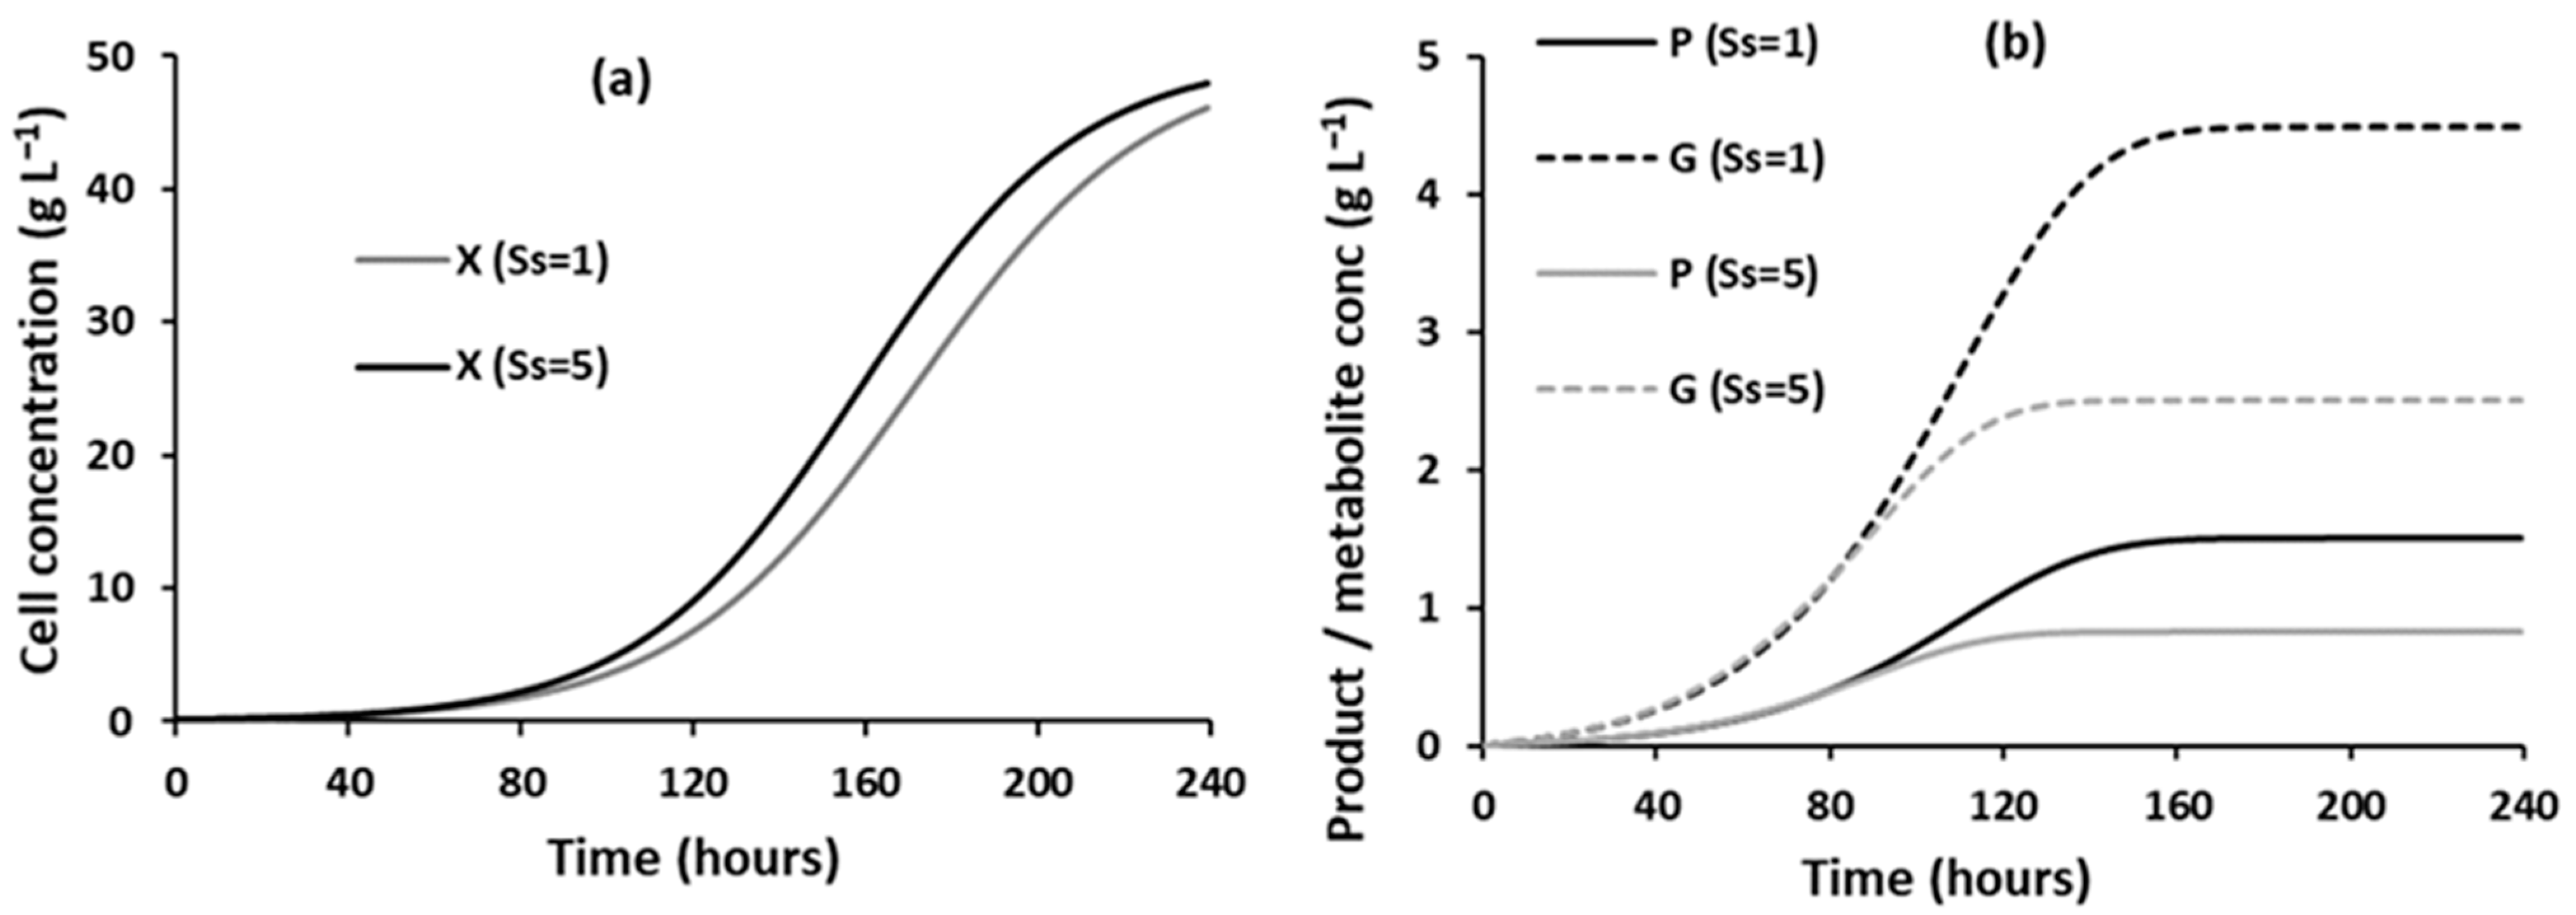
3.2.1. Effect of Substrate Concentrations on the Evolution of Component Concentrations over Time
3.2.2. Effect of Substrate Concentrations on Performance Parameters
3.2.3. Effect of Rate-Limiting Bioreactor Substrate Concentration
3.3. Effect of Bioreaction Time on Bioreactor Performance
3.3.1. Fed-Batch
- Titer, yield. and %WS: Final cell (), final product, and final metabolite () concentrations all increase over time and eventually reach constant values. This is reflected in titer and yield behaving similarly and in %WS decreasing over time to a constant value.
- Bioreactor working volume: Bioreaction time has a major effect on the final bioreactor working volume (), which is an exponential effect as illustrated in Figure 9. This is due to the mode of operation of fed-batch, whereby a greater volume of media addition is required to maintain the substrate concentration as the working volume increases over time. This increase in bioreactor working volume shows that the bioreaction time will be constrained in practice by the size of the bioreactor.
- Mean product residence time: Increasing the bioreaction time increases the residence time, but it does not affect it as one might intuitively expect, as illustrated in Figure 9. For example, one might expect that increasing the bioreaction time from 240 h to 960 h would significantly increase the product residence time. However, the product residence time for the 960 h bioreaction time is 33.9 h, which is only a little greater than the 32.3 h at the 240 h bioreaction time. The reason for this is due to the exponential increase in the bioreactor working volume; thus, most of the product is being produced in the latter part of the bioreaction time.
- Productivity: This initially increases as titer increases, achieves a maximum value, and then progressively decreases with increasing bioreaction time, in particular after 240 h, with productivity at 480 h being roughly half that at 240 h. The decrease in productivity is a consequence of the definition of productivity in Equation (27). As the bioreaction time doubles from 240 h to 480 h and then again to 960 h and the titer changes minimally, the net effect is that the productivity is reduced by half for each doubling of time. Figure 9 highlights that as the bioreaction time increases, more and more of the available working volume in a constant volume bioreactor is not being used, and this is contributing to the reduction in productivity over longer bioreaction times.
3.3.2. Perfusion
- Titer, yield, and %WS: Final cell (), final product, and final metabolite () concentrations all increase over time and eventually reach constant steady-state values. This is reflected in titer and yield behaving similarly and in %WS decreasing over time to a constant value.
- Mean product residence time: This decreases over time, with residence times being much higher early on and then approaching a constant value. Bioreaction rates are very slow initially and increase over time. This leads to higher feed/harvest flowrates over time, which reduces residence times. These flowrates eventually attain steady-state values, leading to mean residence times approaching constant values.
- Productivity: The bioreaction time has significant impact on the productivity, with it increasing significantly over time. This is due to longer bioreaction times having higher titers and also higher harvest flowrates (which is evidence by the shorter residence times).
3.4. Comparison of Fed-Batch and Perfusion Bioreactor Performance
3.5. Sensitivity Analysis
4. Conclusions
Author Contributions
Funding
Data Availability Statement
Conflicts of Interest
Abbreviations
| List of Symbols | |
| media feed volumetric flowrate [perfusion] (m3 h−1) | |
| mean media feed volumetric flowrate [perfusion] (m3 h−1) | |
| metabolite concentration (g L−1) | |
| metabolite concentration at end of bioreaction (g L−1) | |
| harvest volumetric flowrate [perfusion] (m3 h−1) | |
| Monod kinetic constant for substrate (g L−1) | |
| mass of product produced during bioreaction time (kg) | |
| specific maintenance coefficient (h−1) | |
| product concentration (g L−1) | |
| product concentration at end of bioreaction (g L−1) | |
| product concentration before media addition [fed-batch] (g L−1) | |
| metabolite production rate (g L−1 h−1) | |
| product production rate (g L−1 h−1) | |
| substrate utilization rate (g L−1 h−1) | |
| cell growth rate (g L−1 h−1) | |
| cell death rate (g L−1 h−1) | |
| intrinsic cell growth rate (g L−1 h−1) | |
| substrate concentration (g L−1) | |
| lower limit substrate concentration in bioreactor [fed-batch] (g L−1) | |
| substrate concentration in the media added (g L−1) | |
| initial substrate concentration in the bioreactor (g L−1) | |
| steady-state substrate concentration (g L−1) | |
| upper limit substrate concentration in bioreactor [fed-batch] (g L−1) | |
| time (h) | |
| bioreaction time at the ith time increment (h) | |
| hydraulic residence time [perfusion] (h) | |
| bioreaction time from the start to end of bioreaction process (h) | |
| mean product residence time (h) | |
| bioreactor working volume (m3) | |
| volume of cell concentrate after cell separation [fed-batch] (m3) | |
| final bioreactor working volume [fed-batch] (m3) | |
| working volume before media addition [fed-batch] (m3) | |
| volume of media added [fed-batch] (m3) | |
| initial bioreactor working volume [fed-batch] (m3) | |
| volume of recovered product solution [fed-batch] (m3) | |
| viable cell concentration (g L−1) | |
| total cell concentration in cell concentrate after cell separation (g L−1) | |
| dead cell concentration (g L−1) | |
| cell concentration at end of bioreaction (g L−1) | |
| physiological maximum cell concentration (g L−1) | |
| total cell concentration (g L−1) | |
| yield of product produced from substrate added (%) | |
| yield of product recovered from substrate added (%) | |
| yield coefficient for biomass | |
| yield coefficient for product | |
| percentage wasted substrate | |
| , ,, | bioreaction model kinetic constants |
| mass of product produced during the ith time increment (kg) | |
| specific growth rate (h−1) | |
| maximum specific growth rate (h−1) | |
References
- Lindskog, E.K. The upstream process: Principal modes of operation. In Biopharmaceutical Processing; Elsevier: Amsterdam, The Netherlands, 2018. [Google Scholar] [CrossRef]
- Walker, N. Perfusion Appears to Be Gaining Traction in Biopharma Manufacturing. Pharma’s Almanac. 14 September 2017. Available online: https://www.pharmasalmanac.com/articles/perfusion-appears-to-be-gaining-traction-in-biopharma-manufacturing (accessed on 1 July 2024).
- Langer, E.S.; Rader, R.A. Continuous bioprocessing and perfusion: Wider adoption coming as bioprocessing matures. Bioprocess. J. 2014, 13, 43–49. [Google Scholar] [CrossRef]
- Bielser, J.-M.; Wolf, M.; Souquet, J.; Broly, H.; Morbidelli, M. Perfusion mammalian cell culture for recombinant protein manufacturing—A critical review. Biotechnol. Adv. 2018, 36, 1328–1340. [Google Scholar] [CrossRef]
- Yang, Y.; Sha, M. A Beginner’s Guide to Bioprocess Modes—Batch, Fed-Batch and Continuous Fermentation. Eppendorf, Application Note 408. 2022. Available online: http://www.lscollege.ac.in/sites/default/files/e-content/Fed-Batch%20Vs%20Continuous-Fermentation.pdf (accessed on 1 July 2024).
- Jones, W.; Gerogiorgis, D.I. Technoeconomic comparison of optimised bioreactor-filtration systems for mAb production. Comput. Chem. Eng. 2023, 179, 108438. [Google Scholar] [CrossRef]
- Matanguihan, C.; Wu, P. Upstream continuous processing: Recent advances in production of biopharmaceuticals and challenges in manufacturing. Curr. Opin. Biotechnol. 2022, 78, 102828. [Google Scholar] [CrossRef]
- Bielser, J.; Kraus, L.; Burgos-Morales, O.; Broly, H.; Souquet, J. Reduction of medium consumption in perfusion mammalian cell cultures using a perfusion rate equivalent concentrated nutrient feed. Biotechnol. Prog. 2020, 36, e3026. [Google Scholar] [CrossRef]
- Lalor, F.; Fitzpatrick, J.; Sage, C.; Byrne, E. Sustainability in the biopharmaceutical industry: Seeking a holistic perspective. Biotechnol. Adv. 2019, 37, 698–707. [Google Scholar] [CrossRef] [PubMed]
- Tona, R.M.; Shah, R.; Middaugh, K.; Steve, J.; Marques, J.; Roszell, B.R.; Jung, C. Process intensification for lentiviral vector manufacturing using tangential flow depth filtration. Mol. Ther. Methods Clin. Dev. 2023, 29, 93–107. [Google Scholar] [CrossRef] [PubMed]
- Rathore, A.S.; Zydney, A.L.; Anupa, A.; Nikita, S.; Gangwar, N. Enablers of continuous processing of biotherapeutic products. Trends Biotechnol. 2022, 40, 804–815. [Google Scholar] [CrossRef]
- Chen, C.; Wong, H.E.; Goudar, C.T. Upstream process intensification and continuous manufacturing. Curr. Opin. Chem. Eng. 2018, 22, 191–198. [Google Scholar] [CrossRef]
- Wolf, M.K.; Pechlaner, A.; Lorenz, V.; Karst, D.J.; Souquet, J.; Broly, H.; Morbidelli, M. A two-step procedure for the design of perfusion bioreactors. Biochem. Eng. J. 2019, 151, 107295. [Google Scholar] [CrossRef]
- Shevitz, J.; Bonham-Carter, J.; Lim, J.; Sinclair, A. An economic comparison of three cell culture techniques. Bio-Pharm Int. 2011, 24, 54–60. [Google Scholar]
- Fisher, A.C.; Kamga, M.-H.; Agarabi, C.; Brorson, K.; Lee, S.L.; Yoon, S. The Current Scientific and Regulatory Landscape in Advancing Integrated Continuous Biopharmaceutical Manufacturing. Trends Biotechnol. 2018, 37, 253–267. [Google Scholar] [CrossRef] [PubMed]
- Galleguillos, S.N.; Ruckerbauer, D.; Gerstl, M.P.; Borth, N.; Hanscho, M.; Zanghellini, J. What can mathematical modelling say about CHO metabolism and protein glycosylation? Comput. Struct. Biotechnol. J. 2017, 15, 212–221. [Google Scholar] [CrossRef]
- López-Meza, J.; Araíz-Hernández, D.; Carrillo-Cocom, L.M.; López-Pacheco, F.; Rocha-Pizaña, M.d.R.; Alvarez, M.M. Using simple models to describe the kinetics of growth, glucose consumption, and monoclonal antibody formation in naive and infliximab producer CHO cells. Cytotechnology 2015, 68, 1287–1300. [Google Scholar] [CrossRef] [PubMed]
- Gjoka, X.; Gantier, R.; Schofield, M. Going from fed-batch to perfusion. BioPharm Int. 2017, 30, 7. Available online: https://www.biopharminternational.com/view/going-fed-batch-perfusion (accessed on 1 July 2024).
- Shirahata, H.; Diab, S.; Sugiyama, H.; Gerogiorgis, D.I. Dynamic modelling, simulation and economic evaluation of two CHO cell-based production modes towards developing biopharmaceutical manufacturing processes. Chem. Eng. Res. Des. 2019, 150, 218–233. [Google Scholar] [CrossRef]
- Dorceus, M.; Willard, S.S.; Suttle, A.; Han, K.; Chen, P.J.; Sha, M. Comparing Culture Methods in Monoclonal Antibody Production: Batch, Fed-Batch and Perfusion. BioProcess International. 20 March 2017. Available online: https://bioprocessintl.com/analytical/upstream-development/comparing-culture-methods-monoclonal-antibody-production-batch-fed-batch-perfusion/ (accessed on 1 July 2024).
- Bausch, M.; Schulteiss, C.; Sieck, J. Recommendations for comparison of productivity between fed-batch and per-fusion processes. Biotechnol. J. 2019, 14, 1700721. [Google Scholar] [CrossRef]
- Walther, J.; Lu, J.; Hollenbach, M.; Yu, M.; Hwang, C.; McIarty, J.; Brower, K. Perfusion cell culture decreases process and product heterogeneity in a head-to-head comparison with fed-batch. Biotechnol. J. 2018, 14, 1700733. [Google Scholar]
- Yan, X.; Bergstrom, D.J.; Chen, X. Modelling of cell cultures in perfusion bioreactors. IEEE Trans. Bio-Med. Eng. 2012, 59, 2568–2575. [Google Scholar] [CrossRef]
- Kumar, D.; Gangwar, N.; Rathore, A.S.; Ramteke, M. Multi-objective optimization of monoclonal antibody pro-duction in bioreactor. Chem. Eng. Process. Process Intensif. 2022, 180, 108720. [Google Scholar] [CrossRef]
- Jones, W.; Gerogiorgis, D.I. Dynamic simulation, optimisation and economic analysis of fed-batch vs. perfusion bioreactors for advanced mAb manufacturing. Comput. Chem. Eng. 2022, 165, 107855. [Google Scholar] [CrossRef]
- Badr, S.; Okamura, K.; Takahashi, N.; Ubbenjans, V.; Shirahata, H.; Sugiyama, H. Integrated design of biopharmaceutical manufacturing processes: Operation modes and process configurations for monoclonal antibody production. Comput. Chem. Eng. 2021, 153, 107422. [Google Scholar] [CrossRef]
- Klutz, S.; Holtmann, L.; Lobedann, M.; Schembecker, G. Cost evaluation of antibody production processes in dif-ferent operation modes. Chem. Eng. Sci. 2016, 141, 63–74. [Google Scholar] [CrossRef]
- Cataldo, A.; Burgstaller, D.; Hribar, G.; Jungbauer, A.; Satzer, P. Economics and ecology: Modelling of continuous primary recovery and capture scenarios for recombinant antibody production. J. Biotechnol. 2020, 308, 87–95. [Google Scholar] [CrossRef]
- Madabhushi, S.R.; Pinto, N.D.S.; Lin, H. Comparison of process mass intensity (PMI) of continuous and batch manufacturing processes for biologics. New Biotechnol. 2022, 72, 122–127. [Google Scholar] [CrossRef] [PubMed]
- Kornecki, M.; Strube, J. Process Analytical Technology for Advanced Process Control in Biologics Manufacturing with the Aid of Macroscopic Kinetic Modeling. Bioengineering 2018, 5, 25. [Google Scholar] [CrossRef]
- Xing, Z.; Bishop, N.; Leister, K.; Li, Z.J. Modeling kinetics of a large-scale fed-batch CHO cell culture by Markov chain Monte Carlo method. Biotechnol. Prog. 2010, 26, 208–219. [Google Scholar] [CrossRef]
- Jones, W.; Gerogiorgis, D.I. Dynamic optimisation and comparative analysis of fed-batch and perfusion bioreactor performance for monoclonal antibody (mAb) manufacturing. Comput. Aided Chem. Eng. 2022, 51, 1117–1122. [Google Scholar]
- Tapia, F.; Vázquez-Ramírez, D.; Genzel, Y.; Reichl, U. Bioreactors for high cell density and continuous multi-stage cultivations: Options for process intensification in cell culture-based viral vaccine production. Appl. Microbiol. Biotechnol. 2016, 100, 2121–2132. [Google Scholar] [CrossRef]
- Széliová, D.; Ruckerbauer, D.E.; Galleguillos, S.N.; Petersen, L.B.; Natter, K.; Hanscho, M.; Troyer, C.; Causon, T.; Schoeny, H.; Christensen, H.B.; et al. What CHO is made of: Variations in the biomass composition of Chinese hamster ovary cell lines. Metab. Eng. 2020, 61, 288–300. [Google Scholar] [CrossRef]


| (g L−1) | 0.1 | (h−1) | 0.01 |
| (h−1) | 0.06 | (h−1 | 0.03 |
| (g L−1) | 50 | (h−1) | 0.04 |
(g L−1) | Productivity (mg L−1 h−1) | (h) | (%) | (%) | (%) | (g L−1) | |
|---|---|---|---|---|---|---|---|
| 6 | 0.38 | 1.55 | 26.6 | 6.3 | 6.2 | 62.4 | 1.42 |
| 10 | 0.95 | 3.84 | 28.0 | 9.6 | 9.2 | 42.6 | 3.39 |
| 20 | 2.50 | 9.58 | 30.7 | 12.7 | 11.7 | 24.0 | 7.98 |
(g L−1) | Productivity (mg L−1 h−1) | (h) | (%) | (%) | (%) | (m3) | |
|---|---|---|---|---|---|---|---|
| = 1 g L−1 and = 0.99 g L−1 | |||||||
| 2 | 0.17 | 0.69 | 27.8 | 8.4 | 8.3 | 49.7 | 46.9 |
| 6 | 0.83 | 3.36 | 29.0 | 13.9 | 13.5 | 16.7 | 7.93 |
| 10 | 1.48 | 5.87 | 30.1 | 15.0 | 14.2 | 10.1 | 3.91 |
| 20 | 3.06 | 11.59 | 32.3 | 15.8 | 14.4 | 5.1 | 1.52 |
| = 5 g L−1 and = 4.99 g L−1 | |||||||
| 2 | - | - | - | - | - | - | - |
| 6 | 0.17 | 0.69 | 25.8 | 2.8 | 2.8 | 83.3 | 85.4 |
| 10 | 0.83 | 3.35 | 27.1 | 8.3 | 8.1 | 50.1 | 13.8 |
| 20 | 2.46 | 9.43 | 29.8 | 12.5 | 11.4 | 25.3 | 3.30 |
(g L−1) | Productivity (mg L−1 h−1) | (h) | (%) | (%) | (%) | (L) | (m3) | |
|---|---|---|---|---|---|---|---|---|
| = 1 g L−1 and = 0.99 g L−1 | ||||||||
| 2 | 0.17 | 0.69 | 27.8 | 8.4 | 8.3 | 49.7 | 0.60 | 46.9 |
| 20 | 3.06 | 11.6 | 32.3 | 15.8 | 14.4 | 5.1 | 9.22 | 1.52 |
| = 0.05 g L−1 and = 0.04 g L−1 [rate-limiting] | ||||||||
| 2 | 0.27 | 1.11 | 67.9 | 16.2 | 16.2 | 2.6 | 0.35 | 0.28 |
| 20 | 1.02 | 4.21 | 68.2 | 16.5 | 16.3 | 0.8 | 1.32 | 0.07 |
(g L−1) | Productivity (mg L−1 h−1) | (h) | (%) | (%) | (%) | |
|---|---|---|---|---|---|---|
| = 1 g L−1 | ||||||
| 2 | 0.17 | 148 | 0.45 | 8.3 | 8.3 | 50.1 |
| 6 | 0.81 | 147 | 1.87 | 13.8 | 13.7 | 17.0 |
| 10 | 1.44 | 145 | 3.09 | 14.9 | 14.6 | 10.4 |
| 20 | 2.90 | 142 | 5.82 | 15.8 | 15.1 | 5.4 |
| = 5 g L−1 | ||||||
| 2 | - | - | - | - | - | - |
| 6 | 0.17 | 172 | 0.40 | 2.8 | 2.8 | 83.4 |
| 10 | 0.82 | 170 | 1.65 | 8.3 | 8.2 | 50.5 |
| 20 | 2.35 | 167 | 4.27 | 12.3 | 12.0 | 26.1 |
(g L−1) | Productivity (mg L−1 h−1) | (h) | (%) | (%) | (%) | (g L−1) | |
|---|---|---|---|---|---|---|---|
| = 1 g L−1 | |||||||
| 2 | 0.17 | 148 | 0.45 | 8.3 | 8.3 | 50.1 | 46.3 |
| 20 | 2.90 | 142 | 5.82 | 15.8 | 15.1 | 5.4 | 46.3 |
| = 0.05 g L−1 [rate limiting] | |||||||
| 2 | 0.27 | 7.2 | 15.5 | 16.2 | 16.1 | 3.0 | 2.34 |
| 20 | 1.13 | 7.1 | 128 | 16.5 | 16.2 | 0.73 | 2.34 |
(h) | (g L−1) | Productivity (mg L−1 h−1) | (h) | (%) | (%) | (g L−1) | (g L−1) | (m3) |
|---|---|---|---|---|---|---|---|---|
| 48 | 0.1 | 2.57 | 17.4 | 7.1 | 57.2 | 0.54 | 0.37 | 0.05 |
| 120 | 1.2 | 9.78 | 26.7 | 14.1 | 11.9 | 4.29 | 3.68 | 0.08 |
| 240 | 3.1 | 11.6 | 32.3 | 14.4 | 5.1 | 9.22 | 9.19 | 1.52 |
| 480 | 3.2 | 5.98 | 33.9 | 14.4 | 5.0 | 9.36 | 9.50 | 1799 |
| 960 | 3.2 | 2.99 | 33.9 | 14.4 | 5.0 | 9.36 | 9.50 | 2.6(109) |
(h) | (g L−1) | Productivity (mg L−1 h−1) | (h) | (%) | (%) | (g L−1) | (g L−1) |
|---|---|---|---|---|---|---|---|
| 48 | 0.1 | 2.7 | 48 | 7.1 | 57.3 | 0.57 | 0.38 |
| 120 | 1.2 | 16 | 43 | 13.9 | 12.0 | 6.8 | 4.42 |
| 240 | 2.9 | 142 | 5.8 | 15.1 | 5.4 | 46.3 | 9.50 |
| 480 | 3.1 | 319 | 3.8 | 15.7 | 5.1 | 50.0 | 9.50 |
| 960 | 3.1 | 409 | 3.4 | 15.8 | 5.0 | 50.0 | 9.50 |
| All −20% | Base- Case | All +20% | +20% | +20% | +20% | +20% | +20% | |
|---|---|---|---|---|---|---|---|---|
| Fed-batch | ||||||||
| −8 | - | 3 | 17 | −2 | 3 | 0 | −14 | |
| −1 | - | 0 | 0 | 0 | 0 | 20 | −17 | |
| Productivity | −9 | - | 2 | 1 | 0 | 0 | 20 | −15 |
| −9 | - | 3 | 2 | 0 | 0 | 20 | −16 | |
| 11 | - | −2 | −2 | 0 | 0 | 0 | 0 | |
| 20 | - | −15 | −12 | 1 | −2 | 0 | −2 | |
| Perfusion | ||||||||
| −35 | - | 27 | 6 | −1 | 18 | 0 | 0 | |
| −1 | - | 0 | 0 | 0 | 0 | 20 | −17 | |
| Productivity | −58 | - | 87 | 39 | −4 | 12 | 20 | 1 |
| −11 | - | 4 | 2 | 0 | 1 | 20 | −16 | |
| 10 | - | −4 | −2 | 0 | −1 | 0 | −1 | |
| 106 | - | −40 | −20 | 3 | −11 | 0 | −14 | |
Disclaimer/Publisher’s Note: The statements, opinions and data contained in all publications are solely those of the individual author(s) and contributor(s) and not of MDPI and/or the editor(s). MDPI and/or the editor(s) disclaim responsibility for any injury to people or property resulting from any ideas, methods, instructions or products referred to in the content. |
© 2025 by the authors. Licensee MDPI, Basel, Switzerland. This article is an open access article distributed under the terms and conditions of the Creative Commons Attribution (CC BY) license (https://creativecommons.org/licenses/by/4.0/).
Share and Cite
Fitzpatrick, J.J.; O'Leary, F.; Hill, A.; Daly, J.; Lalor, F.; Byrne, E.P. Influence of Substrate Concentrations on the Performance of Fed-Batch and Perfusion Bioreactors: Insights from Mathematical Modelling. ChemEngineering 2025, 9, 48. https://doi.org/10.3390/chemengineering9030048
Fitzpatrick JJ, O'Leary F, Hill A, Daly J, Lalor F, Byrne EP. Influence of Substrate Concentrations on the Performance of Fed-Batch and Perfusion Bioreactors: Insights from Mathematical Modelling. ChemEngineering. 2025; 9(3):48. https://doi.org/10.3390/chemengineering9030048
Chicago/Turabian StyleFitzpatrick, John J., Fionn O'Leary, Ali Hill, James Daly, Fergal Lalor, and Edmond P. Byrne. 2025. "Influence of Substrate Concentrations on the Performance of Fed-Batch and Perfusion Bioreactors: Insights from Mathematical Modelling" ChemEngineering 9, no. 3: 48. https://doi.org/10.3390/chemengineering9030048
APA StyleFitzpatrick, J. J., O'Leary, F., Hill, A., Daly, J., Lalor, F., & Byrne, E. P. (2025). Influence of Substrate Concentrations on the Performance of Fed-Batch and Perfusion Bioreactors: Insights from Mathematical Modelling. ChemEngineering, 9(3), 48. https://doi.org/10.3390/chemengineering9030048