Article

Drilling Optimization Using Artificial Neural Networks and Empirical Models

by
Mohammed F. Al Dushaishi
1,*,
Ahmed K. Abbas
2,
Mortadha T. Al Saba
3 and
Jarrett Wise
4
1
School of Chemical Engineering, Oklahoma State University, Stillwater, OK 74078, USA
2
Misan Oil Training Institute (MOTI), University of Misan, Amarah 62001, Iraq
3
Petroleum Engineering Department, Australian University, Safat 13015, Kuwait
4
School of Engineering, University of Central Oklahoma, Edmond, OK 73034, USA
*
Author to whom correspondence should be addressed.
ChemEngineering 2025, 9(2), 37; https://doi.org/10.3390/chemengineering9020037
Submission received: 12 February 2025 / Revised: 10 March 2025 / Accepted: 28 March 2025 / Published: 31 March 2025

Abstract

A key role of drilling optimization is reducing the cost and non-productive time (NPT) for drilling operations. The rate of penetration (ROP) directly affects the overall cost and cost per foot of drilling operations and could lead to significant cost savings or expenses. Traditionally, empirical ROP modeling is used to predict bit response or estimate ROP using nearby offset data. Due to the complexity and nonlinearity of ROP, data-driven modeling, such as machine learning (ML), became more attractive. The objective of this paper is to develop an ROP data-driven artificial neural network (ANN) model using drilling and formation data collected from three nearby wells. Additionally, drilling optimization was conducted and compared with traditional empirical ROP models. The advantages and disadvantages of both methods are discussed, and the direction of future data-driven modeling is highlighted. The data-driven ANN model demonstrated strong performance when compared to the field data. The ANN model showed an RMSE and R2 of 3.89 m/h and 0.93 for the training data and an RMSE and R2 of 4.16 m/h and 0.92 for the testing dataset. The sensitivity analysis showed that the ANN model predicted higher ROP than the empirical models in the selected interval. Due to the limited bit wear data compared to the operational parameters, coupled simultaneous data-driven and empirical modeling is believed to be the future direction for data-driven drilling optimization.

1. Introduction

Drilling is fundamental to subsurface energy extraction but presents challenges due to its high investment cost. Many attributes contribute to the cost of drilling, including daily rig costs and time spent on non-productive time (NPT). Drilling optimization aims to drill a well efficiently and economically by identifying sources of drilling inefficiencies and ways to improve the overall rate of penetration (ROP) without jeopardizing safety and well operation. This process involves minimizing NPT and selecting the appropriate drilling parameters to achieve the lowest drilling cost [1,2,3]. NPT can be reduced by identifying inefficient operational events during drilling, such as wellbore instability, drill bit failures, and drillstring failures. Another important aspect of drilling optimization is the appropriate selection of drilling parameters [4,5], such as weight on bit (WOB), rotary speed (RPM), and flow rate (FR), that will maximize ROP without excessively wearing or damaging the bit before reaching the target depth (TD).
Over the past decades, many models have been derived to predict ROP due to its importance in optimizing the drilling process. Warren [6] derived a two-term ROP model for roller cone bits, which showed ROP dependence upon WOB, RPM, bit size, and rock strength. Motahhari et al. [7] developed an empirical ROP model incorporating bit design, mud properties, and lithology. Their model depended on the interaction between a single polycrystalline diamond compact (PDC) cutter and a rock. Using a similar approach, Kerkar et al. [8] developed a different ROP model for PDC bits. Akhtarmanesh et al. [9] developed an ROP model for PDC bits, including a non-linear correlation and linear ROP response to WOB for geothermal hard rocks. These models have shown good accuracy in predicting ROP for several offset wells if the lithology is well defined. Conversely, when there is no adequate knowledge about lithology, these models fail to predict ROP accurately [10,11].
Other empirical ROP models include the effect of drilling vibration on the ROP prediction. In such models, the drilling parameters are adjusted to achieve a higher ROP while ensuring the adjusted operational parameters do not induce excessive drillstring vibration to avoid failure during the bit run [12,13,14]. Several ROP models incorporated a wellbore trajectory design to predict and optimize ROP in directional wells [15].
In recent years, data-driven ROP models have been developed by incorporating machine learning [16], artificial neural networks (ANNs) [17,18], and support vector regression (SVR) [19] to correlate between the operational parameters and ROP. Random forest regression and ANN were used to model ROP using operational parameters such as flow rate, torque, WOB, RPM, and formation data, such as unconfined compressive strength (UCS), as inputs [20,21]. Ahmed et al. [18] further included drilling fluid properties in their ANN model to predict ROP in shale formations, while Abbas et al. [22] predicted ROP using ANN for highly deviated wells. Abbas et al. [23] used ANN coupled with genetic algorithms to optimize drill bit selection based on ROP prediction. The bit types and the optimum drilling parameters were successfully predicted with correlation coefficients of 0.96 and 0.86 for the predicted bit types and optimum drilling parameters. Using ANN with laboratory data, Koulidis and Ahmed [24] developed an ROP prediction model by incorporating drillstring vibration and cutter forces acting on a PDC bit. Their work found that the ANN model’s absolute error decreases by considering data measured at the cutter. However, obtaining data at the cutter while drilling in the field is impossible with today’s technology.
The number of input parameters used in data-driven models significantly affects the model accuracy, where different input parameters, ranging from 3 up to 18, have been reported [25]. The commonly used input parameters in the literature are WOB, RPM, depth, flow rate, mud weight, bit diameter, bit wear, and rock strength [26]. Several models used torque as an input parameter [18,22,27,28], wellbore inclination and azimuth [22], or bit type and mud properties [22].
Barbosa et al. [26] performed an extensive review of machine learning methods that have been applied for ROP prediction and drilling optimization, and it was reported that 55% of data-driven models were performed using ANN. Out of the reviewed data-driven ROP models, only 33% compared their models to traditional physical-based modeling. Most comparison work indicated that data-driven modeling yielded more accurate ROP prediction than traditional models [17,29]. It is worth mentioning that some empirical models, such as Bourgoyn et al. [30] and Warren [31], require the prediction of several lithologies and bit interaction constants that could significantly impact the ROP prediction. In contrast, Rahimzadeh et al. [32] concluded that no clear accuracy comparison between the physics-based and data-driven models can be established.
The main objective of ROP predictions is to optimize the drilling by optimizing the selection of operational parameters, drill bit, and bottom hole assembly. However, most published work focused only on predicting ROP rather than optimizing the drilling processes, where only a fraction addressed the optimization process [26]. For instance, Hegde et al. [33] used ANN to optimize the drilling operating window considering ROP, drilling vibrations, and mechanical specific energy (MSE). ANN has also been applied to other aspects of drilling optimization, such as stuck pipe prediction [34] and cuttings transport [35]. These applications address non-productive time and use ROP as an input.
This paper aims to develop an ROP data-driven ANN model using data from three nearby wells in Southern Iraq. Drilling optimization was performed using the developed ANN model and traditional empirical models, and a sensitivity analysis of both was performed. The advantages and limitations of each approach are discussed, and future directions for data-driven modeling are highlighted.

2. Model Construction

Preparing the drilling database is challenging and time-consuming, where data quality significantly impacts model performance and accuracy. In ANN modeling, more complex models require larger datasets to learn effectively and generate realistic predictions. A total of 17,282 data points were collected from daily drilling reports, daily mud reports, final well reports, and master mud logs from three wells drilled in Southern Iraq. The dataset consisted of different bit types, i.e., roller-cone and PDC, and bit sizes ranging from 311.2 mm to 444.5 mm (12 ¼″ to 17 ½″). The variables that were considered are listed in Table 1, which shows each variable’s abbreviation, unit, and range. For the ANN modeling, each lithology was assigned a number from 1 to 7 with the following sequence: sand (1), sandstone (2), shale (3), marl (4), limestone (5), dolomite (6), anhydrite (7). A lithology scale factor (Lsc) was computed for each depth using a linear scale that considered the formation percentage for each depth. For instance, a lithology scale factor (Lsc) for a 100% shale formation is 3, and an Lsc of 5.55 represents 75% dolomite and 15% anhydrite. The three-digit IADC code is used for the bit type without including the bit feature characters.

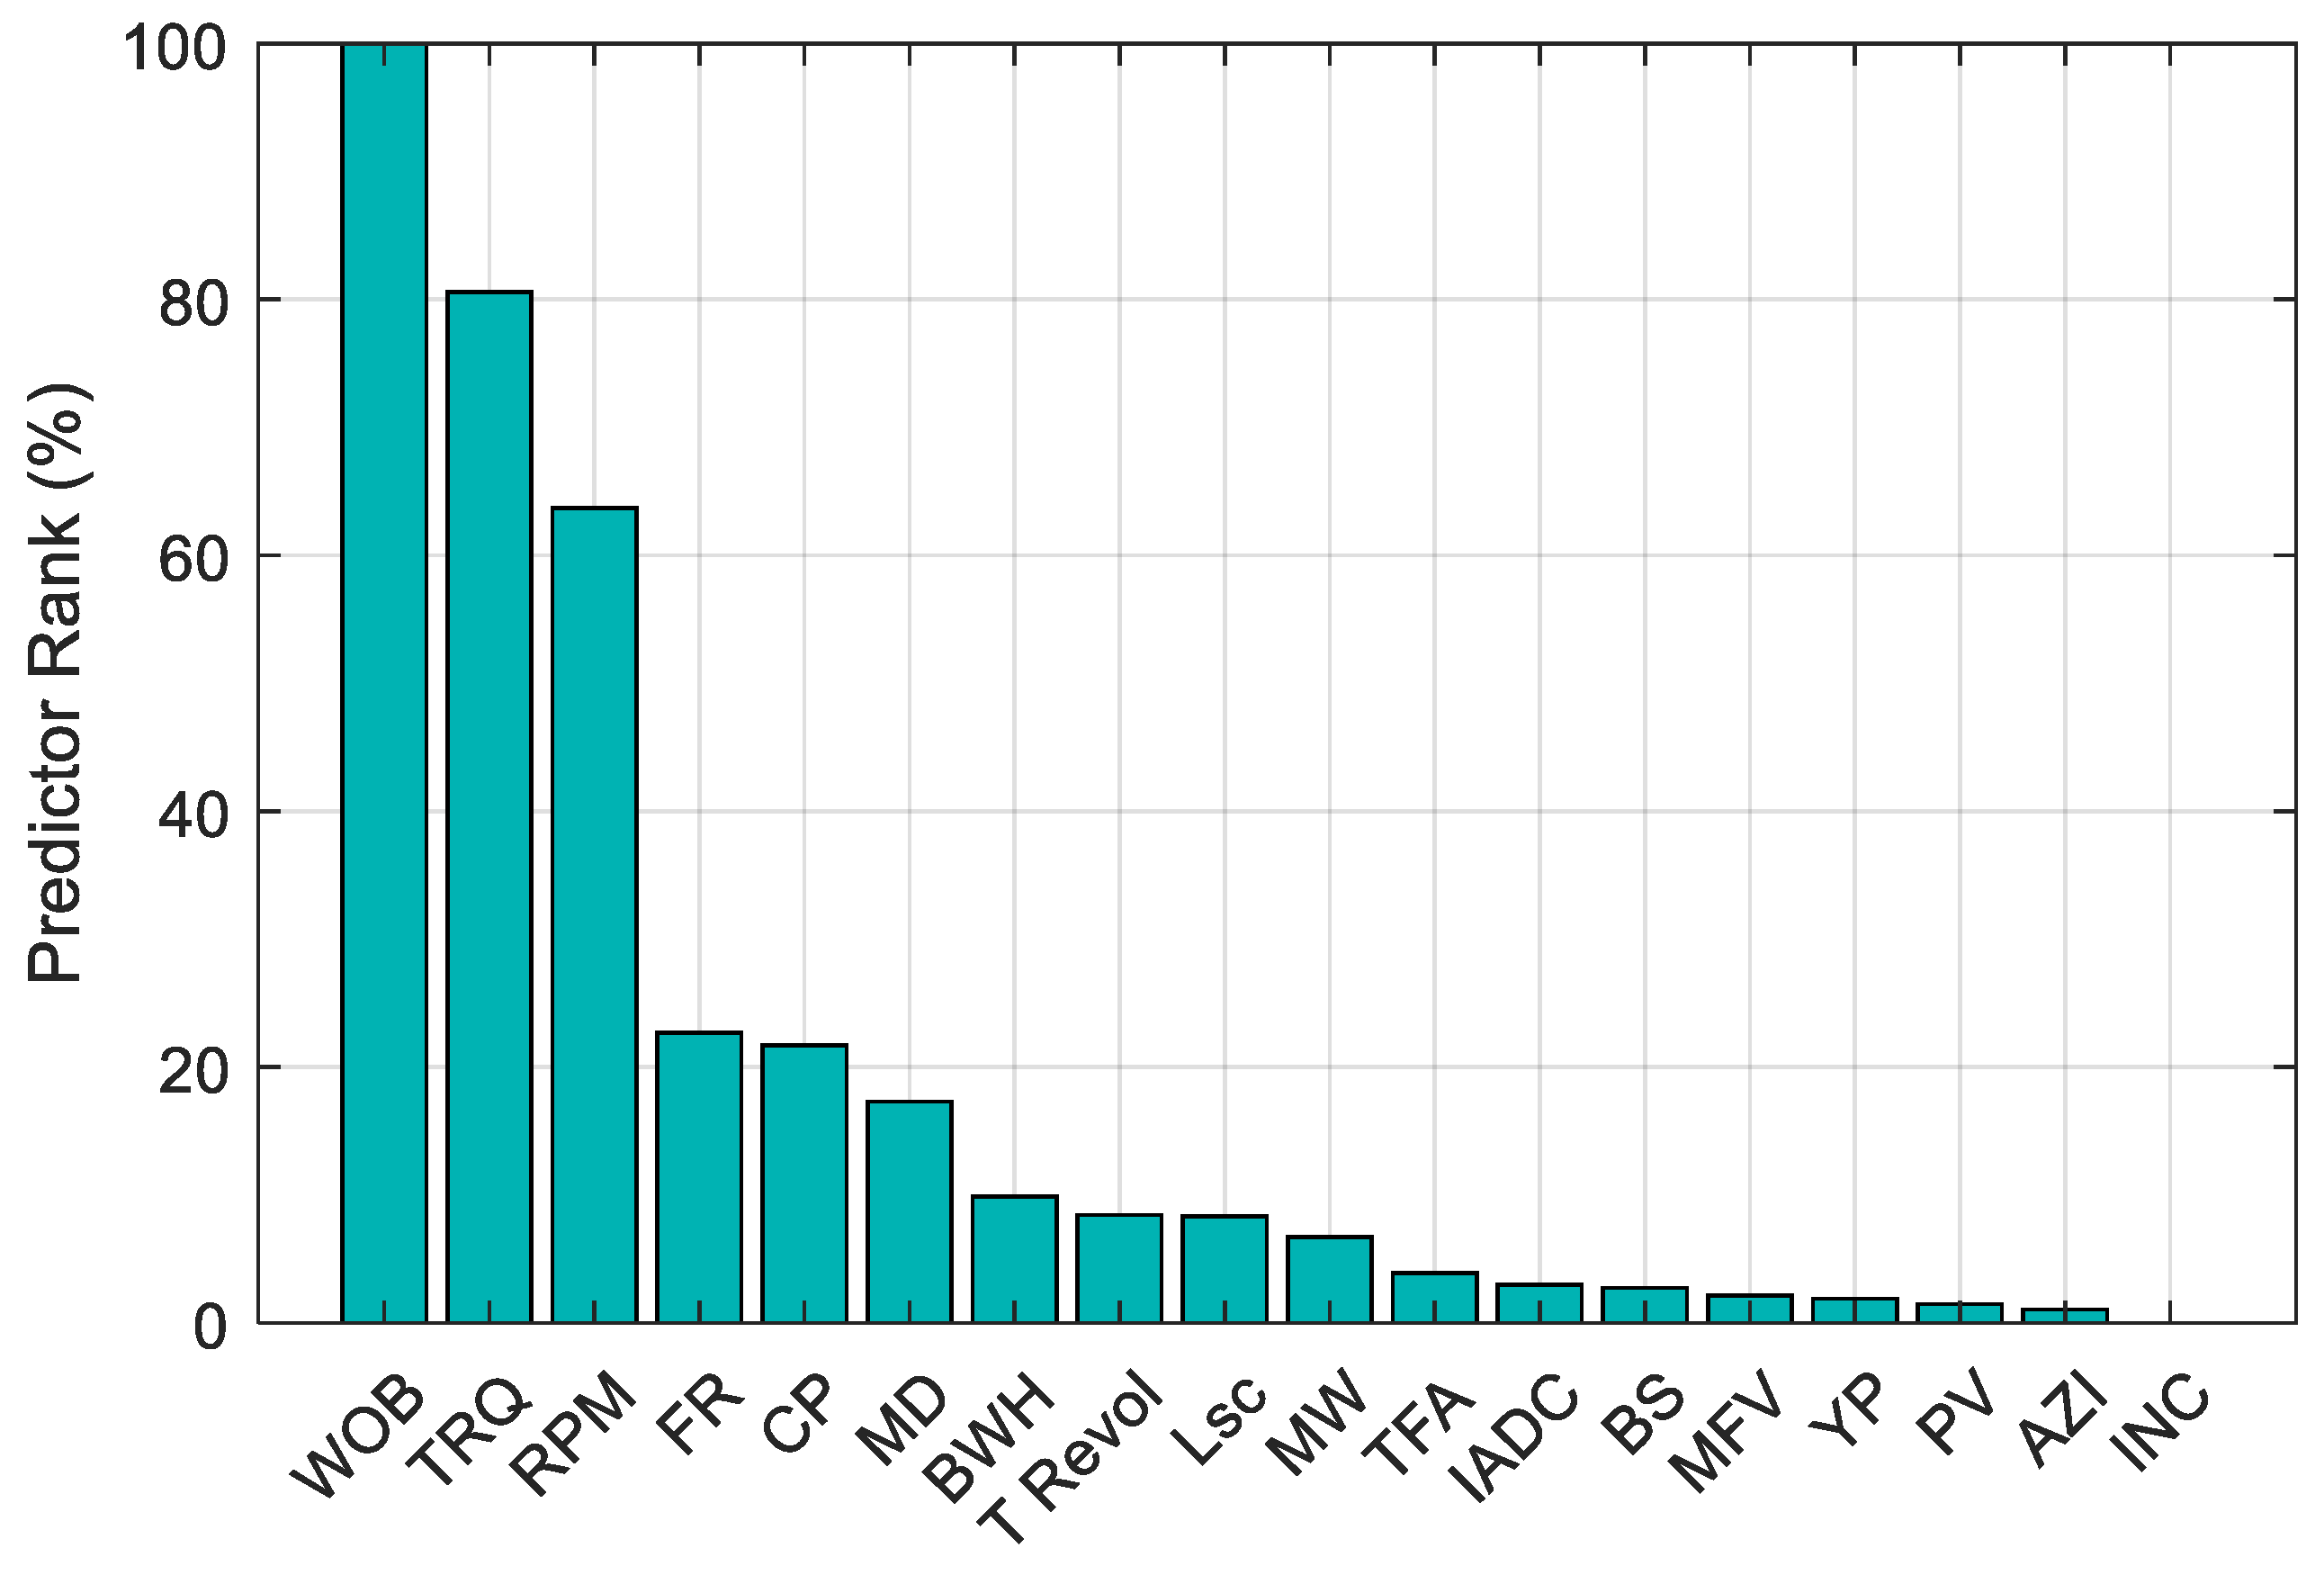
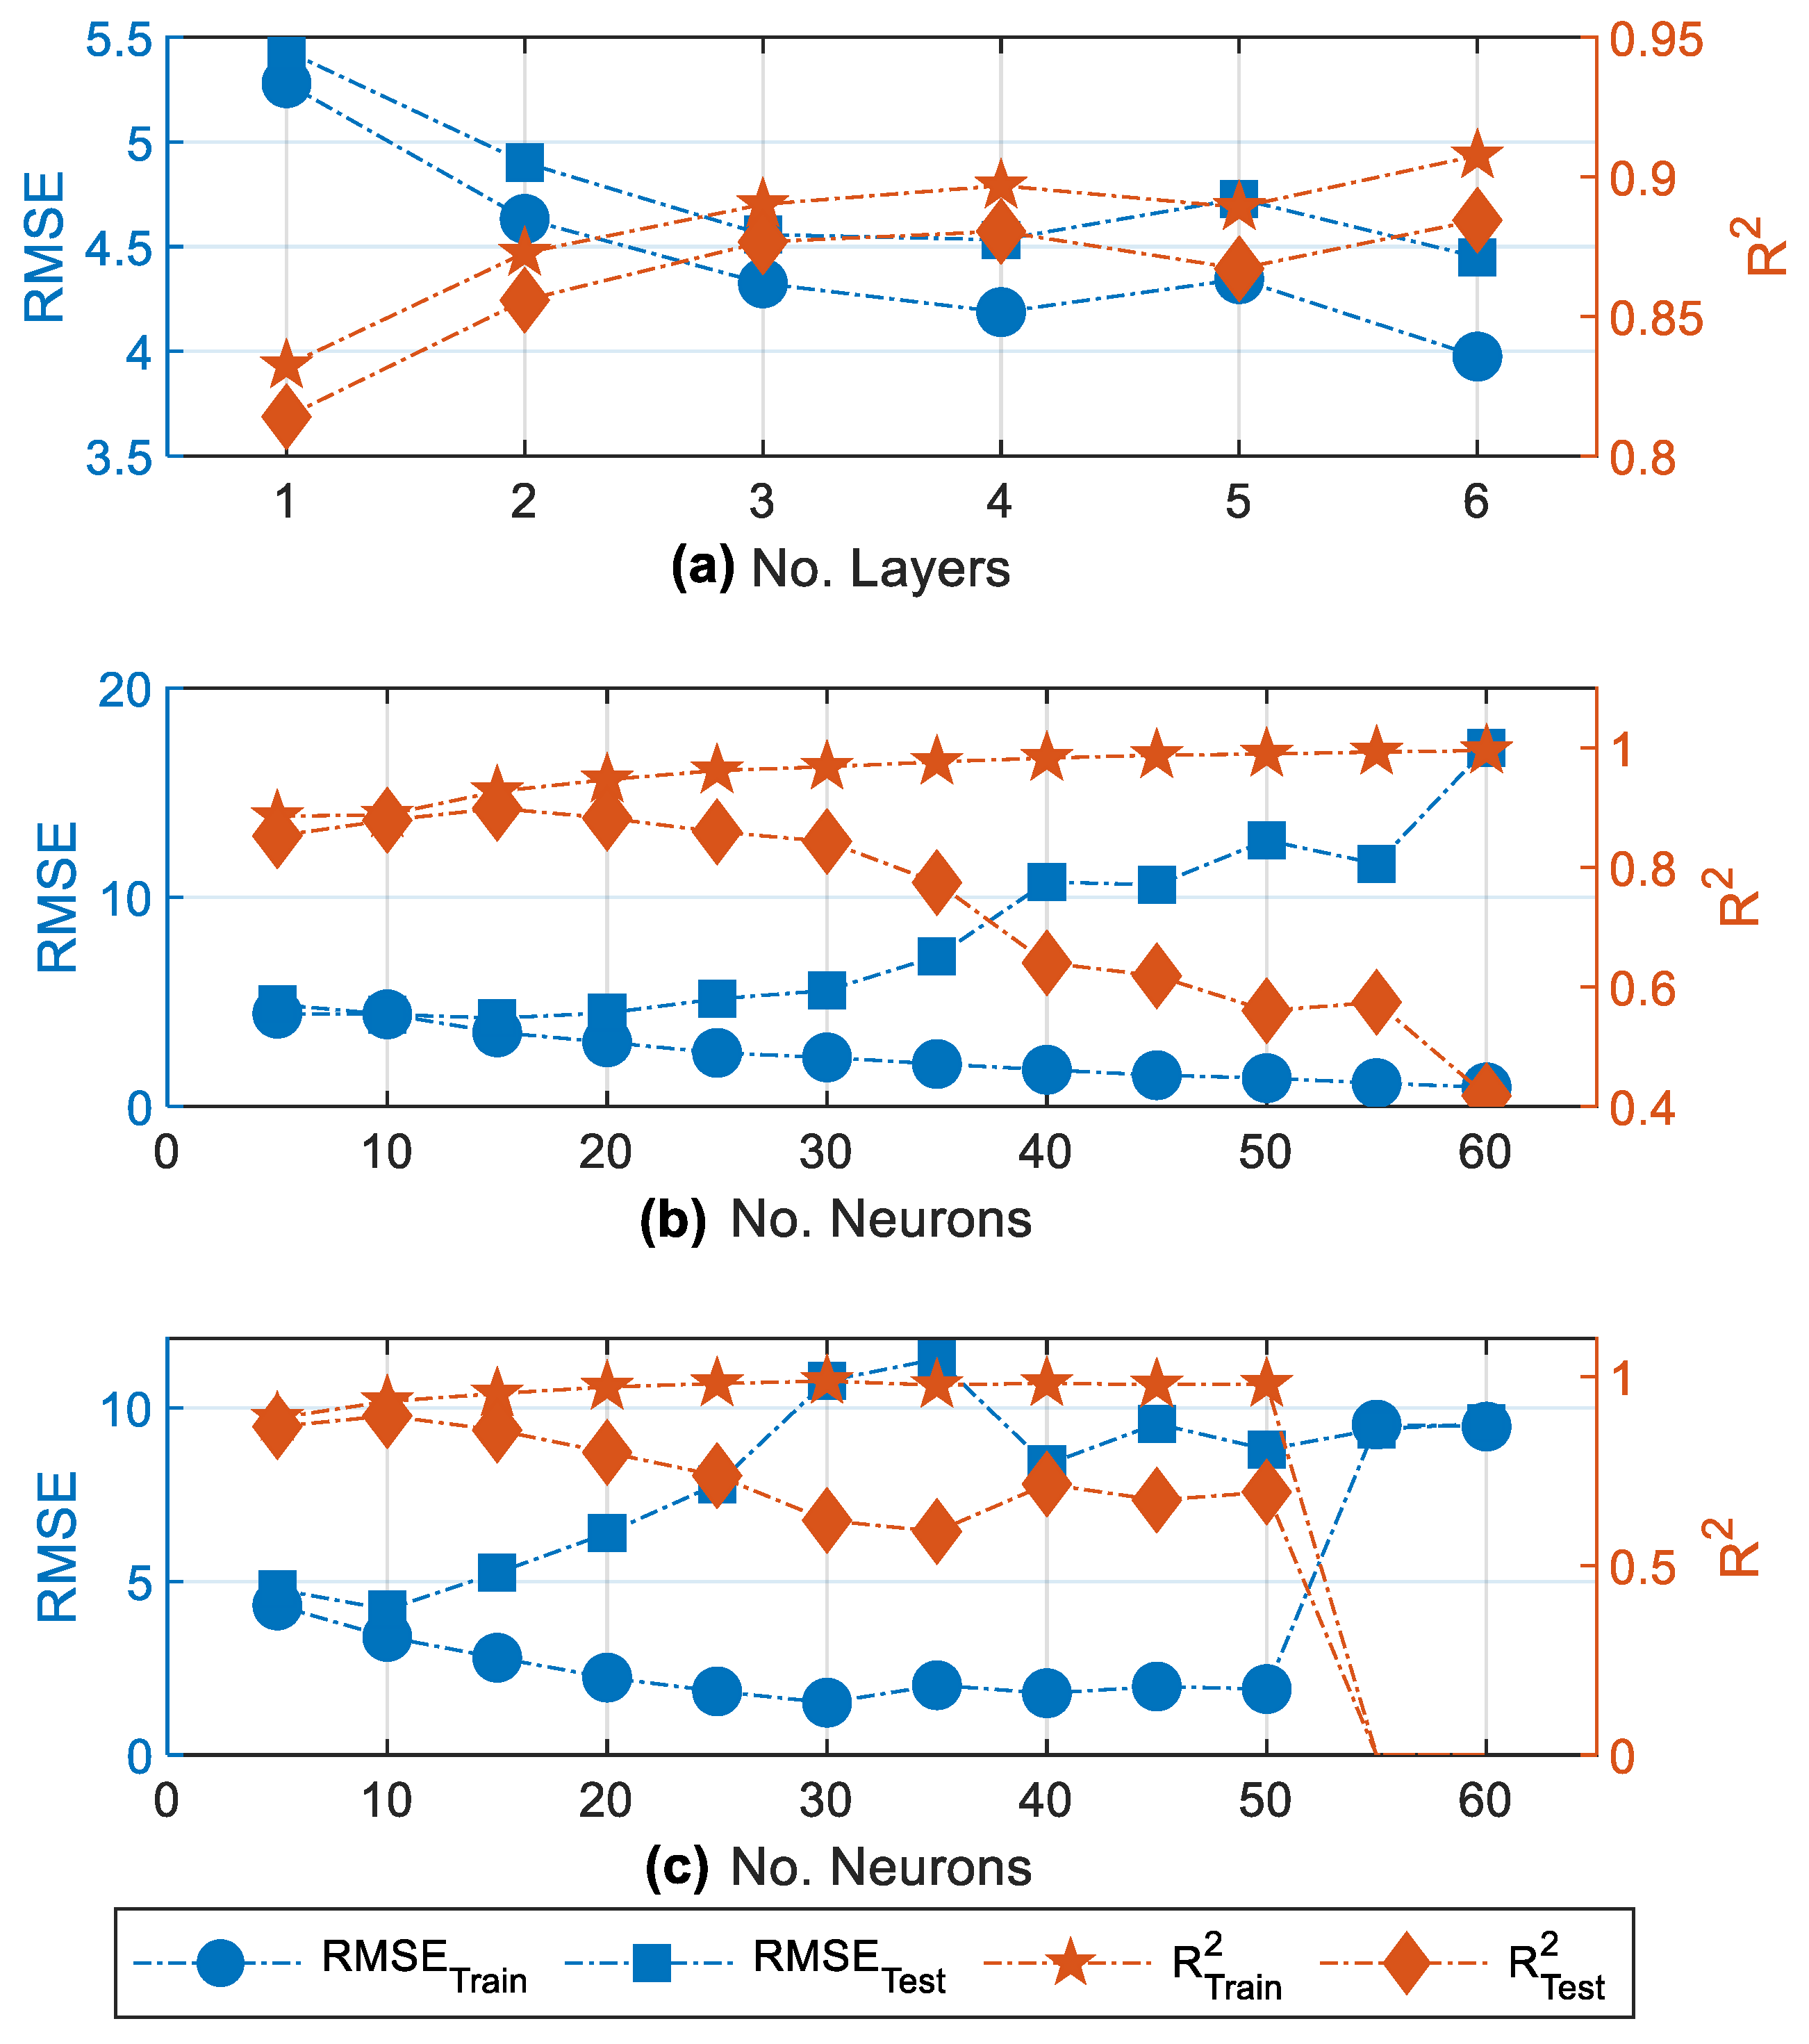
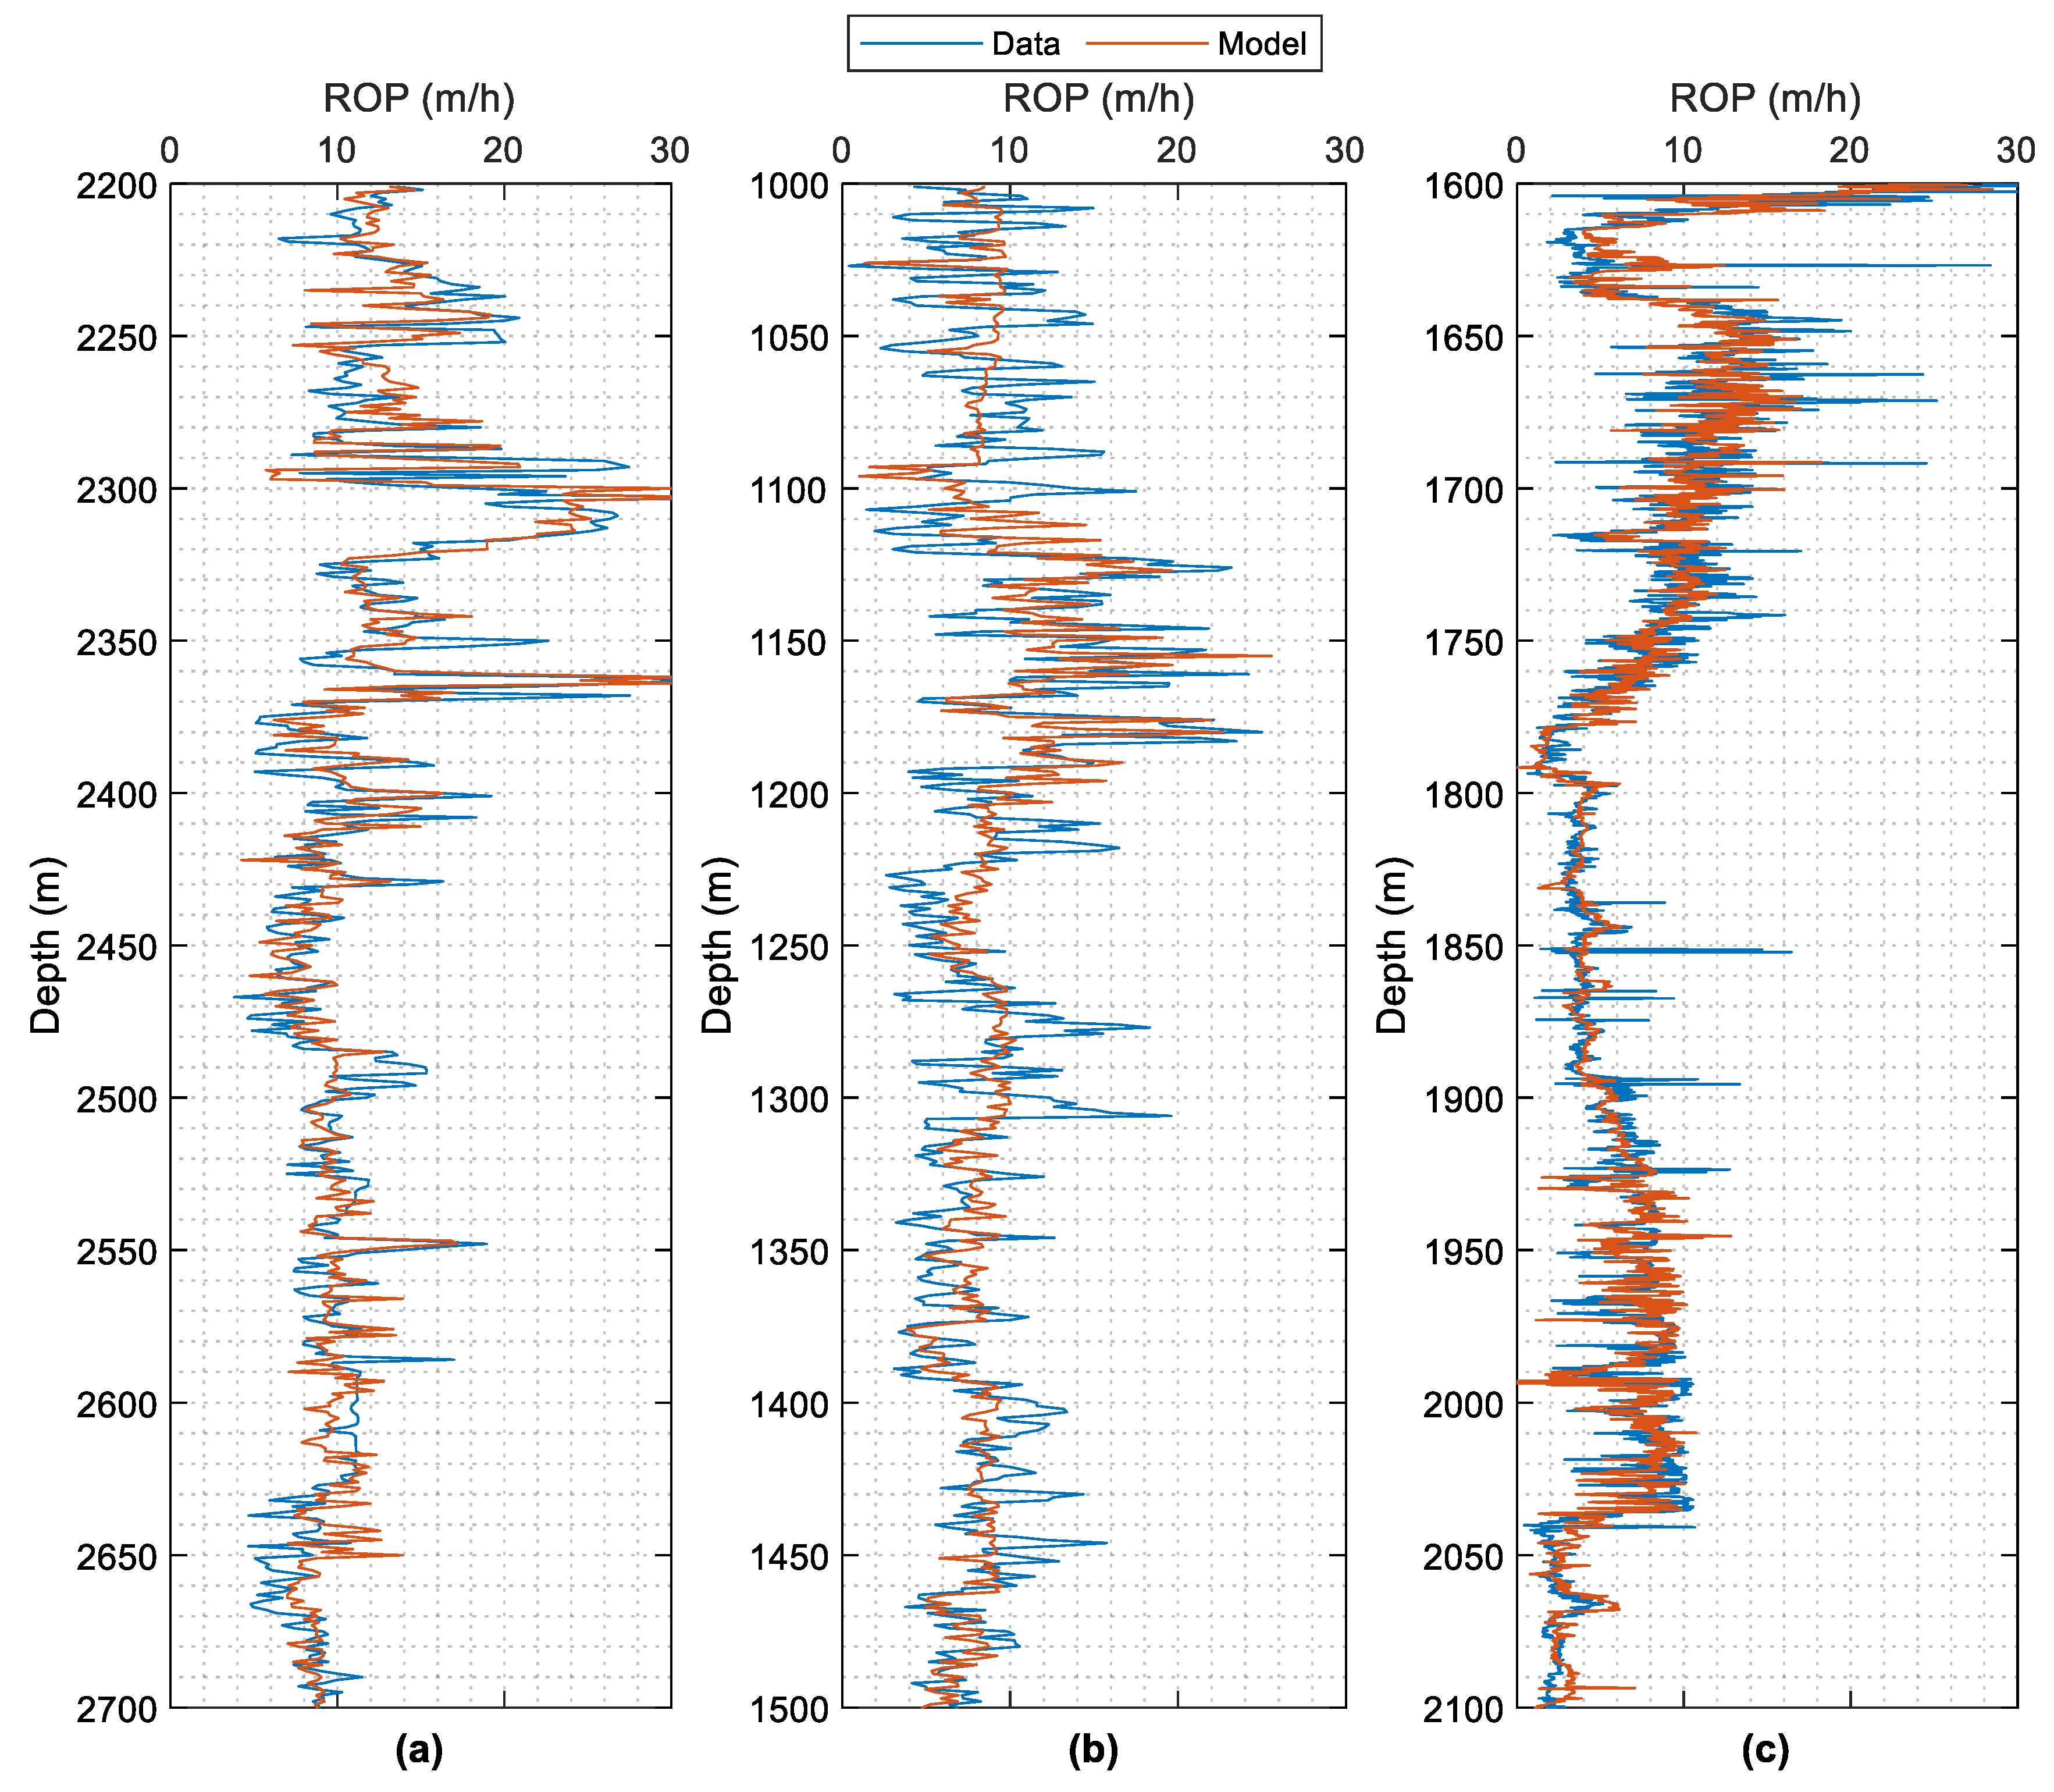
2.1. Data-Driven ANN Modeling

An artificial neural network with feedforward backpropagation was selected to model the ROP of the dataset due to its ability to predict highly complex nonlinear trends in data [17,22]. In the pre-processing stage, the data were normalized with the TANSIG transfer function, where the input and output data ranged from −1 to +1 using Equation (1).
X i = 2 X X m i n X m a x X m i n 1
X i represents the normalized value; X is the original value; X m i n is the original minima value; and X m a x is the original maxima value.
The Relief algorithm [36] was used for feature ranking and to assess the significance of the input parameters affecting the ROP response. The 18 variables in Table 1 are set as the predictor variables and the ROP as the response. Figure 1 shows the predictor’s weights converted to percentages. The results demonstrate that the drilling energy parameters, i.e., WOB, TRQ, RPM, and FR, significantly contribute to ROP prediction, which aligns with the literature. Wellbore inclination showed the least contribution, which is expected for vertical wells, where the maximum wellbore inclination of the dataset was 13.28°.
From the feature ranking analysis, the wellbore inclination was removed from the dataset when constructing the ANN model. Based on the previous work [22], the Bayesian regularization backpropagation training function was selected. The TANSIG and PURELIN transfer functions were used for the input and output layers, respectively. The dataset was divided randomly into 80% for training and 20% for testing and validation. The ANN model performance is measured based on the root mean square error (RMSE) and the correlation coefficient (R2), where a low RMSE and high R2 for the testing and training datasets indicate high performance.
As a starting point of the network architecture design, several hidden layers with different numbers of neurons were tested. Figure 2 summarizes the network’s performance with the RMSE value on the left y-axis and the R2 on the right y-axis. Figure 2a shows varying hidden layer sizes using five neurons per layer. Figure 2b shows the performance of changing the number of neurons using three hidden layers, and Figure 2c shows the performance of varying the number of neurons using four hidden layers.
Based on Figure 2a, an architecture of three to four layers showed the best performance in the testing and validation sets. With a three-layer architecture, the number of neurons varied from 5 to 60 (Figure 2b), where 60 neurons provided the lowest RMSE for the training set but the highest RMSE for the testing set. Based on Figure 2b, 15 neurons performed best with RMSEs of 3.5 and 4.2 m/h, with a corresponding R2 of 0.93 and 0.89 for the training and testing sets, respectively. The best performance for the four hidden layer architectures (Figure 2c) was with ten neurons, which performed similarly to the three-layer architecture.
The sensitivity analysis showed that four hidden layers with nine neurons in the first layer and eleven neurons in the other three layers yielded the best performance for ROP with RMSEs of 3.89 and 4.16 m/h and 0.93 and 0.92 R2 for the training and testing sets, respectively. A cross plot of the predicted versus the actual ROP for the developed model is shown in Figure 3 for (a) the training and (b) the testing datasets, while the error distribution of the model is shown in Figure 4 for both datasets. The error distribution indicates that 86% of the predicted ROP have errors in the range of ±5 at the training phase (Figure 4a), while 84% of the predicted ROP have an error in the range of ±5 in the testing phase (Figure 4b). Given the multiple uncertainties in ROP and several key aspect parameters, i.e., bit design, including cutter sizes and the number of blades for PDC bits, the ANN model shows acceptable results compared to the field data.
Several simulations using the ANN model were performed using the collected dataset for different sections of the wells with various sizes. Figure 5 shows the measured ROP versus the predicted ROP using the ANN model for (a) Well A with a 311.2 mm (12 ¼″) drill bit; (b) Well B with a 406.4 mm (16″) drill bit; and (c) Well C with a 444.5 mm (17 ½″) drill bit. Overall, the predicted ROP matched the measured ROP. Out of the three well sections, Well B exhibited the largest deviation between the measured and predicted ROPs. The deviation in Well B is due to the dataset consisting of two different bit runs, in which one had a small dataset of 500 data points. The limited number of data points reduced the model accuracy for Well B compared to the other wells with over 700 data points.

2.2. Empirical ROP Model

Several models have been proposed to estimate the ROP, some generic and some more specific to a particular bit type, i.e., roller-cone or PDC bits. Hareland and Nygaard [37] modified Warren’s [31] ROP model for roller-cone bits to include imperfect cleaning, the chip hold-down effect, and bit wear. Hareland and Nygaard’s [37] model was adopted in this work for roller-cone bits, which is summarized in Equations (2)–(6).
R O P = W f f c P e a S 2 d b 3 N W 2 + b N d b + c d b γ f μ F j m 1
f c P e = c c + a c P e 120 b c
P e = P m P p
W f = 1 B G 8
B G = W c i = 1 n N i . W i . A b r i . S i
where ROP is the rate of penetration with a, b, and c being bit constants, Wf is the dimensionless bit wear effect, fc (Pe) is the dimensionless chip hold down effect, S is the confined compressive strength, db is the bit diameter, N is the rotary speed, W is the weight on the bit, γ f is the fluid specific gravity, ac, bc, cc are the chip hold down coefficients, μ is the mud plastic viscosity, Fjm is the modified jet impact force, Pe is the differential pressure, Pm is the mud pressure, Pp is the pore pressure, ΔBG is the change in bit tooth wear, Wc is the bit wear coefficient, and A b r i is the relative abrasiveness of the rock. The confined compressive strength is calculated using Equation (7).
S i = S o 1 + a s P e b s
where So is the unconfined compressive strength, and as and bs are the compressive strength coefficients.
The ROP relationship with drilling parameters and a bit design developed by Hareland and Rampersad [38], as shown in Equation (8), is adopted for PDC bits.
R O P = W f 14.14 × N C × N × A v d b × a N b × W c
where Nc is the number of primary cutters, Av is the area of rock compressed ahead of a cutter, and a is the function of the PDC bit design. a, b, and c are the cutter geometry correction factors.
Rock strength is an important parameter to obtain when implementing the ROP models for all the bit designs. This is achieved by inversing Equation (2) for the roller-cone model and Equation (8) for the PDC model and solving for rock strength using the measured ROP data.

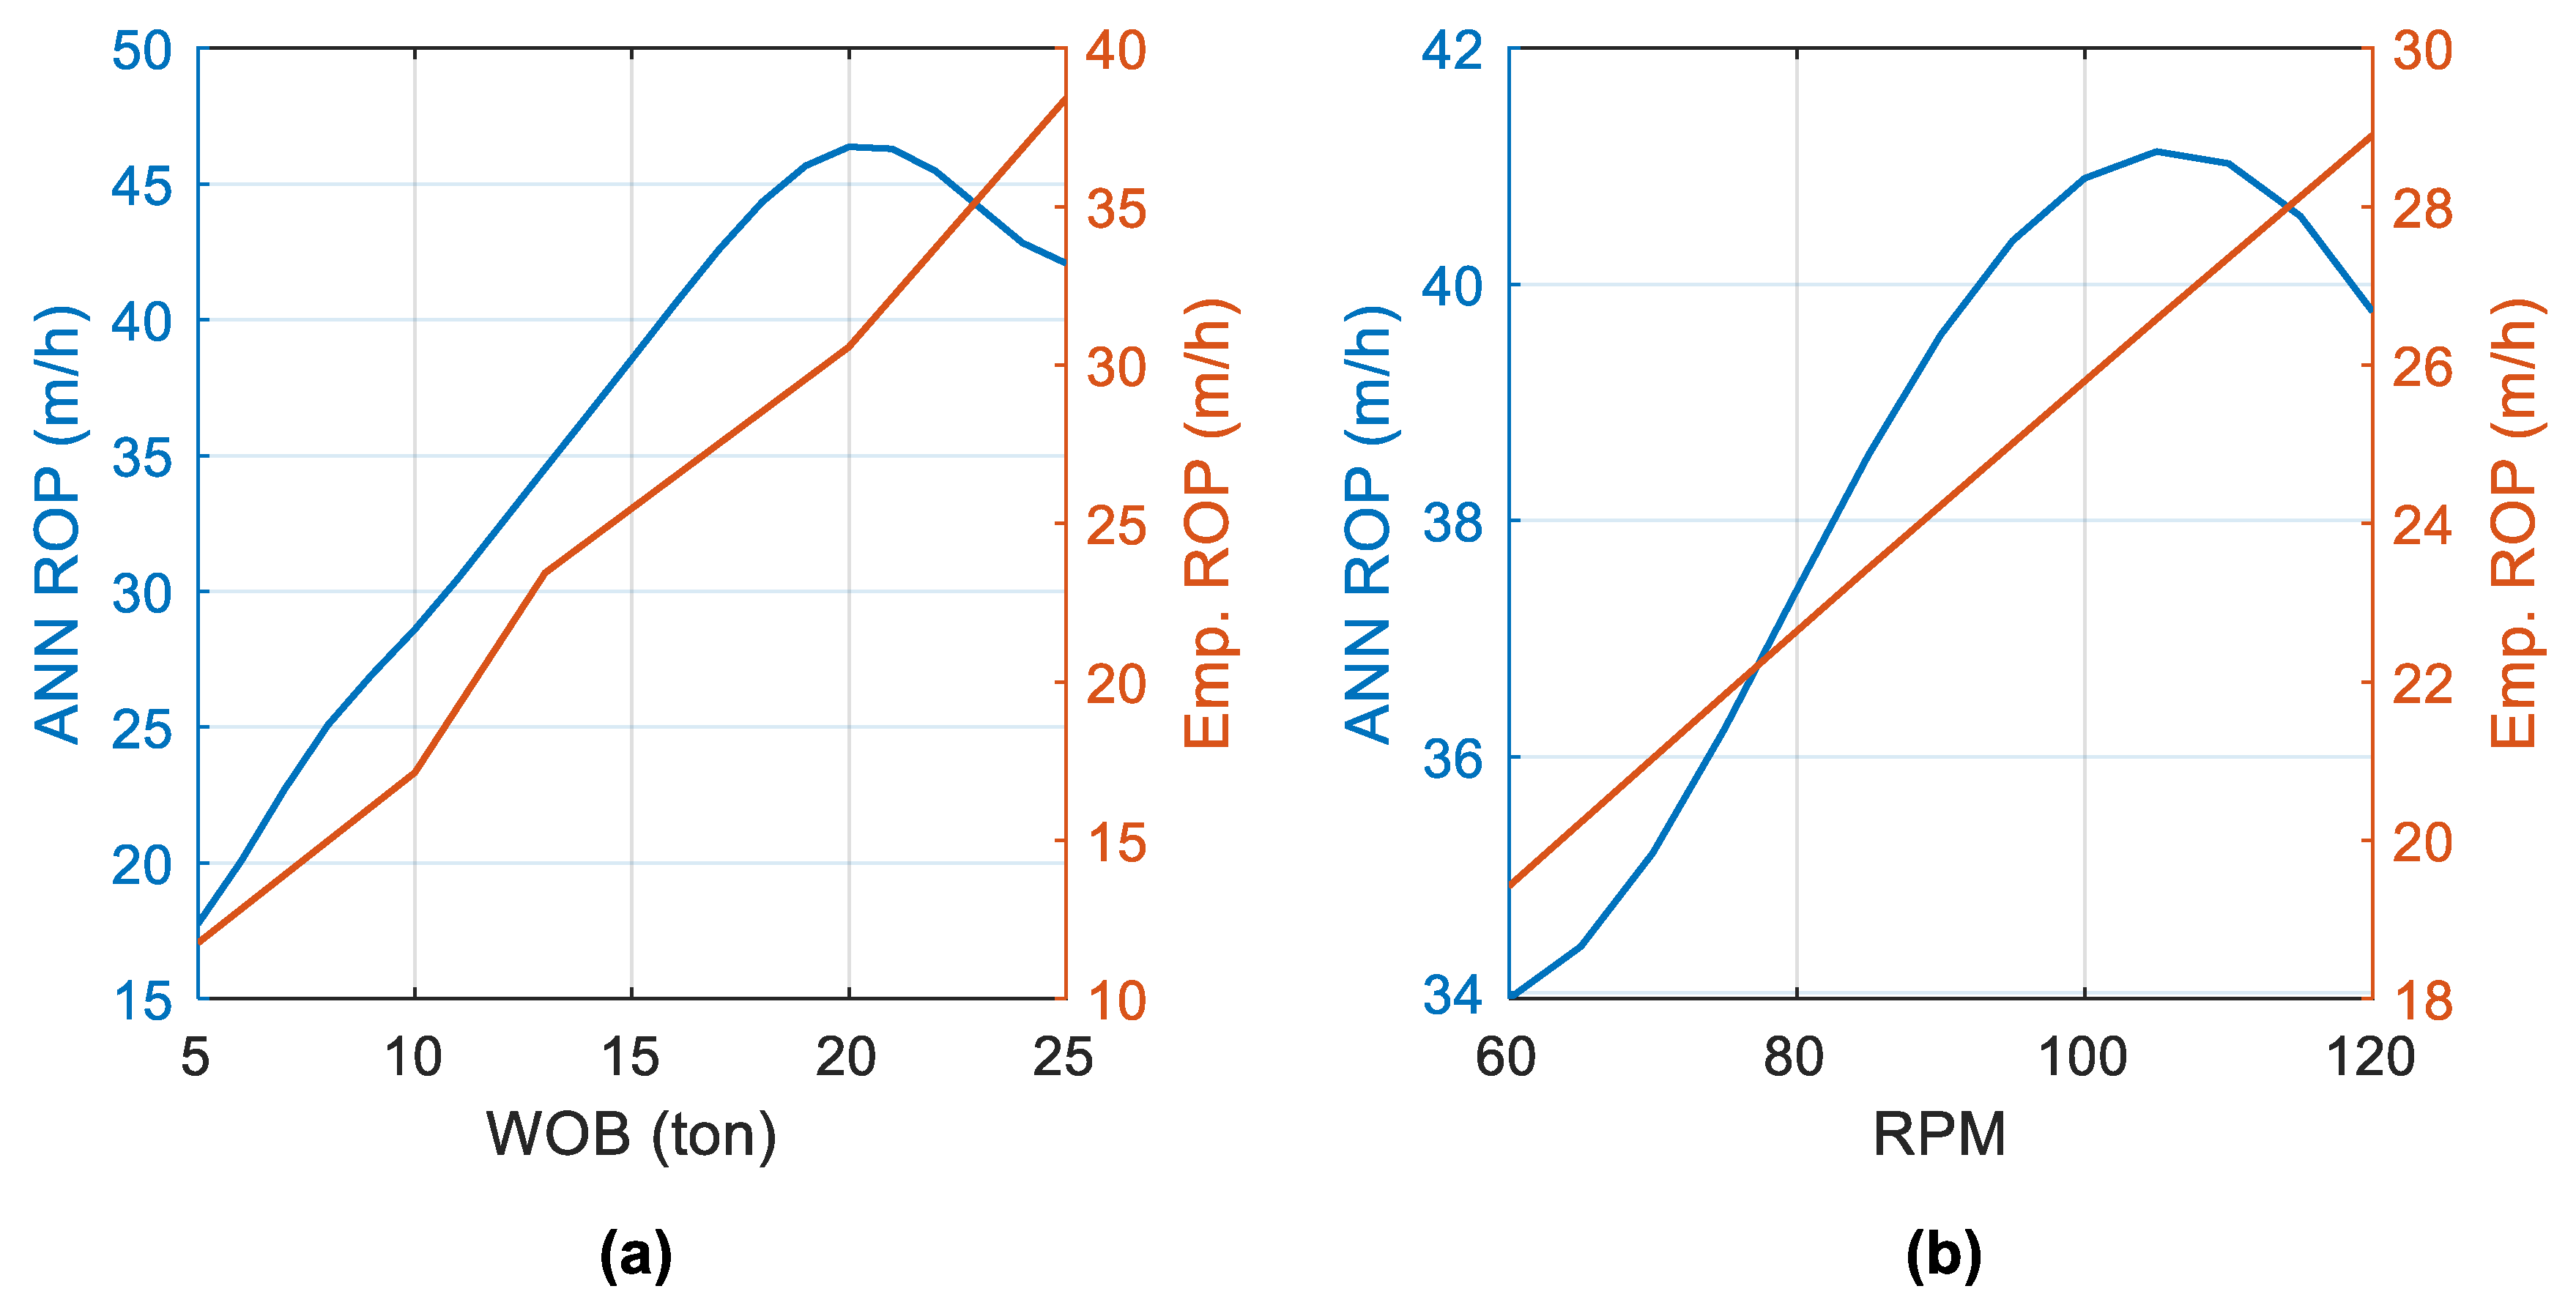
3. Sensitivity Analysis and Optimization

The effect of WOB and RPM on ROP prediction using both the ANN and the empirical ROP models was investigated by varying the WOB and RPM in both models. Table 2 shows the base case parameters of the sensitivity analysis, where WOB and RPM varied from 5 to 25 tons and 60 to 120 RPM, respectively. The input parameters were selected from the Well A dataset in the dolomite formation.
Figure 6 shows the ROP response of the ANN and the empirical model due to (a) varying the WOB and (b) varying the applied rotational speed. The ANN model showed a higher ROP response than the empirical model for varying WOB and RPM. In addition, the ANN model showed that increasing the applied WOB increases ROP up to a certain WOB threshold, i.e., the founder point, where ROP decreases with a further WOB increase. Similar behavior can be seen when increasing the RPM with the ANN model. However, a linear relationship with increasing WOB and RPM was observed for the empirical model without noticing the founder point. This is because the sensitivity analysis was performed in a 1 m section where the empirical model cannot capture the actual effect of each drilling parameter. A sensitivity analysis of a 12 m long section with a roller cone bit, which is the same bit used in Table 2, is shown in Figure 7, where the founder point is more noticeable for RPM than for the WOB effect. It can also be seen that the hydraulics impact, i.e., nozzle sizes, significantly affect ROP using roller cone bits.
Drilling optimization was applied using the empirical model to the intermediate section of Well B with a bit size of 311.2 mm (12 ¼″), which was drilled using six different bit runs to reach the target depth. Table 3 summarizes each bit run, including the actual IADC bit wear and the calculated cost per meter for each section. All of the listed bit runs were pulled out of the hole due to poor performance, making it an ideal candidate for optimization. The listed bit cost is assumed for this study and represents the rental cost without considering any damage to the drill bit body, which will increase the bit cost dramatically. Bit runs 4 and 5 were the most expensive due to the slow drilling rate and short drilled footage.
It can be observed from Table 3 that the roller cone bits exhibited a higher IADC wear rate compared to the PDC bits. In addition to the change in lithology between the roller cone and PDC bits, the roller cone bit exhibits higher WOB and lower rotational speed than the PDC bits, increasing its total IADC wear. In the optimization process, the goal is to select drill bits and operational parameters that would yield the lowest cost per meter. As a safety factor, the bit IADC wear limit was set to 4 to avoid damaging the bit body due to drilling uncertainties. The simulation that produced the lowest cost used three PDC bit runs for the entire section. The optimized program is summarized in Table 4, where the average ROP for the first bit run is 11.2 m/h, the second bit run is 12.8 m/h, and the third bit run is 12.7 m/h. Compared to the actual field data with six bit runs, the optimized program could save approximately 160 h in drilling time by selecting the optimum bit design to drill each section interval.
The optimized operational parameters were used to calculate the ROP using the ANN model for comparison purposes. Figure 8 shows the optimized drilling operational parameters, cumulative bit wear, and the calculated ROP using the empirical and data-driven models. Comparing the ANN model to the empirical ROP model, the ANN model shows a lower ROP than the empirical model.
Drilling optimization using empirical models is widely accepted in the oil and gas industry and has proven effective [39,40,41]. However, drilling optimization using data-driven modeling still requires further development in field operations, mainly due to the limitation of the data range specific to a certain field or bit run. Most data-driven models address ROP predictions rather than utilizing the predictions for optimizations. The input parameters should be carefully selected, specifically when selecting the torque as an input parameter. The torque response varies based on the bit design and the formation being drilled, where it is necessary to include bit design as an input parameter when considering torque as input. Depending on the data noise level, it is possible to include the torque as an output feeding into ROP models. The ANN model showed good performance. However, it is susceptible to the operational parameters and tends to follow the field ROP limit. Parameters are only applicable to specific drill bits and the energy parameters where it is difficult to optimize the drilling process and aid in bit design selection without having a large set of data.
Bit wear in drilling optimization plays a significant role in determining the ability of a specific bit to reach the target depth. One of the significant setbacks in data-driven models is the inability to predict the bit wear. Since the data for bit wear are only available at the end of each bit run, it is difficult to predict the bit wear behavior as a function of drilling or geological parameters using data-driven models. Continuous bit wear measurement technology is unavailable, and empirical models are the only known approach to predicting drill-ahead wear. A coupled simultaneous data-driven and physics-based modeling, i.e., ensemble models, could address this issue, as seen in other applications [42,43].

4. Conclusions

The prediction of the drilling rate of penetration (ROP) using empirical and artificial neural network (ANN) models is presented in this paper. The ANN model was constructed using a four-hidden-layer network with nine neurons in the first layer and eleven neurons in the other three layers. The performance of the ANN ROP model showed an RMSE and R2 of 3.89 m/h and 0.93, respectively, for the training data and an RMSE and R2 of 4.16 m/h and 0.92, respectively, for the testing dataset.
The developed ANN model was compared to the empirical ROP model by performing a sensitivity analysis on the effect of WOB and RPM on the predicted ROP. The sensitivity analysis showed that the ANN model predicts higher ROP than the empirical model in the selected interval. From a drilling optimization point of view, the ANN model can optimize the drilling operation in real time by selecting the optimum operational parameters to achieve higher ROP. However, empirical ROP modeling is more appropriate for planning and post-well analysis due to the ability to predict bit wear status. Data-driven modeling is a powerful tool. However, with the current technologies in bit wear measurements, coupling with empirical models is required for a fully integrated drilling optimization system.

Author Contributions

Conceptualization, M.F.A.D., A.K.A. and M.T.A.S.; methodology, M.F.A.D., A.K.A. and M.T.A.S.; software, M.F.A.D.; validation, M.F.A.D., A.K.A., M.T.A.S. and J.W.; formal analysis, M.F.A.D., A.K.A., M.T.A.S. and J.W.; investigation, M.F.A.D., A.K.A. and M.T.A.S.; writing—original draft preparation, M.F.A.D.; writing—review and editing, M.F.A.D., A.K.A., M.T.A.S. and J.W.; visualization, M.F.A.D., A.K.A., M.T.A.S. and J.W.; supervision, M.F.A.D.; project administration, M.F.A.D. All authors have read and agreed to the published version of the manuscript.

Funding

This research received no external funding.

Data Availability Statement

The data presented in this study are available on request from the corresponding authors.

Acknowledgments

The authors would like to gratefully acknowledge Basrah Oil Company (BOC) and Iraqi Drilling Company (IDC) for providing the technical data and for their permission to publish the results.

Conflicts of Interest

The authors declare no conflicts of interest.

References

  1. Lummus, J.L. Factors to be Considered in Drilling Optimization. J. Can. Pet. Technol. 1969, 8, 138–146. [Google Scholar] [CrossRef]
  2. Staveley, C.; Thow, P. Increasing Drilling Efficiencies Through Improved Collaboration and Analysis of Real-Time and Historical Drilling Data. In Proceedings of the SPE Intelligent Energy Conference and Exhibition, Utrecht, The Netherlands, 23–25 March 2010. [Google Scholar] [CrossRef]
  3. Al Dushaishi, M.; Hellvik, S.; Aladasani, A.; Alsaba, M.; Okasha, Q. Application of Data Analytics to Improve Drilling Performance and Manage Drill Stem Vibrations. In Proceedings of the SPE International Heavy Oil Conference and Exhibition, Kuwait City, Kuwait, 10–12 December 2018. [Google Scholar] [CrossRef]
  4. Atashnezhad, A.; Al Dushaishi, M.F.; Hareland, G. A Graphical User Interface for Hard Rock Drilling Optimization System. In Proceedings of the International Petroleum Technology Conference, Dhahran, Saudi Arabia, 12 February 2024. [Google Scholar] [CrossRef]
  5. Kolmer, H.P.; Cunningham, C.M.; Al-Dushaishi, M.F. ROP Optimization of Lateral Wells in SW Oklahoma: Artificial Neural Network Approach. In Proceedings of the International Conference on Offshore Mechanics and Arctic Engineering, Houston, TX, USA, 20–21 September 2022. [Google Scholar] [CrossRef]
  6. Warren, T.M. Drilling Model for Soft-Formation Bits. J. Pet. Technol. 1981, 33, 963–970. [Google Scholar] [CrossRef]
  7. Motahhari, H.R.; Hareland, G.; James, J.A. Improved drilling efficiency technique using integrated PDM and PDC bit parameters. J. Can. Pet. Technol. 2010, 49, 45–52. [Google Scholar] [CrossRef]
  8. Kerkar, P.B.; Hareland, G.; Fonseca, E.R.; Hackbarth, C.J. Estimation of rock compressive strength using downhole weight-on-bit and drilling models. In Proceedings of the International Petroleum Technology Conference, Doha, Qatar, 19–22 January 2014. [Google Scholar] [CrossRef]
  9. Akhtarmanesh, S.; Atashnezhad, A.; Hareland, G.; Al Dushaishi, M. ROP Model for PDC Bits in Geothermal Drilling. In Proceedings of the 55th U.S. Rock Mechanics/Geomechanics Symposium, Virtual, 20–23 June 2021; p. ARMA-2021-1214. [Google Scholar]
  10. Bataee, M.; Kamyab, M.; Ashena, R. Investigation of various ROP models and optimization of drilling parameters for PDC and roller-cone bits in Shadegan oil field. In Proceedings of the International Oil and Gas Conference and Exhibition in China, Beijing, China, 8–10 June 2010. [Google Scholar] [CrossRef]
  11. Soares, C.; Daigle, H.; Gray, K. Evaluation of PDC bit ROP models and the effect of rock strength on model coefficients. J. Nat. Gas Sci. Eng. 2016, 34, 1225–1236. [Google Scholar] [CrossRef]
  12. Macpherson, J.D.; Mason, J.S.; Kingman, J.E.E. Surface Measurement and Analysis of Drillstring Vibrations While Drilling. In Proceedings of the SPE/IADC Drilling Conference, Amsterdam, The Netherlands, 22–25 February 1993. [Google Scholar] [CrossRef]
  13. Dupriest, F.E.; Koederitz, W.L. Maximizing Drill Rates with Real-Time Surveillance of Mechanical Specific Energy. In Proceedings of the SPE/IADC Drilling Conference, Amsterdam, The Netherlands, 23–25 February 2005. [Google Scholar] [CrossRef]
  14. Al Dushaishi, M.; Nygaard, R.; Andersen, M.; Jeffery, C.; Hellvik, S.; Sassen, A.; Hareland, G. Selecting Optimum Drilling Parameters by Incorporating Vibration and Drilling Efficiency Models. In Proceedings of the IADC/SPE Drilling Conference and Exhibition held in Fort Worth, Fort Worth, TX, USA, 1–3 March 2016. [Google Scholar] [CrossRef]
  15. Wiktorski, E.; Kuznetcov, A.; Sui, D. ROP Optimization and Modeling in Directional Drilling Process. In Proceedings of the SPE Bergen One Day Seminar, Bergen, Norway, 5 April 2017. [Google Scholar] [CrossRef]
  16. Mehrad, M.; Bajolvand, M.; Ramezanzadeh, A.; Neycharan, J.G. Developing a new rigorous drilling rate prediction model using a machine learning technique. J. Pet. Sci. Eng. 2020, 192, 107338. [Google Scholar] [CrossRef]
  17. Elkatatny, S. New approach to optimize the rate of penetration using artificial neural network. Arab. J. Sci. Eng. 2018, 43, 6297–6304. [Google Scholar] [CrossRef]
  18. Ahmed, A.; Ali, A.; Elkatatny, S.; Abdulraheem, A. New artificial neural networks model for predicting rate of penetration in deep shale formation. Sustainability 2019, 11, 6527. [Google Scholar] [CrossRef]
  19. Gan, C.; Cao, W.H.; Liu, K.Z.; Wu, M.; Wang, F.W.; Zhang, S.B. A new hybrid bat algorithm and its application to the ROP optimization in drilling processes. IEEE Trans. Ind. Inform. 2019, 16, 7338–7348. [Google Scholar] [CrossRef]
  20. Aliyev, R.; Paul, D. A Novel Application of Artificial Neural Networks to Predict Rate of Penetration. In Proceedings of the SPE Western Regional Meeting, San Jose, CA, USA, 23–26 April 2019. [Google Scholar] [CrossRef]
  21. Brenjkar, E.; Biniaz Delijani, E.; Karroubi, K. Prediction of penetration rate in drilling operations: A comparative study of three neural network forecast methods. J. Pet. Explor. Prod. 2021, 11, 805–818. [Google Scholar] [CrossRef]
  22. Abbas, A.K.; Rushdi, S.; Alsaba, M.; Al Dushaishi, M.F. Drilling Rate of Penetration Prediction of High-Angled Wells Using Artificial Neural Networks. J. Energy Resour. Technol. 2019, 141, 112904. [Google Scholar] [CrossRef]
  23. Abbas, A.K.; Assi, A.H.; Abbas, H.; Almubarak, H.; Al Saba, M. Drill bit selection optimization based on rate of penetration: Application of artificial neural networks and genetic algorithms. In Proceedings of the International Petroleum Exhibition and Conference, Abu Dhabi, UAE, 11–14 November 2019. [Google Scholar] [CrossRef]
  24. Koulidis, A.; Ahmed, S. Advisory system for drilling optimization using artificial intelligence and in-cutter sensing data. In Proceedings of the SPE Middle East Intelligent Oil and Gas Symposium, Al Khobar, Saudi Arabia, 17–18 January 2023. [Google Scholar] [CrossRef]
  25. Hegde, C.; Daigle, H.; Millwater, H.; Gray, K. Analysis of rate of penetration (ROP) prediction in drilling using physics-based and data-driven models. J. Pet. Sci. Eng. 2017, 159, 295–306. [Google Scholar] [CrossRef]
  26. Barbosa, L.F.F.; Nascimento, A.; Mathias, M.H.; de Carvalho, J.A., Jr. Machine learning methods applied to drilling rate of penetration prediction and optimization-A review. J. Pet. Sci. Eng. 2019, 183, 106332. [Google Scholar] [CrossRef]
  27. Negara, A.; Saad, B. Combining Insight from Physics-Based Models into Data-Driven Model for Predicting Drilling Rate of Penetration. In Proceedings of the International Petroleum Technology Conference, Dhahran, Saudi Arabia, 13–15 January 2020. [Google Scholar] [CrossRef]
  28. Chandrasekaran, S.; Kumar, G.S. Drilling efficiency improvement and rate of penetration optimization by machine learning and data analytics. Int. J. Math. Eng. Manag. Sci. 2020, 5, 381–394. [Google Scholar] [CrossRef]
  29. Soares, C.; Gray, K. Real-time predictive capabilities of analytical and machine learning rate of penetration (ROP) models. J. Pet. Sci. Eng. 2019, 172, 934–959. [Google Scholar] [CrossRef]
  30. Bourgoyn, A.T.; Millhem, K.K.; Chenevert, M.E.; Young, F.S. Applied Drilling Engineering, 9th ed.; SPE Textbook Series; SPE: Richardson, TX, USA, 2003; p. 232. [Google Scholar]
  31. Warren, T.M. Penetration Rate Performance of Roller Cone Bits. SPE Drill. Eng. 1987, 2, 9–18. [Google Scholar] [CrossRef]
  32. Rahimzadeh, H.; Mostofi, M.; Hashemi, A.; Salahshoor, K. Comparison of the penetration rate models using field data for one of the gas fields in Persian Gulf area. In Proceedings of the International Oil and Gas Conference and Exhibition in China, Beijing, China, 8–10 June 2010. [Google Scholar] [CrossRef]
  33. Hegde, C.; Pyrcz, M.; Millwater, H.; Daigle, H.; Gray, K. Fully coupled end-to-end drilling optimization model using machine learning. J. Pet. Sci. Eng. 2020, 186, 106681. [Google Scholar] [CrossRef]
  34. Al Dushaishi, M.F.; Abbas, A.K.; Alsaba, M.; Abbas, H.; Dawood, J. Data-driven stuck pipe prediction and remedies. Upstream Oil Gas Technol. 2021, 6, 100024. [Google Scholar] [CrossRef]
  35. Ozbayoglu, E.; Ozbayoglu, M.; Ozdilli, B.G.; Erge, O. Optimization of flow rate and pipe rotation speed considering effective cuttings transport using data-driven models. Energies 2021, 14, 1484. [Google Scholar] [CrossRef]
  36. Robnik-Šikonja, M.; Kononenko, I. An adaptation of Relief for attribute estimation in regression. In Machine Learning, Proceedings of the Fourteenth International Conference, San Francisco, CA, USA, 8–12 July 1997; Morgan Kaufmann Publishers Inc.: Burlington, MA, USA, 1997; Volume 5, pp. 296–304. [Google Scholar]
  37. Hareland, G.; Nygaard, R. Calculating Unconfined Rock Strength from Drilling Data. In Proceedings of the 1st Canada—U.S. Rock Mechanics Symposium, Vancouver, BC, Canada, 27–31 May 2007; p. ARMA-07-214. [Google Scholar]
  38. Hareland, G.; Rampersad, P.R. Drag-bit model including wear. In Proceedings of the SPE Latin America/Caribbean Petroleum Engineering Conference, Buenos Aires, Argentina, 27–29 April 1994. [Google Scholar] [CrossRef]
  39. Hareland, G.; Motahhari, H.R.; Hayes, J.P.; Qureshi, A. Increased Drilling Efficiency of Gas Storage Wells Proven Using Drilling Simulator. In Proceedings of the CIPC/SPE Gas Technology Symposium 2008 Joint Conference, Calgary, AB, Canada, 16–19 June 2008. [Google Scholar] [CrossRef]
  40. Rastegar, M.; Hareland, G.; Nygaard, R.; Bashari, A. Optimization of multiple bit runs based on ROP models and cost equation: A new methodology applied for one of the Persian Gulf carbonate fields. In Proceedings of the IADC/SPE Asia Pacific Drilling Technology Conference and Exhibition, Jakarta, Indonesia, 25–27 August 2008. [Google Scholar] [CrossRef]
  41. Hankins, D.; Salehi, S.; Karbalaei Saleh, F. An integrated approach for drilling optimization using advanced drilling optimizer. J. Pet. Eng. 2015, 2015, 281276. [Google Scholar] [CrossRef]
  42. Son, M.; Kim, J. Digital transformation of rotary hearth furnace for process automation and CO2 reduction: Hybrid model under limited operational data utilization. J. Manuf. Process. 2023, 101, 784–794. [Google Scholar] [CrossRef]
  43. Kim, J.; Son, M.; Han, S.S.; Yoon, Y.S.; Oh, H. Computational-cost-efficient surrogate model of vacuum pressure swing adsorption for CO separation process optimization. Sep. Purif. Technol. 2022, 300, 121827. [Google Scholar] [CrossRef]
Figure 1. Predictor ranking of the drilling data.
Chemengineering 09 00037 g001
Figure 2. Network architecture performance for (a) a varying hidden layer size; (b) a varying number of neurons with three hidden layers; and (c) a varying number of neurons with four hidden layers.
Chemengineering 09 00037 g002
Figure 3. Actual field ROP versus model ROP for the (a) training set and (b) testing set.
Chemengineering 09 00037 g003
Figure 4. Error distribution of the model for (a) training data and (b) testing data.
Chemengineering 09 00037 g004
Figure 5. Measured ROP versus predicted ROP for (a) Well A with a 311.2 mm (12 ¼″) drill bit; (b) Well B with 406.4 mm (16″) drill bits; and (c) Well C with a 444.5 mm (17 ½″) drill bit.
Chemengineering 09 00037 g005
Figure 6. ROP response of the ANN and empirical models for varying (a) the WOB and (b) the applied rotational speed.
Chemengineering 09 00037 g006
Figure 7. Sensitivity analysis of a 12 m long section with roller cone bit.
Chemengineering 09 00037 g007
Figure 8. Optimized drilling operational parameters using three PDC bit runs.
Chemengineering 09 00037 g008
Table 1. Drilling data parameter ranges and abbreviations.
ParameterMin.Max.
Measure depth (MD) [m]6103370
Bit size (BS) [in]12.2517.5
Bit type (IADC) [-]223527
Total flow area (TFA) [in2]0.453.14
Bit revolution (T Revol) [k Rev]0.061197
Bit working hours (BWH) [h]0.01124
Rate of penetration (ROP) [m/h]0.1375
Weight on bit (WOB) [ton]0.0140
Rotational speed (RPM) [RPM]32207
Torque (TRQ) [kN.m]0.1522.8
Flow rate (FR) [L/min]4253610
Circulating pressure (CP) [psi]4703851
Mud weight (MW) [sg]1.071.28
Marsh funnel viscosity (MFV) [s]4574
Plastic viscosity (PV) [cP]933
Yield point (YP) [g/100 cm2]1029
Inclination (INC) [°]0.0613.28
Azimuth (AZI) [°]27.3344
Lithology factor (Lsc) [-]26.7
Table 2. Base case parameters of the sensitivity analysis.
ParameterValueParameterValue
MD (m)1023FR (L/min)2900
BS (in)17 ½ CP (psi)1467
IADC1415MW (sg)1.08
TFA (in2)0.92MFV (s)55
T Revol (krev)27PV (cp)10
BWH (h)6YP (g/100 cm2)12
WOB (ton)15AZI (°)86
RPM85Lsc (-)6
TRQ (kN·m)19.5
Table 3. Bit run summary of Well B’s intermediate section.
No.BitBit Cost ($)Length
(m)
WOB
(ton)
RPMROP (m/h)Bit WearCost
($/m)
1Roller cone-A400024011924.744.52297
2PDC-A16,0003461702.1116157
3PDC-B19,00085751737.1721374
4Roller cone-B32003014941.06612,368
5Roller cone-C33002413940.86315,333
6Roller cone-D32005214962.2536457
Table 4. Optimized drilling parameters of Well B’s intermediate section.
Bits UsedInterval No.WOB (ton)RPMFR (L/min)Length (m)ROP (m/h)Time (h)Bit Wear
PDC-A1990250015317.328.830.8
21413025008710.378.391.6
3181502700715.9112.012
PDC-A11210025009015.085.970.6
21410525005017.352.880.8
31110025007010.926.411.1
4109525008012.546.381.3
51210026006013.004.621.4
612.5105250021011.1518.832.4
717110260013010.9611.863.0
812100260013011.6811.133.2
PDC-B11210025001910.651.780.3
22520029004811.684.112.5
31518028003915.682.492.8
Disclaimer/Publisher’s Note: The statements, opinions and data contained in all publications are solely those of the individual author(s) and contributor(s) and not of MDPI and/or the editor(s). MDPI and/or the editor(s) disclaim responsibility for any injury to people or property resulting from any ideas, methods, instructions or products referred to in the content.

