1. Introduction
Conventional energy resources, especially fossil fuels, have been a cornerstone of industrial advancement and economic growth. They include oil, coal, and natural gas, which have been instrumental in meeting the global energy demand for more than a century [
1]. However, their continued use harms the environment and accelerates climate change. Fossil fuel combustion releases significant quantities of greenhouse gas emissions (GHGs) such as methane (CH
4), carbon dioxide (CO
2), and nitrous oxide (N
2O), which are the main contributors to the greenhouse effect and, subsequently, to global warming [
2,
3]. To address this challenge, the transition to renewable energy sources is appropriate to mitigate the effect of climate change, combat greenhouse gas emissions, and air pollution, and promote sustainability. The 2050 energy outlook envisions achieving net-zero emissions, which necessitates adopting clean and sustainable energy resources such as biofuels that align with SDG 7 [
4].
Biogas is derived from the microbial decomposition of organic matter, like agricultural residues, food, human waste, biomass, and sewage. As such, biogas is an important renewable energy option with great potential to address the twin challenges of energy sustainability and waste management. The composition of biogas varies based on the type and amount of feedstock utilized. Generally, it contains methane (55–77%), carbon dioxide (30–45%), and minor constituents such as hydrogen sulfide, ammonia, nitrogen, and siloxane compounds [
5]. The concentration of methane indicates the energy value of biogas, while the rest of the components are considered impurities. Biogas has a calorific value ranging from 25 to 30 MJ/m
3, depending on the methane concentration, higher methane content in biogas corresponds to higher energy values [
6].
Hydrogen sulfide in biogas is highly corrosive and can cause severe damage to metal components in biogas systems, such as pipes, valves, and engines. This corrosion can lead to increased maintenance costs, frequent repairs, and the reduced lifespan of equipment. The H
2S is a toxic gas with a characteristic rotten egg smell. High concentrations pose serious health risks, including respiratory problems, headaches, and, in extreme cases, life-threatening conditions [
7]. Proper handling and monitoring are essential to ensure the safety of personnel working with biogas. When biogas containing H
2S is used in internal combustion engines or gas turbines, the H
2S can form sulfuric acid, affecting engine performance and efficiency. This can cause engine fouling, decreased power output, and increased maintenance needs. The presence of H
2S can negatively influence the efficiency of biogas utilization systems, reducing overall energy output and operational effectiveness [
8]. When biogas is burned or processed, H
2S can react with oxygen to form sulfur dioxide (SO
2), which contributes to air pollution and acid rain. This environmental impact necessitates careful management of H
2S levels in biogas, thus upgrading technologies are required. In the process of upgrading biogas, H
2S must be removed to meet quality standards of biomethane for integration into natural gas networks or as fuel for vehicles.
Recently, several biogas desulphurization methods have been developed, including pressure swing adsorption, physical scrubbing, water scrubbing, and membrane separation. However, the application of these techniques in developing economies is limited by high maintenance and operational costs. This is because most current biogas desulphurization technologies are intended for large-scale operations. In contrast, using locally sourced organic materials for the elimination of hydrogen sulfide from biogas offers several advantages, including simplicity in design, ease of handling, and cost-effectiveness. In addition, this makes the technology easy to adapt and use in low-income areas and small-scale applications. Various sorbents, such as soda ash [
7], activated sweet potato leaves [
9], and red rock [
10], have been utilized for biogas upgrading. The purified biogas, or bio-methane, can be transformed into bio-compressed natural gas (Bio-CNG), which facilitates its distribution through natural gas pipelines. The use of bio-compressed natural gas will increase from 2% in 2021 to 27% by 2050 [
11,
12].
Limited research exists on using low-cost materials for biogas purification. The few available studies have been conducted as batch studies, rather than column studies, which reflect practical applications. Our previous work investigated the characterization and use of soda ash collected from Lake Natron for the elimination of H
2S from biogas through batch studies [
7]. The study determined that soda ash with 280 μm particle size, mass of 75 g, and gas flow rate of 0.03 m
3/h gave the best performance. Within 15 min of application, the soda ash demonstrated a high removal efficiency of 94% and a sorption capacity of 0.02 g per 100 g of adsorbent. Given this strong performance, the objective of the present work was to apply existing kinetics of adsorption and breakthrough analysis models to the data from the experiment to determine key column design parameters. Such parameters include absorbent mass, column bed height, and biogas flow rate. They are useful for the design and optimization of biogas desulphurization systems. The adsorption kinetics were analyzed using the pseudo-first order, pseudo-second order, intra-particle diffusion models, and the Elovich model. Breakthrough curves were examined using the Yoon–Nelson, Thomas, and Adams–Bohart models. This study’s innovation lies in the application of a new adsorbent for H
2S removal from biogas and in deriving key design parameters from the models to support the scaling-up of the column. This approach aims to address the dual challenges of energy efficiency and safety using biogas.
3. Results and Discussion
3.1. Biogas Composition and Summary of Material Characterization
The biogas compositions of the two digesters vary based on the quality and quantity of the feedstock used throughout the biogas production process, as shown in
Table 3. This variation occurs because the feedstock’s characteristics such as moisture level, organic content, and degradability directly influence microbial activity during digestion, thereby affecting the production and composition of biogas. Additionally, the amount of feedstock determines the availability of substrates for microorganisms, further affecting the gas yield and composition. The soda ash was characterized, and the results are reported in our previous study [
8]. The multipoint BET analysis indicated that the material pores were mesoporous with pore sizes ranging from 2 to 50 nm. The SEM analysis showed that the material morphology is relatively rough with extremely hollow pores, and irregular crystal structures, which enhance H
2S removal.
3.2. Adsorption Isotherms
These were used to study the behavior of interaction between the active mesoporous sites of soda ash material and hydrogen sulfide from biogas. These isotherms describe the relationship between the equilibrium quantities of hydrogen sulfide adsorbed and those in the adsorbent phase.
3.2.1. The Langmuir Adsorption Model
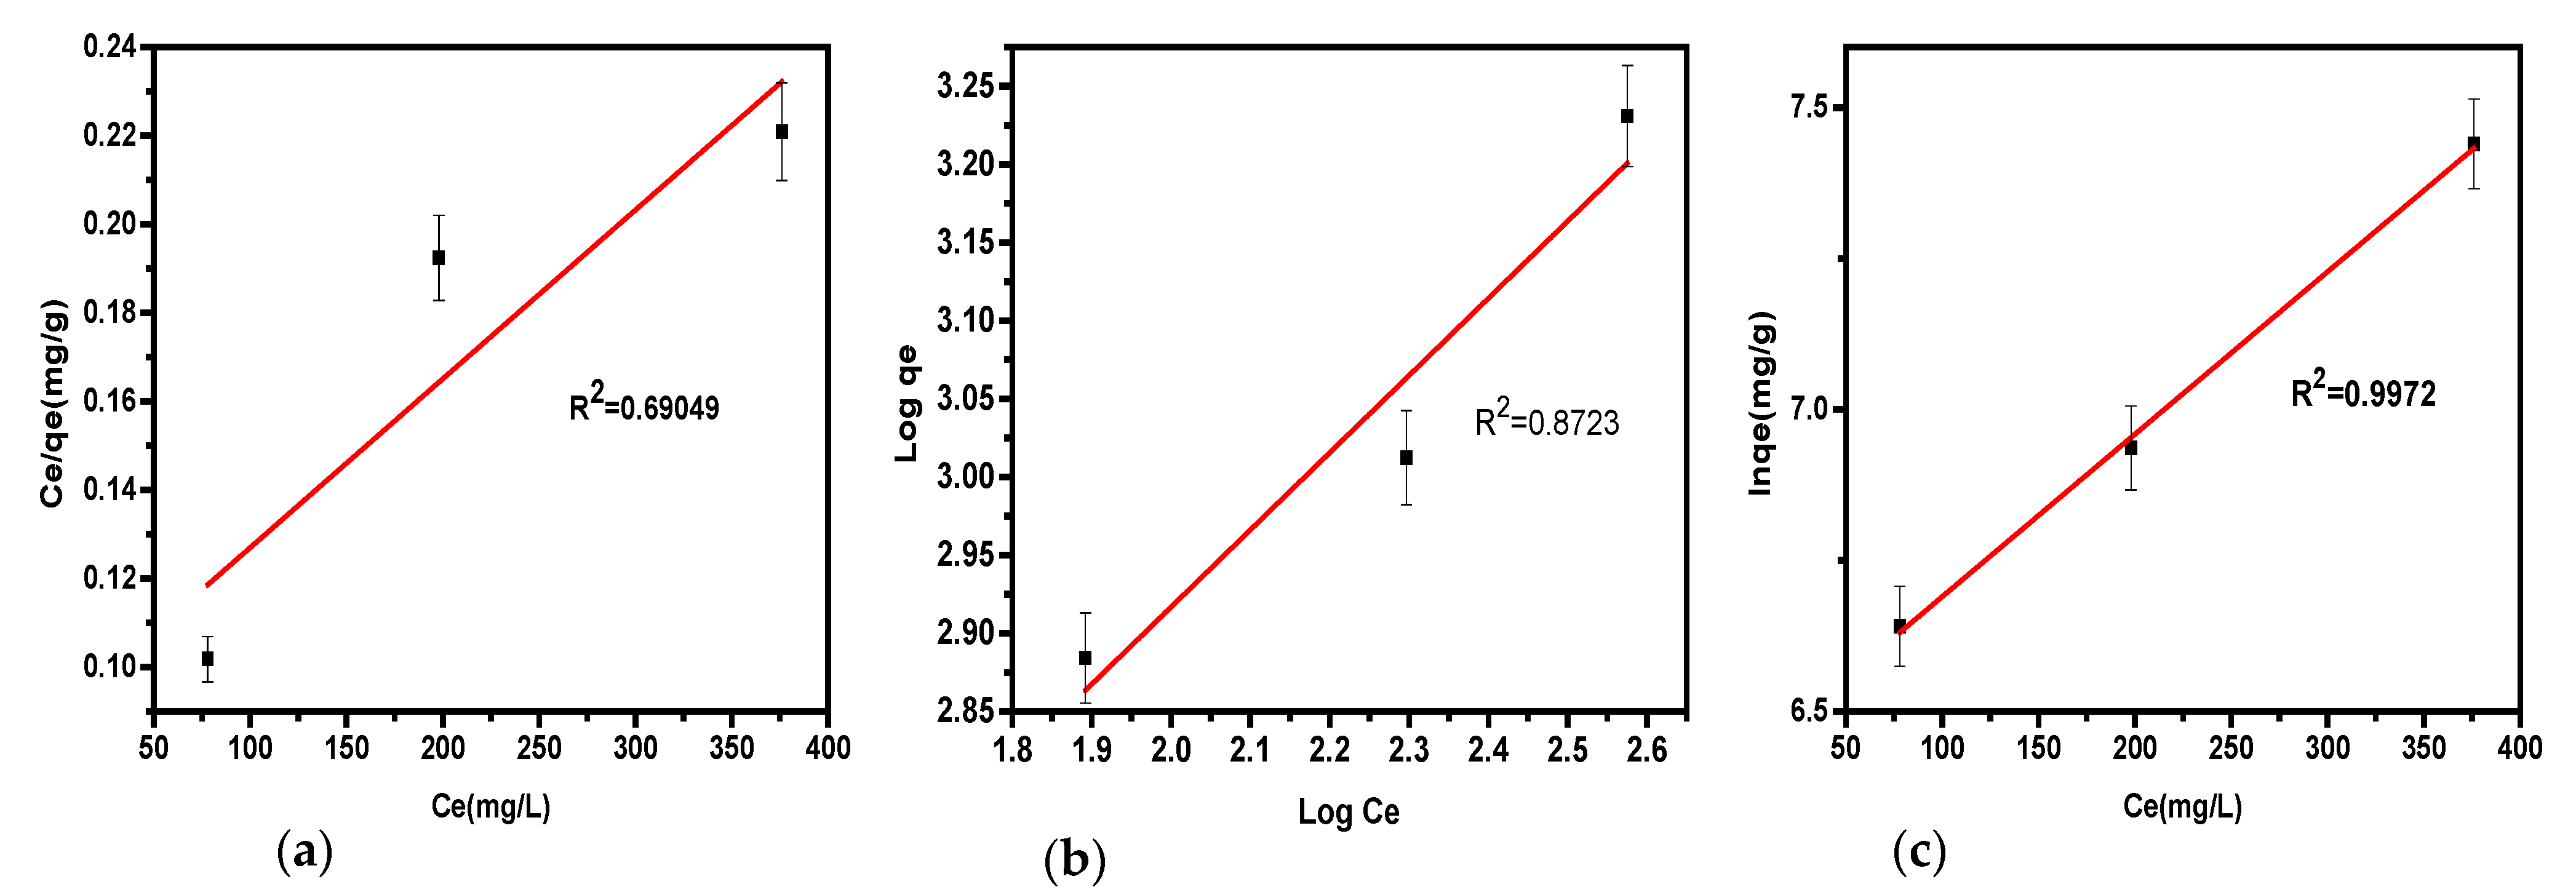
This model determined the maximal adsorption capacity, representing full monolayer coverage on the soda ash surface. The parameters of the model, presented in
Table 4, were obtained via equations detailed in our prior study, with plots illustrated in
Figure 3a. From the intercept and slope of the linearized Langmuir plot of C
e/q
e versus C
e, key parameters like R
L, K
L, R
2, and q
m were derived. Adsorption efficiency was evaluated via the separation factor R
L: R
L = 1 suggests linear sorption, R
L > 1 indicates unfavorable adsorption, 0 < R
L < 1 shows favorable adsorption, and R
L = 0 implies irreversible adsorption. From the R
2 values in
Table 4, the Langmuir isotherm does not appropriately describe hydrogen sulfide removal, as seen with an R
L of 3.45 × 10⁻⁶ and an R
2 of 0.69049, underscoring the model’s inadequacy for H
2S adsorption from biogas.
3.2.2. The Freundlich Isotherm
This model was used to estimate the sorption intensity, 1/n, of hydrogen sulfide on the surface of the soda ash sorbent. The model characterized the removal of H
2S as a multilayer adsorption process occurring on heterogeneous surfaces. The plots of log q
e versus log C
e illustrated in
Figure 3b were utilized to obtain the parameters K
f, and n as shown in
Table 4, offering insights into surface heterogeneity and adsorption intensity. By using this isotherm, the process is favorable only if 1< n < 10 or 0 < 1/n < 1. Alternatively, when n < 1 shows a slow sorption process, and n = 1 suggests a linear adsorption. In this study, the 1/n value for H
2S removal was found to be 0.4, with R
2 of 0.87. These results show that the adsorption of hydrogen sulfide aligns well with the model, as it achieved coefficients close to 1, and 1/n values fell within the expected range of 0 < 1/n < 1 consistent with the literature. This supports the conclusion that the Freundlich adsorption isotherm effectively modeled the adsorption of biogas impurities in this study.
3.2.3. The Jovanovich Isotherm Model for Adsorption
The Jovanovich model was evaluated, with the results presented in
Table 4. A plot of ln q
e versus shown in
Figure 3c, along with relevant equations, was used to determine the isotherm variables based on the data from the experiment. The results indicated adsorbent capacity is 6.42 mg/g for H
2S elimination (
Table 4) with a correlation coefficient of 0.997. The data fitted well in the model as K
j was in the range of 0 < K
j < 1 agrees with the literature [
17]. The low value of q
max indicates that the material has weak adsorption ability [
18]. The Jovanovich isotherm adequately described the removal of hydrogen sulfide from biogas.
Here, KL (L/mg) is the Langmuir constant, RL (L/mg) is the Langmuir equilibrium constant, qmax (mg/g) is the maximum adsorption capacity, n is the adsorption intensity constant, kf (L/g) is the Freundlich adsorption constant, and Kj (L/g) is the Jovanovich constant.
3.2.4. The Limitations of Langmuir Isotherms
The Langmuir isotherm assumes a homogenous adsorption surface with uniform energy levels, where adsorption occurs as a monolayer and each adsorption site can only hold one molecule without interactions between adsorbed molecules. These assumptions, while useful for ideal systems, limit the model’s applicability to more complex adsorption processes. In cases where the adsorbent surface is heterogeneous, such as soda ash, or where multilayer adsorption occurs due to varying binding energies and interactions, the Langmuir model fails to accurately describe the adsorption behavior. This limitation becomes evident when experimental data deviate significantly from the model’s predictions, as it cannot account for surface irregularities, variations in adsorption site energy, or the potential for molecules to adsorb onto previously adsorbed layers.
3.3. Adsorption Kinetics
The process of H2S removal from biogas using soda ash material was investigated and the data from the experiment were analyzed using various kinetic models discussed here. Different equations for these models were converted into linear forms, enabling regression analysis based on the on-site results. The coefficient of correlation (R2) and the maximal adsorption (qmax) were then used to evaluate the alignment of the on-site data with the proposed adsorption kinetic models.
3.3.1. Pseudo-First Order Kinetics
The kinetics are considered valid for surface reactions-controlled adsorption kinetics, particularly under conditions of low adsorbate concentration or excess adsorbent, suggesting that each adsorbate molecule occupies a single active site on the surface. The model assumes that the adsorption process relies solely on the adsorbate concentration and is governed by diffusion. The linearized pseudo-first order (PFO) model requires an initial estimate of q
e to calculate other parameters through its equation. On the other hand, q
e can be estimated by deducing experimental data to t→+ꝏ. This involves the assumption of an initial q
e performing linear regression to obtain k
1, and iteratively refining q
e. The q
e, k
1, and R
2-values are illustrated in
Table 5, while the linear form of the model is depicted in
Figure 4. The model highlights a direct correlation between the sorbent material’s surface area and the adsorption rate. However, the model’s accuracy is validated only when the calculated q
e (mg/g) closely matches the on-site q
e (mg/g). For hydrogen sulfide adsorption, the calculated q
e did not align with the value from the on-site experiment, indicating that the model failed to fit the experimental data.
3.3.2. Pseudo-Second Order Kinetics
The model can be expressed in a linear form, allowing the important variables to be determined, as shown in
Table 5. Experimental data collected from on-site studies were utilized to create plot
Figure 4b, from which the required parameters were derived. The adsorption kinetics for H
2S removal using the pseudo-second order model were studied in batch systems at ambient temperature.
Figure 4b illustrates a rapid increase in H
2S adsorption during the first 50 min. The kinetic variables calculated from the pseudo-second order equation are summarized in
Table 5. The correlation coefficient (R
2) for hydrogen sulfide uptake using the pseudo-second order (PSO) model was found to be 0.903. However, the values of k, q
e, and R
2 indicate that the kinetics model did not adequately represent the experimental data [
19]. Overall, the calculated q
e and R
2 for hydrogen sulfide adsorption demonstrate that the model failed to align with the on-site experimental results.
3.3.3. Elovich Model
The parameters obtained for H
2S removal using this model are summarized in
Table 5 and illustrated in
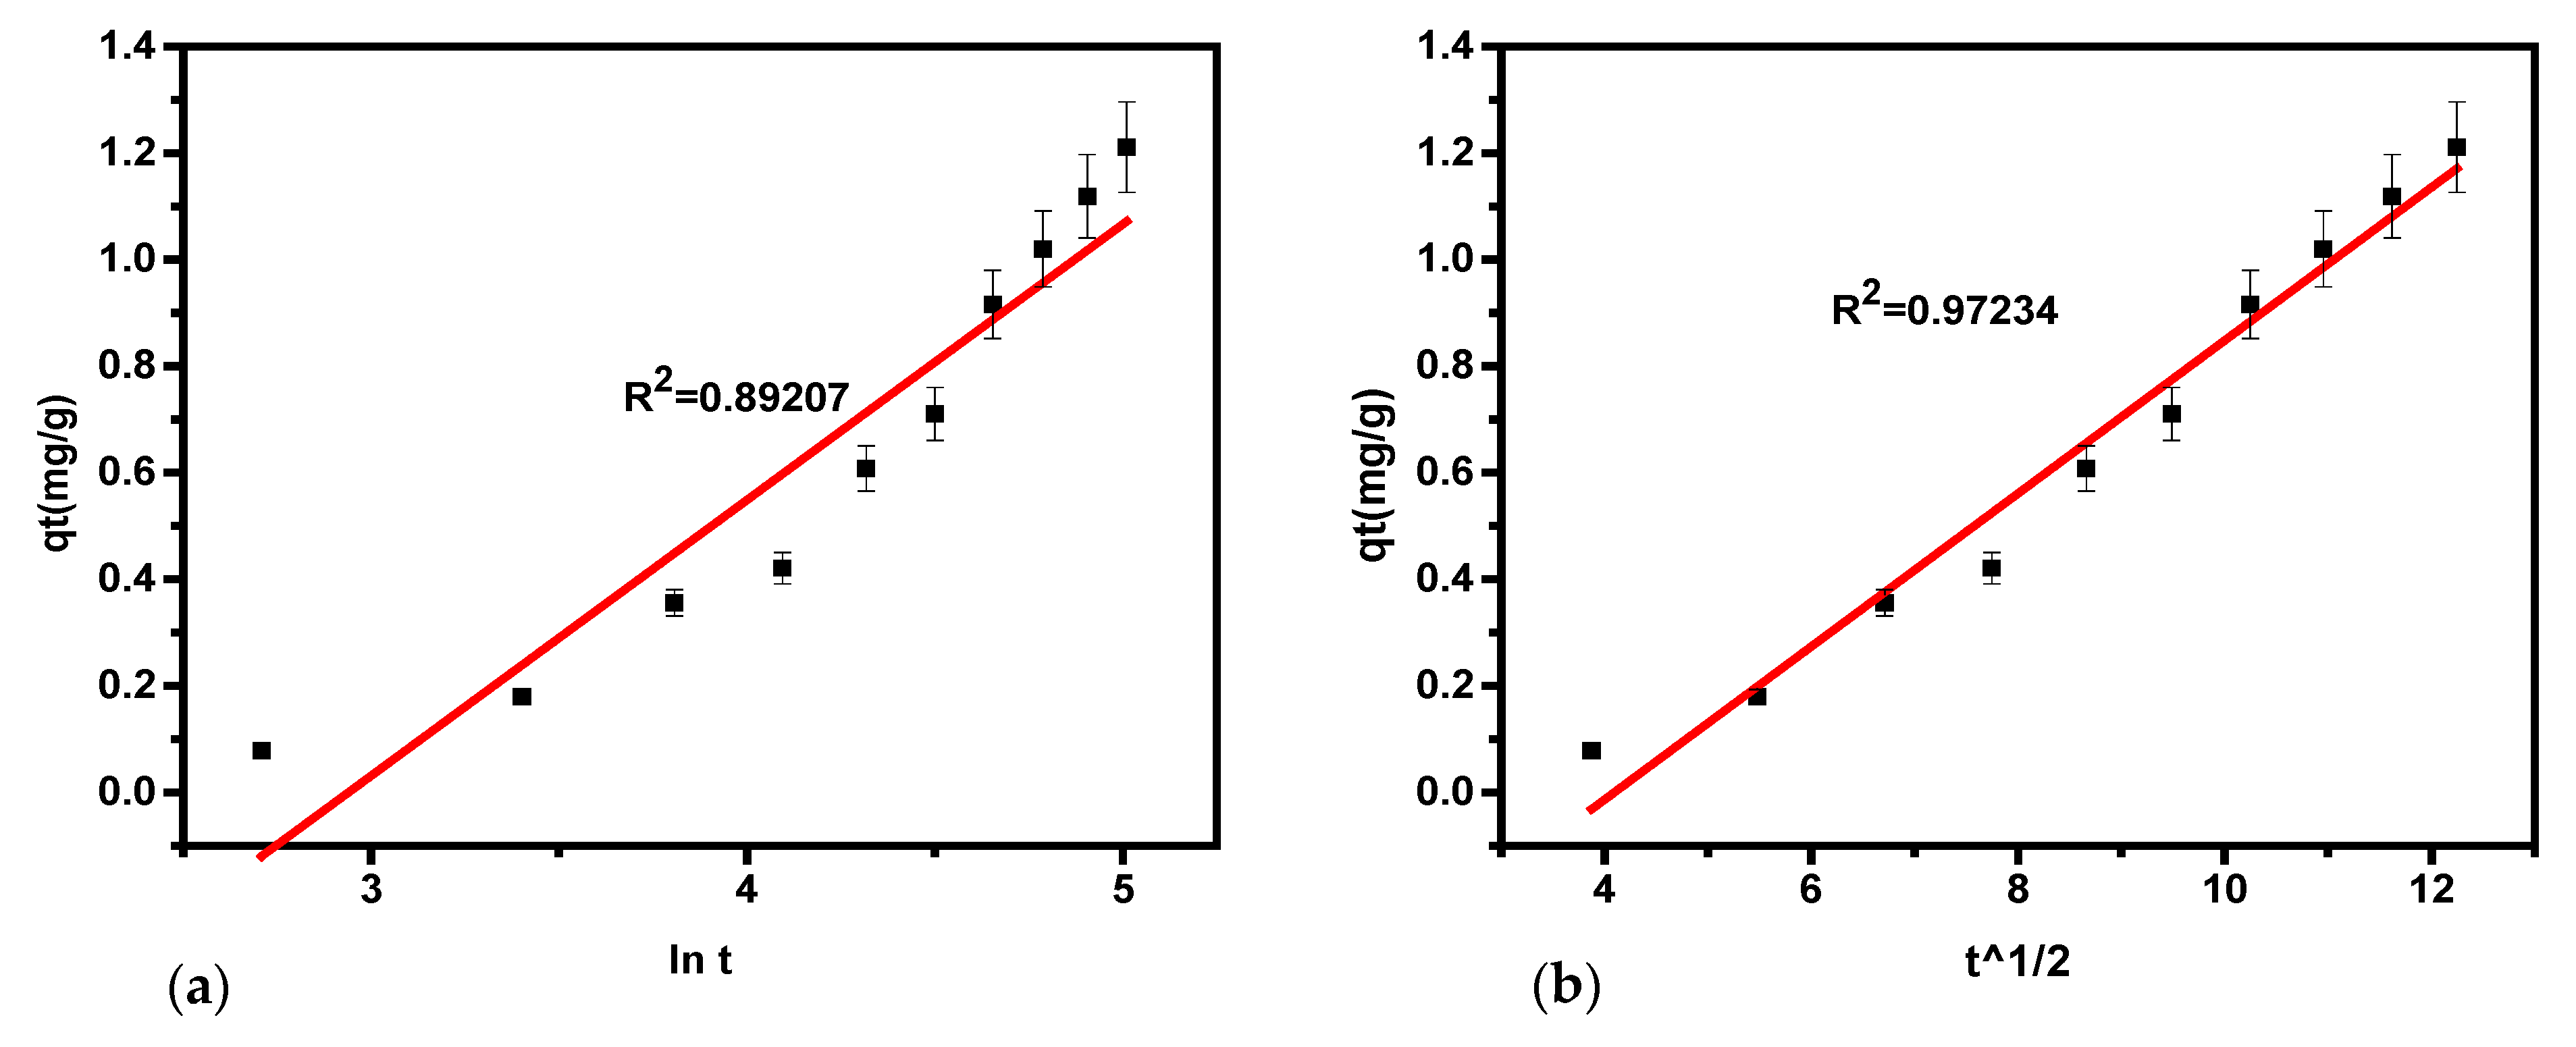
Figure 5. The linear regression analysis for hydrogen sulfide removal based on the Elovich model yielded an R
2 value of 0.892. The availability of adsorption sites increases exponentially, following a multilayer adsorption process governed by chemisorption kinetics. This model suggests that the adsorption rate declines exponentially as the number of adsorbates increases, consistent with chemisorption mechanisms.
The kinetics of the model are defined by the parameters ᵦ, α, and R
2, which are derived from linear plots. The findings indicate strong chemisorption interactions between hydrogen sulfide and the sorbent material. Values for α, ᵦ, and R
2 were extracted from the plot of q
t versus lnt as demonstrated in
Figure 5a, and the results are presented in
Table 5. These results suggest that the Elovich kinetics model offers a moderate fit to the experimental data, as indicated by R
2 values below 0.89207.
It was further noted that the initial adsorption rate of hydrogen sulfide removal was minimal, at 1.9 mg/g·min. This observation aligns with findings from [
19], suggesting that the desorption rate of hydrogen sulfide when using soda ash is relatively slow.
3.3.4. Intra-Particle Diffusion Model
A graph of q
t against t
1/2 illustrated a linear relationship between these parameters (
Figure 5b). This indicates that the adsorption occurs through intra-particle mechanisms and surface adsorption. The c and k
id parameters are obtained from the plot of q
t versus t
1/2 as the slope and intercept, respectively, and are shown in
Table 5. The high R
2 (closer to 1) concerning the previous models indicates the appropriateness of this mechanism. The values of k
id and c (mg/g) obtained suggest that soda ash sorbent can be used for chemisorption. Consequently, the intra-particle diffusion model best fits the on-site experimental data concerning the other models used in the current study.
The equation establishes a direct correlation between the square root of time and sorption capacity, as shown in
Figure 5b. The graph of q
t against t
1/2 for H
2S adsorption using soda ash indicates that the adsorption occurs through both surface adsorption and intra-particle diffusion mechanisms. The parameters c and k
id (mg/g) can be derived from the slope and intercept of the q
t versus t
1/2 plot. These parameters are summarized in
Table 5. The R
2 values for hydrogen sulfide removal are closer to 1 as compared to the remaining models, suggesting that the diffusion mechanism is a significant factor in the adsorption process. The values of k
id and c (mg/g) reflect the extent of the boundary layer and indicate that soda ash is a suitable sorbent for chemisorption.
3.4. Modeling
The Yoon–Nelson, Thomas, and Adams–Bohart models are widely utilized in adsorption studies to describe the dynamics of fixed-bed columns. The models help to understand and predict the breakthrough behavior during the removal of biogas contaminants, like hydrogen sulfide, from gaseous or liquid streams (
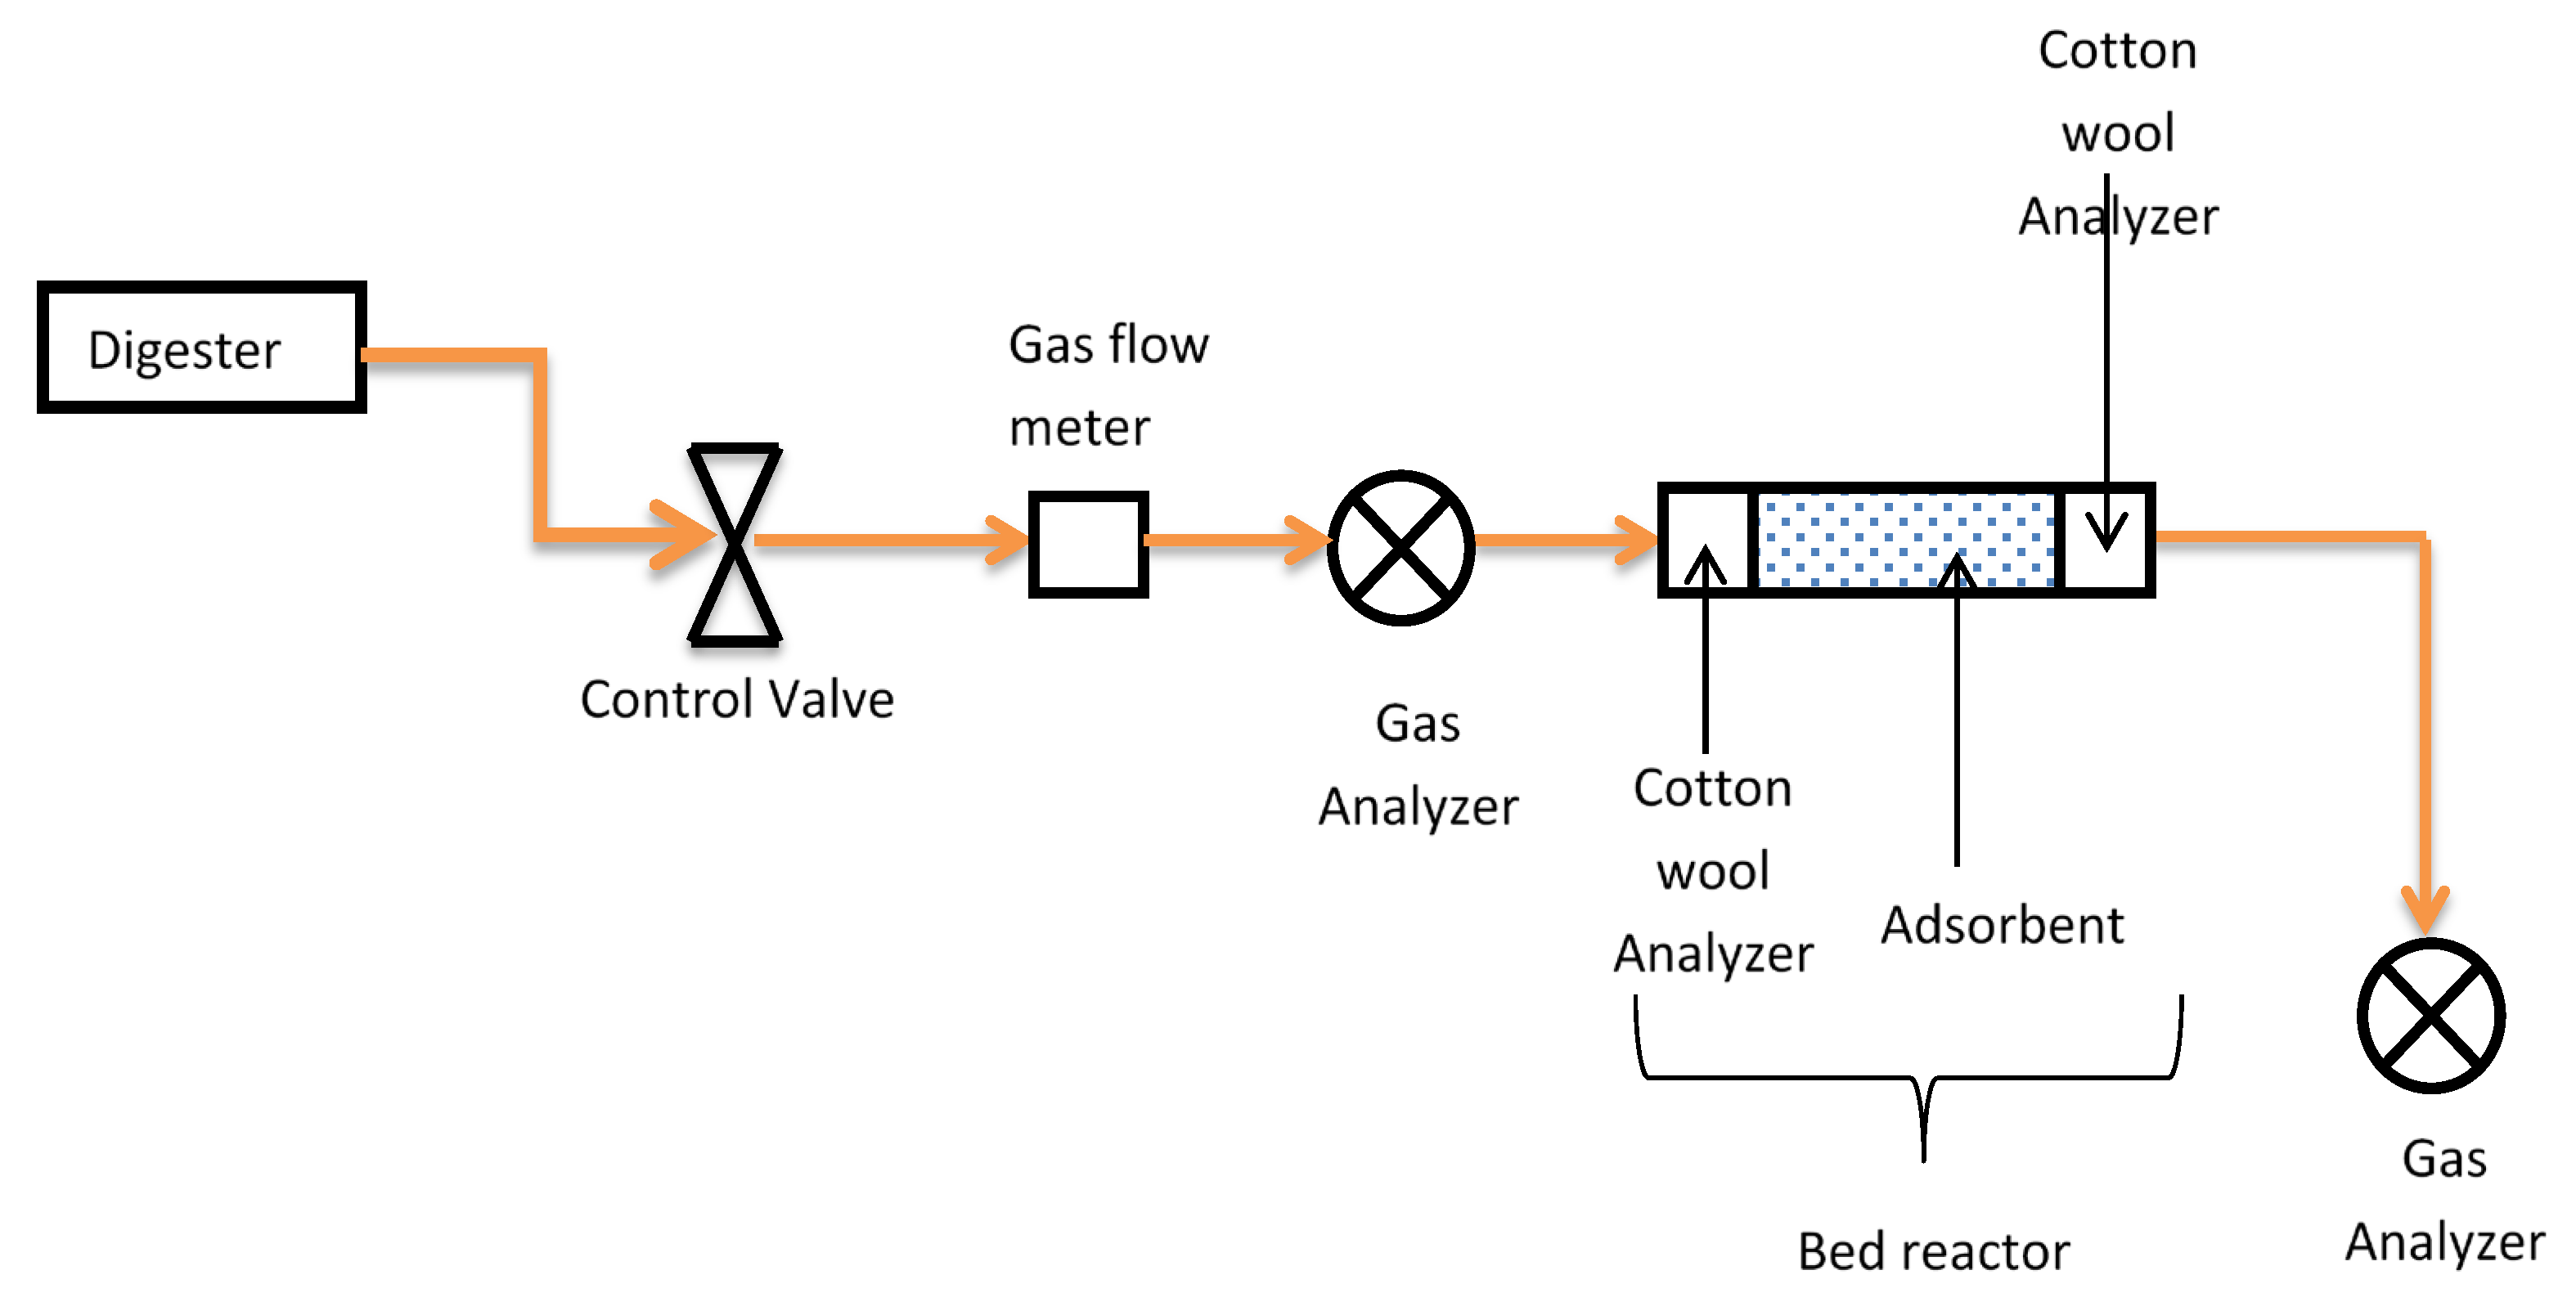
Figure S1, Supplementary Materials). They enable the assessment of adsorbent performance and column design parameters, making them valuable tools in optimizing processes, such as hydrogen sulfide removal from biogas. In the adsorption experiments, the smallest particle size of 280 µm, with a flow rate of 0.03 m
3/h and an initial hydrogen sulfide concentration of 1227 ppm, reached saturation at 160 min. The experiment demonstrated a high removal efficiency of 94% and a sorption capacity of 0.02 g per 100 g of adsorbent. The mass of the adsorbent used varied at 75 g, 50 g, and 25 g, while the bed volume changed correspondingly from 10 cm to 7 cm and 4 cm.
3.4.1. Adams–Bohart Model
This model is particularly effective in describing the initial phase of adsorption within a fixed column, as it focuses on the relationship between mass transfer and adsorption capacity. It was applied to describe the adsorption behavior of the material for hydrogen sulfide removal under varying conditions of initial sorbent concentrations and bed heights. The mass transfer coefficient (K
AB) and maximal adsorption ability (N
o) were obtained from the slope and intercept of the plots, respectively,
Figure 6. The results presented in
Table 6 highlight the dependence of these parameters on the experimental conditions. An increase in bed height (e.g., 25 g to 75 g) was associated with higher values of (N
o) indicating that taller beds provided more active sites for adsorption. However, (K
AB) tended to increase with increased bed height, likely due to the extended contact time reducing the rate of mass transfer per unit area. Higher initial concentrations of hydrogen sulfide generally resulted in larger (K
AB) values, reflecting a stronger driving mechanism for mass transfer at the start of the sorption process. Similarly, (N
o) increased with concentration, demonstrating the ability of the adsorbent material to accommodate greater contaminant loads under higher input levels.
Overall, the results confirm the suitability of Adams’s model in assessing the kinetic behavior of the fixed-bed column, providing valuable insights into the adsorbent’s performance and its optimization for hydrogen sulfide removal. These findings emphasize the influence of operational variables, like bed height and influent concentration, on the adsorption efficiency. The Adams–Bohart model is often used for adsorption in fixed-bed systems and considers mass transfer limitations. Thus, the experimental data did not align well with this model, and it suggests that mass transfer resistance may not be the dominant factor in the adsorption process.
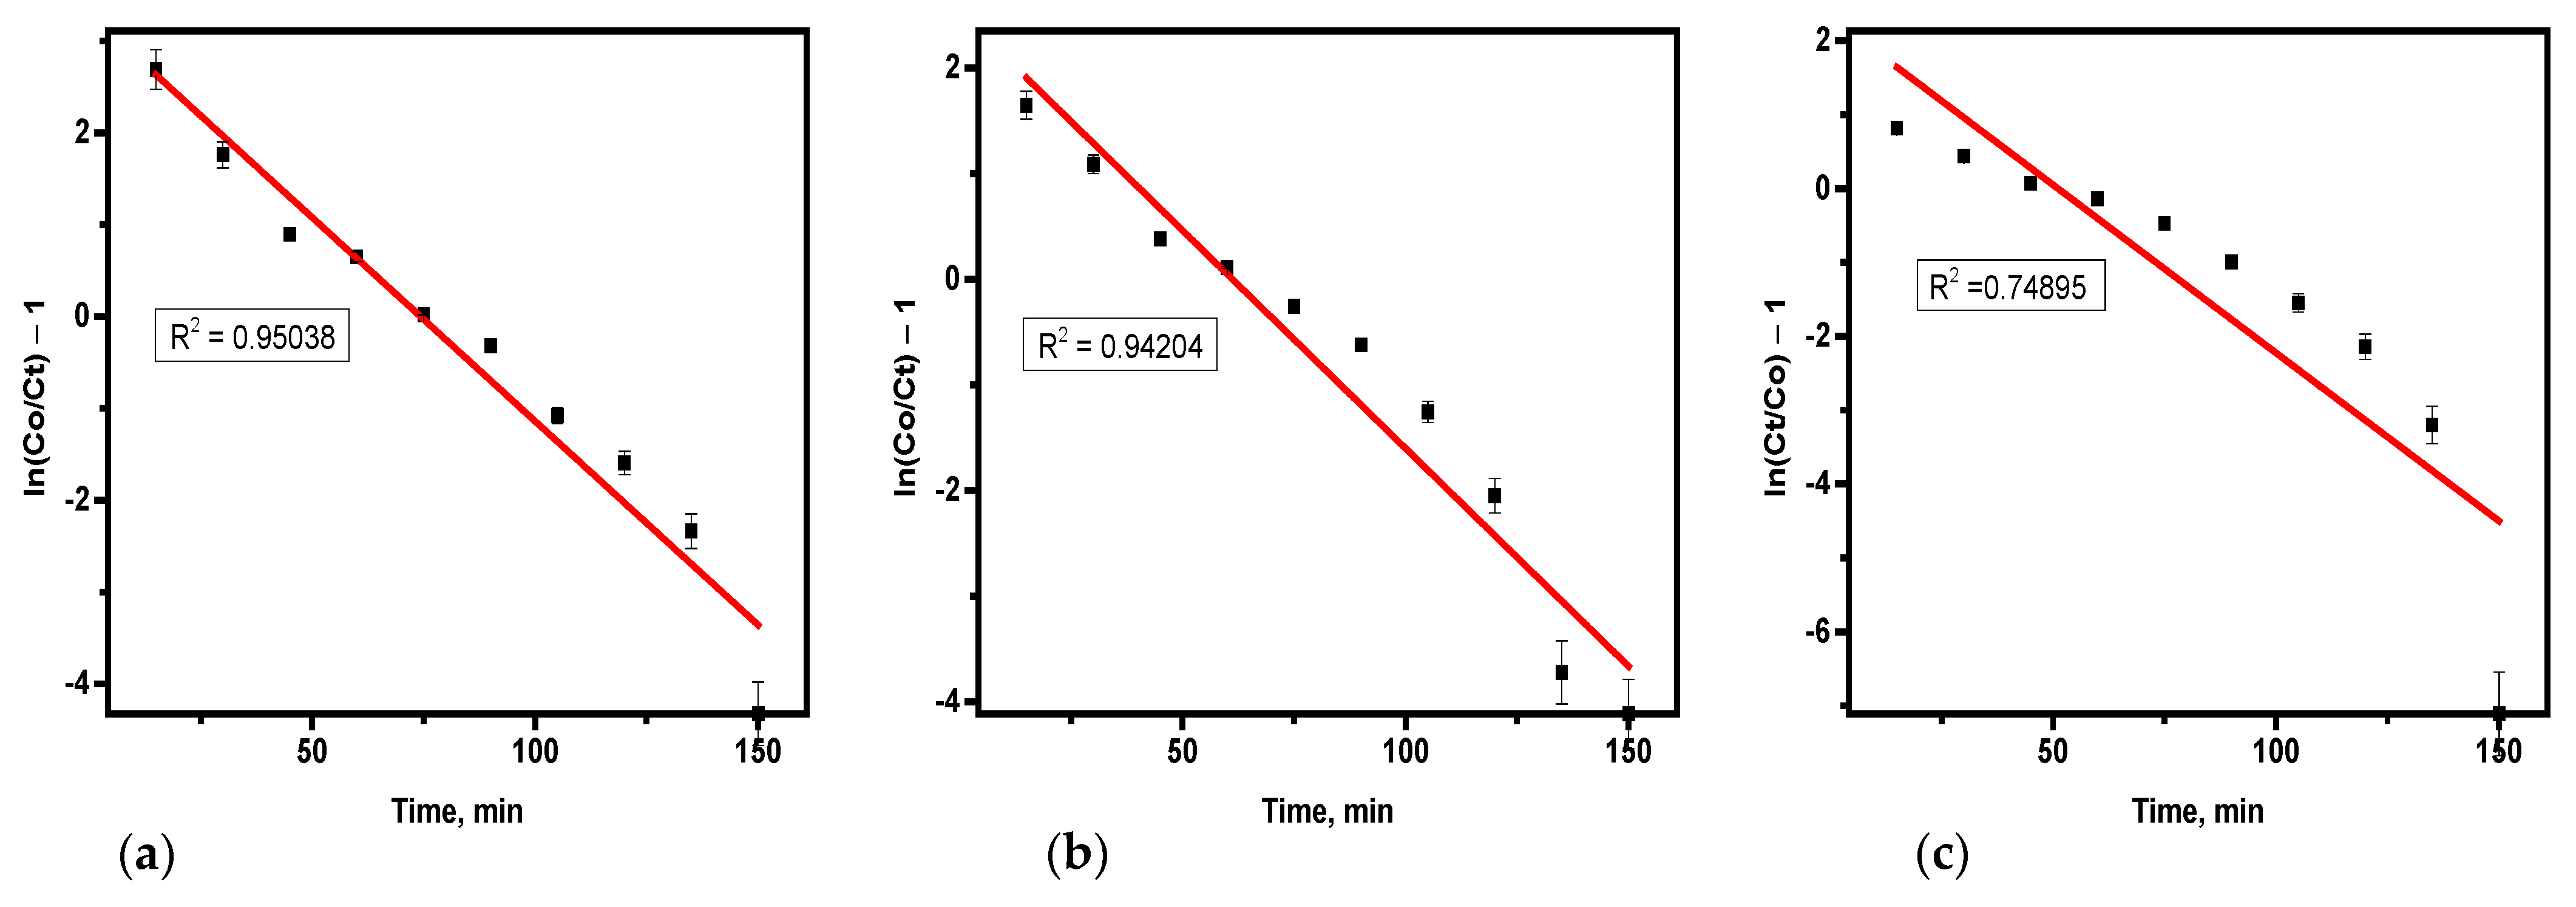
3.4.2. Thomas Model
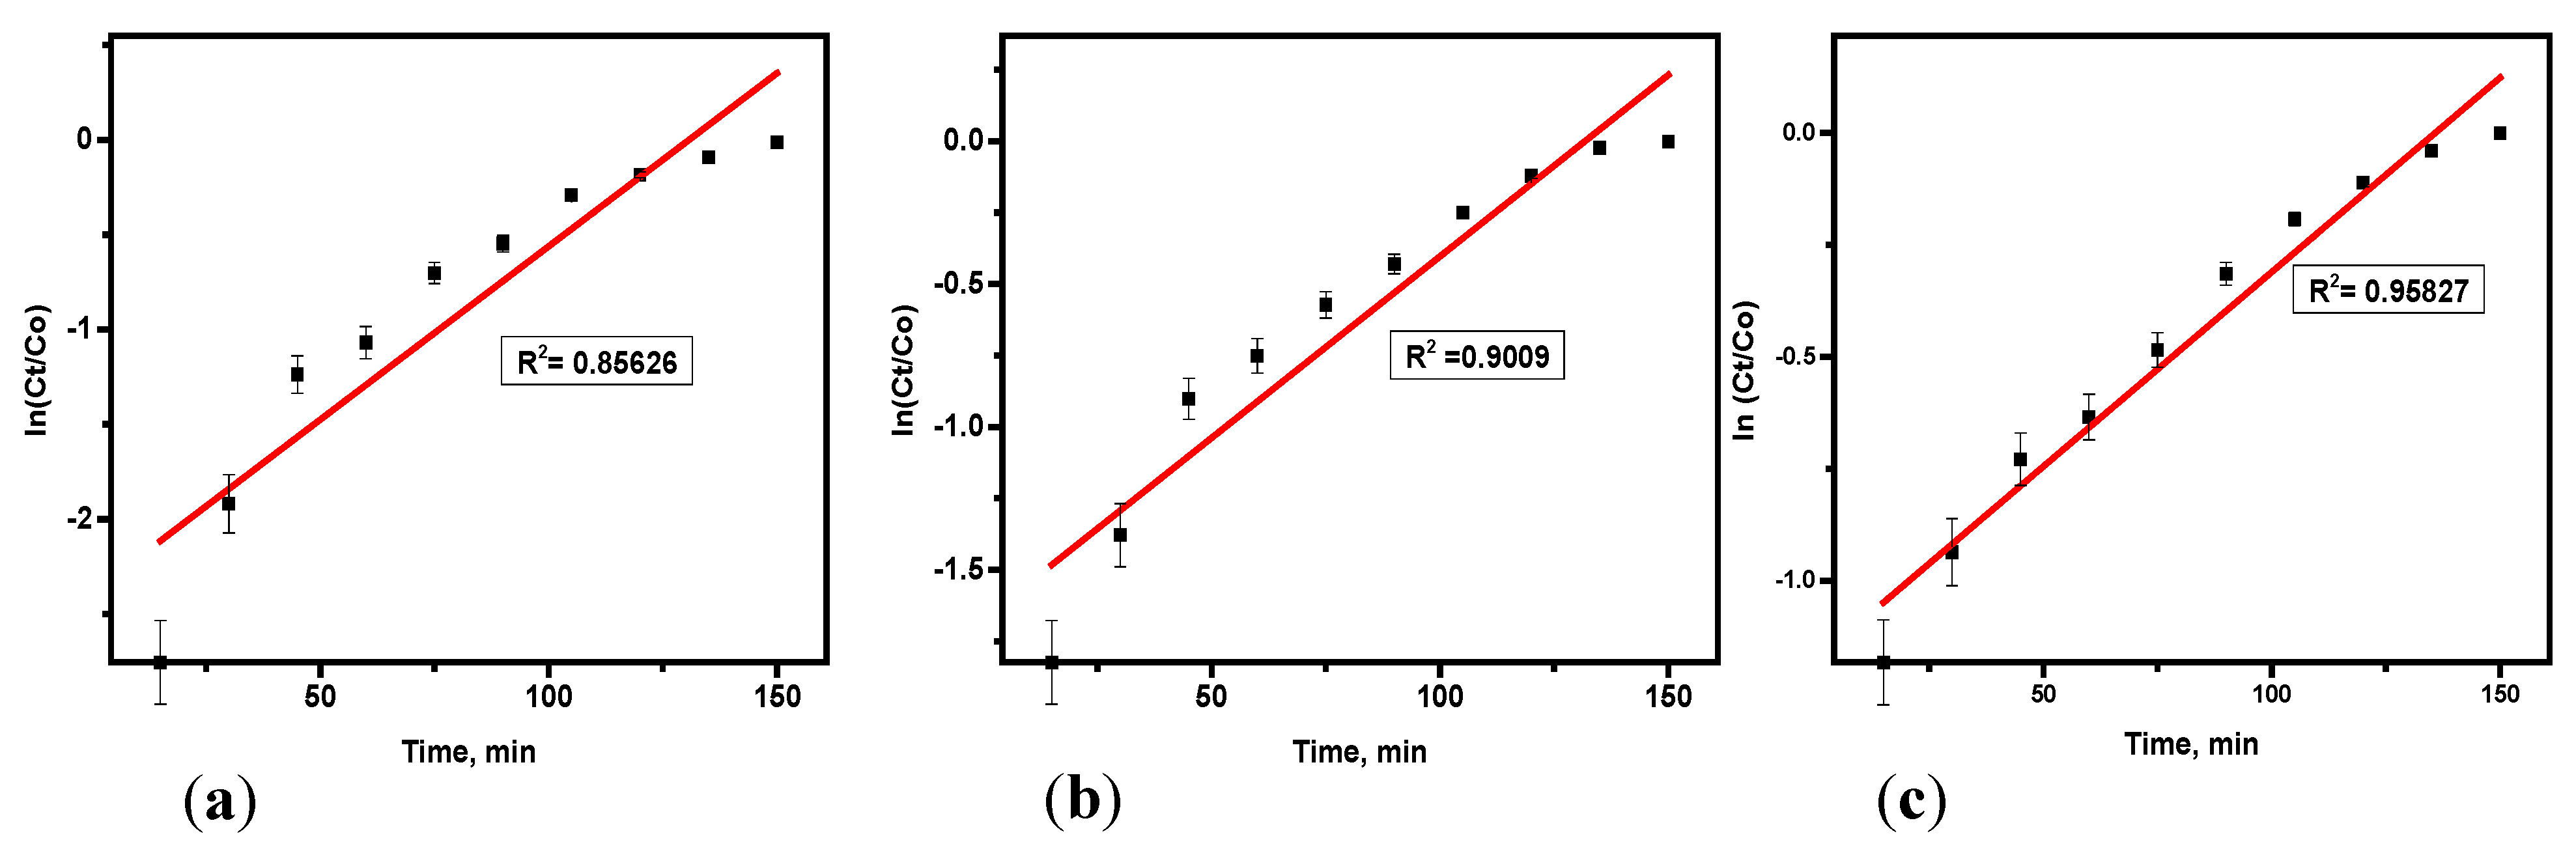
The model was used to fit the data from the experiments, with coefficients and related constants determined through linear regression analysis.
Table 6 summarizes the results and was derived from
Figure 7. The Thomas model exhibited R
2 values ranging from 0.95038 to 0.74895.
Table 6 reveals that as bed depth increased, the k
Th values decreased, whereas higher flow rates and concentrations resulted in increased values for both k
TH and q
o [
20]. The data from the experiment showed that as there is an increased bed height from 4 cm (
Figure 7c)–10 cm (
Figure 7a), q
o, k
TH decreased, consistent with findings in the literature [
21]. This characteristic was contributed by the kinetics of adsorption influenced by concentration gradients. Thus, higher influent concentration, greater bed depth, and lower flow rate enhanced the sorption of hydrogen sulfide adsorption from biogas in the fixed column. The data from the experiment for the H
2S elimination aligned well with the Thomas model, with coefficients ranging from 0.74 to 0.95. The Thomas model assumes Langmuir kinetics and negligible axial dispersion, making it widely applicable in fixed-bed adsorption systems. The experimental data for hydrogen sulfide removal from biogas deviated from this model; it indicates that the adsorption mechanism does not strictly follow Langmuir isotherm assumptions and some external factors such as flow dynamics have influenced the adsorption performance of the soda ash sorbent. The terms C
o is the initial concentration, C
t is the concentration at time t, q
o is the equilibrium adsorption capacity and q
t is the adsorption capacity at time t.
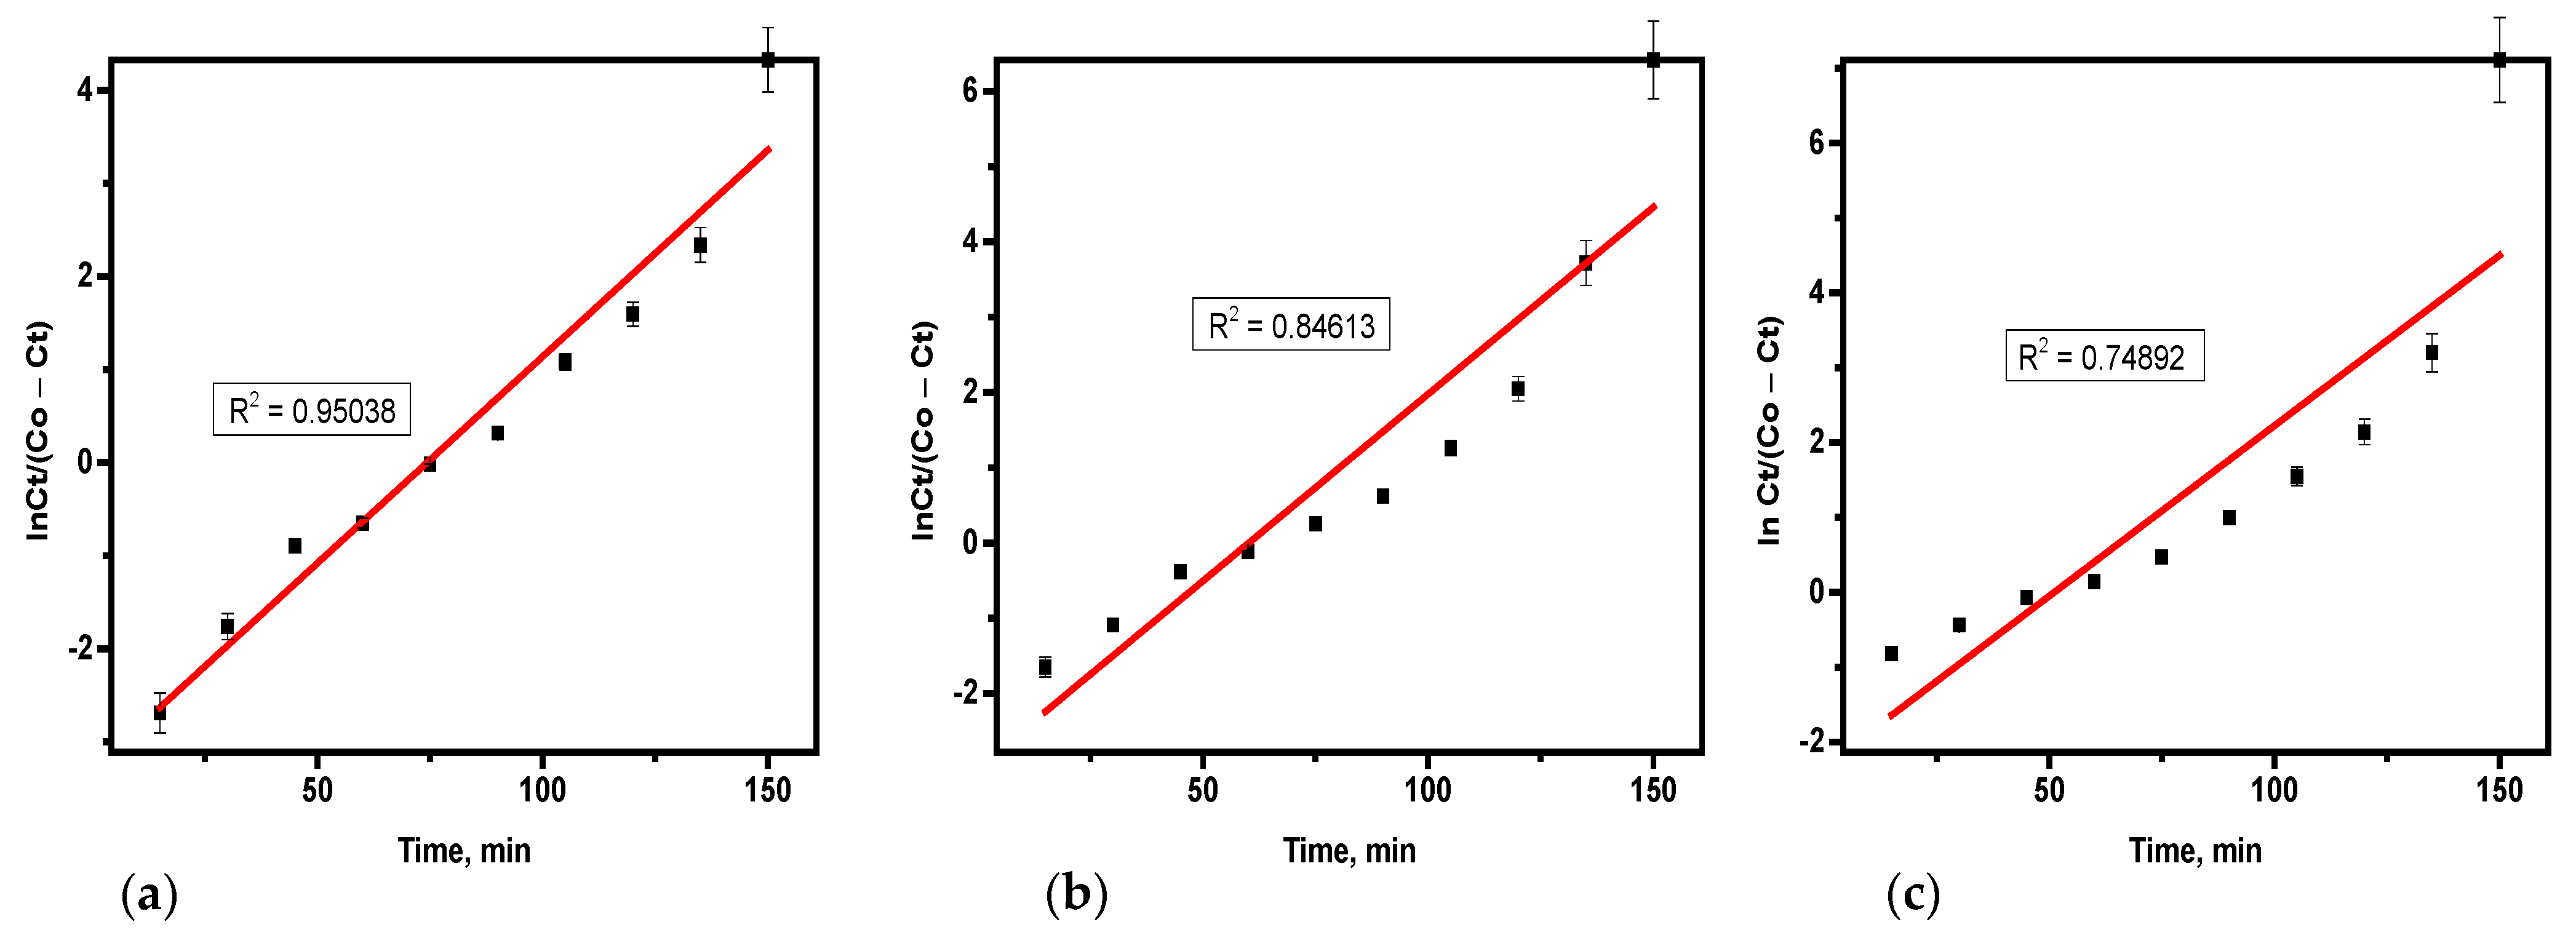
3.4.3. Yoon–Nelson Model
Variables such as ɽ (the time needed for 50% hydrogen sulfide breakthrough) and the rate constant (k
YN) were determined from the plot using the slope and intercept as illustrated in
Table 6 and derived from
Figure 8a–c. The values of k
YN increased as the flow rate and bed height decreased, while ɽ decreased as concentration increased and bed height. The rise in ɽ with higher flow rates suggests that a slower consumption rate of the adsorbent bed occurs, which is beneficial for the adsorption. The ɽ value indicates the time at which 50% of the adsorbent material in the column reaches the breakthrough point, with higher ɽ values reflecting improved column performance. Similar findings have been reported in the literature [
21,
22]. The Yoon–Nelson model is simpler than the Thomas model and only requires two parameters time required for 50% breakthrough (τ) and rate constant (k
YN). Its good fit suggests that the adsorption follows a predictable breakthrough behavior with a symmetrical adsorption and desorption process. This model’s consistency with the data indicates that breakthrough time prediction was accurate, and adsorption kinetics were stable under the given experimental conditions.
Therefore, the effect of the mass of the adsorbent on hydrogen sulfide elimination was evaluated via adsorbent quantities of 75 g, 50 g, and 25 g. Using the Adam-Bohart model, as the mass of soda ash increased, it resulted in a higher value of KAB and a lower No value. Similarly, in the Thomas model, increasing the adsorbent mass led to a reduction in both KTH and qo. For the Yoon–Nelson model, a higher mass of adsorbent caused decreases in both KYN and ɽ.
3.5. Study Limitations and Outlook
The study focused solely on soda ash as the adsorbent, which may limit the generalizability of the findings to other potential adsorbents with varying properties and efficiencies. Meanwhile, the range of particle sizes tested was narrow, and smaller or more varied particle sizes might provide additional insights into optimizing performance. The effect of external factors like temperature, pressure, and humidity on the adsorption efficiency was not extensively studied. The study recommended that investigating other adsorbents with higher adsorption capacities, better regeneration potential, or lower costs could enhance the efficiency and economic viability of the process. Similarly, comprehensive cost–benefit analyses and life cycle assessments should be conducted to ensure the long-term practicability of the process. These adsorption models can be applied in future reactor design and cost estimation for large-scale biogas purification systems through optimizing adsorbent usage. The best-fit model (Yoon–Nelson) can help predict breakthrough times, ensuring efficient adsorbent replacement schedules and model parameters can be extrapolated to design larger fixed-bed reactors with accurate residence times and adsorption capacities. Meanwhile, the Thomas and Adam–Bohart models can assist in understanding mass transfer limitations, guiding improvements in bed height, flow rate, and particle size for better performance. Additionally, models like Yoon–Nelson predict when a breakthrough occurs, helping estimate the frequency and cost of adsorbent replacement. Pressure drop refers to the decrease in pressure experienced by gas as it flows through a packed bed of solid adsorbent particles. This is caused by friction between the gas and the adsorbent particles as it moves through the bed. Generally, smaller particles result in higher pressure drop due to increased surface area for interaction with the gas. If we could be able to measure pressure drop, we could inform energy requirements for biogas flow through the reactor, contributing to operational cost estimates. The adsorption models, combined with cost data like adsorbent price, regeneration costs, and biogas flow rate, can help determine the cost-effectiveness of different adsorption setups before large-scale implementation. Thus, we recommend further studies to consider pressure drop in the bed reactor for a more accurate estimation of energy efficiency.


