1. Introduction
Bubble column reactors play a crucial role in various engineering fields, with their design tailored to meet specific industrial requirements. One notable advantage of bubble column reactors lies in their absence of moving parts, distinguishing them from continuous stirred-tank reactors (CSTRs). This characteristic contributes to simplified maintenance procedures and efficient error detection and facilitates the use of such reactors in different application fields. Due to their good performance in terms of heat and mass transfer, bubble column reactors are suitable for use in a wide range of biological, chemical, and petrochemical industrial applications [
1].
The multiphase contact area provided through the insertion of a gaseous phase into a liquid, combined with the simple operational characteristics of bubble columns, has initiated significant interest in the distinct physical and hydrodynamic behavior of the gas–liquid interfaces in these systems [
2,
3]. Precise knowledge of the hydrodynamic conditions in a bubble column reactor is required to ensure the largest possible contact surface between the two phases to achieve the desired reaction properties and operating conditions and to minimize dead zones inside the column. These multiphase conditions inside the column rely on a variety of different parameters, like the column design [
4,
5,
6], the physical parameters of the components involved [
7,
8,
9], the superficial gas velocity [
10,
11] and the sparger design [
12].
An optimized sparger design is crucial for the optimal distribution of the gaseous phase into the liquid with minimum construction, operation, and maintenance costs. To quantitatively express the influence of the sparger design, experimental investigations of different sparger types and their influence on the hydrodynamic flow phenomena have been conducted by many researchers. Vijayan et al. [
13] used electrical resistance tomography and found an increase in the radial gas holdup at higher superficial gas velocities in cylindrical bubble columns for a variety of sparger types. Employing different sparger types also shows a shift in the flow regime transition points and a tendency towards clearer segregation of these transitions [
14]. Depending on the design, the sparger generates certain bubbling behavior, which determines the overall hydrodynamic behavior of the bubble column at the reactor scale in accordance with the underlying bubble size distribution and the interactions between the individual bubbles due to coalescence and breakup [
15,
16]. Besagni et al. [
17] examined the influence of two sparger designs (a coarse gas sparger and a fine gas sparger) and observed the influence on the behavior of the flow regime at the reactor scale. It was found that more uniformly distributed spargers with smaller orifice diameters stabilized a homogeneous dispersion pattern and thus enabled a higher gas holdup. An increase in the gas holdup in perforated plate spargers at smaller orifice diameters has also been reported in other studies [
18]. Kazakis et al. [
19] showed the dependency of the gas holdup and flow regime transitions on the mean pore diameter in porous sparger designs. Smaller orifice sizes in perforated plate spargers also enhance the volumetric mass transfer coefficient compared to single-inlet coarse spargers, boosting the efficiency of fine spargers in reaction-driven process applications [
20]. Considering the size of the inlet diameter, bubble detachment theory describes a decrease in the bubble size at smaller inlet diameters [
21]. As applied to the case of a homogenous flow in bubble columns, single-inlet tube spargers show larger Sauter mean diameters in terms of the bubble size with an increase in the inlet diameter [
22]. The average bubble diameter tends to decrease at smaller orifices sizes, whereas the interface area shows an increase with smaller orifices in similar multi-inlet sparger types [
23]. For tree-shaped spargers, an impact on the global holdup at different orifice sizes and under homogeneous and heterogeneous flow regimes has been observed [
24]. The findings of these investigations indicate that variations in the orifice size among different sparger designs, even with the general interconnectivity of the overall phenomena observed, significantly influence the hydrodynamic phenomena at the reactor scale. Besides some studies that have dealt with submerged single orifices [
16,
25], many recent studies have focused on the overall impact of multi-orifice spargers on the hydrodynamics and gas holdup in bubble columns.
Despite the extensive evaluation of bubble column reactors using numerical simulations [
26], many research areas for bubble columns, like sparger design research, rely on experimental determination of important operating parameters because of the complexity of the numerical methods and their calculational cost. Choosing the right measurement method for the desired parameters plays an important role. Due to the intricate and dynamic nature of hydrodynamic processes, the use of direct measurement methods to analyze their structure is often associated with significant challenges [
27]. The indirect measurement methods used to study the structure of gas–liquid media (especially those aimed at determining the size of gas bubbles in liquids) also have several limitations, complicating their practical application [
28]. For example, the main disadvantage of the most common analytical method, namely conductometry, is its invasive nature. The presence of foreign elements (such as a wire mesh or a probe) alters the velocity field in liquid and gaseous media and can also cause bubble destruction [
29]. For other widely used techniques, like the acoustic method and the inverted funnel method, limiting factors include challenges related to the inconsistency between sound pressure fluctuations and changes in bubble size. Additionally, design modifications to the liquid/gas supply system are often required [
30]. Applying optical methods avoids any impact on the object of study and prevents disturbances while obtaining detailed information about the phases and their distributions. For the study of optically transparent media, photometric methods, enhanced by modern mathematical techniques, are gaining popularity [
31]. However, current methods for processing images of multiphase media face limitations due to the low contrast of the measured objects and their aggregation [
32]. For instance, Vasquez et al. [
30] describe a photographic method for measuring the diameter of gas bubbles. Despite its advantages, this method and similar methods encounter significant challenges due to reflections on the bubbles’ surfaces, which hinder accurate edge detection and lead to measurement errors. Additionally, there is no universally accepted standard for evaluating the quality of images used in such measurements. In this study, the authors propose a method for capturing and processing images that enhances object edges, minimizes boundary gaps, and consequently improves measurement accuracy. Utilizing this imaging approach, the gas holdup and the phase surface of the projection of all gas inclusions on the central section of the column were measured. The results obtained using this method follow the same trend as the gas holdup and the phase surface in volumetric regions, enabling the study of bubble column properties and phase interactions through high-speed imaging. Subsequently, the projection of the gas holdup and the phase surface of air in water for different single-orifice spargers at various flow rates was measured. The results for different inlet orifice sizes and types were then compared to provide insight into the influence of the various single-orifice spargers under various flow rates on the gas–liquid interface area.
2. Experimental Setup
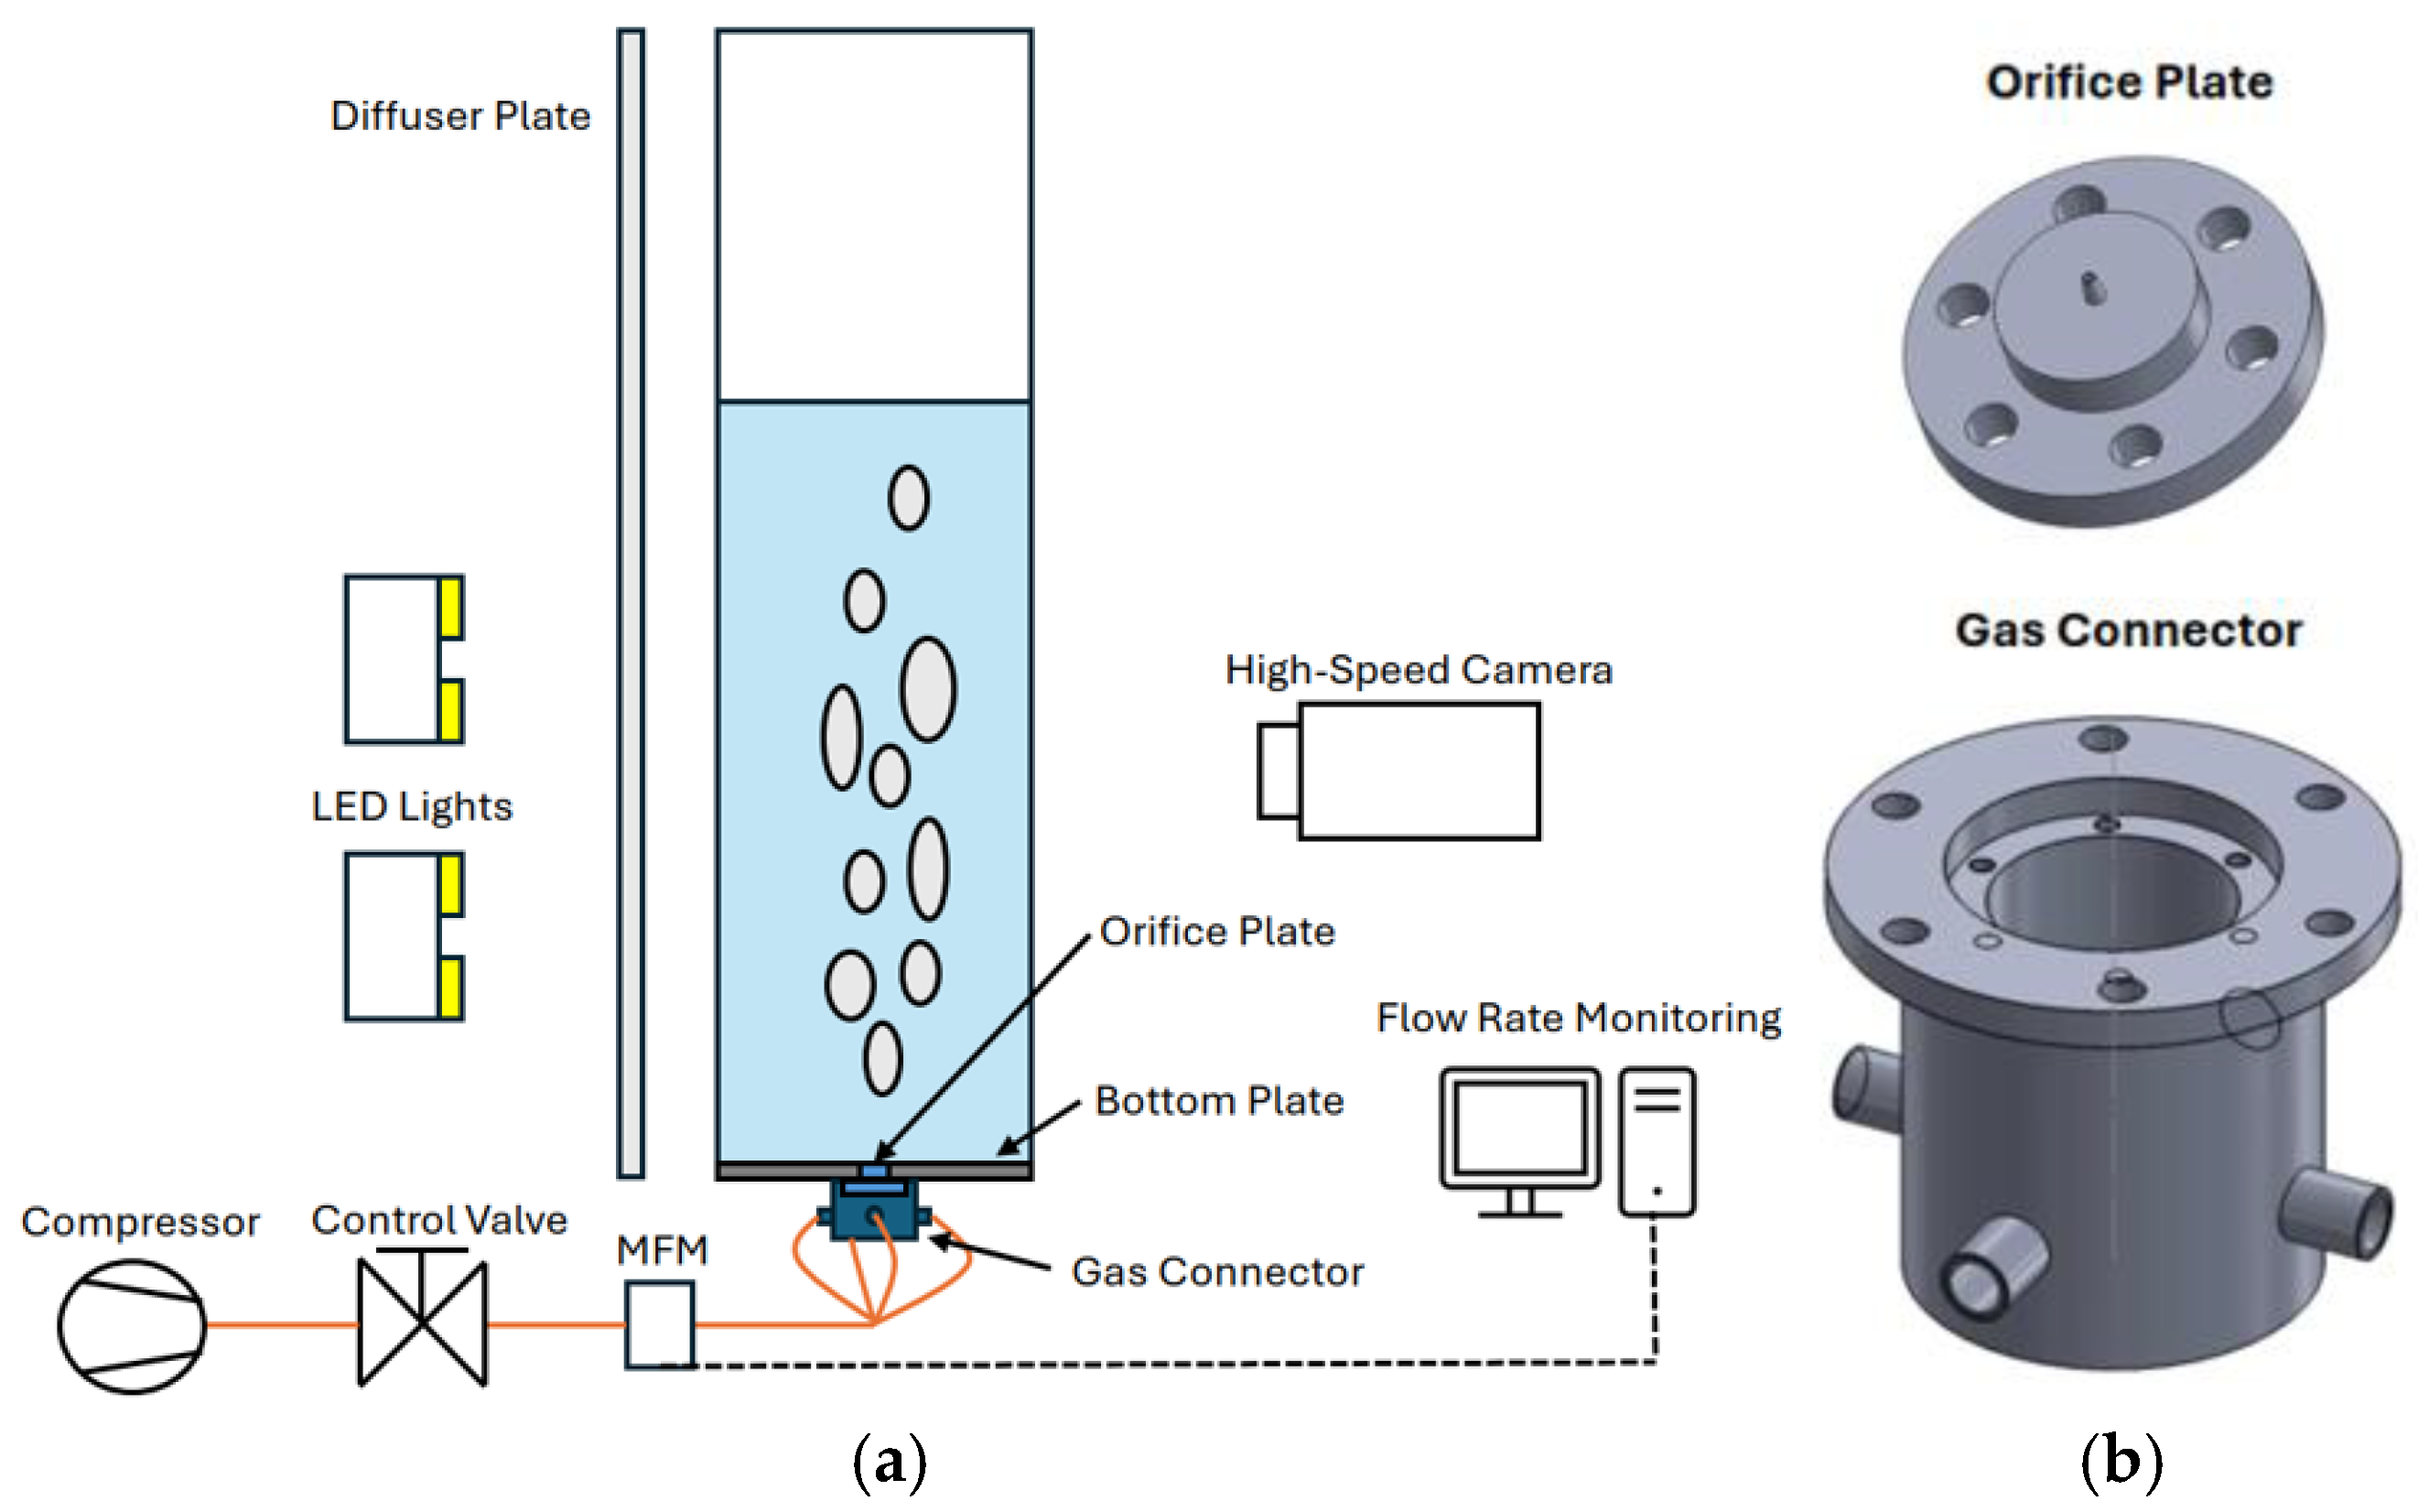
To conduct measurements of the gas holdup and phase surface, we adapted a bubble column setup to precisely meet the requirements of our study. The bubble column had a square cross-section with dimensions of 20 cm × 20 cm, with a water height of approximately 75 cm (±2 cm). The column was connected to the atmosphere at the top to maintain constant pressure. Regular tap water was used as the liquid medium (pH: 7.8; conductivity: 244 μS/cm). The interchangeable single-orifice inlet was positioned at the bottom of the column in the center of the column’s bottom plate. Airflow was provided by an oil-free air compressor, while the flow rate was controlled by a needle valve. A mass flow meter (MFM) was used to measure the flow rate.
Figure 1a shows the overall schematic of the experimental setup.
The inlet section consisted of three components: a bottom plate made of aluminum, orifice pieces made of polyoxymethylene (POM), and a gas connector. The compressed air was introduced from four different directions into the gas connector and then released from the nozzle through the orifice, which was placed on top of the connector part (
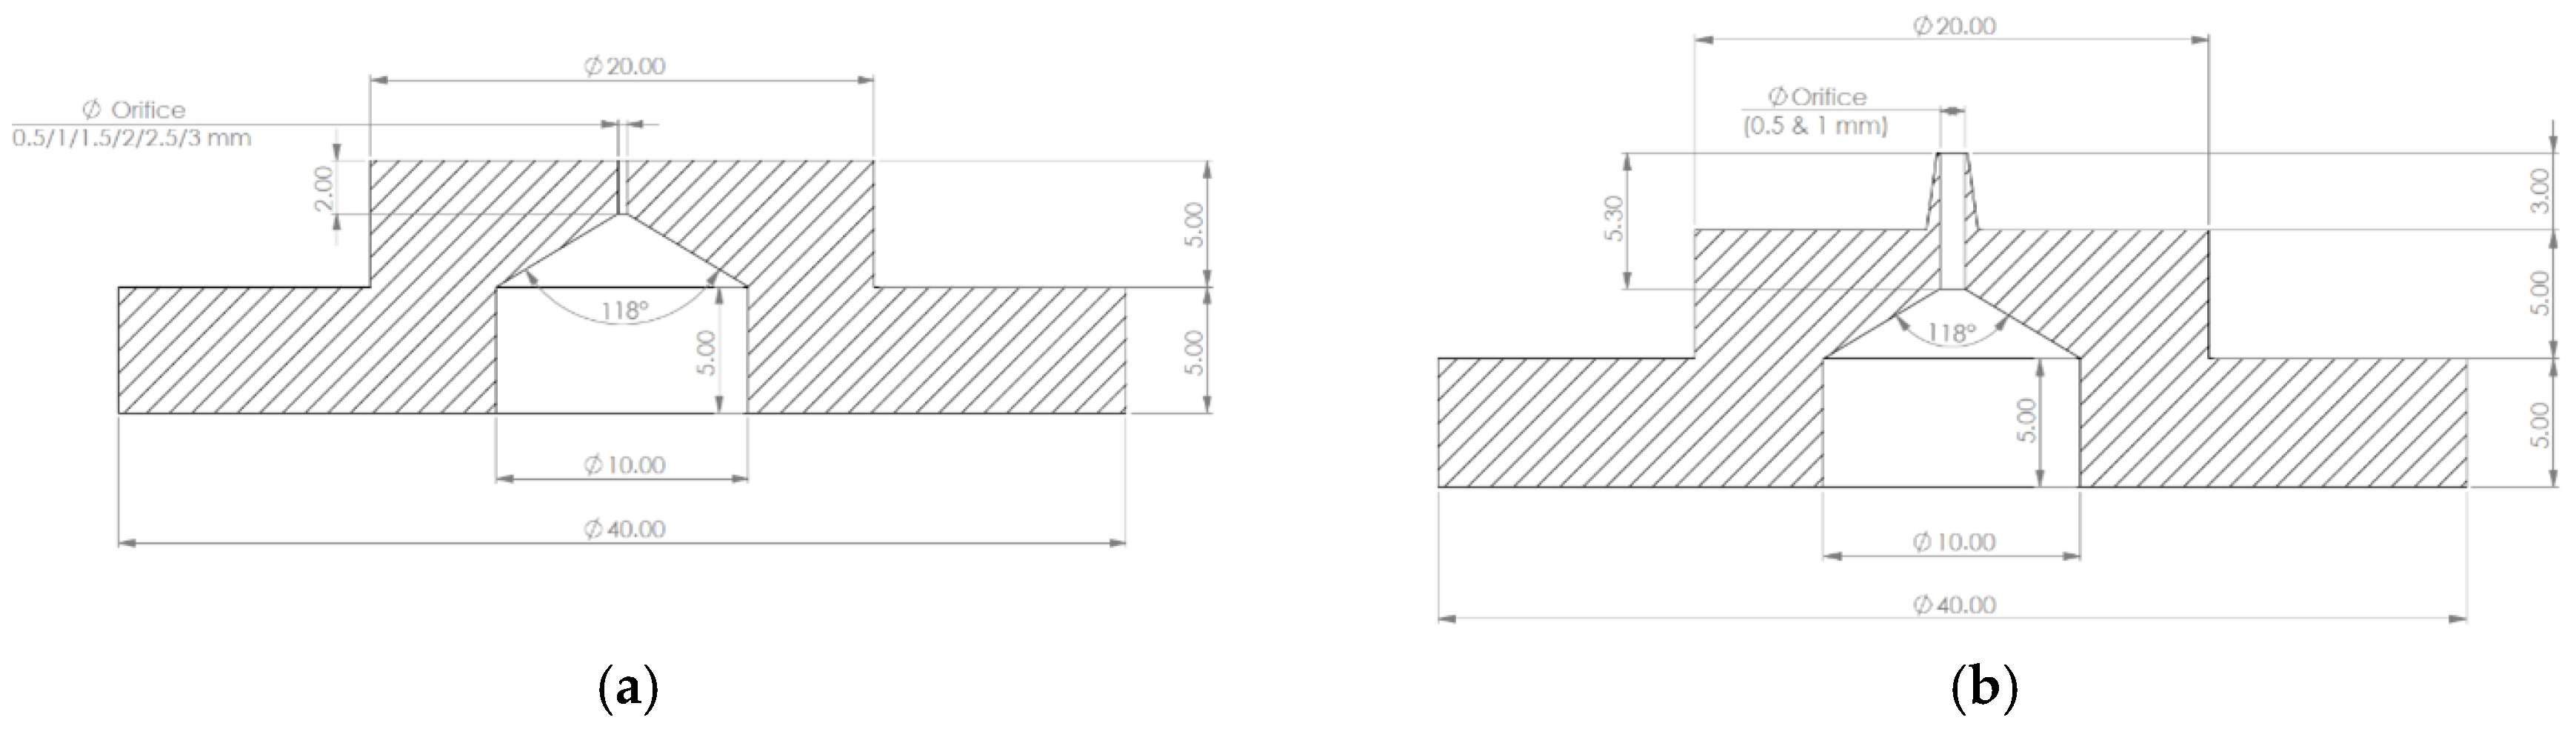
Figure 1b). This configuration ensured uniform air distribution within the component and a stable flow rate at the orifice. The assembled orifice plate and gas connector were then mounted to the underside of the bottom plate of the bubble column. This design allowed for seamless interchangeability of the tested orifices via a screw connection that connected the orifice piece and the distributor to the bottom plate, enabling the investigation of the effects of different hole sizes of the gas inlets without the need to dismantle larger parts of the bubble column. Two types of single-inlet spargers, namely single flat orifices (
Figure 2a) and single needle-type inlets (
Figure 2b), were evaluated. The specific types and orifice dimensions that were investigated are shown in
Figure 2, and the orifice sizes observed during this study can be seen in
Table 1.
The mass flow meter (MFM—type: Omron D6F-05N2-000) utilized for the measurements had a measuring range of 0.5–5 L/min. The analog output of the MFM was interfaced with an Arduino Mega, and the resulting data were displayed on a computer. To ensure accurate flow rate measurements, the MFM output was calibrated using a flow definer (MesaLabs Bios DryCal Definer 220, manufactured by Mesa Laboratories Inc., Butler, USA). The following superficial gas velocities were selected for the measurements: 0.29 mm/s, 0.5 mm/s, 0.75 mm/s, 1.04 mm/s, 1.53 mm/s, and 1.9 mm/s.
Notably, the voltage output of the MFM introduced a measurement inaccuracy of ±0.12 V. For imaging purposes, a high-speed camera (type: Kron Technologies Chronos 1.4) was employed with the resolution set to 1280 × 1024 pixels and the framerate set to 1057 fps. This configuration ensured detailed observations of the bubble behavior and phase interactions, contributing to a comprehensive understanding of the experimental data. The shutter speed was set to 680 microseconds. The camera, positioned 1.78 m from the object, captured a 40 × 20 cm field of view using a lens with a 40 mm zoom, set to a focus of 1.5 and an iris aperture of F4.
The use of two-dimensional projected images is currently the most prevalent method for studying multiphase media [
33]. The authors employed the shadowgraphy approach, as diffuse backlighting and multiple light sources provide an improved visualization of the bubble surface topography [
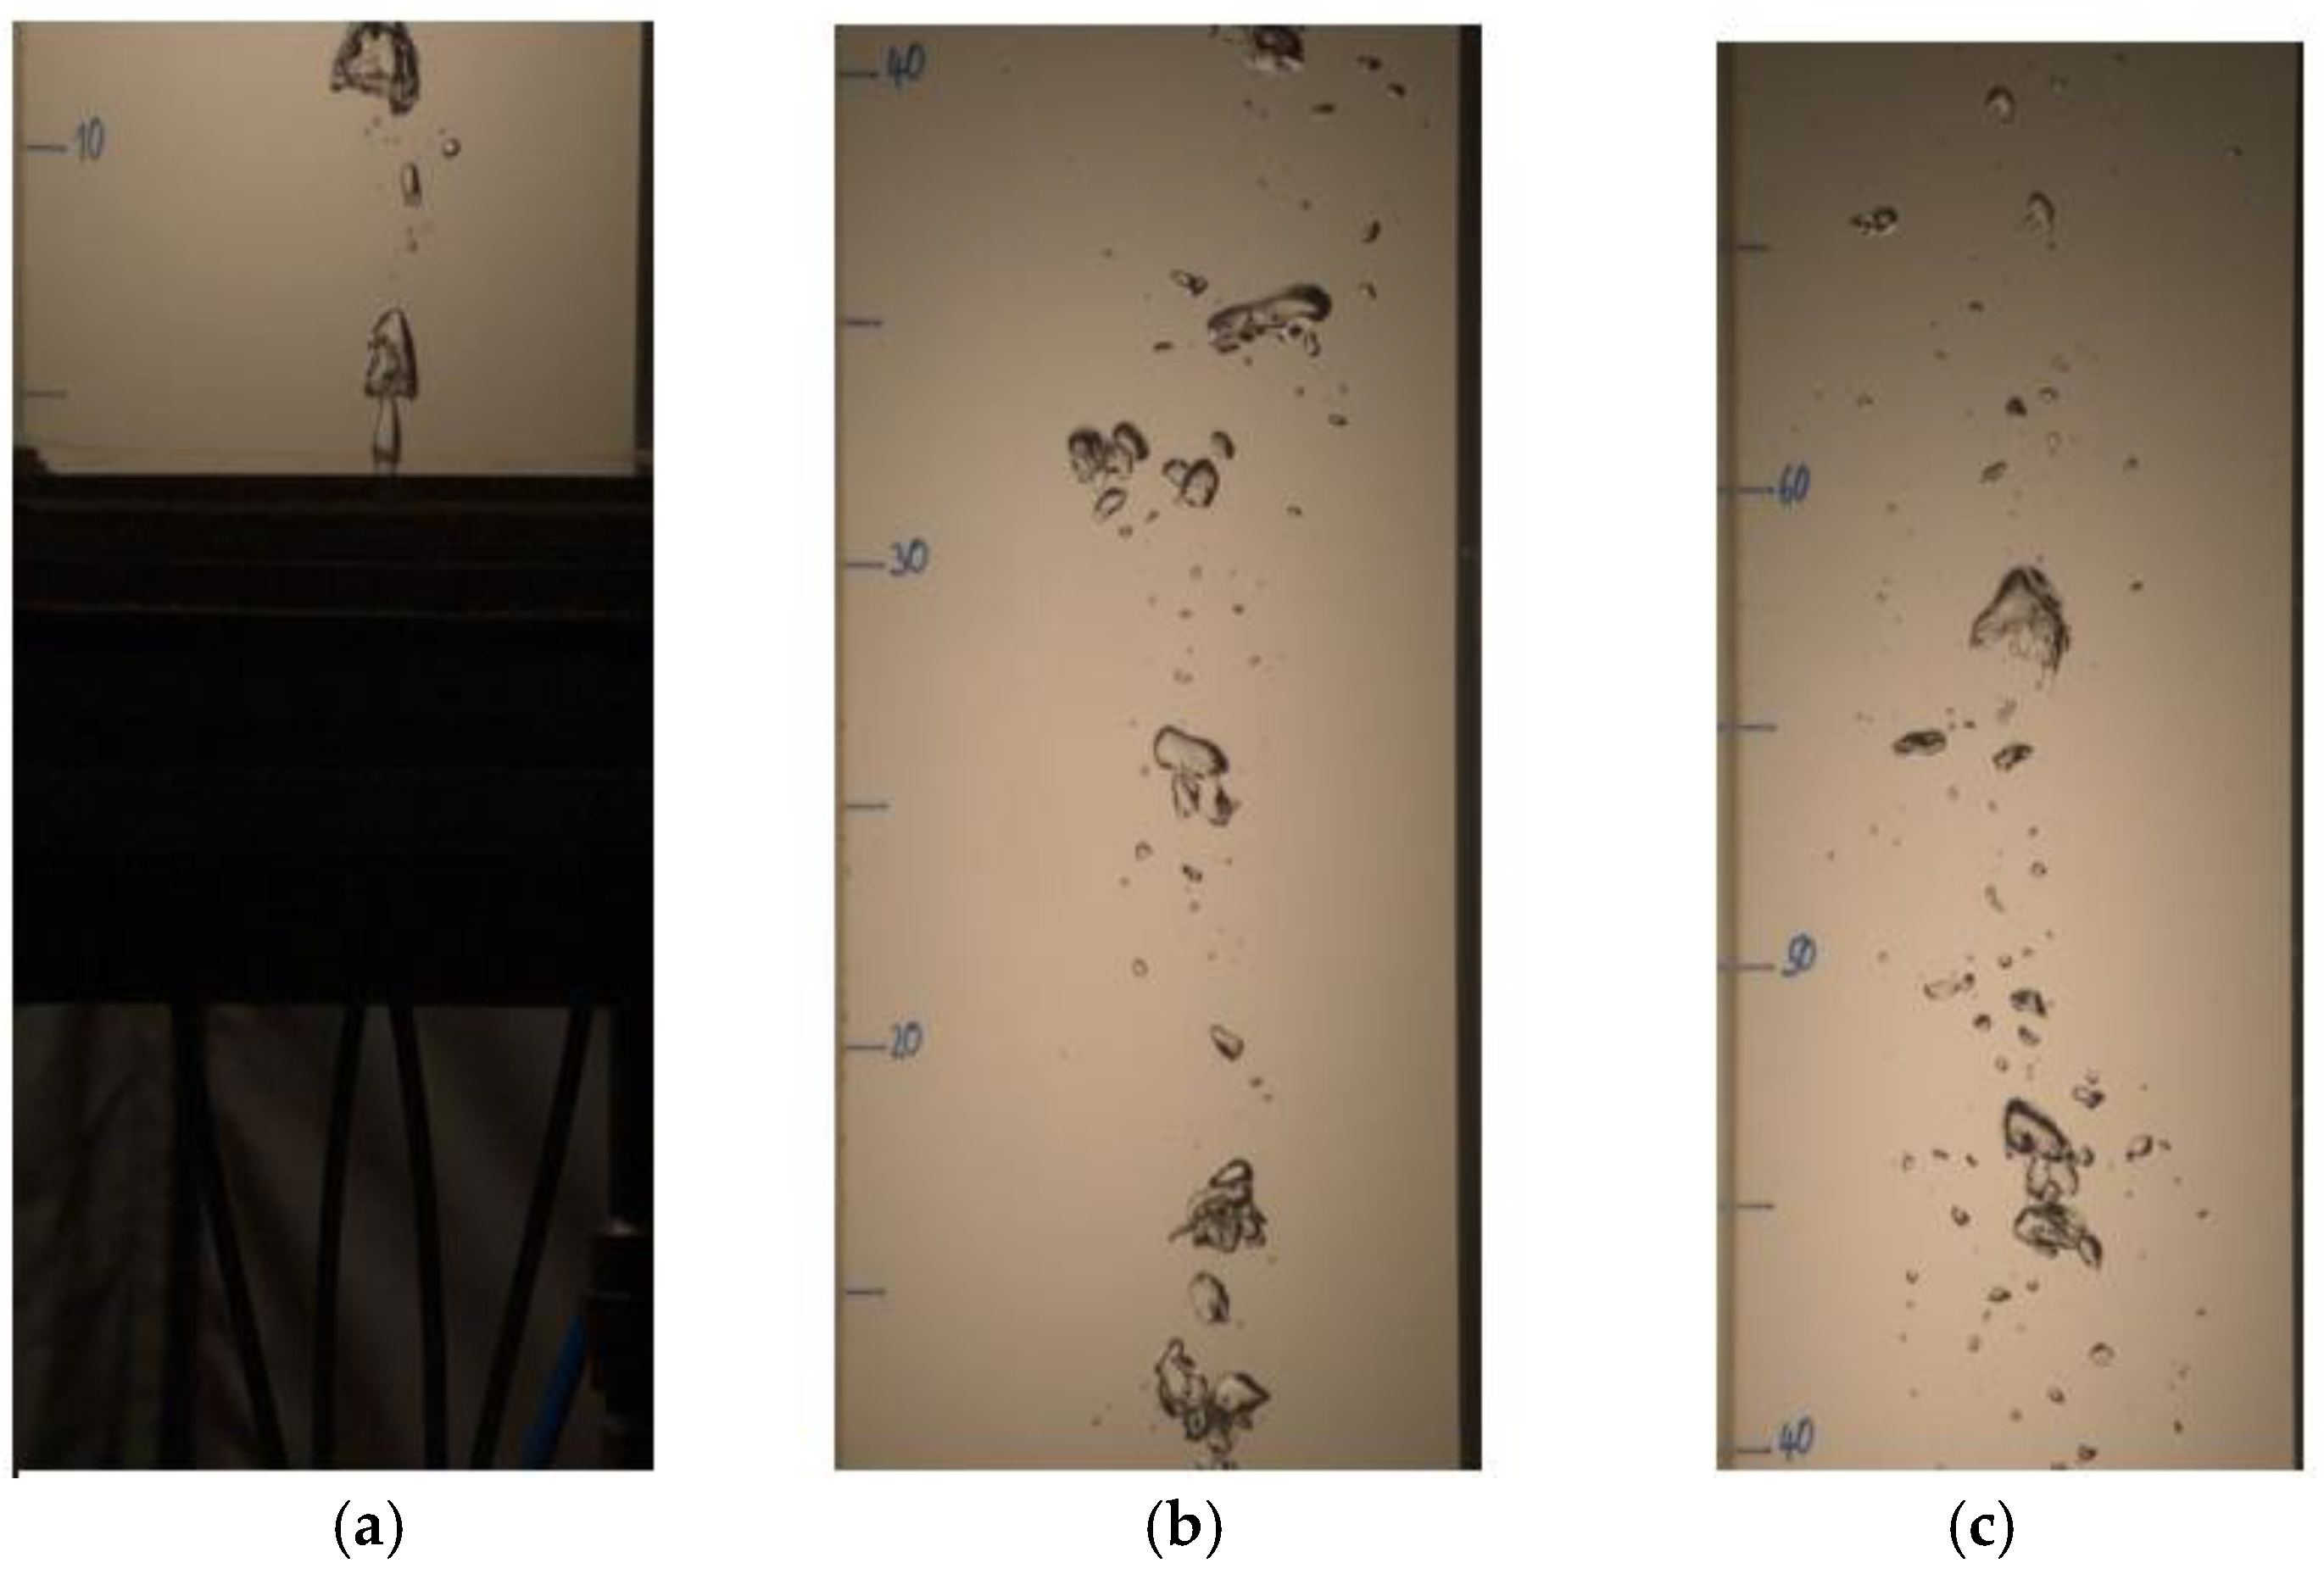
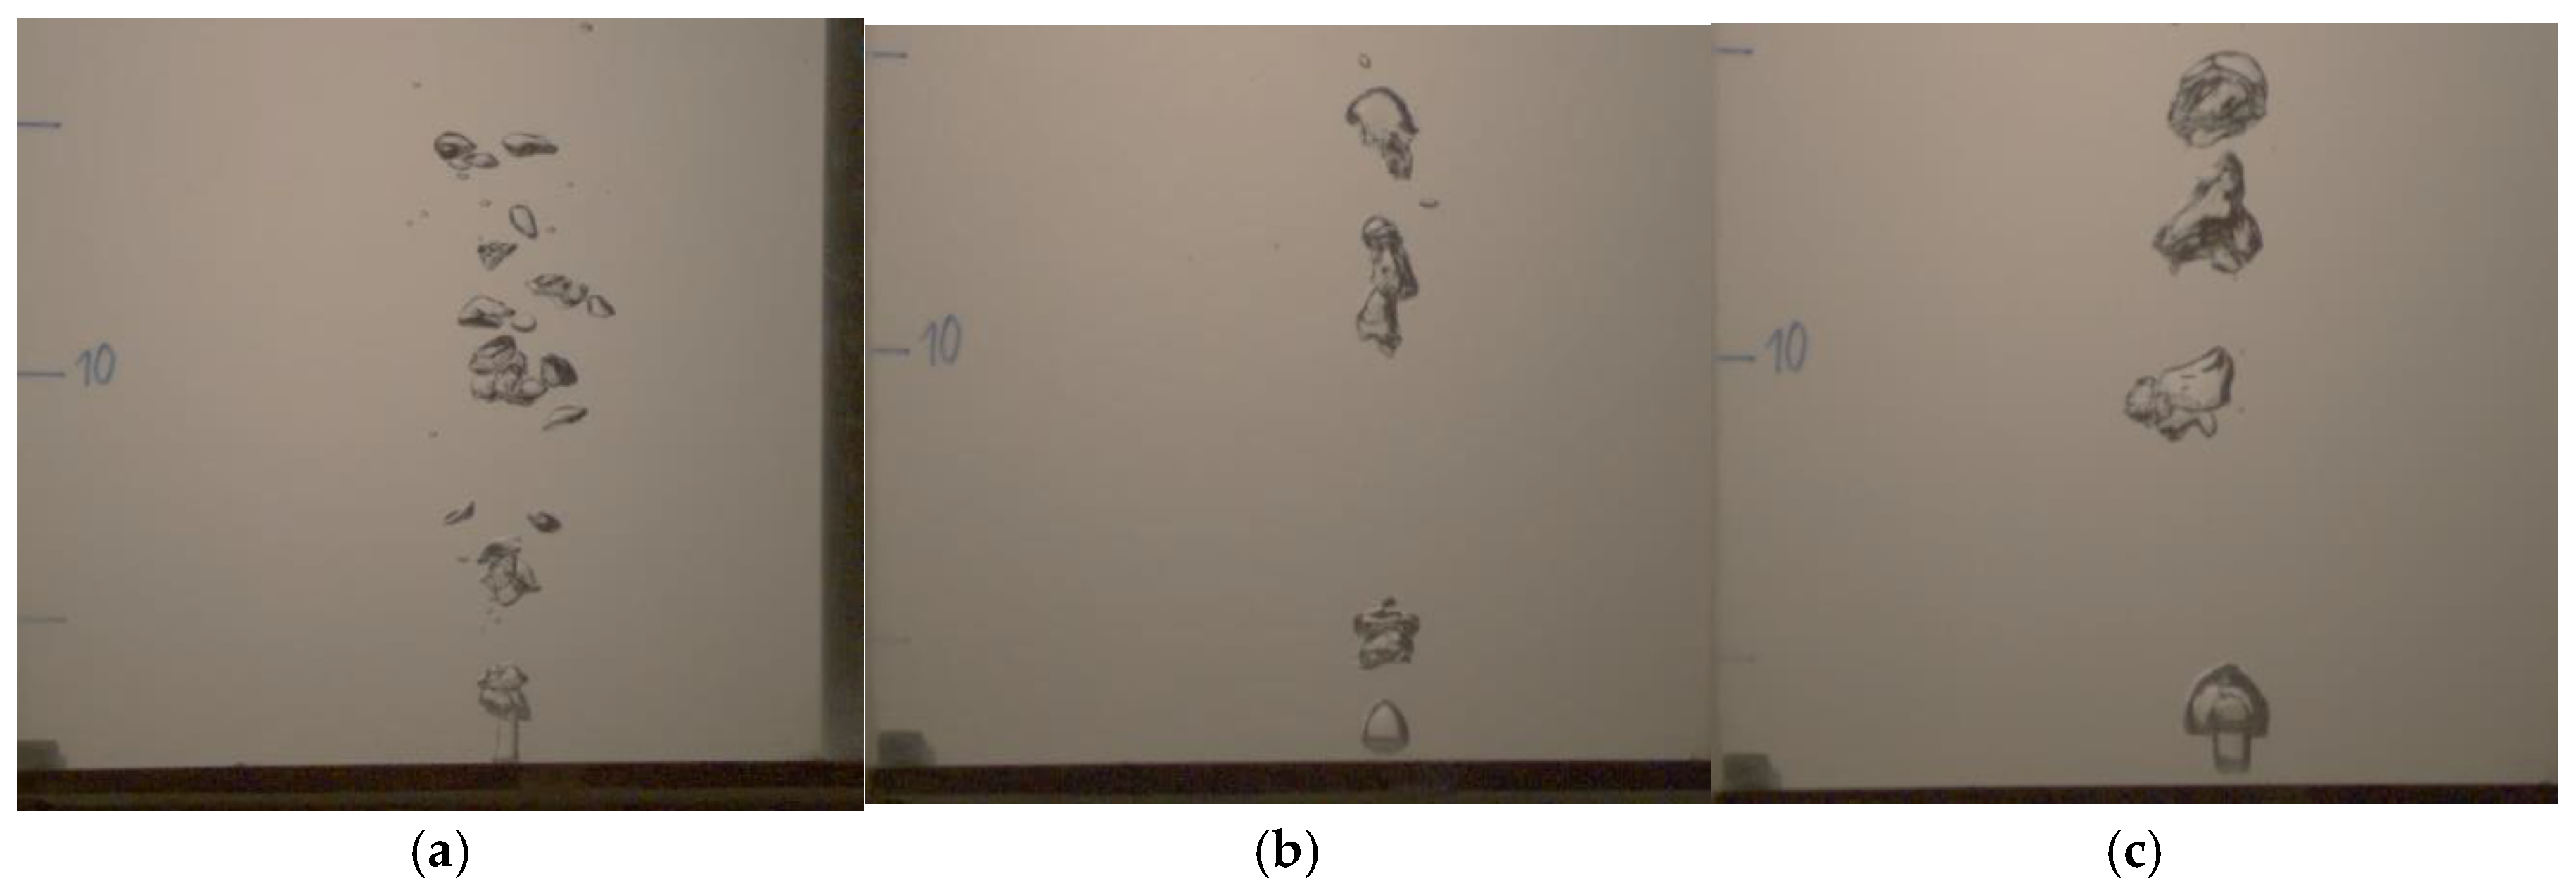
34]. LED lighting was used to ensure uniform illumination in the observation area. During imaging, the light source was placed opposite the camera and positioned behind the bubble column. To ensure high-quality images in the shadowgraphy mode, a plastic plate was inserted as a light diffuser to improve light uniformity in the imaging area and to prevent oversaturation of the camera. This plastic plate was also marked with a height scale to achieve the correct scaling of the images during analysis. The 60 cm evaluation height of the bubble column was divided into three sections during imaging. This approach ensured consistent lighting and contrast across all sections, maintaining a uniform image quality for an accurate analysis using the image processing algorithm. A set of shadowgraphy images at the three different sections can be seen in
Figure 3.
Figure 3a shows the region near the inlet orifice. Any details of the base plate and screw connections could lead to problems in the subsequent image analysis due to the higher contrast of the components in the images. To avoid this issue, the imaging perspective was chosen to position the bottom plate as the horizon. Using this imaging method, the different inlets were evaluated at the specified flow rates and then subjected to further image analysis.
Figure 3b shows the flow feed at the second height section from approximately 10 to 40 cm, whereas
Figure 3c illustrates the third and highest section of the column. The observed range for image analysis in this third section was set to a maximum of 60 cm.
3. Image Analysis
Considering the optical transparency of the investigated medium, the authors found it reasonable to utilize photometric methods supplemented by advanced mathematical approaches. Applying optical methods helps to avoid any impact on the object of study and prevents disturbances to the gas–liquid interface area.
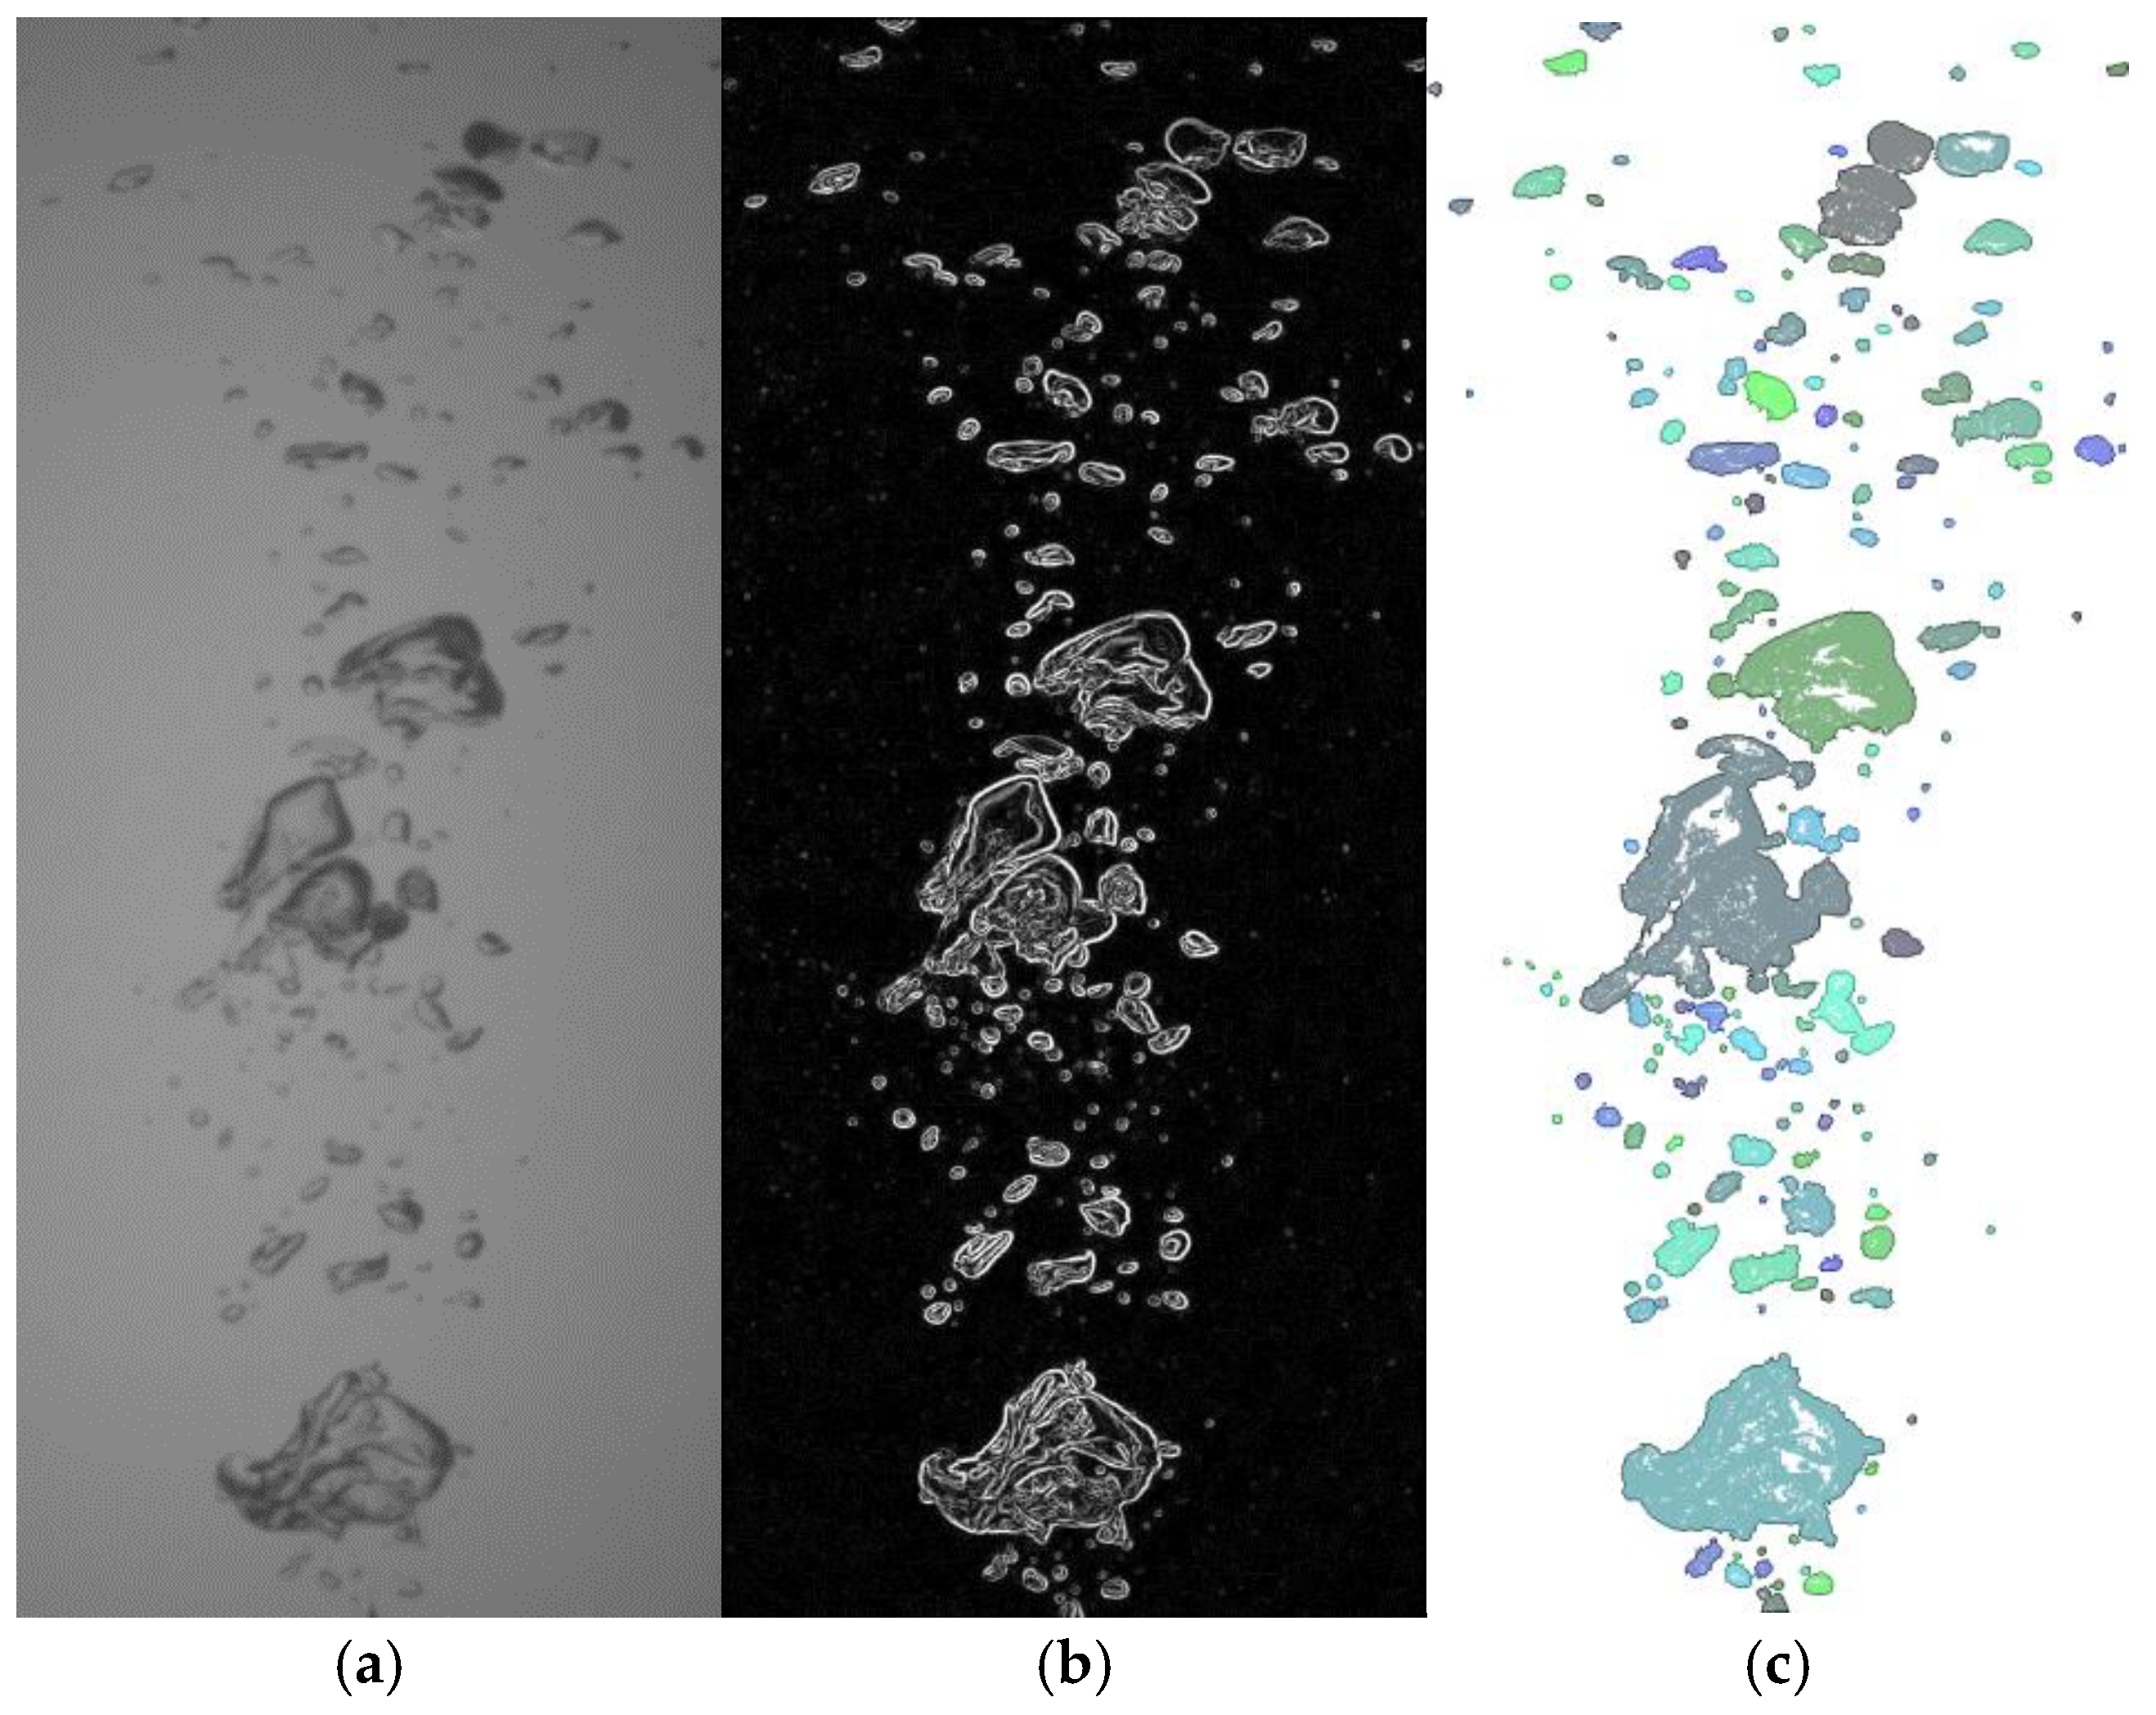
The application of the shadowgraphy technique and the induced light refraction at the gas–liquid interface resulted in the formation of a dark rim along the bubble’s contour. At the same time, the inner (central) region of the bubble, where the light remained undeflected, appeared bright [
34]. This approach enhanced the visibility of the bubble’s boundary, facilitating subsequent analysis (
Figure 4a).
Nevertheless, despite these efforts, the images of the bubbles still lacked sufficient contrast. Their edges appeared unevenly delineated, with bold fragments alternating with noticeable gaps (
Figure 3b,c). This inconsistency complicated further analysis.
To address this issue and improve the connectivity of the bubbles’ outlines, a nonlinear method for contour analysis—the Sobel method [
35]—was applied [
36] (
Figure 5a,b). This method utilizes a discrete differential operator to evaluate the brightness gradient at each point in the image. The image was then converted to monochrome mode using the image-threshold-based segmentation technique (
Figure 5b) [
35].
To identify object contours in the resulting image and evaluate their areas and perimeters, the authors proposed a two-color marking system for the investigated objects [
37,
38,
39]. This system assigns specific color characteristics to each object, allowing for unambiguous identification of whether a particular pixel belongs to it. Color characteristics are defined as functions of the object’s number using simple formulas. When processing images of dispersed systems with intricate configurations, this approach preserves the topology of the dispersed phase elements. This technique has been thoroughly described in several publications and has proven effective in processing images of emulsions, porous media, and gas–liquid systems. The results of applying this marking system to the investigated gas–liquid dispersion are presented in
Figure 5c, enabling the easy tracing of the topology of the bubble aggregates.
Subsequently, the contours of the identified objects were automatically traced using a method outlined in [
40]. This method involved selecting a reference point on the contour and identifying the nearest point with the same color value.
Unfortunately, the existing techniques for capturing video of multiphase media are primarily projective, which offer a highly integrated view of gas–liquid interactions. This results in a large number of overlapping bubbles, creating significant challenges at high flow rates. Despite extensive research in this area, a satisfactory solution has yet to be found [
41,
42]. Consequently, the term “bubble” as it relates to the objects in
Figure 4 and
Figure 5 is largely arbitrary, as we were actually observing agglomerates of bubbles. Therefore, our aim was not to identify individual bubbles or determine their size distribution. Instead, we focused on studying the distribution of the “gas mass” across the column’s cross-section at various heights, which allowed us to describe the trends and dynamics of the process.
So, the main objective at this stage of investigation was to acquire integral values of the gas holdup S and phase surface P at different height levels of the bubble column, as well as the distribution of these values across the bubble column’s diameter in a planar section of the column. In this context, the term “planar section” refers to the 2D projection of the bubble column captured in an image, from which the gas mass and phase surface were calculated. Around 1500 frames were evaluated for each measurement point during the image analysis to ensure sample representativeness. The observed quantities were then averaged to identify overall trends in the gas holdup and phase surface for the different orifice types and diameters.
The value of the gas holdup at specified height level
h was determined as the sum of the areas of gas bubbles within the corresponding
h ± W/2 band, while the phase surface values were determined as the sum of the perimeters of gas bubbles in the same band (
Figure 6a). To normalize these values, both parameters were divided by the width
W of the corresponding band of the bubble column. The use of dimensionless parameters ensures the transferability of the results and allows for comparison with data obtained by other researchers under different conditions. In this study,
W = 50 mm, and the height levels
h = 50, 100, 150, 200, 250, 300, 350, 450, 500, and 550 mm. The origin of the coordinates was set at the nozzle center. Calculations were performed using the prepared images obtained from the imaging routine, employing numerical integration methods and an approximation model for describing perimeters [
43].
Figure 6b illustrates the schematic distributions of the gas holdup and the phase surface across the diameter of the evaluated section at several of the pre-specified height levels shown in
Figure 6a.
An AMD Ryzen 5 5500U processor (manufactured by Advanced Micro Devices, Santa Clara, USA), operating at 2.10 GHz, took about 4 s to process a single image (1100 × 480 pixels, roughly 10 px/mm), which is displayed in
Figure 6a (central part of column). Consequently, serially processing a set of 1500 images would require approximately 100 min to complete.
4. Results
The individual inlet orifice sizes, consisting of flat and needle-type inlet nozzle geometries, were subsequently analyzed according to the methodology described above. Each nozzle was installed individually, and the gas–liquid interface evolution was observed in an experimental set at the three different height sections under the specified superficial gas velocities. During the measurement of a specific nozzle at a certain height level, the position of both the light source and the camera were fixed. To ensure optimal positioning of the light source and sufficient contrast, a test image was captured and evaluated using the image analysis algorithm. Only after confirming sufficient exposure and contrast through expert assessment, followed by the processing of the test sample, was a complete set of images of the nozzle at different flow rates taken and analyzed. Flow rates during the measurement were recorded using the MFM and calibrated with the data gathered by the flow definer.
Close to the orifice, a difference in bubble-forming behavior was observed for the different orifice sizes. Smaller diameters (
Figure 7a) produced a greater number of bubbles at the same flow rates compared to large-diameter orifices, with an increased degree of coalescence already at short distances from the orifice. Larger diameters showed distinct and uniform large bubbles directly after the orifice (
Figure 7b,c).
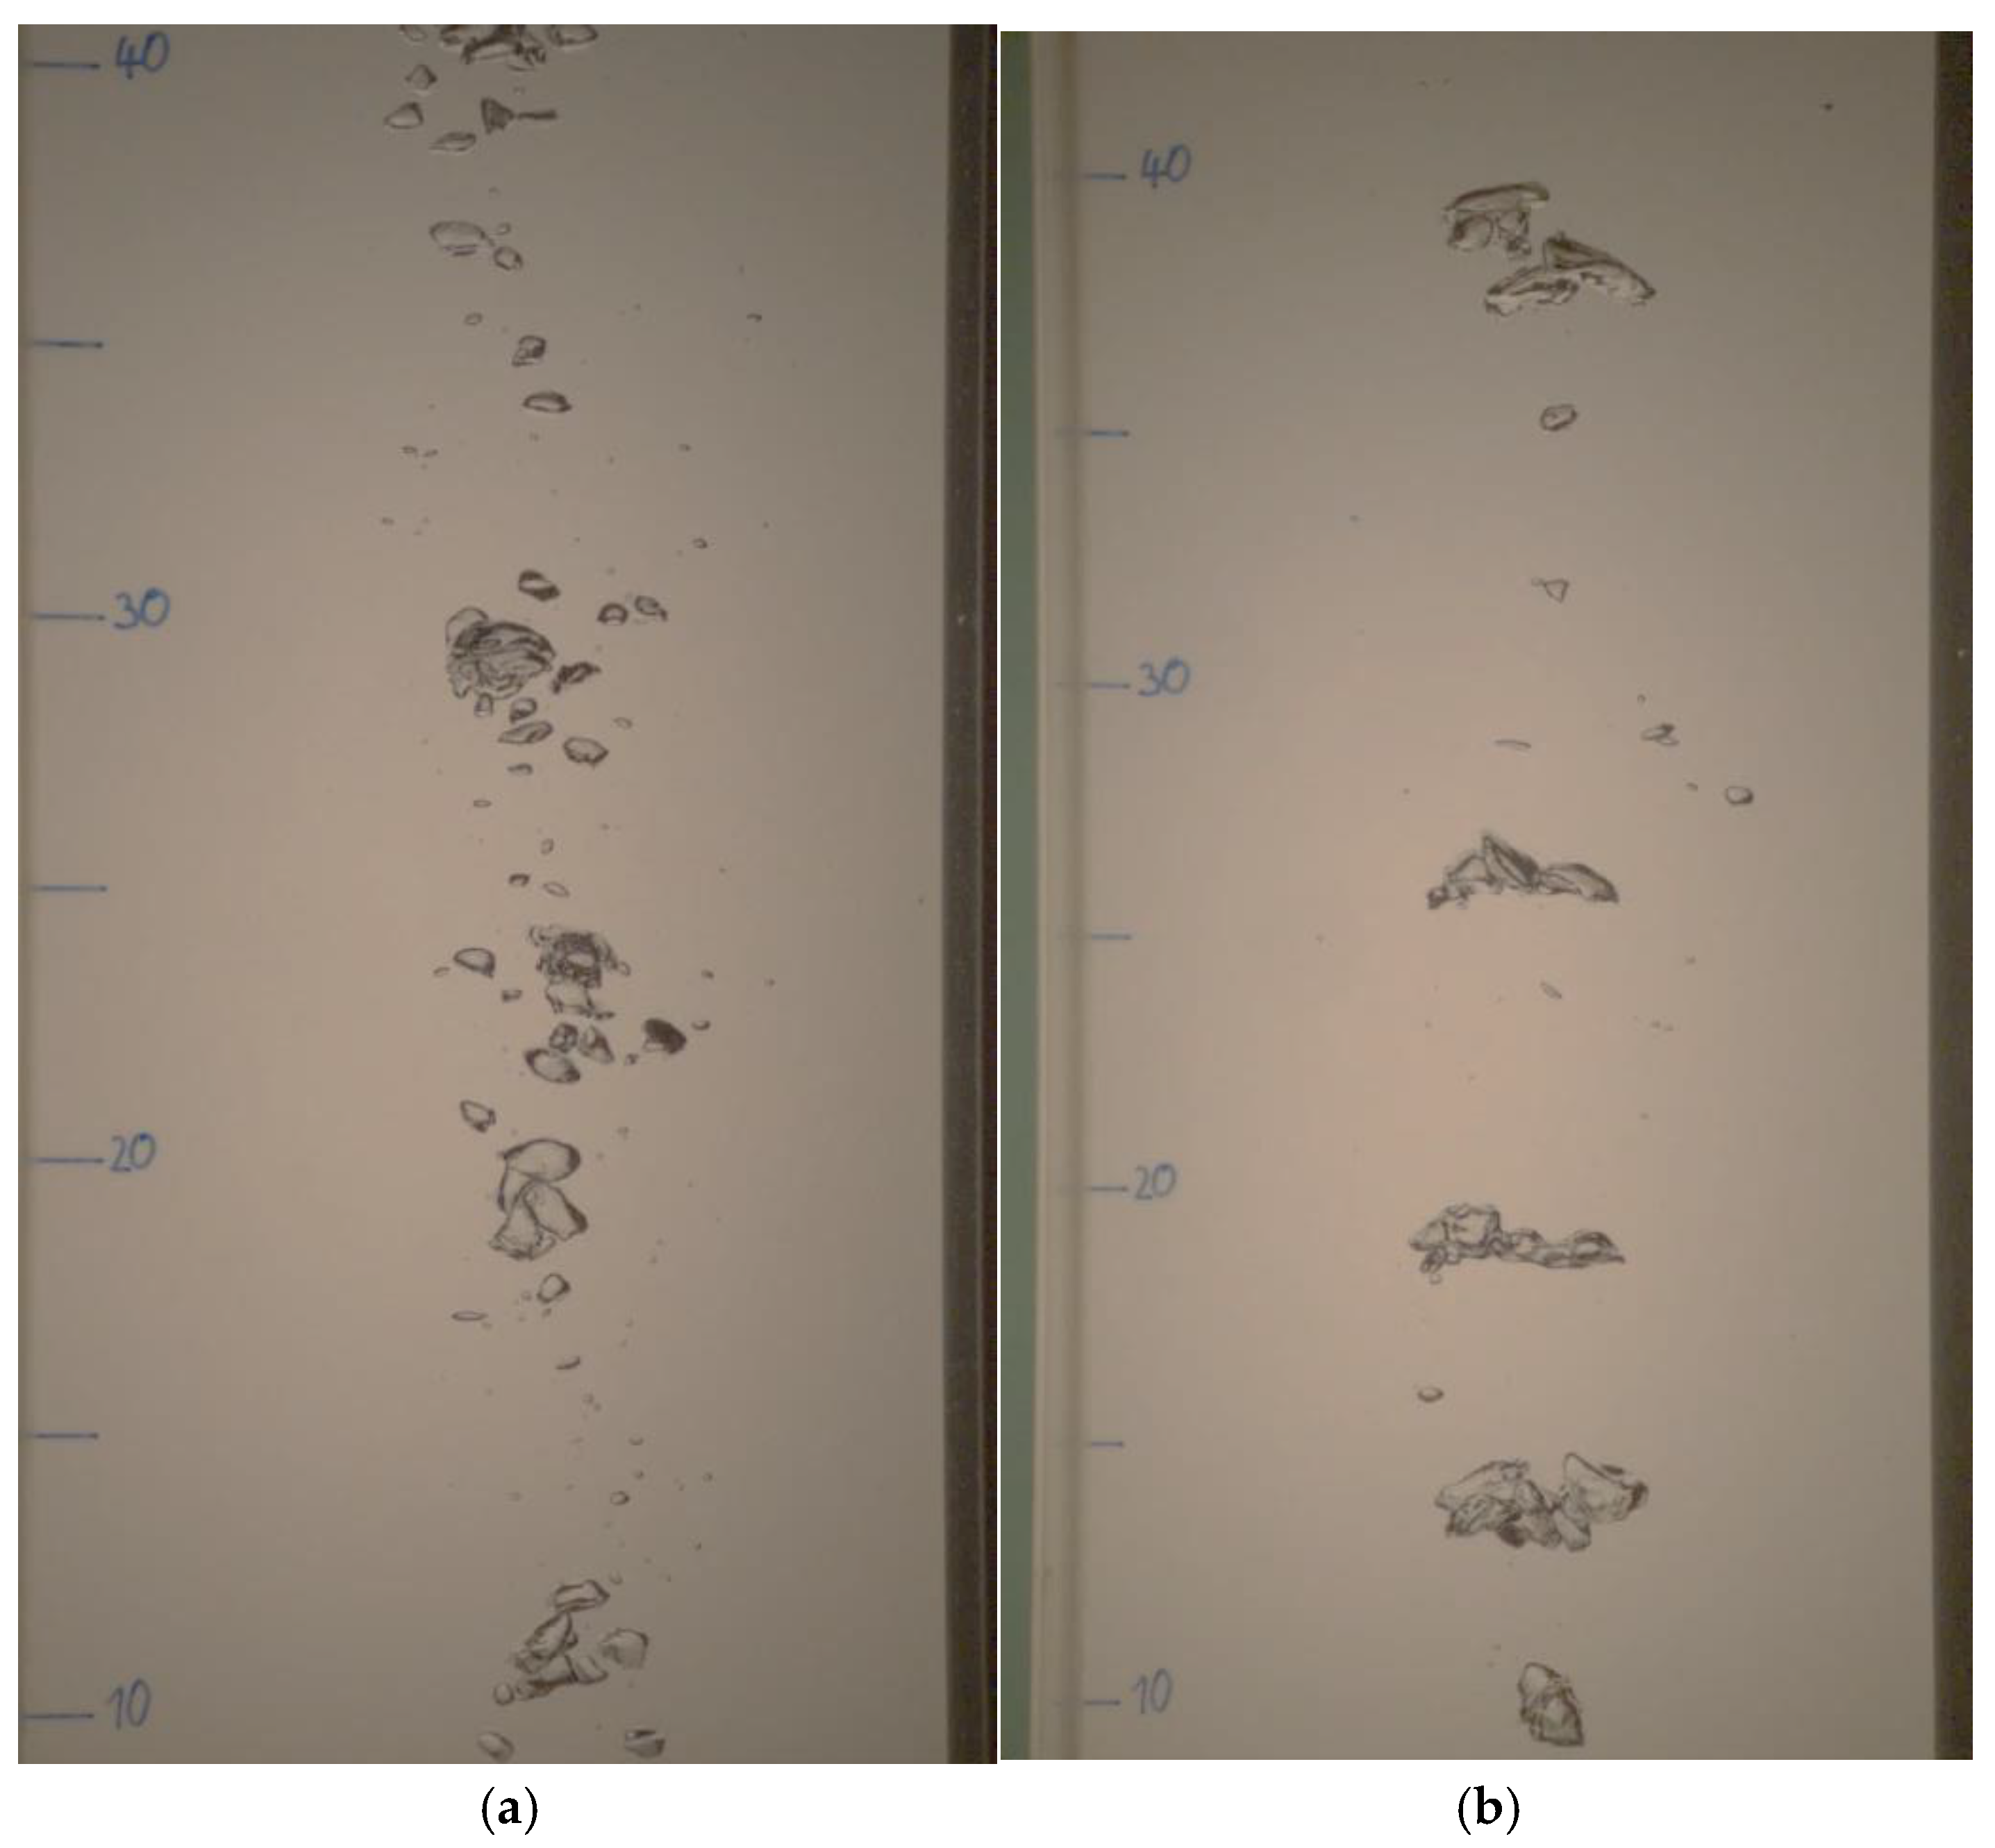
Variation between the different diameters was also seen at larger distances from the orifice.
Figure 8a shows the bubble distribution between 100 mm and 400 mm at a superficial gas velocity of 0.5 mm/s for the 0.5 mm flat nozzle, whereas
Figure 8b depicts the bubble distribution in the same height section and at the same velocity for the 3 mm flat nozzle. At fixed superficial gas velocities, smaller-orifice diameters showed a better distribution than large-diameter orifices.
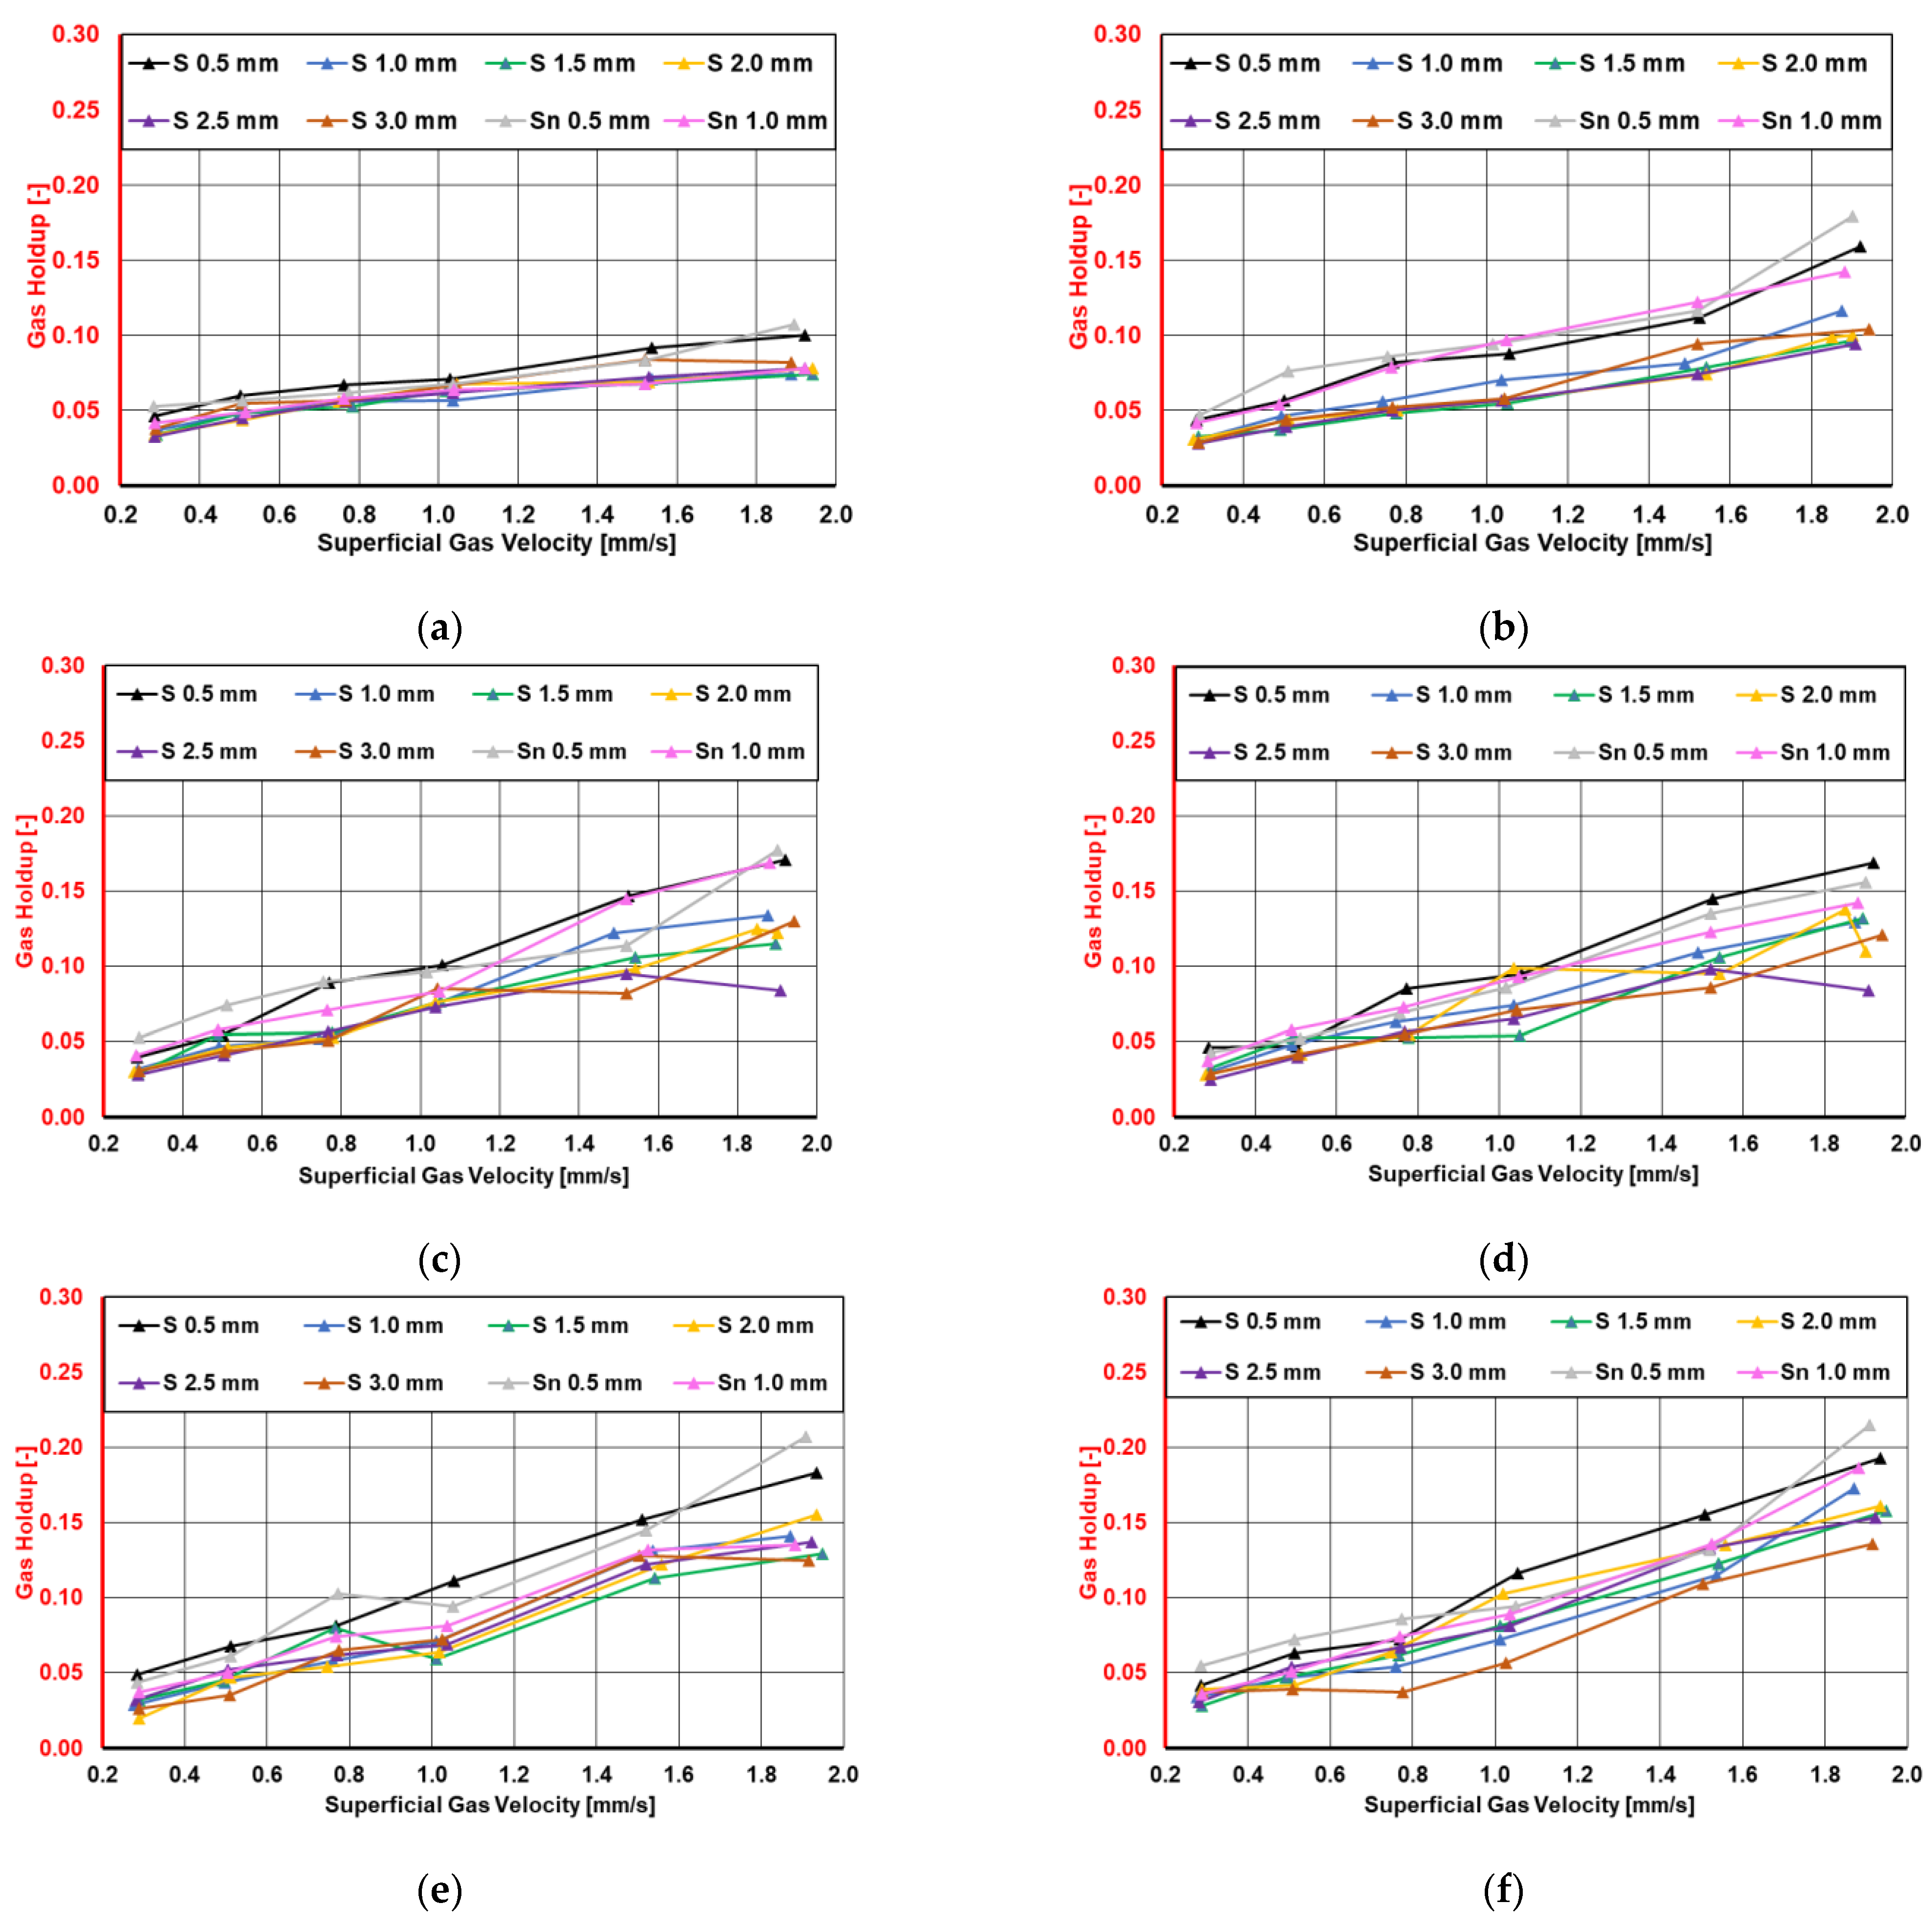
To quantitatively describe the processed images, the image analysis procedure was employed to determine the gas holdup and phase surface of the dispersed bubbles inside the bubble column. As specified in
Section 3, the gas holdup “S” represents the projected area of the gas phase on the observed plane, while “P” denotes the projected phase surface in the corresponding captured image. The various inlet sizes were measured, and the gas holdup (
Figure 9) was plotted at different predefined flow rates and normalized by the bandwidth of the analyzed height section. In the graphs, “Sn” refers to the needle-type inlets. During the experimental procedure, each nozzle was individually installed and measured to ensure accurate data collection. Additionally, separate measurements were taken for different height sections of the column, focusing on superficial flow velocities. Our analysis indicates that a general trend emerged from these measurements, despite some minor outliers in certain readings. The standard measurement uncertainty (Type A) was evaluated for the various injection modes based on the approach outlined in the work of Dorozhovets [
44]. For the summarized values of the gas holdup and phase surface area at a specified height level, the uncertainty did not exceed 0.01 and 0.001, respectively. Since the diagrams in
Figure 9,
Figure 10,
Figure 11,
Figure 12 and
Figure 13 illustrate different interpretations of the same measurement results obtained using the methodology developed by the authors and illustrated in
Figure 6, the assessed uncertainty may be applicable to all the provided diagrams.
The observations shown in
Figure 9 indicate that immediately following the outlet, the precise determination of gas quantity became challenging. As the observation distance increased from the inlet, a discernible pattern emerged, showcasing a tendency of elevated gas holdup towards smaller-nozzle diameters. This trend may be attributed to the increased velocities associated with smaller diameters at the inlet. Consequently, it became evident that diameters up to 1 mm should be prioritized when aiming for a larger desired gas quantity. At certain points, slight deviations in the individual nozzles were observed, which could not be precisely described by this methodology, highlighting the need for subsequent measurement or simulation approaches. For example, nozzle diameters larger than 1.5 mm showed a deviation from the trend toward enhanced gas holdup observed with smaller-diameter orifices. The total gas holdup for the different nozzles can be seen in
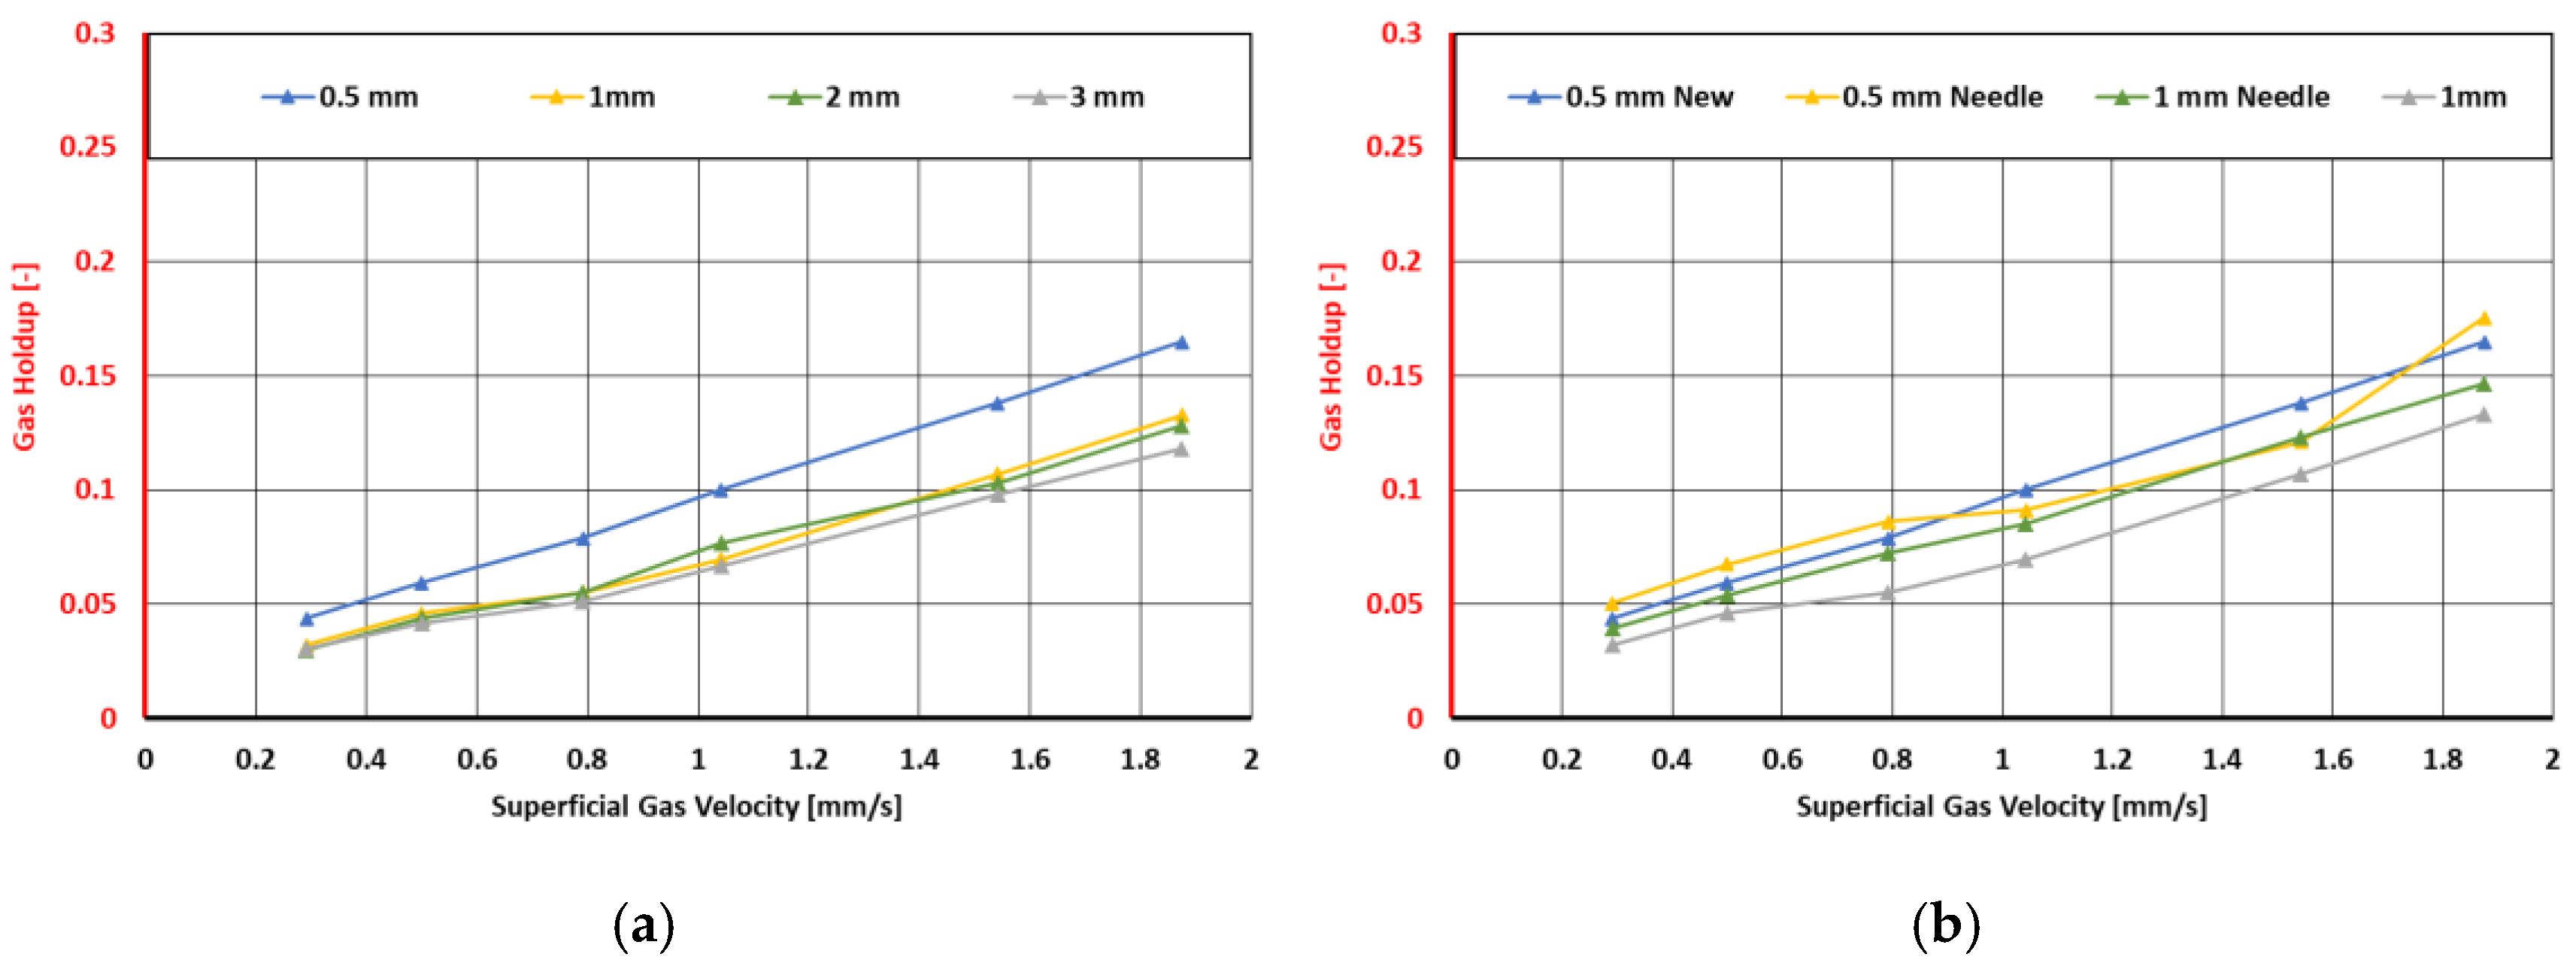
Figure 10. The diameters 1.5 mm and 2.5 mm showed no significant changes compared to the 2 mm and 3 mm nozzles in the total gas holdup. However, when comparing them with smaller nozzle diameters (0.5 mm and 1 mm), a clear trend towards smaller diameters was detected.
Figure 10a illustrates the gas holdup for flat orifices of sizes 0.5 mm, 1 mm, 2 mm, and 3 mm. The gas holdup showed a nearly linear trend in all curves.
Figure 10b demonstrates similar linear behavior when comparing the needle nozzle sizes and the flat orifices. Even with some outliers in the needle nozzle measurement with a 0.5 mm diameter inlet, a trend towards higher gas holdup for needle nozzles is observable.
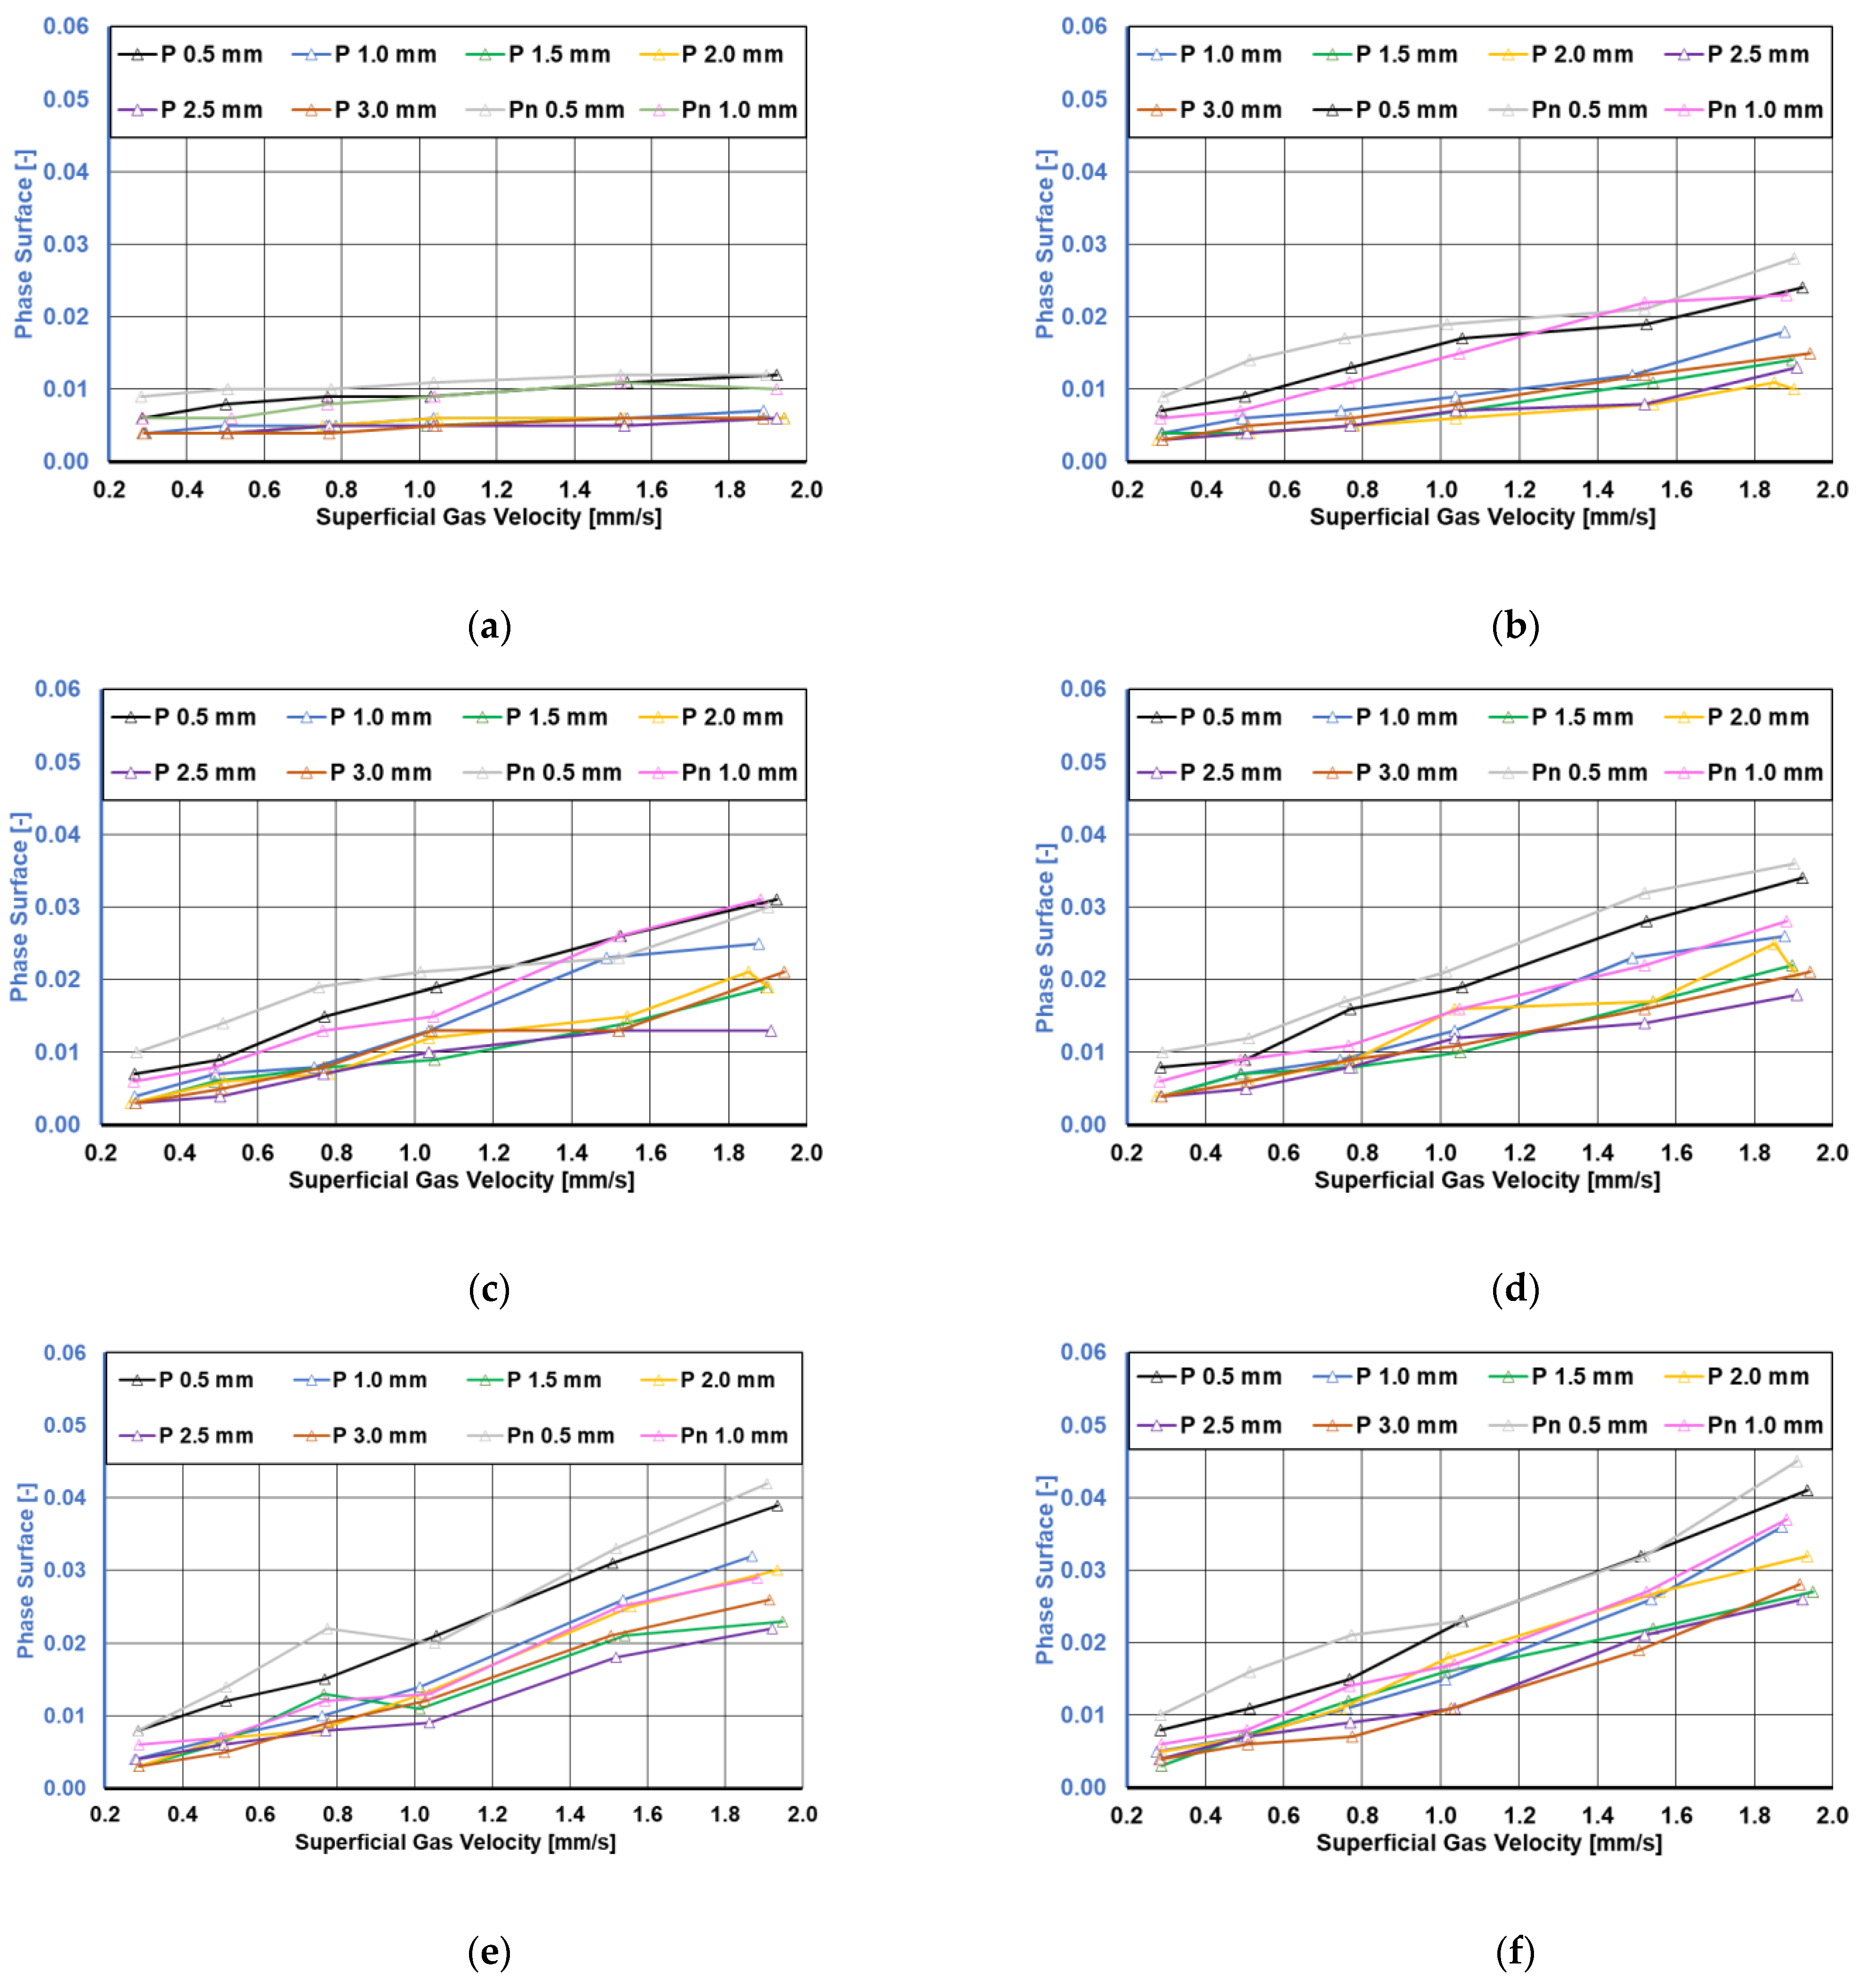
The phase surface showed a similar trend to the gas holdup (
Figure 11). Higher gas holdup was typically associated with a greater number of bubbles, which, in turn, increased the overall phase surface within the measurement volume. The phase surface at different heights can be seen in
Figure 11. At short distances from the inlet, no certain conclusion could be drawn regarding the differences between the different nozzle sizes. However, at greater distances, a clear trend emerged, indicating a higher phase surface of the gas–liquid interface for smaller orifice diameters. Like the gas holdup, the needle-type inlets with diameters 0.5 mm and 1 mm showed the largest phase surface and gas holdup at greater distances from the inlet. This indicates the advantages of smaller nozzle sizes as well as needle-type distributors in enhancing the phase mass transfer areas. Also, slight deviations for nozzle sizes larger than 1.5 mm from the trend of elevated phase surface and gas holdup were seen.
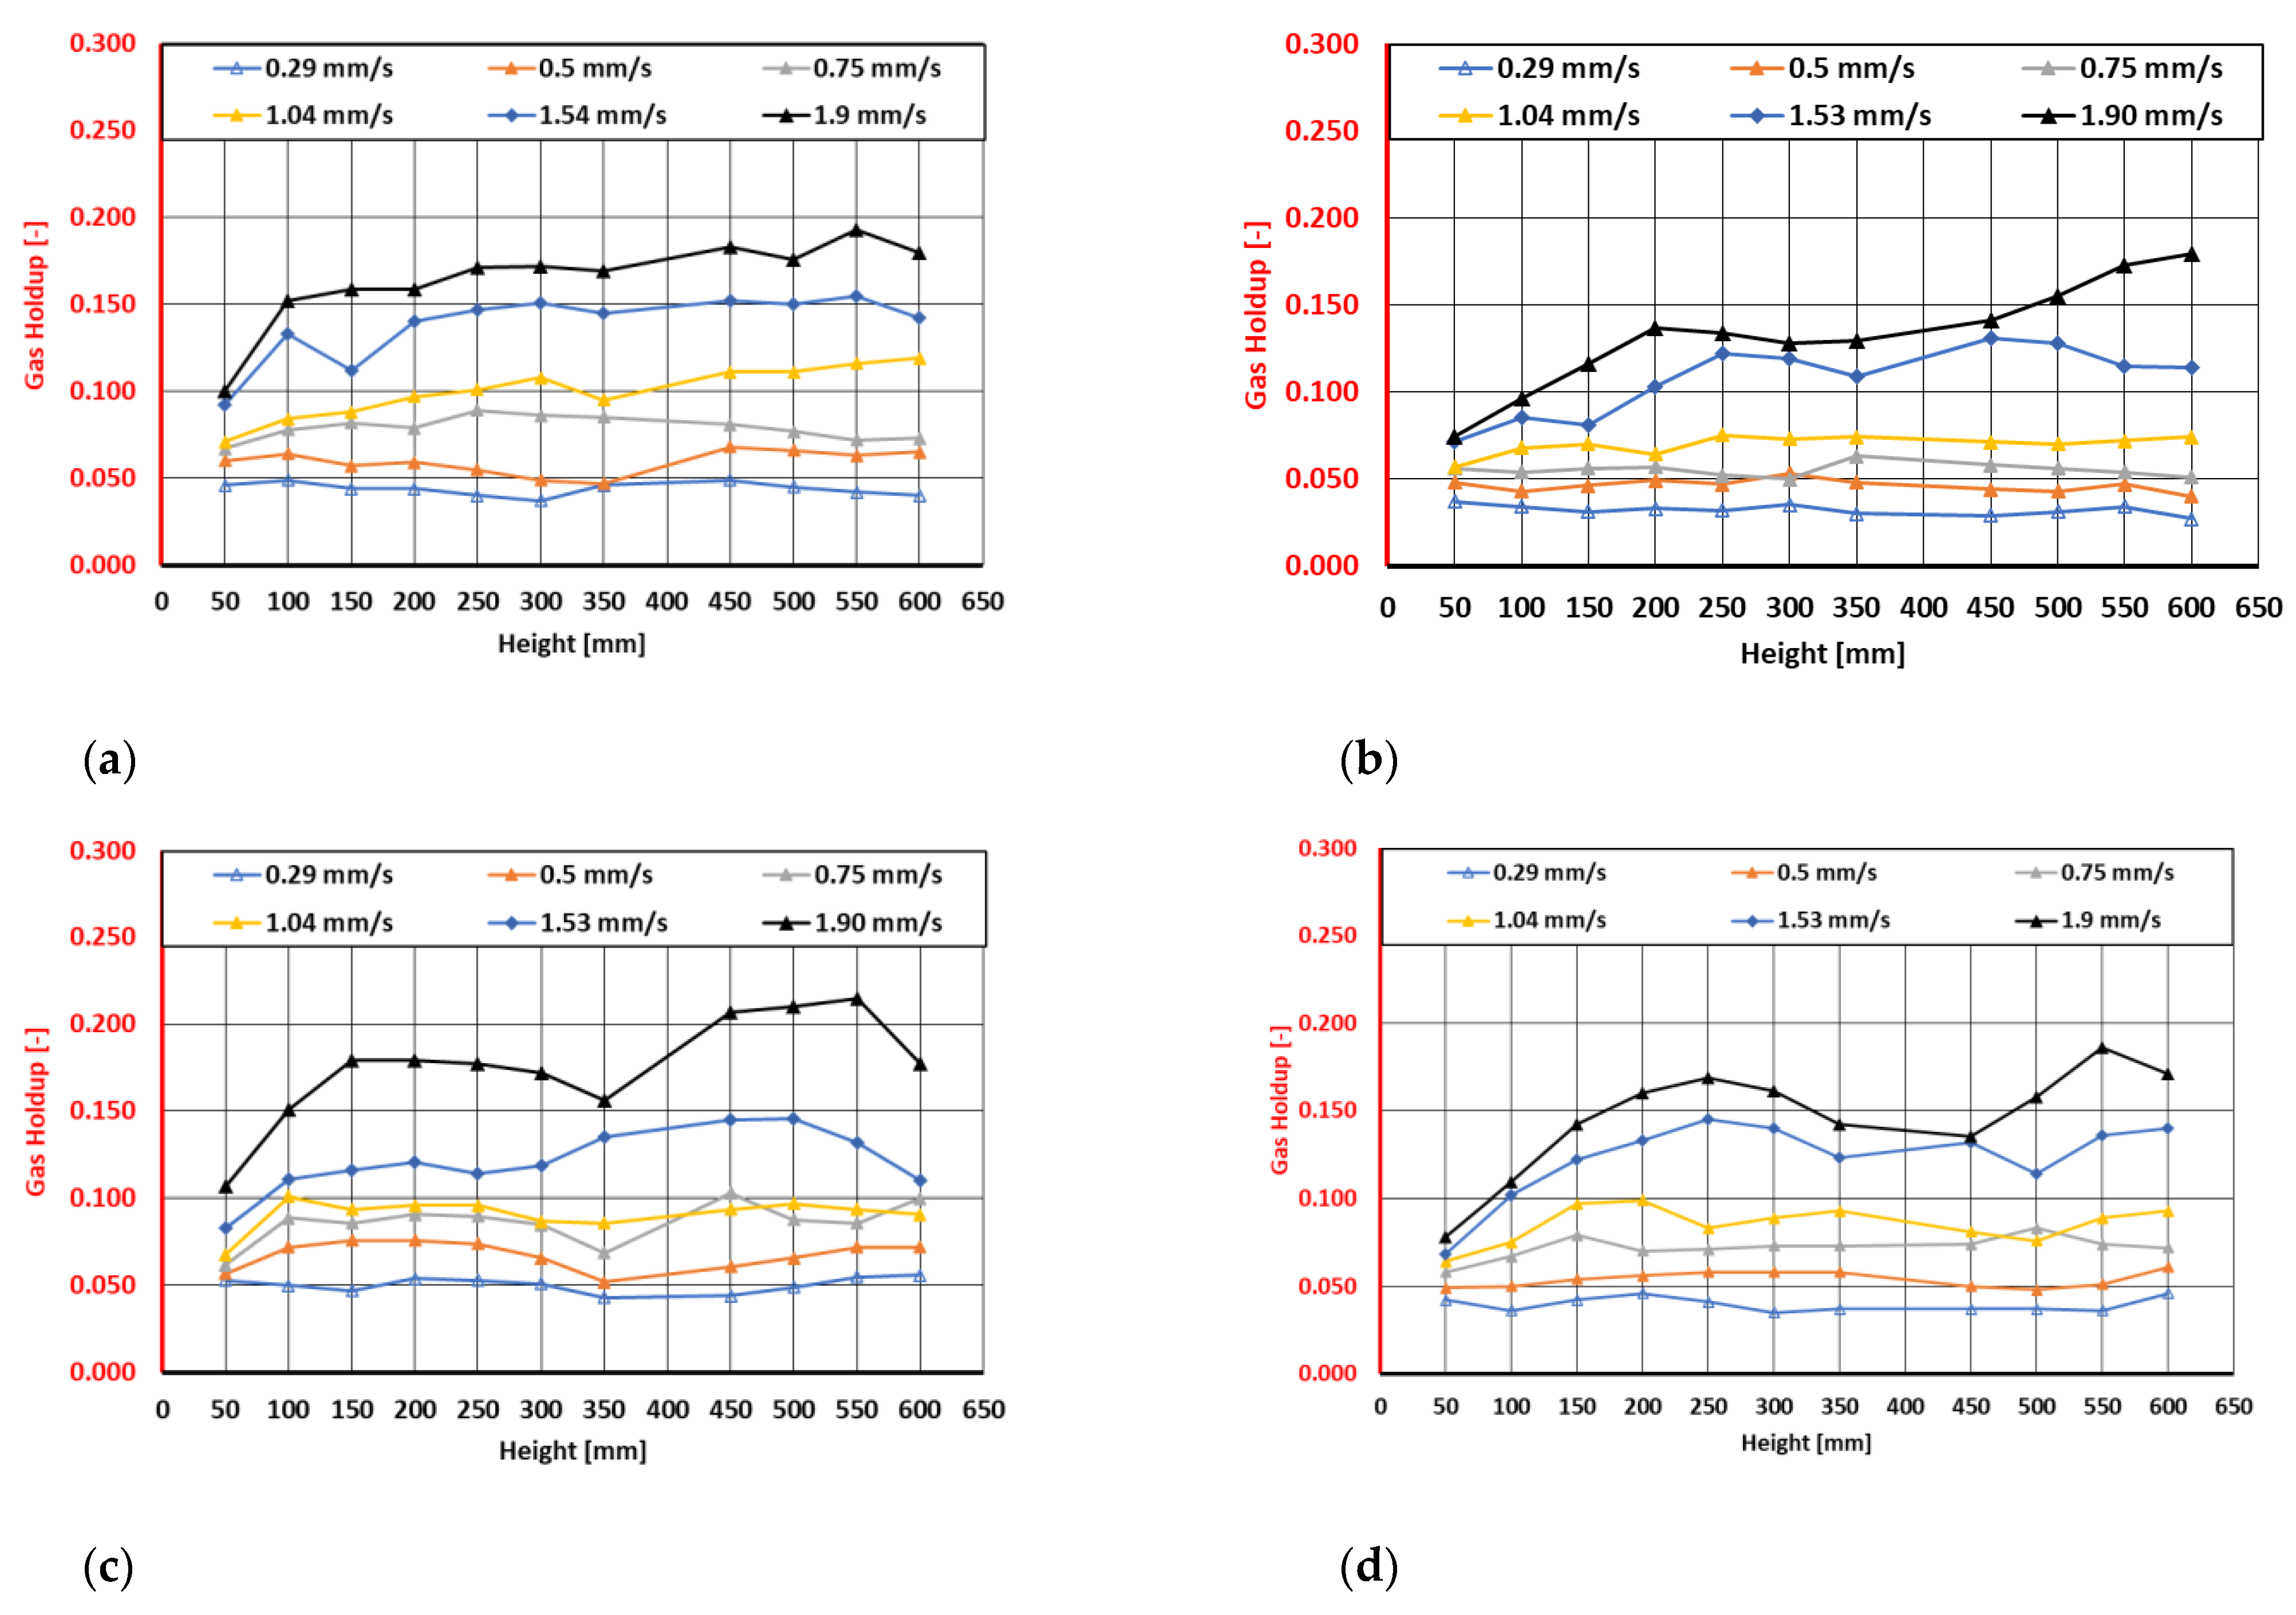
To obtain a closer look at the preferred nozzle sizes (0.5 mm and 1 mm), the gas holdup in the evaluated images and bandwidths at specific distances from the orifice and across different flow rates is compared in
Figure 12. The data indicate that lower flow rates resulted in only a slight increase in the gas holdup across the various height sections, whereas higher superficial gas velocities showed an increase at certain levels.
Additionally, a sudden change at a height of 350 mm was observed. This may be attributed to the captured images, as the deviation occurred at the transition point from the second to the third imaging section. This finding highlights the necessity for future measurements that involve a fixed positioning of the light source and a more rigorous imaging routine for better evaluation of the overlapping sections from the three-image separation of the column in this study.
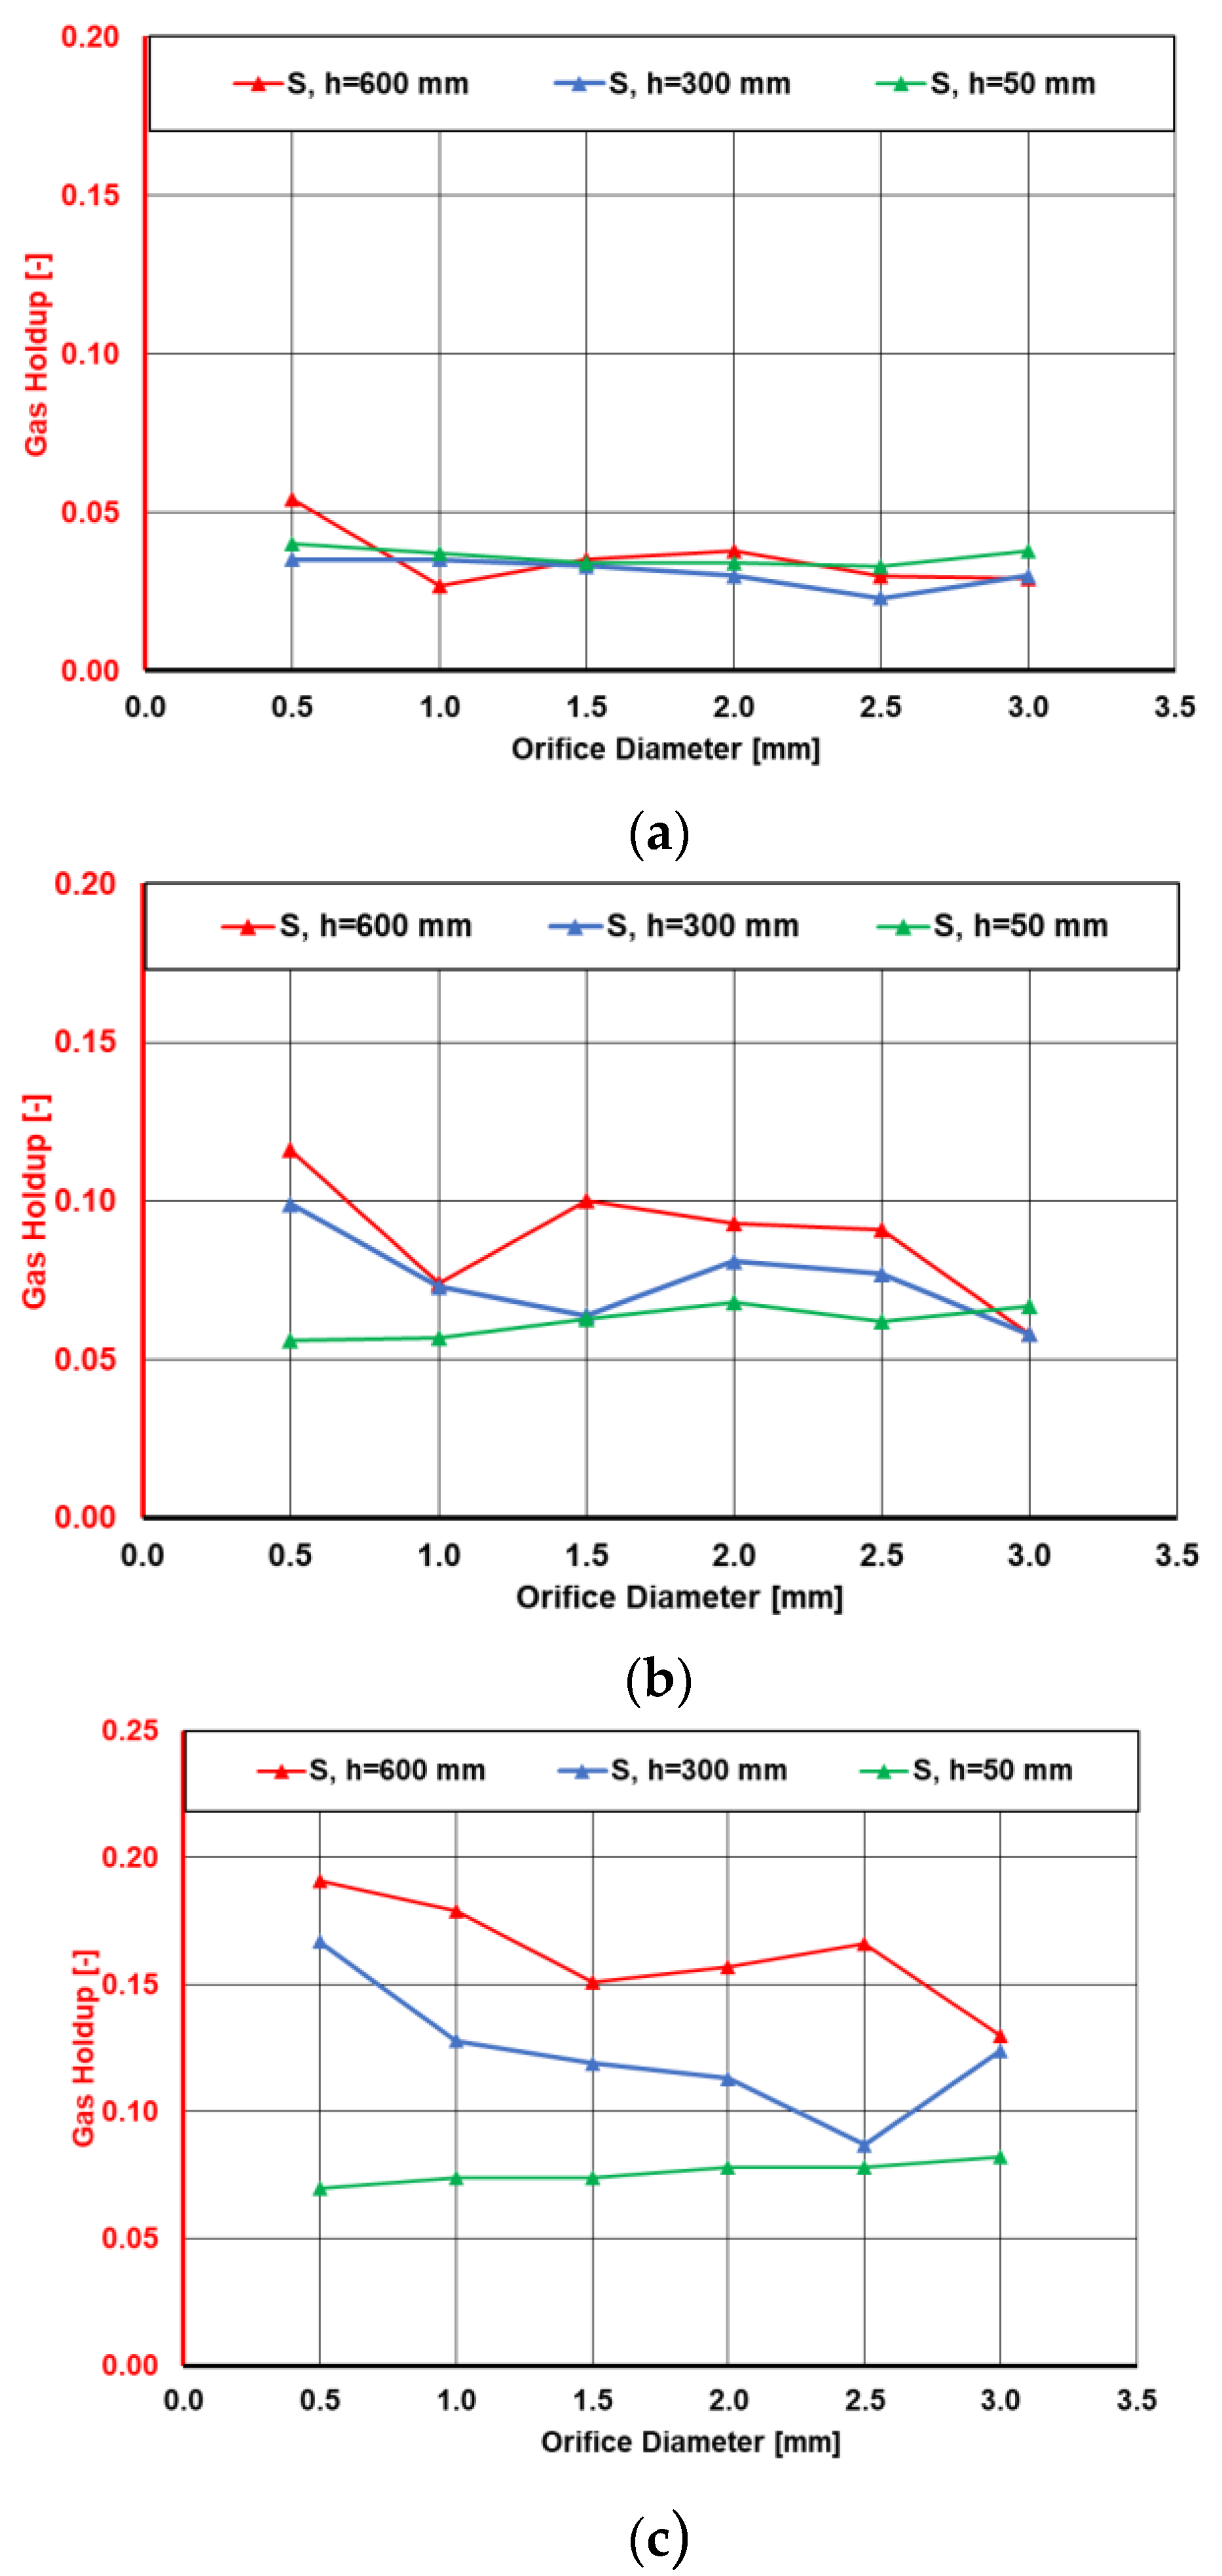
Figure 13 shows the gas holdup of different nozzle diameters at certain heights (50 mm, 300 mm, and 600 mm) in the bubble column, measured at approximately the same flow rate, due to slightly diverging needle valve positions that altered the measurements (maximum deviation was 0.03 mm/s superficial gas velocity). In accordance with the results in
Figure 9, smaller diameters resulted in a higher gas holdup than larger diameters at a fixed flow rate. Notably, there was no significant difference in the gas holdup directly after the gas inlet. The distinction only became apparent at greater distances from the inlet. These results are also consistent with the observed phenomena during the imaging process (
Figure 7), where similar behavior was already recognizable.


