Article

DMSO Intercalation in Selected Kaolinites: Influence of the Crystallinity

by
Jean-Aimé Mbey
1,2,*,
Jean Mermoz Siéwé
1,
Cyrill Joël Ngally Sabouang
3,
Angelina Razafitianamaharavo
2,
Sakeo Kong
1 and
Fabien Thomas
2
1
Laboratory of Applied Inorganic Chemistry, Department of Inorganic Chemistry, University of Yaoundé 1, P.O. Box 812, Yaoundé, Cameroon
2
Laboratoire Interdisciplinaire des Environnements Continentaux (LIEC), Université de Lorraine, CNRS, UMR 7360, F-54000 Nancy, France
3
Department of Chemistry, Higher Teacher Training College, University of Bamenda, P.O. Box 39, Bambili, Cameroon
*
Author to whom correspondence should be addressed.
ChemEngineering 2020, 4(4), 66; https://doi.org/10.3390/chemengineering4040066
Submission received: 2 November 2020 / Revised: 7 December 2020 / Accepted: 10 December 2020 / Published: 21 December 2020

Abstract

:
The present study deals with the relation between crystalline order in kaolinites and their ability to intercalate DMSO. Raw clays and kaolinite–DMSO complexes are analyzed using FTIR, XRD powder diffraction and differential scanning calorimetry and thermogravimetric analysis (DSC-TGA). The crystallinity is accessed using the Hinckley index (HI) from the raw clays’ XRD patterns and the p2 factor from their FTIR spectra. The intercalation ratio is evaluated from XRD and compared among the samples. The thermal analyses show a decrease in the dehydroxylation temperature in the DMSO–kaolinite complexes, indicating a decrease in the interlayer cohesion that may be useful to improve the delamination of kaolinite. The analysis of the coherent scattering domain size in the raw and the DMSO-intercalated samples indicates that the ordering is not affected during the DMSO intercalation. From these results, it is deduced that DMSO intercalation is favored by an increased crystallinity, as revealed by the intercalation ratio from XRD and the DSMO release during DSC-TGA analysis.

1. Introduction

Clays are widely used as mineral fillers in composite plastic materials due to their layered shape and their ability to disperse within the polymer matrix [1,2,3,4].
Although clays of the smectite group are the most suitable for such uses because of their intrinsic capacity to expand and to delaminate into individual clay platelets [4,5,6], their availability as industrial minerals is limited by their relatively scarce geological deposits. On the other hand, kaolinites are ubiquitous clays, already exploited as industrial minerals [7,8,9], and despite their reduced expandability, they must be regarded as potential candidates for composite materials [10,11,12].
The crystalline network of the kaolinite layer Al2Si2O5(OH)4 is formed by the superposition of one sheet of aluminum hydroxide in octahedral symmetry and one sheet of silicium oxide in tetrahedral symmetry. Thus, a kaolinite layer has asymmetrical basal planes with siloxane and aluminol groups. The superposition of kaolinite layers generates strong hydrogen bonds between the siloxane groups of one layer and the aluminol groups of the next layer and, hence, strong cohesive energy between the layers [13,14]. Kaolinite particles, therefore, occur as non-expandable, large layer stacks of low anisotropy, which explains the lack of interest up until now for their use as mineral fillers in polymer–clay composites.
A promising strategy to achieve expansion of kaolinite is the intercalation of molecules that build hydrogen bonds with both siloxane and aluminol groups but are also easy to replace by water molecules [12]. Various approaches are used to carry out intercalation. These include solution intercalation [12], homogenization intercalation (wet mixing) [15] or mechanochemical processes [16] There are few organic molecules that can be directly intercalated within kaolinite. This is the case for dimethylsulfoxide(DMSO), N-methylformamide, acetamide, formamide, potassium acetate and ammonium acetate [17,18,19,20,21,22]. In the present study, we used the non-toxic and cost-effective DMSO.
The molecular mechanism of DMSO intercalation has been recently revisited using molecular dynamics simulation. The modeling confirmed that intercalation involves the hydroxyl groups of the octahedral vacancies functioning as H-donors towards the S=O group of DMSO, whereas the hydrophobic Si=O groups of the ditrigonal cavities of the tetrahedral surface attract the methyl groups of DMSO [23,24].
Natural kaolinite minerals are characterized by several types of imperfection, which are likely to influence the strength of the bonds between the surface groups and the DMSO molecules, such as chemical substitutions in the crystal network and by stacking faults. It is mainly the geologic origin that determines these imperfections. Thus, kaolinites of hydrothermal origin have low rates of substitutions and high stacking order, whereas sedimentary kaolinites are more substituted and show degraded stacking order.
That is why the intercalation is possibly influenced by some crystal-chemical parameters of the kaolinite. Hence, it is hypothesized that the intercalation of a molecule of DMSO is influenced by the crystallinity of the sample.
The present work was carried out on four kaolinites samples selected for different origin and crystalline order. The effect of DMSO intercalation on structural order was investigated by X-ray diffraction (XRD), Fourier-transform infrared spectrometry (FTIR), Brunauer–Emmett–Teller (BET) surface measurement and thermal analysis.

2. Materials and Methods

Two reference kaolinites from the Clay Minerals Society (MAC and Kga2), one kaolinite from the Charente deposit (France) (GZA4) and one kaolinite from Cameroon (MY3) were used. The characteristics of the samples are shown in Table 1. All the samples were wet sieved over a 40-µm mesh. The obtained cakes were dried at room temperature and then in an oven for 24 h at 70 °C and were stored in polyethylene bags before experimentation.
The DMSO–kaolinite complexes were prepared following a method adapted from Gardolinski et al. (2000) [25] and modified by Mbey et al. (2013) [12]. A DMSO to clay mass ratio of 20:3 was used. Water was added in the system at a percent to DMSO volume <10%. The mixture was refluxed for 1 h at 70 °C and then kept for 7 days before the clay was separated from the solution through filtration. The cake was left for DMSO evaporation for 7 days and then placed in an oven at 70 °C for drying to a constant weight. The dry sample was then crushed and sieved at 100 µm prior the analyses.

2.1. X-ray Diffraction

Powder X-ray diffraction patterns were recorded using a D8 Advance Bruker diffractometer equipped with a Co Kα radiation (λ = 1.7890 Å) operating at 35 kV and 45 mA. The diffraction patterns were obtained from 1.5 to 32° at a scanning rate of 0.035° per 323.9 s.
The coherent scattering domain (D) was calculated from the X-ray patterns using the full width at half maximum height of the d001 reflection and the Scherrer equation. It should be noted that the Scherrer equation is used assuming a unique coherent scattering domain for d001 diffraction peaks in each sample.
From the XRD patterns, the Hinckley crystallinity index (HI) was evaluated [26].The heights of the 1 1 ¯ 0 and the 11 1   ¯ peaks above a line drawn from the trough between the 020 and 1 1 ¯ 0 peaks to the background just beyond the 11 1 ¯ peak are measured. The sum of these measurements is the numerator and it is divided by the height of the 1 1 ¯ 0 peak above general background (Figure 1).

2.2. Fourier Transform Infrared Spectroscopy (FTIR)

Infrared spectra were recorded in diffuse reflectance mode using a Bruker Fourier Transform Interferometer IFS 55. The spectra were recorded in diffuse reflectance mode from 4000 to 600 cm−1 with a resolution of 4 cm−1. The spectra were obtained as an accumulation of 200 scans. Potassium bromide (KBr) pellets containing ~10% of the powder clay were obtained by pressing (10 tons/cm2) manually ground mixtures of the clay and oven-dried potassium bromide.

2.3. Thermal Analysis

A coupled thermogravimetric analysis-differential scanning calorimetry (TGA-DSC) device LINSEIS (model STA PT-1000) operating under an air flow was used for the thermal analysis. The samples were placed in an alumina crucible and heated from ambient temperature to 800 °C at a heating rate of 10 °C min−1.

2.4. Nitrogen Adsorption: BET Specific Surface Measurement

Nitrogen adsorption–desorption isotherms at 77 K were recorded on a step-by-step automatic home-built set-up. Pressures were measured using 0–1000 and 0–100,000 Pa Baratron-type pressure sensors provided by Edwards. The nitrogen saturation pressure was recorded in situ using an independent 0–100,000 Pa Baratron-type pressure sensor provided by Edwards. Prior to adsorption, the samples were outgassed overnight at 110 °C and under a residual pressure of 0.01 Pa. Nitrogen N55 (purity >99.9995%) used for experiments was provided by Alphagaz (France). Specific surface areas (SSAs) were determined from adsorption data by applying the Brunauer–Emmett–Teller (BET) equation and using 16.3 Å2 for the cross-sectional area of nitrogen. The error in the determination of the SSA was estimated as +/− 1 m2/g.
In order to assess microporosity (openings below 2 nm), the t-plot method was applied. It allows calculating the microporous volume and the specific surface area of a sample by comparison with a reference adsorption isotherm of a non-porous material having similar surface chemistry.

3. Results and Discussion

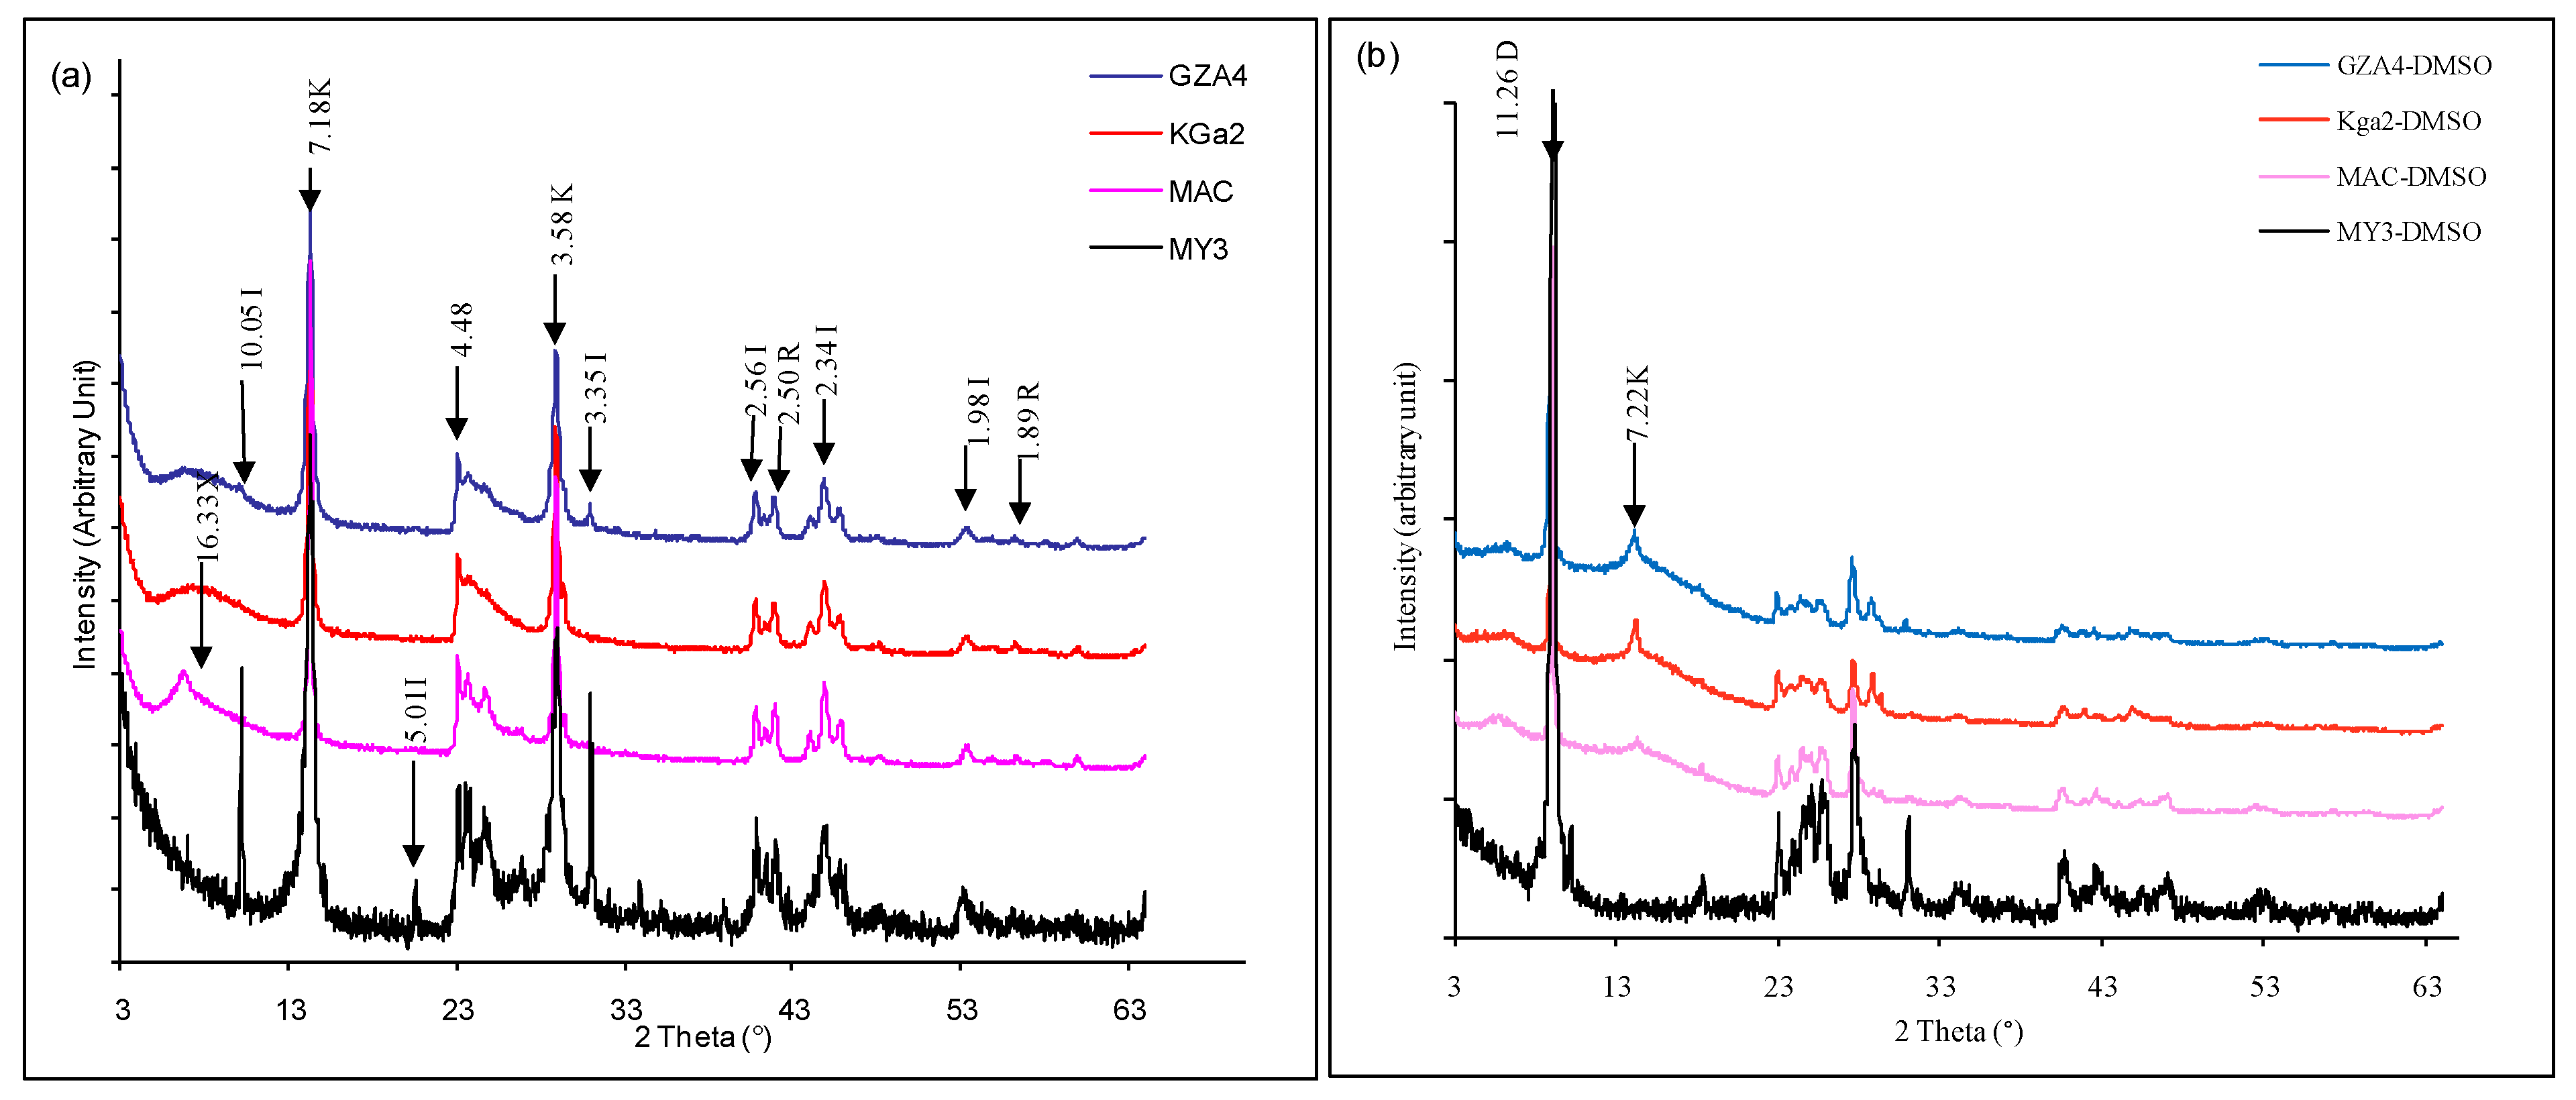
3.1. XRD: Crystalline Changes

The mineralogical assemblage of the raw kaolinite samples, as shown on the X-ray diffractograms (Figure 2), is mainly made of kaolinite, with small amounts of illite and rutile impurities. The illite content is the highest in sample MY3. The XRD reflection at 16.33 Å was assigned in a previous study [27] to a kaolinite–illite interstratification.
After DMSO intercalation, the displacement of the reflections associated to the XRDbasal distance d001 in kaolinite, from 7.18 to 11.26 Å, is coherent with a monolayer intercalation [24] of DMSO molecules. The coherent scattering domain (D) is significantly increased for all the intercalated samples, which clearly indicates that intercalation results in increased stacking order.
The intercalation ratio (I.R) (also called the degree of reaction) in the DMSO–kaolinite composite was calculated using Equation (1).
I.R = I001intercalate/(I001intercalate + I001Kaolinite) × 100
where I001intercalate is the d001 peak intensity due to intercalation; I001Kaolinite is the residual intensity of the kaolinite basal peak in the intercalated product.
As reported in a previous study [12], the relationship assumes the same degree of particle orientation for both expanded and unexpanded phases. The values obtained are reported in Table 1. The expansion of the basal distance due to DMSO intercalation concerns from 71% of the clay sheets in Kga2 to 96% of the clay sheets in MY3. Thus, kaolinites are, in general, very sensitive to DMSO intercalation. The observed differences in the intercalation ratio can be related to the Hinckley index (HI) (Table 1), which is an indicator of the crystalline order. The four studied clays can be separated into two groups: MY3 and MAC have a high HI and I.R, whereas Kga2 and GZA4 have a significantly lower HI and I.R. The closer the HI is to 1, the better the crystallinity. Hence, sample MY3 (HI = 1.05) appears to be the most ordered sample, whileKga2 (HI = 0.44) is the least ordered one.
Considering the size of the pseudo-crystallite listed in Table 1 and the estimate of the number of layers per crystallite, it appears that this number is almost constant. The slight differences were associated to particle distortion. As the general feature indicates a constant number of layers, this may indicate that the path of DMSO intercalation may be associated to the ordering (i.e., crystallinity) within the clay sample. Looking at the intercalation ratio, it appears that higher crystalline order is favorable to intercalation by DMSO, which justified the I.R values.

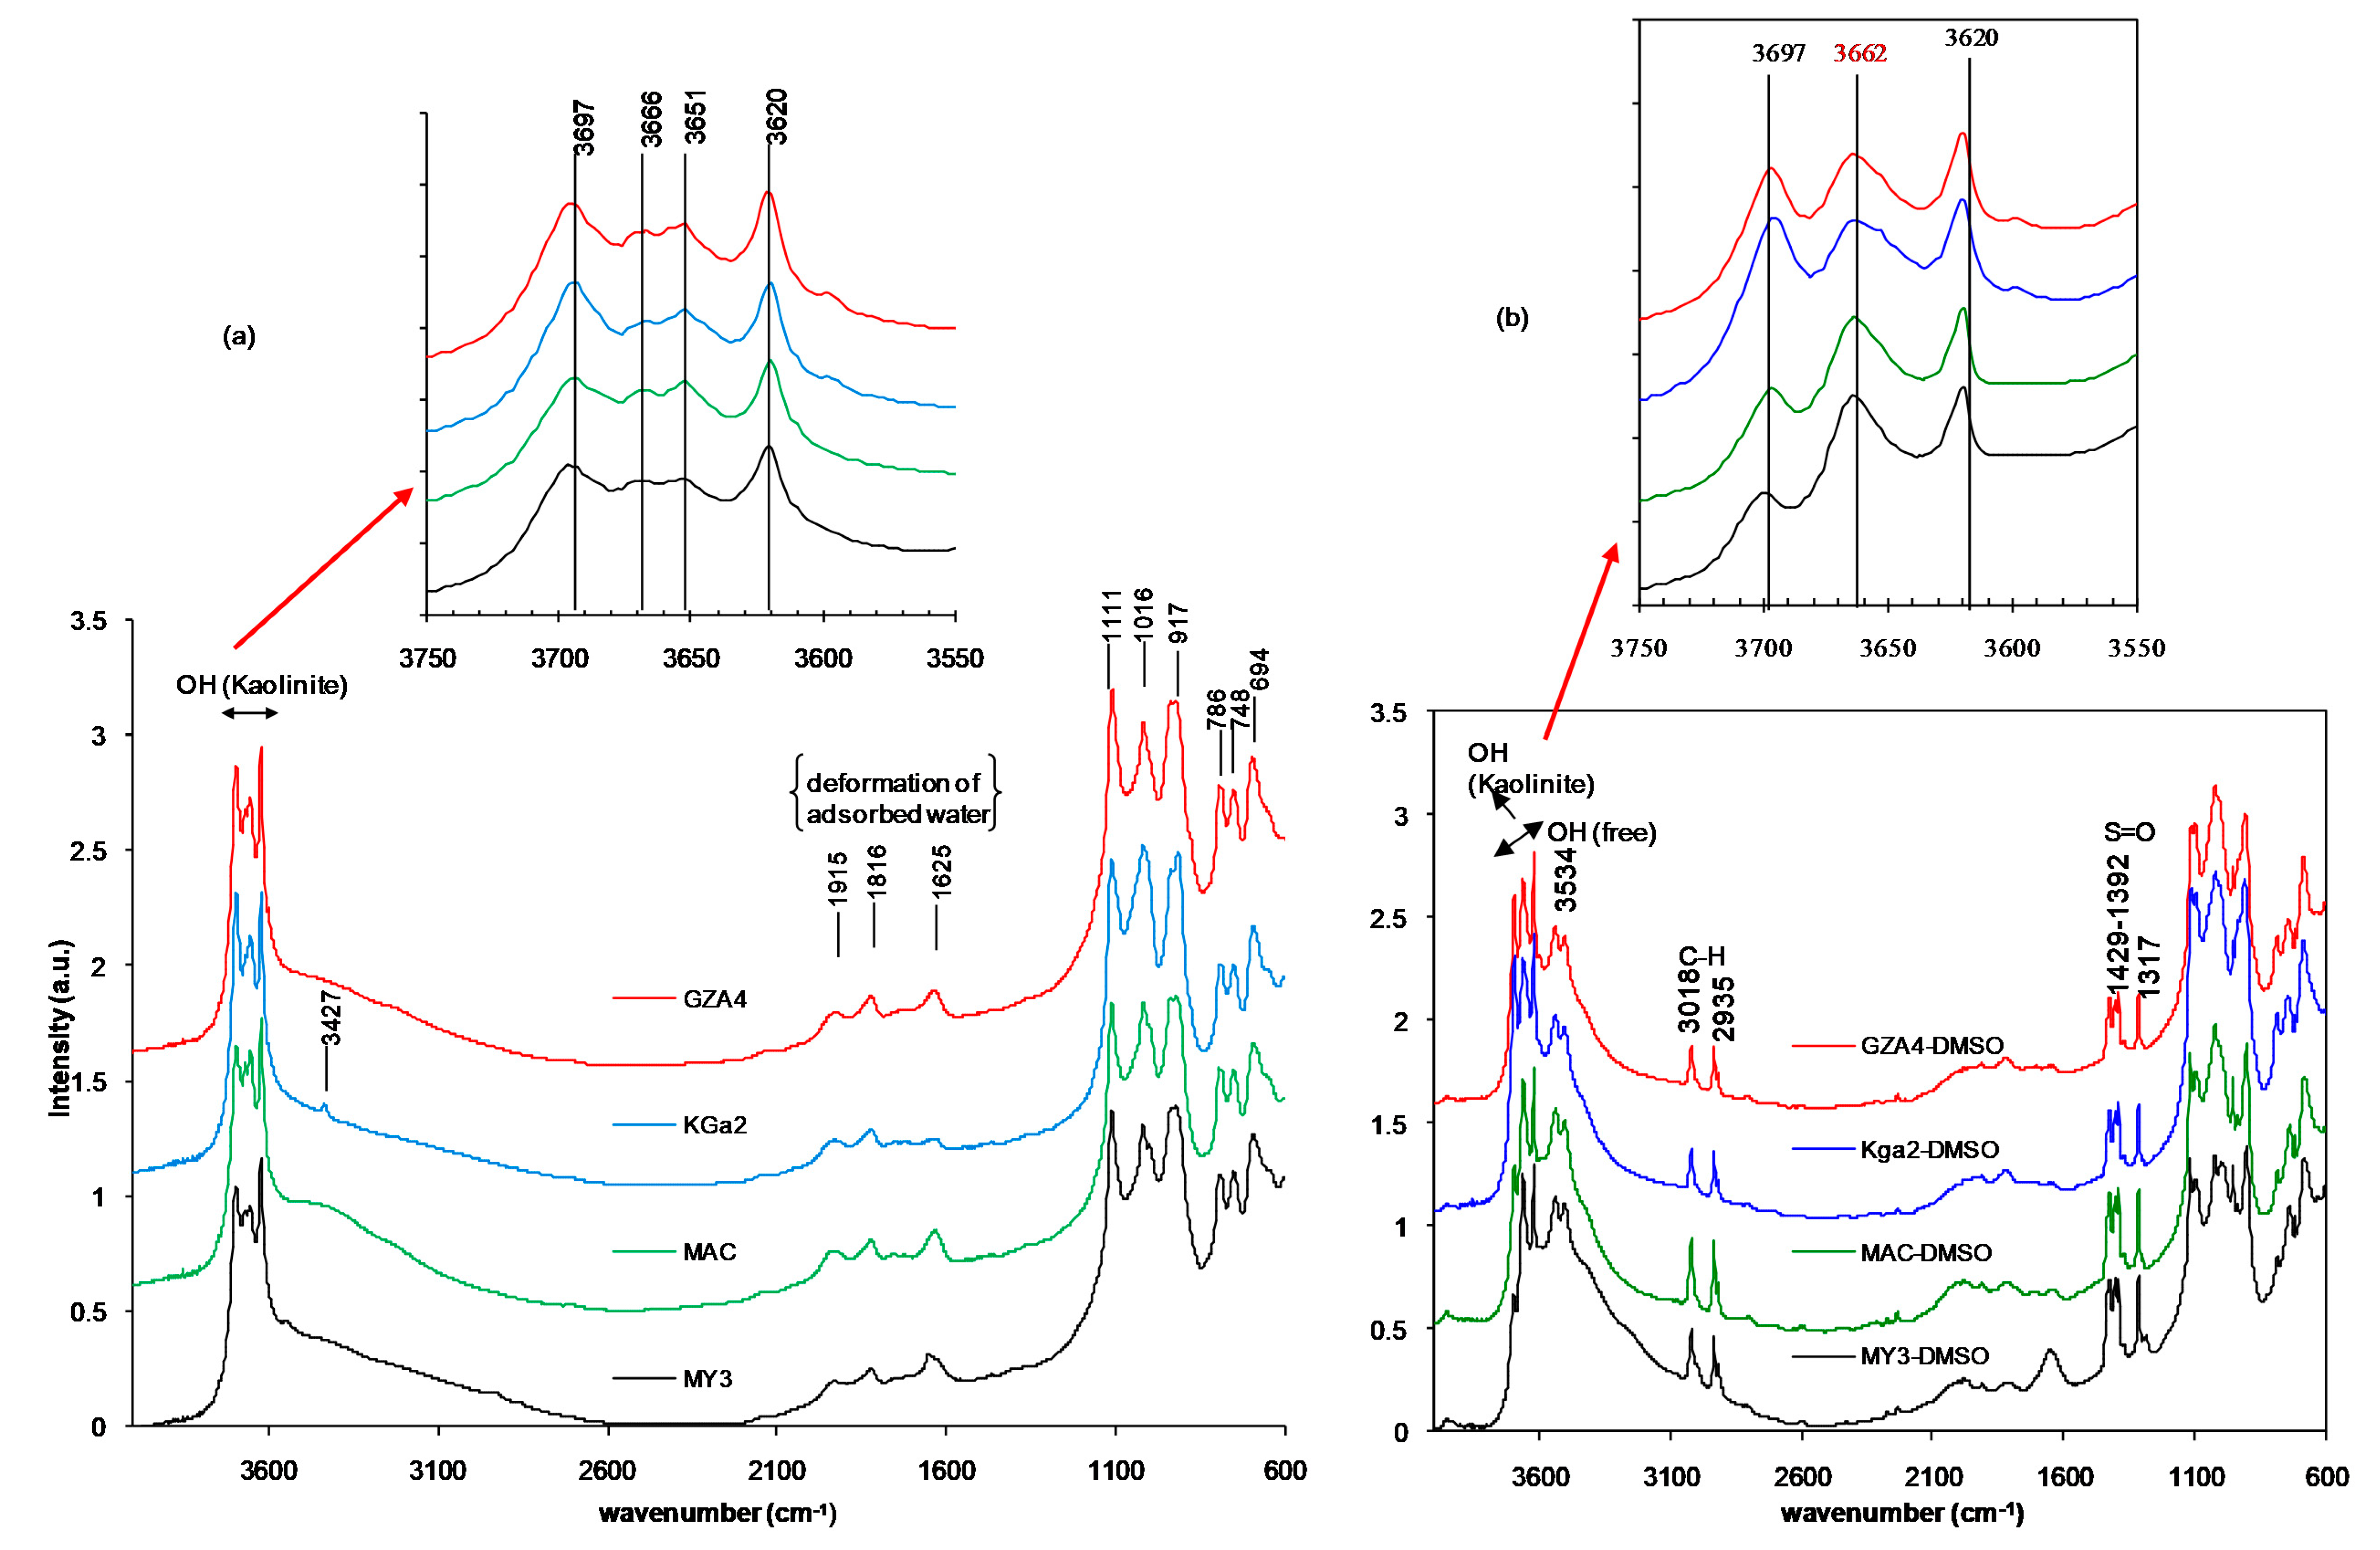
3.2. FTIR Analysis: DMSO-Clay Interactions

FTIR spectra (Figure 3) of the raw samples, already described elsewhere [27], displayed the characteristic crystalline O-H stretching bands in kaolinite at 3697, 3666, 3651 and 3620 cm−1. The band at 3697 cm−1 is assigned to in-phase stretching vibration of O-H groups at the surface of the clay sheets. The bands at3666 and 3651 cm−1 are attributed to the surface O-H out-of-phase stretching vibration. The band at 3620 cm−1 is known as the inner O-H stretching vibration. These four bands are reasonably well defined, which indicates low rates of crystalline defects.
The C-H bands due to DMSO are clearly observed on the FTIR spectra of intercalated products at 3018 and 2935 cm−1. Furthermore, sulfonyl (S=O) stretching bands are observable at 1429, 1392 and 1317 cm−1. The influence of the sulfonyl group of DMSO on the internal O-H stretching bands at 3666 and 3651 cm−1 in kaolinite is noticeable within the intercalated samples, where only one band is observable at 3662 cm−1. The latter band is attributed to the hydrogen bonds between the internal O-H of the kaolinite sheet and the sulfonyl group in DMSO. The appearance of this single and broad band after intercalation is indicative of poor ordering and relatively weak interactions between the sulfonyl and the external O-H.
Furthermore, the p2 factor was calculated from the relative intensity of the external O-H stretching bands using Equation (2) below:
p 2 = I / I 0 ( 3666   cm 1 ) I / I 0 ( 3651   cm 1 )
This factor is slightly lower than 1 in well-crystallized kaolinite and increases with an increase in defaults within the kaolinite structure [28].
The calculated p2 values lead almost to the same crystallinity classification as per the Hinckley index (see Table 1).The defaults are, in general, significant for all the samples as the p2 value is > 1 for all the samples.
All the above observations clearly indicate that DMSO intercalation weakens the cohesive strength between the clay sheets, which may favor the delamination of the kaolinite layer stacks after intercalation.

3.3. DSC-TGA: Interaction Energy and Quantitative Aspect

The DSC-TGA curves of the raw clays (Figure 4a,b) display a sharp endothermic peak at 523, 521, 253 and 527 °C for Kga2, GZA4, MY3 and MAC, respectively, characteristic for the dehydroxylation of the kaolinite crystal structure and conversion to a metakaolin structure. These TGA curves are typical of kaolinite clays. The dehydroxylation mass losses are within the range usually encountered for kaolinite (9% to 14%). The Kga2 sample exhibited the highest percent loss of 12.6%, which was still within the range observed for kaolinite. In the other samples, the mass losses were 10.6%, 10.4% and 10.3% for MAC, MY3 and GZA4, respectively. On the DMSO-intercalated clays, the dehydroxylation band from DSC (Figure 4c,d), undergoes a slight shift towards a lower temperature, which is coherent with reduced cohesion within the kaolinite sheets, as proposed from FTIR (Figure 3).
The thermal release of the intercalated DMSO appears between 184 and 190 °C; these values are, in general, lower than the boiling temperature of DMSO (190 °C), which could indicate that the interactions between the DMSO molecules and the surface sites of the clay sheets are of lower energy than the interactions between the DMSO molecules in solution. Furthermore, it can be inferred that all the intercalated molecules are adsorbed to the clay surfaces and not condensed in the interlayer space, which would have resulted in at least partial evaporation at 190 °C or higher. This endothermic band is larger in MY3-D in comparison to the others, indicating a higher amount of intercalated DMSO, which can be related to the higher crystalline order of this sample in the raw state. From the TGA curve of the kaolinite–DMSO complex (Figure 4d), a ratio of the percent mass loss during DMSO release to the percent mass loss of dehydroxylation leads to values of 0.79, 1.06, 1.97 and 2.68 for Kga2-D, GZA4-D, MAC-D and MY3-D, respectively. These ratios follow the same ordering as the intercalation ratios from XRD (Table 1), leading to the following order of increased DMSO intercalation: Kga2-D < GZA4-D < MAC-D < MY3-D. This classification also accounts for the size of the endothermic band from DSC (Figure 4c) and corroborates the conclusion of an increased DMSO intercalation with increased crystallinity of the kaolinite (see Table 1 for the values of Hinckley index). Furthermore, when the DMSO is completely released, the dehydroxylation of the kaolinite from the kaolinite–DMSO complex follows the same scheme as the raw kaolinite [29].
The absence of an exothermic DSC band confirms that the DMSO is not thermally decomposed during the heating process and it is released as an unbroken molecule. These observations suggest that the DMSO intercalation in kaolinite is highly reversible and that no decomposition products remain in the clay.

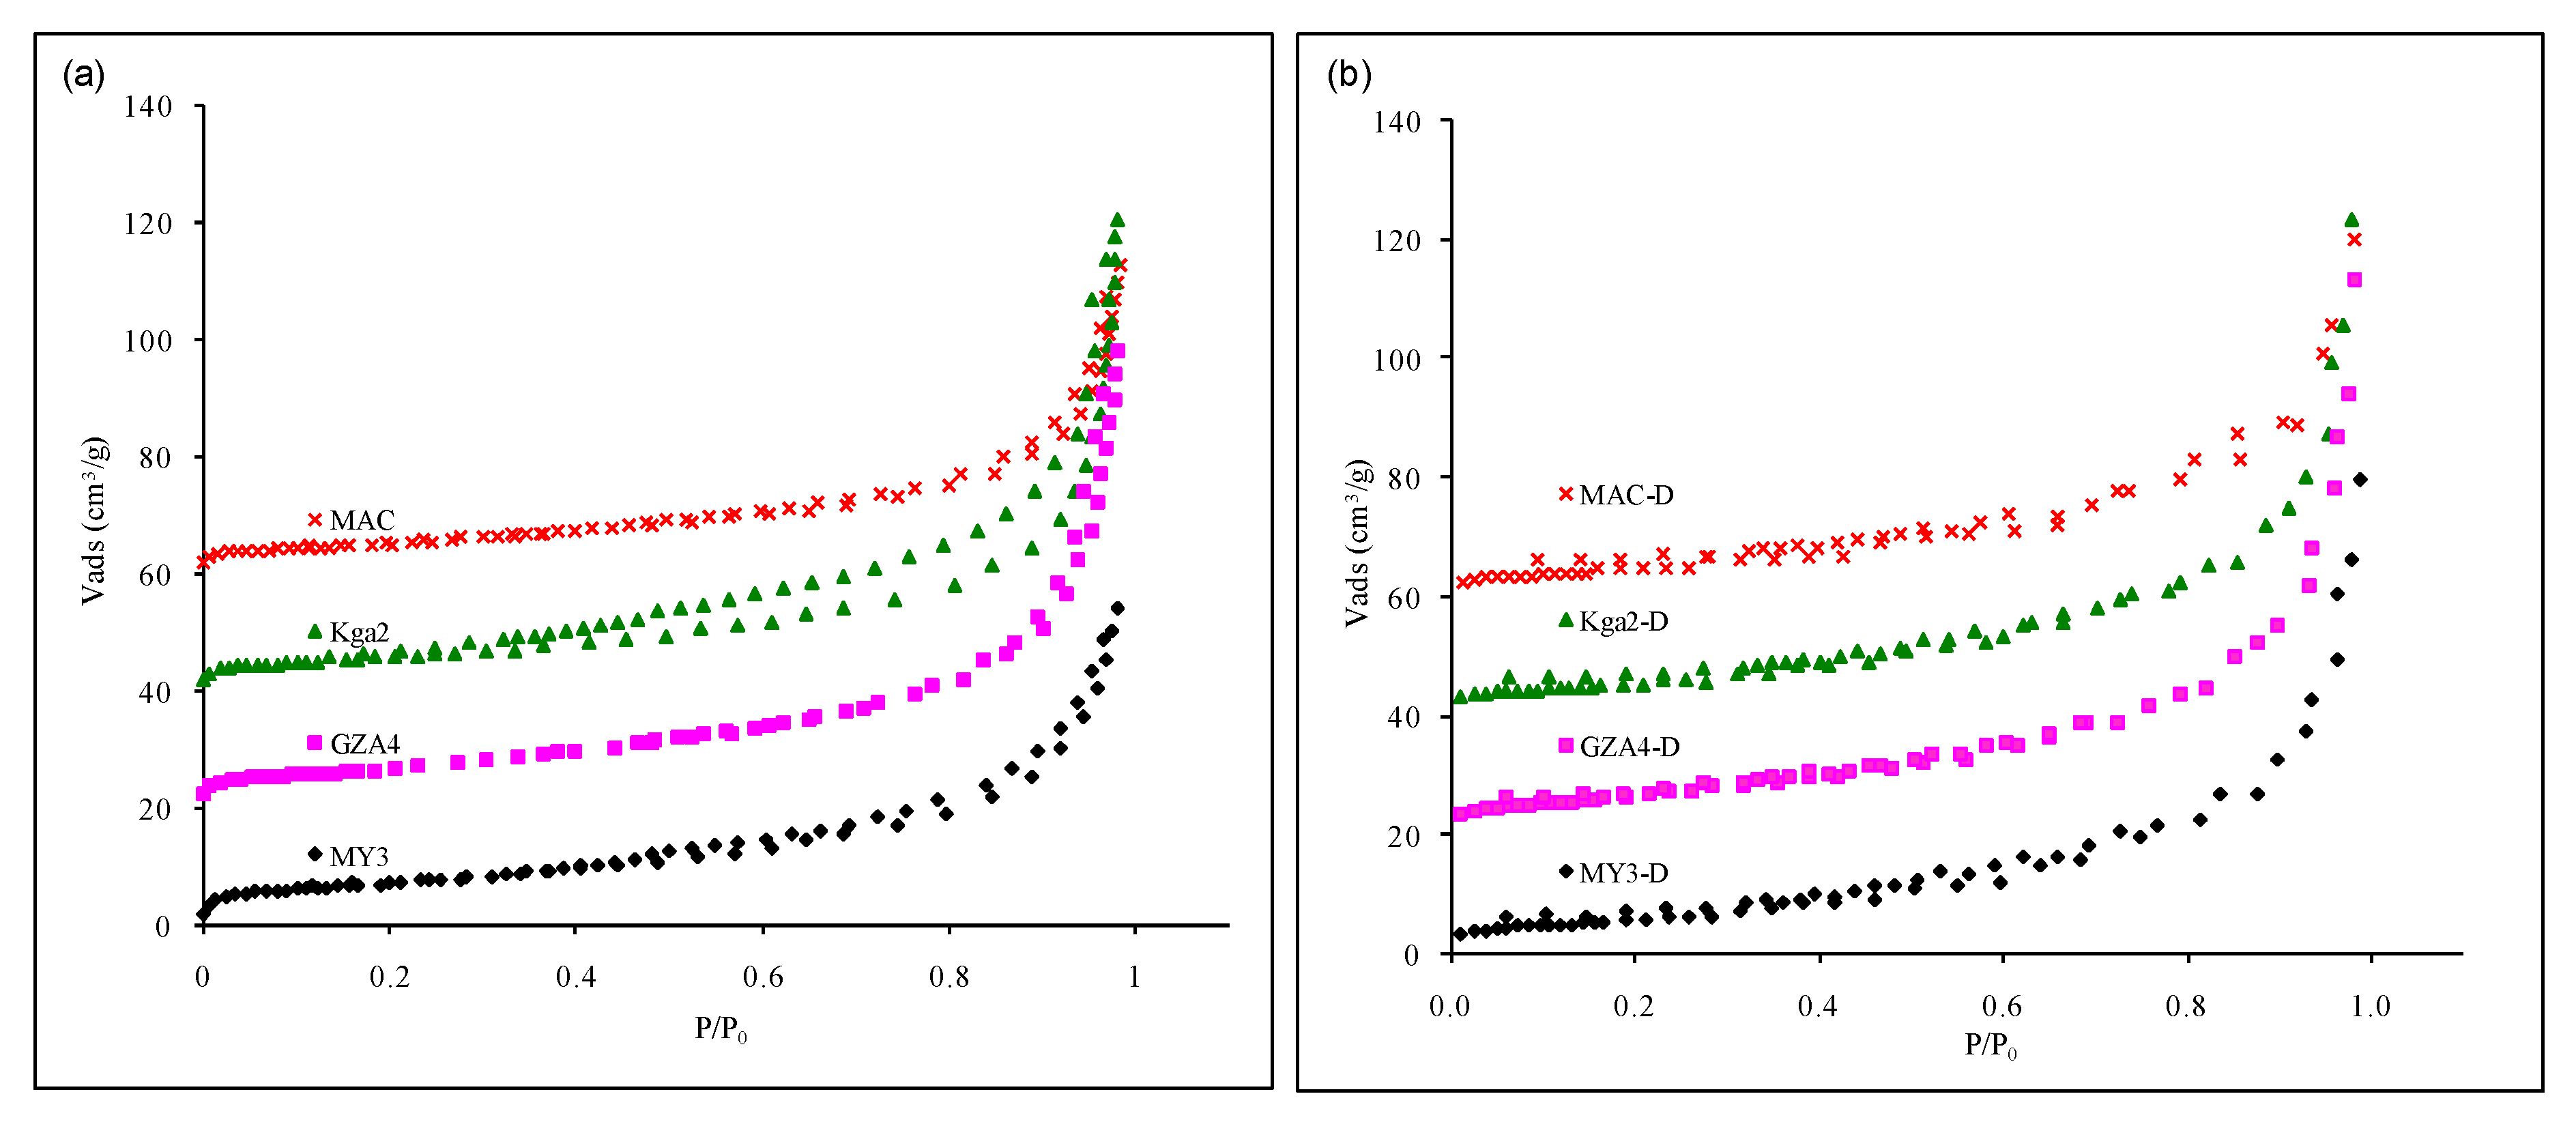
3.4. Nitrogen Adsorption and SSA: Textural Effects

The isotherms (Figure 5) are of type IV (mesoporous) according to the classification of the international union of pure and applied chemistry (IUPAC) [30]. For both raw and intercalated series, the adsorption–desorption hysteresis is very small, as it is usual for kaolinite. This hysteresis was assigned to slit-shaped mesopores at the edges of the clay particles [31,32].
A decrease in specific surface area (SSA) was observed (Table 1) for all the samples as a result of DMSO intercalation. It can be observed from the t-plot data (Table 1) that the contribution of microporosity to the total SSA is very low (equal to or below 1.1 m2 g−1) in all cases. The drop in SSA after DMSO intercalation is, therefore, not due to micro-textural rearrangement, but rather to competition for the most energetic surface sites occupied by DMSO. The most significant decrease in SSA is registered for the MY3 sample, which also exhibits the highest crystallinity (as indicated by the Hinckley index), the highest DMSO intercalation ratio (R.I) and the highest amount of intercalated DMSO (Table 1, Figure 4).
There is, however, a slight textural effect of DMSO intercalation, as observed on the hysteresis loop between the adsorption and desorption curves (Figure 5), especially in the case of Kga2. For this clay, the hysteresis loop vanishes after intercalation, indicating a loss of mesopores (20–200-nm opening), i.e., pores in which condensation of liquid nitrogen is hindered by the presence of DMSO at the interface.

4. Conclusions

The present study focused on the relation between crystalline order in four kaolinites and their ability to intercalate DMSO.
After intercalation, XRD analysis shows an increase in the coherent scattering domain which reveals an increase in the stacking order. The path of DMSO intercalation depends on the clay ordering, as revealed by the number of layers per crystallite, which remains constant from the raw to the intercalated form. The Hinckley index of crystallinity coupled with the intercalation ratio shows that the higher the crystallinity, the higher the DMSO intercalation. The FTIR analysis evidences the weakening of the clay layer interaction that may be favorable to the clay delamination for composite making. Furthermore, the p2 factor, from FTIR, confirms the improved DMSO intercalation for better crystallized kaolinite. Using DSC-TGA analysis, the clay sheet cohesion was shown to be weakened, as also observed from FTIR analysis. DSC-TGA analysis showed that the DMSO in the kaolinite–DMSO complex is released as unbroken molecules at temperatures varying from 184 to 190 °C.
It is concluded that clay sheet–DMSO interactions are weaker than DMSO–DMSO interactions (in liquid DMSO). These relatively weak interactions explain the highly reversible intercalation of DMSO in kaolinite. The TGA weight loss associated to the DMSO released, related to the weight loss during kaolinite dehydroxylation, confirms the DMSO intercalation ratios from XRD and leads to the same ranking of increasing intercalation. Nitrogen gas adsorption isotherms showed a decrease in SSA and reduced accessibility to adsorption sites for nitrogen as a result of DMSO intercalation. The overall results are coherent with increased DMSO intercalation in well-crystallized kaolinites.

Author Contributions

Conceptualization J.-A.M. and F.T.; methodology, J.-A.M., F.T. and S.K; formal analysis, J.-A.M., A.R. and J.M.S.; investigation, J.-A.M. and A.R.; resources, F.T., J.-A.M., S.K. and C.J.N.S.; supervision, F.T.; visualization, J.-A.M. and A.R.; writing—original draft preparation, J.-A.M., J.M.S. and C.J.N.S.; writing—review and editing, F.T., S.K. and J.-A.M. All authors have read and agreed to the published version of the manuscript.

Funding

This research received no external funding.

Conflicts of Interest

The authors declare no conflict of interest.

References

  1. Alexandre, M.; Dubois, P. Polymer-layered silicate nanocomposites: Preparation, properties and uses of a new class of materials. Mater. Sci. Eng. R Rep. 2000, 28, 1–63. [Google Scholar] [CrossRef]
  2. Mbey, J.A.; Hoppe, S.; Thomas, F. Cassava-starch kaolinite composite film. Effect of clay content and clay modification on film properties. Carbohydr. Polym. 2012, 88, 213–222. [Google Scholar] [CrossRef]
  3. Uysal Unalan, I.; Cerri, G.; Marcuzzo, E.; Cozzolino, C.A.; Farris, S. Nanocomposite films and coatings using inorganic nanobuilding blocks (NBB): Current applications and future opportunities in the food packaging sector. RSC Adv. 2014, 4, 29393–29428. [Google Scholar] [CrossRef] [Green Version]
  4. Olivato, J.B.; Marini, J.; Pollet, E.; Yamashita, F.; Grossmann, M.V.E.; Avérous, L. Elaboration, morphology and properties of starch/polyester nano-biocomposites based on sepiolite clay. Carbohydr. Polym. 2015, 118, 250–256. [Google Scholar] [CrossRef] [PubMed]
  5. Gul, S.; Kausar, A.; Muhammad, B.; Jabeen, S. Research Progress on Properties and Applications of Polymer/Clay Nanocomposite. Polym. Plast. Technol. Eng. 2016, 55, 684–703. [Google Scholar] [CrossRef]
  6. La Mantia, F.P.; Mistretta, M.C.; Scaffarol, R.; Botta, L.; Ceraulo, M. Processing and characterization of highly oriented fibres of biodegradable nanocomposites. Compos. Part B Eng. 2015, 78, 1–7. [Google Scholar] [CrossRef]
  7. Fadil-Djenabou, S.; Ndjigui, P.-D.; Mbey, J.A. Morphological and physicochemical characterization of Ngaye alluvial clays (Northern Cameroon) and assessment of its suitability in ceramic production. J. Asian Ceram. Soc. 2015, 3, 50–58. [Google Scholar] [CrossRef] [Green Version]
  8. Ekosse, G.E. Kaolin deposits and occurrences in Africa: Geology, mineralogy and utilization. Appl. Clay Sci. 2010, 50, 212–236. [Google Scholar] [CrossRef]
  9. Nkoumbou, C.; Njoya, A.; Grosbois, C.; Njopwouo, D.; Yvon, J.; Martin, F. Kaolin from Mayouom (Western Cameroon): Industrial suitability evaluation. Appl. Clay Sci. 2009, 43, 118–124. [Google Scholar] [CrossRef]
  10. de Macêdo Neto, J.C.; Botan, R.; Lona, L.M.F.; Net, J.E.; Pippo, W.A. Polystyrene/kaolinite nanocomposite synthesis and characterization via in situ emulsion polymerization. Polym. Bull. 2015, 72, 387–404. [Google Scholar] [CrossRef]
  11. Chen, B.; Evans, J.R.G. Thermoplastic starch–clay nanocomposites and their characteristics. Carbohydr. Polym. 2005, 61, 455–463. [Google Scholar] [CrossRef]
  12. Mbey, J.A.; Thomas, F.; Ngally Sabouang, C.J.; Liboum; Njopwouo, D. An insight on the weakening of the interlayer bonds in a cameroonian kaolinite through DMSO intercalation. Appl. Clay Sci. 2013, 83–84, 327–335. [Google Scholar] [CrossRef]
  13. Cabedo, L.; Giménez, E.; Lagaron, J.M.; Gavara, R.; Saura, J.J. Development of EVOH-kaolinite nanocomposites. Polymer 2004, 45, 5233–5238. [Google Scholar] [CrossRef]
  14. Giese, R.F. Kaolin Minerals: Structures and Stabilities. In Hydrous Phyllosilicates; Bailey, S.W., Ed.; Mineralogical Society of America: Chantilly, VA, USA, 1988; pp. 29–66. [Google Scholar]
  15. Makó, E.; Kristóf, J.; Horváth, E.; Vágvölgyi, V. Mechanochemical intercalation of low reactivity kaolinite. Appl. Clay Sci. 2013, 83–84, 24–31. [Google Scholar] [CrossRef]
  16. Makó, E.; Kovács, A.; Kristóf, T. Influencing parameters of direct homogenization intercalation of kaolinite with urea, dimethyl sulfoxide, formamide, and N-methylformamide. Appl. Clay Sci. 2019, 182, 105287. [Google Scholar] [CrossRef]
  17. Frost, R.L.; Kristóf, J.; Paroz, G.N.; Kloprogge, J.T. Intercalation of kaolinite with acetamide. Phys. Chem.Miner. 1999, 26, 257–263. [Google Scholar] [CrossRef]
  18. Frost, R.L.; Makó, E.; Kristóf, J.; Horváth, E.; Cseh, T. The effect of machanochemical activation upon the intercalation of a high-defect kaolinite with formamide. J. Colloid Inter. Sci. 2003, 265, 386–395. [Google Scholar] [CrossRef]
  19. Frost, R.L.; Kristof, J.; Horvath, E. Vibrational spectroscopy of intercalated kaolinites. Part, I. Appl.Spectrosc. Rev. 2010, 45, 130–147. [Google Scholar] [CrossRef] [Green Version]
  20. Itagaki, T.; Komori, Y.; Sugahara, Y.; Kuroda, K. Synthesis of a kaolinite–poly(β-357 alanine) intercalation compound. J. Mater. Chem. 2001, 11, 3291–3295. [Google Scholar] [CrossRef]
  21. Olejnik, V.S.; Posner, A.M.; Quirk, J.P. The intercalation ofpolar organic compound into kaolinite. Clay Miner. 1970, 8, 421–434. [Google Scholar] [CrossRef]
  22. Olejnik, V.S.; Aylmore, L.A.G.; Posner, A.M.; Quirk, J.P. Infrared Spectra of Kaolin Mineral-Dimethyl Sulfoxide Complexes. J. Phys. Chem. 1968, 72, 241–249. [Google Scholar] [CrossRef]
  23. Zhang, S.; Liu, Q.; Cheng, H.; Gao, F.; Liu, C.; Teppen, B.J. Mechanism Responsible for Intercalation of Dimethyl Sulfoxide in Kaolinite: Molecular Dynamics Simulations. Appl. Clay Sci. 2018, 151, 46–53. [Google Scholar] [CrossRef] [PubMed]
  24. Fang, Q.; Huang, S.; Wang, W. Intercalation of dimethyl sulphoxide in kaolinite: Molecular dynamics simulation study. Chem. Phys. Lett. 2005, 411, 233–237. [Google Scholar] [CrossRef]
  25. Gardolinski, J.E.; Carrera, L.C.M.; Wypych, F. Layered polymer-kaolinite nanocomposites. J. Mater. Sci. 2000, 35, 3113–3119. [Google Scholar] [CrossRef]
  26. Hinckley, D.N. Variability in “crystallinity” Values among the Kaolin Deposits of the Coastal Plain of Georgia and South Carolina. Clays Clay Miner. 1962, 11, 229–235. [Google Scholar] [CrossRef]
  27. Mbey, J.A.; Thomas, F.; Razafitianamaharavo, A.; Caillet, C.; Villieras, F. A comparative study of some kaolinites surface properties. Appl. Clay Sci. 2019, 172, 135–145. [Google Scholar] [CrossRef]
  28. Cases, J.M.; Lietard, O.; Yvon, J.; Delon, J.F. Etude des propriétés cristallochimiques, morphologiques, superficielles des kaolinites désordonnées. Bull. Mineral. 1982, 105, 439–455. [Google Scholar] [CrossRef]
  29. Zhang, Y.; Liu, Q.; Wu, Z.; Zheng, Q.; Cheng, H. Thermal behavior analysis of kaolinite–dimethylsulfoxide intercalation complex. J. Therm. Anal. Calorim. 2012, 110, 1167–1172. [Google Scholar] [CrossRef]
  30. Sing, K.S.W.; Everett, D.H.; Haul, R.A.W.; Moscou, L.; Pierotti, R.A.; Rouquérol, J.; Siemieniewska, T. Reporting physisorption data for gas/solid systems with special reference to the determination of surface area and porosity. Pure Appl. Chem. 1985, 57, 603–619. [Google Scholar] [CrossRef]
  31. Sayed Hassan, M.; Villiéras, F.; Razafitianamaharavo, A.; Michot, L.J. Role of exchangeable cations on geometrical and energetic surface heterogeneity of kaolinites. Langmuir 2005, 21, 12283–12289. [Google Scholar] [CrossRef]
  32. Delineau, T. Les Argiles Kaoliniques Du Bassin de Charentes (France): Analyses Typologiques, Cristallochimique, Speciation du Fer et Applications. Ph.D. Thesis, Université de Lorraine, INPL-Nancy, France, 1994; 627p. [Google Scholar]
Figure 1. Calculation of the Hinckley crystallinity index for kaolinite [26].
Chemengineering 04 00066 g001
Figure 2. XRD patterns of (a) the raw and (b) the DMSO–intercalated kaolinite samples.
Chemengineering 04 00066 g002
Figure 3. FTIR spectra of (a) the raw and (b) the DMSO-intercalated kaolinite samples.
Chemengineering 04 00066 g003
Figure 4. DSC-TGA analysis of (a,b) the raw and (c,d) the DMSO–intercalated kaolinite.
Chemengineering 04 00066 g004
Figure 5. Nitrogen adsorption isotherm: (a) raw kaolinite; (b) DMSO-intercalated kaolinite. Note: The curves are offset for clarity. The shifting constant is 20 cm3/g.
Chemengineering 04 00066 g005
Table 1. Crystallite size (D); specific surface area (SSA); Hinckley index; number of layers per crystallite (NL/Crystallite) and intercalation ratio.
SamplesMY3MY3-DMACMAC-DKGa2Kga2-DGZA4GZA4-D
d001 (Å)7.2011.267.2011.357.2011.357.2111.48
D (Å)169292439518339434262373
SSA (m2/g) BET25.920.318.718.021.019.424.925
External SSA (m2/g) t-plot25.720.417.416.020.618.122.922.7
Microporous SSA (m2/g) t-plot0.301.0000.61.10
Hinckley Index (HI)1.05/0.86/0.44/0.57/
p21.04 1.13 1.23 1.13
Number of Layer/Crystallite2326614647383633
Intercalation ratio (I.R) (%)/96/88/71/73
Publisher’sNote: MDPI stays neutral with regard to jurisdictional claims in published maps and institutional affiliations.

