Article

Swell Magnitude of Unsaturated Clay as Affected by Different Wetting Conditions

Department of Civil Engineering, Braude College of Engineering, Snunit 51 St., Karmiel 2161002, Israel
Standards 2025, 5(1), 1; https://doi.org/10.3390/standards5010001
Submission received: 2 December 2024 / Revised: 30 December 2024 / Accepted: 31 December 2024 / Published: 6 January 2025
(This article belongs to the Topic Advanced Risk Assessment in Geotechnical Engineering)

Abstract

:
The wetting of compacted clays and their subsequent swelling often result in damage to structures and infrastructures. Estimations of the swell that is expected to develop during wetting are usually based on standard laboratory tests. The standard procedure requires inundating the test specimens; this procedure represents an extreme wetting condition and provides an upper limit to the swell. However, wetting may result from less extreme conditions, for example by the absorption of water due to suction forces, which may result in a smaller swell. This paper describes a laboratory investigation of the swell difference in high-plasticity clay that may result from different wetting conditions. Swell tests were carried out on specimens prepared at different initial conditions and wetted under different wetting conditions of inundation or absorption. The results indicate that as the initial void ratio decreases and the degree of saturation increases, it is more likely that different wetting conditions will result in different swell magnitudes, where inundation may create a larger swell than absorption. The soil at a low initial void ratio and high degree of saturation seems to be characterized by mono-modal pore size distributions in the micropore range. This unique pore size distribution may be the explanation of the different swell magnitudes.

1. Introduction

The swelling of unsaturated clay is one of the major sources of damage to buildings, infrastructures, and roads in many parts of the world. Estimations of the swell that is expected to evolve during wetting of unsaturated soils are usually based on laboratory tests carried out using consolidometer equipment and based on water inundation of the specimen [1]. The inundation undoubtedly provides an upper limit to the swell that may be expected under field conditions and may be relevant to cases in which low-lying areas are expected to be flooded as a result of a wetting episode. However, in other cases, the wetting of the soil may result from less extreme conditions, such as absorption of water from underlying wetted layers. Inundation is the upper limit, where water enters freely into the soil, whereas absorption is the lower limit, where water enters the soil solely through suction, without the aid of external gravity heads.
Existing constitutive laws and empirical approaches (e.g., [2,3]) suggest that the expected volume changes of soil at defined initial conditions (e.g., saturation level and water potential) can be predicted independently of the hydraulic head causing wetting. Similarly, it has been suggested that the swelling pressure can be predicted based on the water potential and geotechnical soil indexes [4].
In fact, the water flow mechanisms in inundation and absorption are different. Researchers have found that different flow mechanisms have decisive effects on the flow in porous media, such as the transport of contaminants in soils by biological microorganisms [5] or multiphase flow in the oil industry [6]. It can be assumed that in a similar way, different flow mechanisms may theoretically create different swell mechanisms. When estimating expected damage to roads, structures, and infrastructure, different swell mechanisms may be important for estimating the effects of differential movements resulting from the different wetting conditions.
The response of the soil to the different wetting conditions may be dependent on its initial conditions. The soil initial conditions and geotechnical soil indexes stand in relation to the soil’s porous nature; this nature is determining the flow mechanism, as well as the volume change mechanism and the magnitude of the swell. It is therefore necessary to examine how different wetting conditions result in different flow mechanisms depending on the soil’s initial conditions. As part of this paper’s discussion, it is suggested that the pore size distribution of the compacted clay, and its dependence on the molding water content and the soil’s initial condition, may be the cause of the different swell mechanisms that evolve under different wetting conditions.

2. Background

2.1. Pore Size Distributions

It has previously been observed that compacted clay is characterized by a double porosity structure; large pores (macropores) exist between the pods or aggregates of clay platelets, while micropores exist within the pods [7,8,9,10]. While soil that is compacted on the dry side of the optimum (i.e., the maximum dry density of the compaction curve) typically shows a bi-modal pore size distribution characterized by micropores and macropores, soil that is compacted on the wet side of the optimum typically shows a mono-modal pore size distribution in the micropore range [8]. Molding water content affects soil’s structure and aggregation, which in turn impacts the soil water characteristics, i.e., the relationship between the soil water content and suction [11]. The different water flow mechanisms through the macro- and the micropores have been previously discussed (e.g., [12,13,14]). The micropores are characterized by much higher suction forces and much lower hydraulic conductivity compared to the macropores. In compacted soils, the number of macropores is reduced, and preferential flow pathways are disrupted, resulting in decreasing permeability [15].
Swell results from water adsorption into micropores. The ability of micropores to attract water depends on the water potential; a large water potential can draw water without gravity flow. The water potential varies according to the soil saturation; at low saturation levels, the gravity head is negligible compared to the matric suction. However, at high degrees of saturation, due to minimal matric suction, the gravity head becomes significant, and water cannot flow without a gravity flow.
Based on this paper’s results, it is suggested that the pore size distribution of compacted clay may be the cause of the different swell mechanisms that evolve under different wetting conditions.

2.2. Different Wetting Conditions

The standard procedure for the performance of a swelling test [1] specifies that the specimen should be inundated with water. Quantifying the volumetric strain using this method is not only used in practice engineering, but also in research. This procedure has been employed, for instance, by Puppala et al. [16] for the investigation of clay’s pore structure and mineralogy. This procedure undoubtedly provides an upper limit to the final swell that may be expected. However, in the field, wetting may result from less extreme conditions, such as the absorption of water from underlying wetted layers.
From a mathematical standpoint, the difference between inundation and absorption conditions can be explained by the gravity head (resulting from elevation differences) that is part of the water potential. The soil water potential (ψt) is defined as the potential energy of water in the soil compared to the energy of water at the reference state. The water potential may be defined (see Equation (1)) as the sum of gravitational potential (ψg), matric potential (capillary and adsorptive, ψm), osmotic potential (ψo), and hydrostatic potential (ψh) (e.g., [17]).
ψt = ψg + ψm + ψo + ψh
The gravitational potential is determined by the elevation of the soil water with respect to the chosen reference elevation. The matric potential is determined by the forces that are exerted by the soil matrix (soil particles) on water, which are capillary and adsorptive forces. The osmotic potential is determined by the presence of solutes in the soil. The hydrostatic potential (also called the pressure potential) is derived from the pressure exerted on the point of interest in the soil. The water potential can also be defined in terms of other components. Considering that the soil water potential represents the potential energy, it should be expressed as energy per unit mass or volume of water.
In many cases, and particularly when describing flow equations in unsaturated soil, the water potential is calculated mathematically as the sum of the matric suction and the gravity head (e.g., [18,19,20,21,22]).
Generally, constitutive models of unsaturated soils are extended from those for saturated soils. The water potential is often used to describe unsaturated soil’s mechanical and hydraulic behavior, including volumetric changes (e.g., [2,3,23,24]). In clays with high plasticity, the matric suction can reach thousands of kPa; therefore, in the sum of the matric suction and the gravity head, a few centimeters of elevation difference are negligible, i.e., the water potential and hence the volumetric change behavior are not expected to be significantly influenced by the gravity head. For example, Buzzi [25] suggested that the volumetric strain can be calculated by the confining stress, the initial void ratio, and the initial water potential. Thus, the elevation difference in the model, which is negligible when it comes to the soil water potential, cannot affect its results.
However, the author has obtained different results in previous studies. Nachum et al. [26], in addition to inundated swell tests, conducted swell tests in which the soil was wetted from the specimen’s base while applying different external hydraulic heads. The head is defined as the driving water level relative to the base of the specimen. In the case of inundation, water quickly entered the specimen, causing a rapid and large swell. When a specimen was wetted from the base with an externally applied hydraulic head of zero, water was absorbed into the soil, causing significantly slower and smaller swell. Nachum et al. [27] found that the final degree of saturation was not affected by the wetting conditions of inundation or absorption with different external hydraulic heads. Nachum et al. [26,27] reported only a single series of tests under one initial condition of water content and density. However, the soil’s initial condition has a significant impact on its swell.
This paper, based on a laboratory investigation, examines the impact of the soil’s initial conditions on the swell difference that is caused by different wetting conditions. Swell tests were carried out on specimens prepared at different initial conditions of water content and density and then wetted by inundation or absorption. The aim of this study was to quantify the swell difference resulting from different wetting conditions.

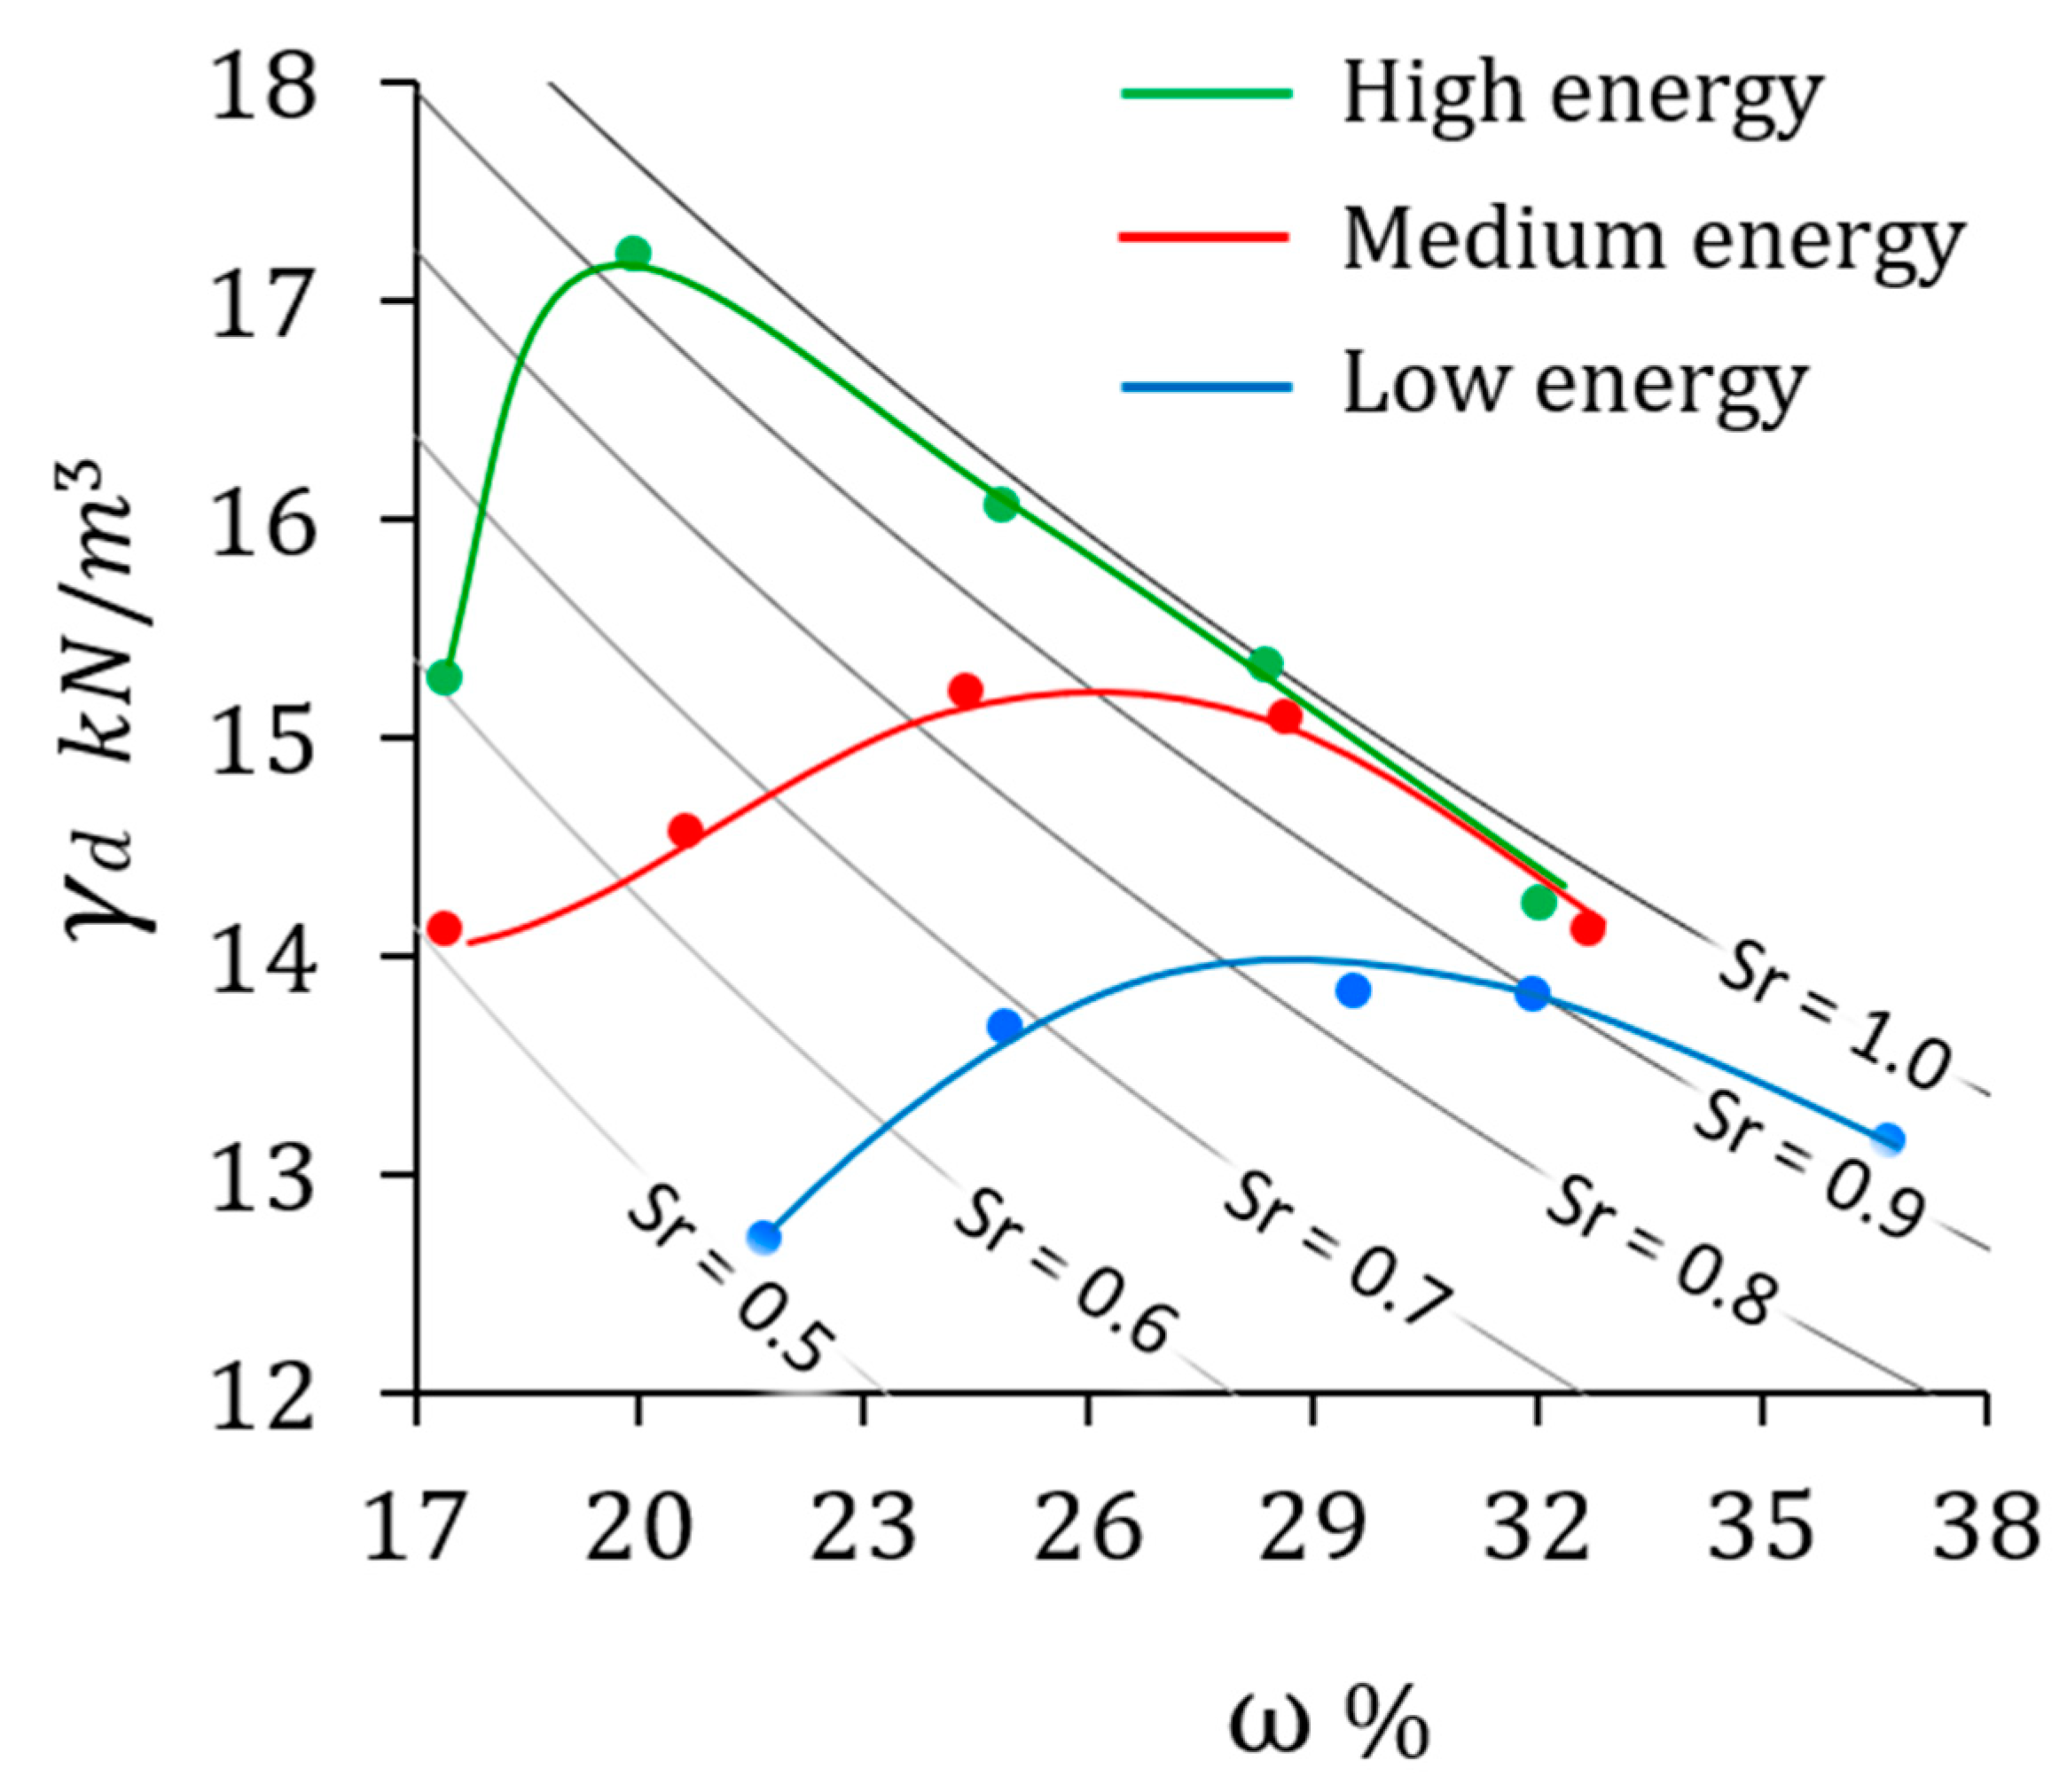
3. Material and Methods

Clay specimens were prepared by remolding a natural, montmorillonite clay sampled from the Jezreal Valley of northern Israel. The USCS classification of the clay is CH, and the indicative properties are a Specific gravity of solids (Gs) of 2.72, Liquid Limit of 75, and Plastic Limit of 21. In terms of particle size (mm), the soil is composed of 5% Sand (2–0.05), 18% Silt (0–0.02), and 77% clay (<0.002). Based on X-ray diffraction (XRD) analyses (reported by [28]), phyllosilicates comprising mainly illite–smectite mixed-layer clays are the dominant soil component, with a dominant montmorillonite component.
The soil compaction curves of three different energy levels are presented in Figure 1, based on [29]. As expected, the compaction curve has an inverted parabolic shape. Kurucuk et al. [30] explain the shape of the compaction curve in terms of unsaturated soil mechanics. The drawing of the curves helps locate the optimal point, from where soils typically show a mono-modal pore size distribution in the micropore range [8].
Test specimens were prepared by mixing a known mass of air-dried soil with a pre-determined mass of water to obtain a particular moisture content. The material was then cured for 24 h in a sealed nylon bag (the moisture content of soil is uniform after 24 h, according to previous tests), remixed, and placed loosely into the 63 mm diameter consolidometer ring, which was outfitted with a top collar. The specimen was statically compressed to a nominal height of 22 mm in a ring between two porous stones. Depending on the initial soil conditions, the compression pressure required for each sample varied, with the full-scale press machine being 2 t (6.4 MPa). The ring was then placed in the consolidometer loading system (external ring) under an applied vertical stress of 30 kPa. The aim was for this vertical stress to simulate the stress on a compacted clay layer about 1 m below the surface of a road pavement [31]. On top of the specimen, a displacement indicator was installed, and water was supplied. In the field, changes in water content may occur at limited soil depths that are determined mainly by local environmental and climatic conditions [32]. In the Jezreal Valley, it has been reported that seasonal water content changes are mainly limited to the upper two meters of the soil profile [33]. Therefore, a depth of 1 m can roughly be a representative height of the swelling clay layer.
Two test conditions were examined: one where the specimen was inundated, and the other where water was absorbed into the soil due to suction forces only. In the field, inundation indicates extreme flooding conditions, while absorption indicates water traction from underlying wet layers. Under the absorption condition, the soil was wetted from the specimen’s base with no (zero) external hydraulic head. A schematic layout of the system is shown in Figure 2. The water was supplied to the specimen from a water reservoir to maintain a constant water level. This system has been used previously by [31] to examine the effect of the quantity of water intake on the swell.
Swell tests were conducted on specimens that were prepared under different initial conditions of water content and dry density. For each initial condition, two duplicate specimens were prepared, one for each wetting condition—inundation and absorption. A total of 32 tests are reported in this paper, 16 for each wetting condition (absorption or inundation). The initial conditions are classified according to the void ratio and the degree of saturation. It has been observed that swell tests generally exhibit high reproducibility (e.g., [34]), and therefore, one test should be considered faithfully representative of each soil and wetting condition.
The tests were terminated after ensuring that the swell had been completed, so the measurement of the swell was objective and not time-dependent. Testing durations vary based on the initial conditions of the soil, from a few days to three weeks in dense soils. The swelling rate was significantly higher under inundation, but the differences in rates are well known and not the focus of this study.

4. Results and Discussion

The tests results are summarized in Table 1. Figure 3 shows the measured swell as a function of the initial void ratio (before water was supplied to the soil). Each point in the figure is the result of a single swell test. Each test is classified according to (a) the wetting conditions (inundation or absorption) and (b) the initial degree of saturation, Sr. Three initial Sr values were examined: 0.71, 0.84, and 0.93. Six trend lines were fitted, each for a defined wetting condition and initial Sr. Under the inundation condition, the trend lines have a similar shape for the three degrees of saturation; the adsorption curves differ from the inundation curves under conditions of low initial void ratios, and the difference increases with the increasing degree of saturation.
The minimum initial void ratio value considered was 0.63, a reasonable minimum value in high-plasticity clays [35].
The results show two main trends:
(1)
As the initial void ratio decreases, it is more likely that a swell difference will occur.
(2)
As the initial degree of saturation increases, a swell difference appears to develop from a higher void ratio.
These observations may be related to the pore size distributions. It can be concluded from the literature, as will be explained, that these two trends are associated with mono-modal pore size distributions in the micropore range.
Alonso et al. [36] showed that during soil compaction (forced decreases in the void ratio), the micropores are not changed, whereas the macropores are decreased in both quantity and size; as a result, clay at a low void ratio will be characterized mainly by micropores. Additionally, soil with a low void ratio and high saturation will be on the wetter side of the optimum (see compaction curves in Figure 1) and thus will be expected to have a mono-modal micropore pore size distribution [8]. Based on those results, the soil will exhibit a mono-modal pore size distribution in the micropore range when different wetting conditions cause different swell magnitudes—low void ratios and high saturation levels.
Pedrotti and Tarantino [37] showed that the distribution of the micropores is associated with pores in slurry samples, and the distribution of the macropores is associated with the distribution of pores in samples that are prepared from dry powder. This has led to a novel view on compacted soil’s microstructure, where macropores are assumed to be just pores filled with air and micropores are assumed to be just pores filled with water. Therefore, as the degree of saturation is higher, the pores in the soil will be mainly micropores.
These observations [36,37] support the claim that the two trends observed above characterized soil with micropore distributions. The micropores are characterized by much higher suction forces and much lower hydraulic conductivity compared to the macropores (e.g., [13]). When the soil has a bi-modal pore size distribution, characterized by micro- and macropores, the water can advance through the macropores due to their high hydraulic conductivity. After water is absorbed into the macropores, the water is available to be adsorbed into the micropores. The adsorption of the water into the micropores is the source of the swell. During swelling, the pores tend to rebound because the pore–water pressure increases from negative values to zero (e.g., [14,37]). In this case, the different wetting conditions do not affect the swell. However, when the soil is characterized by micropore distributions, the low hydraulic conductivity of micropores tends to result in zero water movement, particularly at high saturation levels, when the soil’s matric suction is low. The gravity head, which is negligible compared to the matric suction at lower degrees of saturation, becomes significant at high degrees of saturation. Under inundation, the water arises from all the sample boundaries, and water may be absorbed into the soil without any dependency on suction forces.
Allegedly, the larger swelling strain in the inundation condition may be mainly due to the hydration from two boundaries (from both the top and the bottom ends), which may lead to a higher degree of saturation, in comparison to an absorption condition where water enters only from the bottom end. In order to test this, after the tests were completed, the specimens were extracted from the cell and weighed, their heights were measured, and water content samples were taken. Based on these measurements the final degree of saturation was calculated. The average values for the different conditions are summarized in Table 1. According to Table 1, the final degree of saturation does not appear to be affected by the wetting conditions. The saturation levels are consistent with those expected for inundated specimens (e.g., [38,39,40,41]). The similar saturation level in different wetting conditions is another indicator that models are unable to predict the observed phenomenon. Zhou et al. [42] use saturation to describe volume changes in models. However, if saturation does not depend on wetting conditions, it is impossible to quantify the effect of wetting conditions on volume changes.
Even if the degrees of saturation in both wetting conditions are equal, there is a theoretical possibility that the absorption conditions may cause an inhomogeneous distribution of Sr along the height of specimens, which could explain the swell difference. Generally, soils with a higher void ratio have higher permeability, and at a high permeability, the inhomogeneousness due to different wetting conditions may be less significant. However, as the void ratio decreases, lower permeability may cause a greater variance in the water distribution under different wetting conditions. When soil is initially saturated and the water potential is small, the influence is greater. Even though it may seem intuitive that the absorption conditions might produce an inhomogeneous distribution of Sr throughout the specimen height, a preliminary test carried out on several samples indicates that this is not the case. In order to examine the internal Sr distribution, the specimens were divided into sub-slices after the tests were completed, and the degree of saturation in each slice was measured; the results of these divisions did not indicate a distinguishable distribution between the sub-slices. However, due to the small specimen’s height, the division was not simple, and these are only preliminary results, and this requires further investigation. However, even if an internal Sr distribution is the explanation for this, from an unsaturated soil mechanics viewpoint, the reason will be the micropore mono-modal pore size distribution, since the permeability and suction forces are determined by the micropores’ properties. As a result, the explanation presented above is valid. In practice, regardless of the explanation for the observed phenomenon, it is important to consider this phenomenon, which is not emphasized in standards or the literature based on inundation tests without considering different wetting conditions.
To correlate volume changes with water potential, soil water characteristic curves were examined. Samples were prepared at a density of 14.5 kN/m3 in a wide range of water contents; 63 mm diameter samples were statically compressed to a 9 mm height, and their weights were determined based on their nominal water contents.
The water potential was measured using a WP4C device (METER Group, Inc., Pullman, WA, USA) that operates based on the principle of a relative humidity cell. Figure 4 shows the results of the measurements. It can be seen from the results that for a dry density of 14.5 kN/m3, at a saturation level of 90%, the suction is about 1000 kPa, which is equivalent to 100 m of water height in terms of mechanical water pressure. In comparison with this value, the height difference of 3 cm between inundation and absorption is negligible. Despite this, Table 1 shows a 15% swell difference for an Sr of 0.93 and dry density of 14.5 kN/m3. Even though the gravity head value is mathematically negligible, it appears to create a large difference in swelling, because the matric suction and gravity head cannot be mathematically coupled. The matric suction is, by definition, a potential energy variable, not a mechanical stress [10]; summing the matric suction with the gravity head would not be an error if it was a stress variable, but it is not.
In general, when high suction values are used in models and in unsaturated flow equations, the water potential requires balancing, because it has high values. Darcy’s law is often used to describe water flow. While Darcy developed this law based on empirical evidence for saturated flows, it has also been applied to unsaturated flows and swelling soils (e.g., [43,44]) in which the hydraulic head, H, is replaced by the water potential of the soil, ψ (Equation (2)).
q = K ψ
where q is the water flux and K is the permeability. With Darcy’s law, the water potential can reach thousands of kPa for unsaturated flows, so the balance is calculated by multiplying enormous suction values by near-zero permeability values, which results in a reasonable water flux value (e.g., [45,46]). However, there are some difficulties when the goal is to obtain a value of 1 and the mathematical method is to multiply 106 by 10−6. There seems to be a problem with using soil water potential as a head variable, since it does not distinguish between capillary tension, absorption, and external gravity head.
Practical engineering guides require minimization of the swelling potential to a limited value of movement or to a percentage of swell based on inundation tests (e.g., [33,47]). Wetting conditions may be significant when estimating expected damage to roads, structures, and infrastructures. The common approach to design, based on the inundation of test specimens, could be economically wasteful. Moreover, it may also result in damage due to different movements where, for example, a road alignment includes sections that may be flooded and others where wetting will be a result of suction alone. A more realistic estimation of the swell should be based on testing conditions that are consistent with those expected in the field, particularly when working with highly compacted clays at a relatively high initial degree of saturation.
The standard procedure to determine swelling potential [1] requires that “the specimen is inundated with test water and the one-dimensional wetting-induced swell or collapse strain is measured”. According to the results, this procedure provides an upper limit to the swell that may be expected in flooded conditions. It may, however, be inaccurate in other cases.

5. Conclusions

This paper examines the soil conditions in which swell differences caused by different wetting conditions will occur. Swell tests on high-plasticity clay were conducted under two conditions, one where the specimen was inundated, and the other where water was only absorbed in the soil due to suction forces. The results indicate that the different wetting conditions may lead to different swell potential.
It was found that the different wetting conditions will cause different swell magnitudes (1) as the initial void ratio decreases and (2) as the initial degree of saturation increases. This phenomenon has been explained in terms of the pore size distributions for unsaturated clays, and the unique mono-modal micropore pore size distribution that is expected under these initial soil conditions of a low void ratio and high degree of saturation. Since micropores have low hydraulic conductivity, the water movement tends to be zero. In absorption conditions, less water is absorbed into the soil, resulting in less volumetric strain. However, under inundation, the water comes from all the sample boundaries, and water may be adsorbed into the soil with no dependency on suction forces. The gravity head, which is commonly negligible compared to the matric suction, becomes significant.
It is possible that the standard design approach [1], that guides the inundation of a specimen will, in some cases, result in damage arising from different movements. For example, a road alignment may include sections that will be flooded and others that will be wet only by suction. A realistic estimation of the swell and therefore of the damage expected to roads, structures, and infrastructures should be based on testing conditions that are consistent with those expected in the field, in particular when working with highly compacted clays and with clays at a relatively high initial degree of saturation.
Even though these conclusions do not seem innovative, when looking at accepted methods for swell estimation, this simple and trivial issue does not seem to be generalized there. For example, Buzzi [25] suggests that the volumetric strain can be determined using the confining stress, initial void ratio, and initial water potential; since these three parameters are the same under different wetting conditions (as the gravity head is negligible compared to the matric suction), the model would have missed the swell differences resulting from different wetting conditions.

Funding

This research received no external funding.

Institutional Review Board Statement

Not applicable.

Informed Consent Statement

Not applicable.

Data Availability Statement

The original contributions presented in this study are included in the article. Further inquiries can be directed to the corresponding author.

Conflicts of Interest

The authors declare no conflicts of interest.

References

  1. ASTM D4546–14; Standard Test Methods for One-Dimensional Swell or Collapse of Soils. ASTM International: West Conshohocken, PA, USA, 2014.
  2. Alonso, E.E.; Gens, A.; Josa, A. A Constitutive Model for Partially Saturated Soils. Géotechnique 1990, 40, 405–430. [Google Scholar] [CrossRef]
  3. Vanapalli, S.; Lu, L. A State-of-the Art Review of 1-D Heave Prediction Methods for Expansive Soils. Int. J. Geotech. Eng. 2012, 6, 15–41. [Google Scholar] [CrossRef]
  4. Ikechukwu, A.F.; Mostafa, M.M. Swelling pressure prediction of compacted unsaturated expansive soils. Int. J. Eng. Res. Afr. 2022, 59, 119–134. [Google Scholar] [CrossRef]
  5. Corapcioglu, M.Y.; Haridas, A. Transport and fate of microorganisms in porous media: A theoretical investigation. J. Hydrol. 1984, 72, 149–169. [Google Scholar] [CrossRef]
  6. Perkins, T.K.; Johnston, O. A review of diffusion and dispersion in porous media. Soc. Pet. Eng. J. 1963, 3, 70–84. [Google Scholar] [CrossRef]
  7. Gens, A.; Alonso, E.E.; Suriol, J.; Lloret, A. Effect of structure on the volumetric behavior of a compacted soil. In Proceedings of the First International Conference on Unsaturated Soils, Paris, France, 6–8 September 1995; pp. 83–88. [Google Scholar]
  8. Delage, P.; Audiguier, M.; Cui, Y.J.; Howat, D. Microstructure of a compacted silt. Can. Geotech. J. 1996, 33, 150–158. [Google Scholar] [CrossRef]
  9. Romero, E.; Gens, A.; Lloret, A. Water permeability, water retention and microstructure of unsaturated compacted Boom clay. Eng. Geol. 1999, 54, 117–127. [Google Scholar] [CrossRef]
  10. Baker, R.; Frydman, S. Unsaturated soil mechanics; critical review of physical foundations. Eng. Geol. 2009, 106, 26–39. [Google Scholar] [CrossRef]
  11. Vanapalli, S.; Fredlund, D.G.; Pufahl, D.E. Influence of soil structure and stress history on the soil-water characteristics of a compacted till. Géotechnique 2001, 51, 573–576. [Google Scholar] [CrossRef]
  12. Beven, K.; Germann, P. Macropores and water flow in soils. Water Resour. Res. 1982, 18, 1311–1325. [Google Scholar] [CrossRef]
  13. Gerke, H.H.; Van Genuchten, M.T. A dual-porosity model for simulating the preferential movement of water and solutes in structured porous media. Water Resour. Res. 1993, 29, 305–319. [Google Scholar] [CrossRef]
  14. Tarantino, A. Unsaturated soils: Compacted versus reconstituted states. In Proceedings of the 5th International Conference on Unsaturated Soil, Barcelona, Spain, 6–8 September 2010; pp. 113–136. [Google Scholar]
  15. Wen, T.; Luo, Y.; Tang, M.; Chen, X.; Shao, L. Effects of representative elementary volume size on three-dimensional pore characteristics for modified granite residual soil. J. Hydrol. 2024, 643, 132006. [Google Scholar] [CrossRef]
  16. Puppala, A.J.; Pedarla, A.; Pino, A.; Hoyos, L.R. Diffused double-layer swell prediction model to better characterize natural expansive clays. J. Eng. Mech. 2017, 143, 04017069-1. [Google Scholar] [CrossRef]
  17. Bittelli, M. Measuring soil water potential for water management in agriculture: A review. Sustainability 2010, 2, 1226–1251. [Google Scholar] [CrossRef]
  18. Bolt, G.H.; Miller, R.D. Calculation of total and component potentials of water in soil. Eos Trans. Am. Geophys. Union 1958, 39, 917–928. [Google Scholar]
  19. Brooks, R.H.; Corey, A.T. Hydraulic Properties of Porous Media; Hydrology Paper; Colorado State University: Fort Collins, CO, USA, 1964; Volume 3. [Google Scholar]
  20. Philip, J.R. Flow in porous media. In Theoretical and Applied Mechanics, Proceedings of the 13th International Congress of Theoretical and Applied Mechanics, Moskow, Russia, 16–21 August 1972; Springer: Berlin, Heidelberg, 1973; pp. 279–294. [Google Scholar]
  21. Raats, P.A. Developments in soil–water physics since the mid 1960s. Geoderma 2001, 100, 355–387. [Google Scholar] [CrossRef]
  22. Bhattacharya, A. Soil Water Deficit and Physiological Issues in Plants; Springer: Singapore, 2021; pp. 393–488. [Google Scholar]
  23. Loret, B.; Khalili, N. An effective stress elastic–plastic model for unsaturated porous media. Mech. Mater. 2002, 34, 97–116. [Google Scholar] [CrossRef]
  24. Tarantino, A. A water retention model for deformable soils. Geotechnique 2009, 59, 751–762. [Google Scholar] [CrossRef]
  25. Buzzi, O. On the use of dimensional analysis to predict swelling strain. Eng. Geol. 2010, 116, 149–156. [Google Scholar] [CrossRef]
  26. Nachum, S.; Talesnick, M.; Frydman, S. Effect of External Hydraulic Head on Swelling of Unsaturated Clay. Presented at the 4th European Conference on Unsaturated Soils; EDP Sciences: Lisbon, Portugal, 2020; Volume 195. [Google Scholar]
  27. Nachum, S.; Talesnick, M.; Frydman, S. A new apparatus for studying laterally restrained swell of compacted clay with lateral pressure measurement. Geotech. Test. J. 2021, 44, 547–563. [Google Scholar] [CrossRef]
  28. Nachum, S.; Talesnick, M.; Weisberg, E.; Zaidenberg, R. Development of swelling induced shear and slickensides in Vertisols. Geoderma 2022, 409, 115629. [Google Scholar] [CrossRef]
  29. Primo, H. Use of ANSS as a Stabilizer for Fine Grained Swelling Soils. Master’s Thesis, Technion-Israel Institute of Technology, Haifa, Israel, 2010. (In Hebrew). [Google Scholar]
  30. Kurucuk, N.; Kodikara, J.; Fredlund, D.G. Theoretical modelling of the compaction curve. In Unsaturated Soils. Advances in Geo-Engineering; Proceedings of the 1st European Conference, E-UNSAT, Durham, UK, 2–4 July 2008; Routledge: London, UK, 2008; pp. 375–379. [Google Scholar]
  31. Nachum, S.; Talesnick, M.; Frydman, S. Swelling of Compacted Clay as Affected by Quantity of Water Intake and Soil Structure. Geotech. Geol. Eng. 2022, 40, 4961–4974. [Google Scholar] [CrossRef]
  32. EM 1110-1-1904; Engineer Manual 1110-1-1904. Engineering and Design Settlement Analysis. U.S. Army Corps of Engineers: Washington, DC, USA, 1990.
  33. Kassiff, G.; Livneh, M.; Wiseman, G. Pavements on Expansive Clays; Academic Press: Jerusalem, Israel, 1969. [Google Scholar]
  34. Onyekpe, U. Data on one-dimensional vertical free swelling potential of soils and related soil properties. Data Brief 2021, 39, 107608. [Google Scholar]
  35. VSS SN (Schweizer Norm) SN 670 010b; Characteristic Coefficients of Soils. Federal Institute of Technology: Lausanne, Switzerland, 2000.
  36. Alonso, E.E.; Pinyol, N.M.; Gens, A. Compacted soil behaviour: Initial state and constitutive modelling. Geotechnique 2013, 63, 463–478. [Google Scholar] [CrossRef]
  37. Pedrotti, M.; Tarantino, A. A conceptual constitutive model unifying slurried (saturated), compacted (unsaturated) and dry states. Géotechnique 2019, 69, 217–233. [Google Scholar] [CrossRef]
  38. Rogers, L.E.; Wright, S.G. The Effects of Wetting and Drying on the Long-Term Shear Strength Parameters for Compacted Beaumont Clay; Report No. FHWA/TX 87/40+436-2F; University of Texas: Austin, TX, USA, 1986. [Google Scholar]
  39. Noorany, I.; Stanley, J.V. Settlement of Compacted Fills Caused by Wetting. In Vertical and Horizontal Deformations of Foundations and Embankments; ASCE (American Society of Civil Engineers): Reston, VA, USA, 1994; pp. 1516–1530. [Google Scholar]
  40. Mašín, D. Predicting the Dependency of a Degree of Saturation on Void Ratio and Suction Using Effective Stress Principle for Unsaturated Soils. Int. J. Numer. Anal. Methods Geomech. 2009, 34, 73–90. [Google Scholar] [CrossRef]
  41. Monroy, R.; Zdravkovic, L.; Ridley, A. Evolution of Microstructure in Compacted London Clay during Wetting and Loading. Géotechnique 2010, 60, 105–119. [Google Scholar] [CrossRef]
  42. Zhou, A.N.; Sheng, D.; Sloan, S.W.; Gens, A. Interpretation of unsaturated soil behaviour in the stress–saturation space, I: Volume change and water retention behaviour. Comput. Geotech. 2012, 43, 178–187. [Google Scholar] [CrossRef]
  43. Zaslavsky, D. Saturated and unsaturated flow equation in an unstable porous medium. Soil. Sci. 1964, 98, 317–321. [Google Scholar] [CrossRef]
  44. Smiles, D.E. Hydrology of swelling soils: A review. Soil. Res. 2000, 38, 501–521. [Google Scholar] [CrossRef]
  45. Van Genuchten, M.T. A closed-form equation for predicting the hydraulic conductivity of unsaturated soils. Soil. Sci. Soc. Am. J. 1980, 44, 892–898. [Google Scholar] [CrossRef]
  46. Assouline, S.; Selker, J. Introduction and evaluation of a Weibull hydraulic conductivity-pressure head relationship for unsaturated soils. Water Resour. Res. 2017, 53, 4956–4964. [Google Scholar] [CrossRef]
  47. Snethen, D.R.; Johnson, L.D.; Patrick, D.M. An Evaluation of Expedient Methodology for Identification of Potentially Expansive Soils; No. FHWA-RD-77-94; Office of Research and Development, Federal Highway Administration: Washington, DC, USA, 1977. [Google Scholar]
Figure 1. Test soil compaction curves, based on [29].
Standards 05 00001 g001
Figure 2. Test setup for the different wetting conditions—absorption (left side) and inundation (right side).
Standards 05 00001 g002
Figure 3. Swell as a function of the initial void ratio.
Standards 05 00001 g003
Figure 4. Soil water characteristic curves.
Standards 05 00001 g004
Table 1. Tests results.
Initial Values Final
ω %γd
kN/m3
e Swell %Swell Difference %SrSr
Initial
Sr
about
0.71
25.413.80.97inundation 4.8−2.10.87
absorption4.9 0.91
20.715.10.80inundation 8.9−1.60.92
absorption9.1 0.93
19.315.70.74inundation 11.16.90.92
absorption10.3 0.92
17.616.30.67inundation 13.67.90.94
absorption12.6 0.94
17.216.50.65inundation 15.411.90.95
absorption13.6 0.95
0.920.93average
Initial
Sr
about
0.84
30.713.70.99inundation 3.71.10.96
absorption3.6 0.95
24.215.20.79inundation 7.95.80.95
absorption7.4 0.96
22.615.80.72inundation 9.511.10.94
absorption8.5 0.95
20.416.30.67inundation 11.419.70.95
absorption9.2 0.95
0.950.96average
Initial
Sr
about
0.93
35.413.41.03inundation 1.94.00.97
absorption1.8 0.98
30.414.20.91inundation 3.114.30.96
absorption2.7 0.95
30.114.60.87inundation 3.815.60.99
absorption3.2 0.98
27.115.00.81inundation 5.222.10.96
absorption4.1 0.96
25.315.40.76inundation 6.024.60.96
absorption4.5 0.94
25.415.80.72inundation 6.930.50.96
absorption4.8 0.95
23.116.30.67inundation 8.038.90.99
absorption4.9 0.98
0.970.96average
Disclaimer/Publisher’s Note: The statements, opinions and data contained in all publications are solely those of the individual author(s) and contributor(s) and not of MDPI and/or the editor(s). MDPI and/or the editor(s) disclaim responsibility for any injury to people or property resulting from any ideas, methods, instructions or products referred to in the content.

