Autologous Mesenchymal Stem Cell Treatment is Consistently Effective for the Treatment of Knee Osteoarthritis: The Results of a Systematic Review of Treatment and Comparison to a Placebo Group

Abstract
1. Introduction
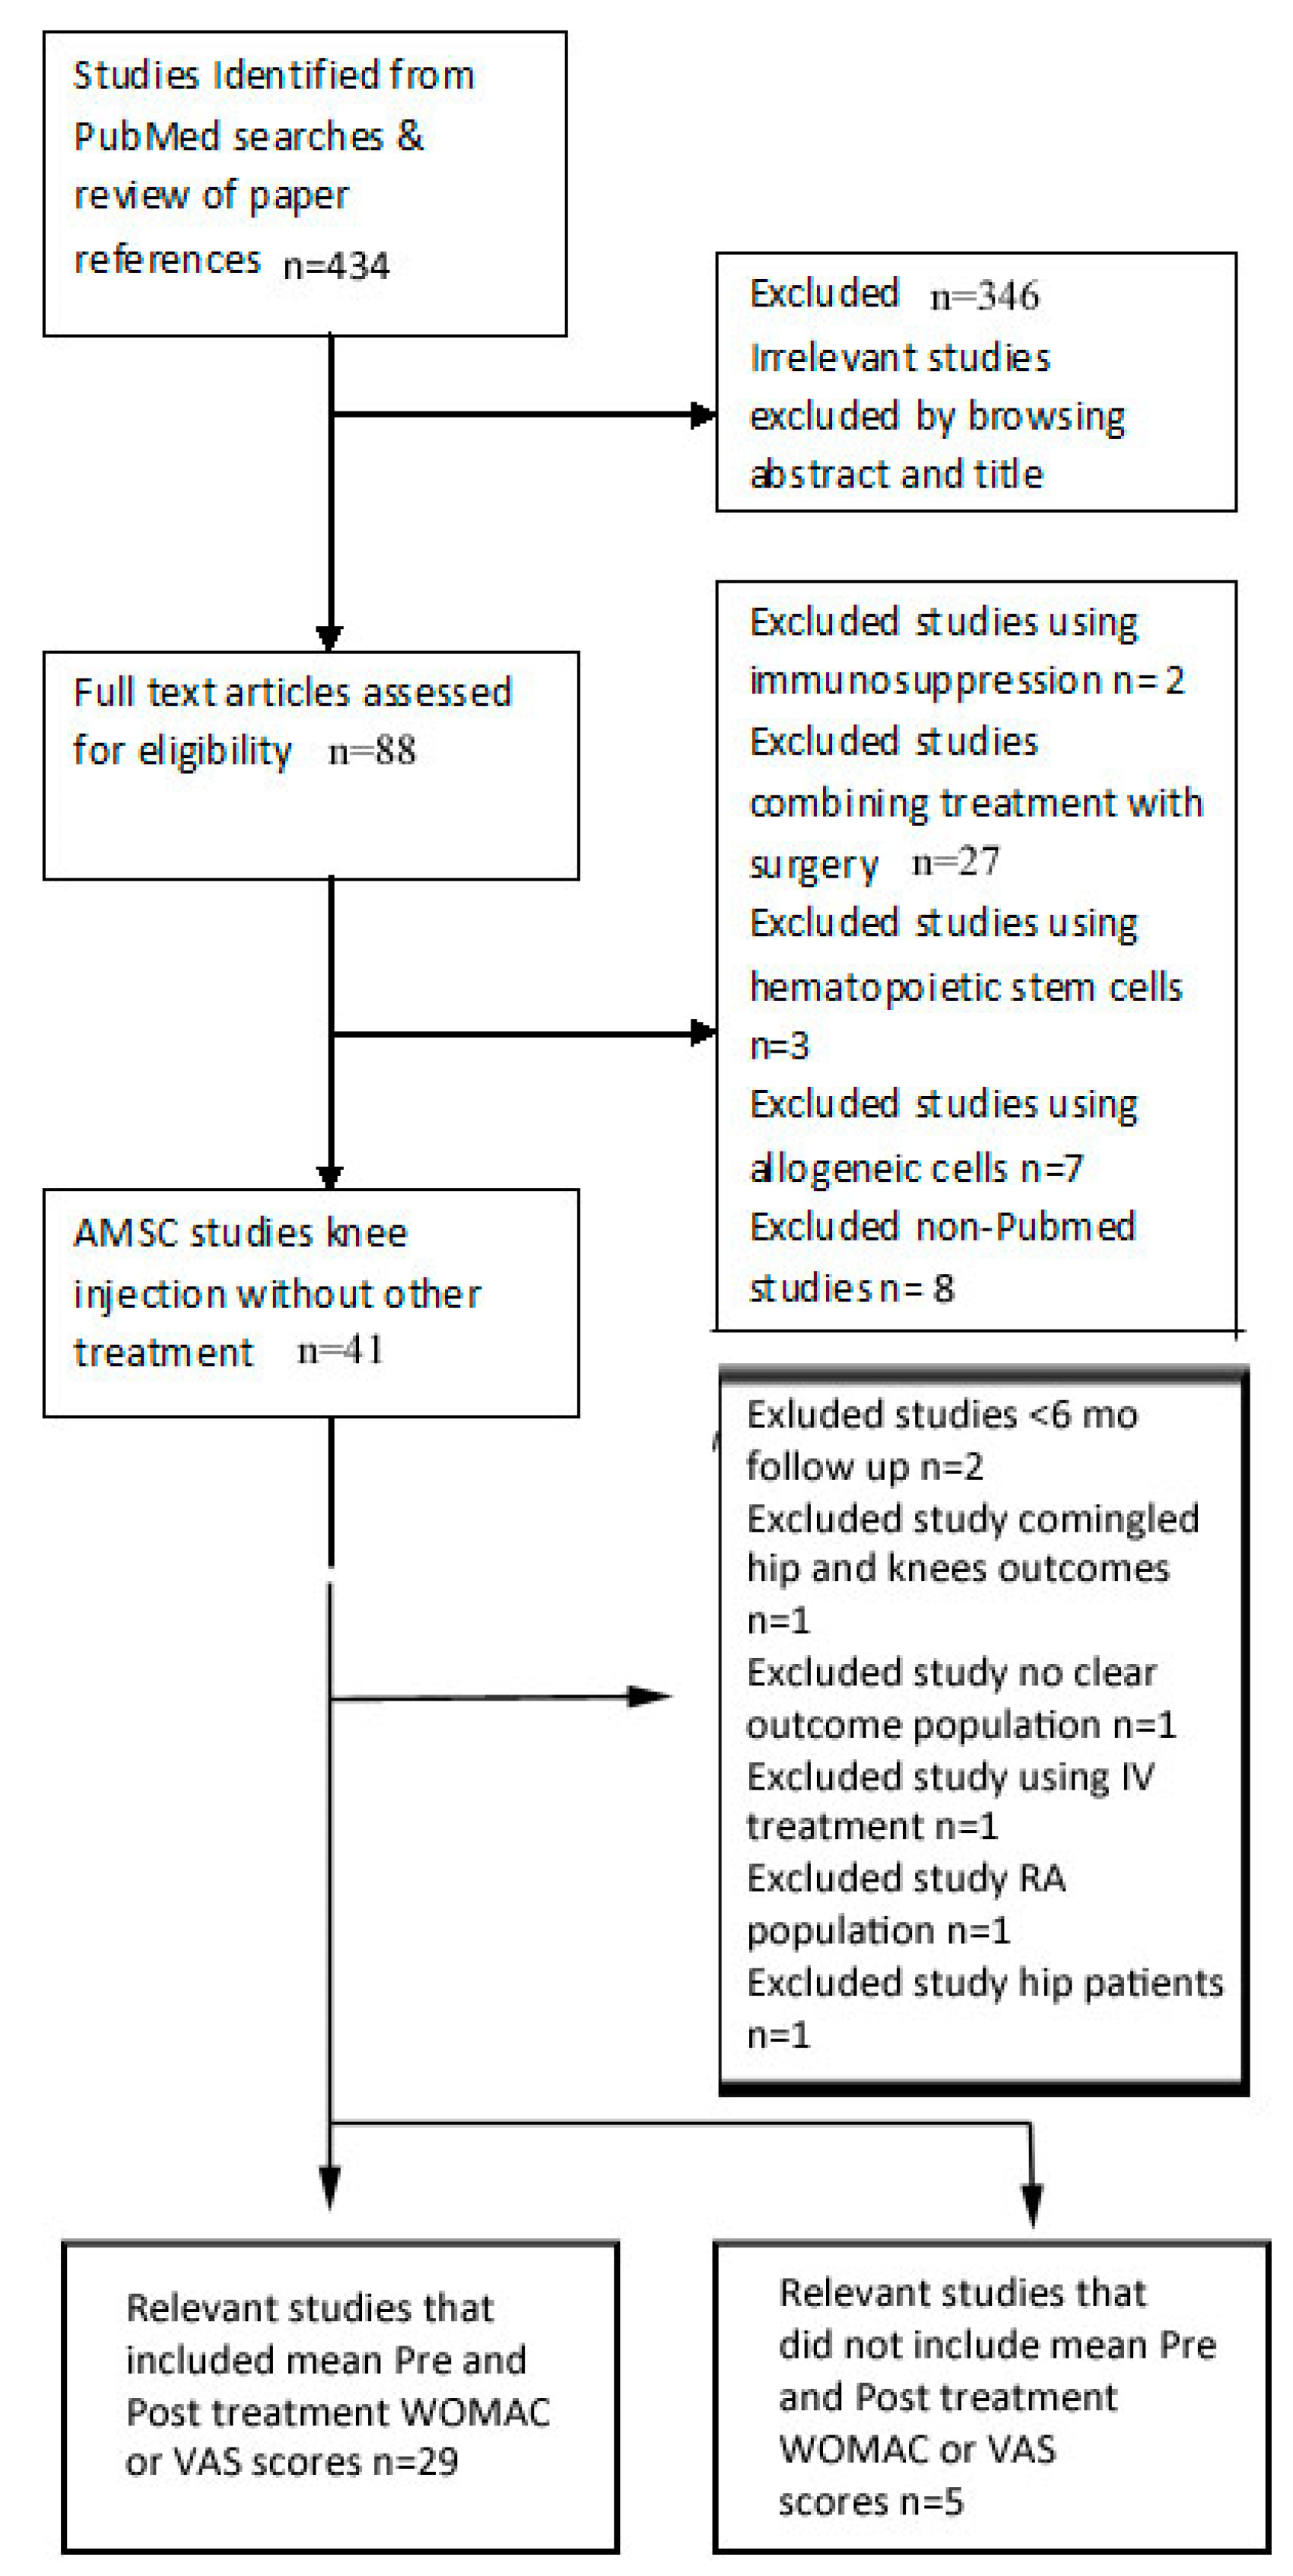
2. Materials and Methods
3. Results
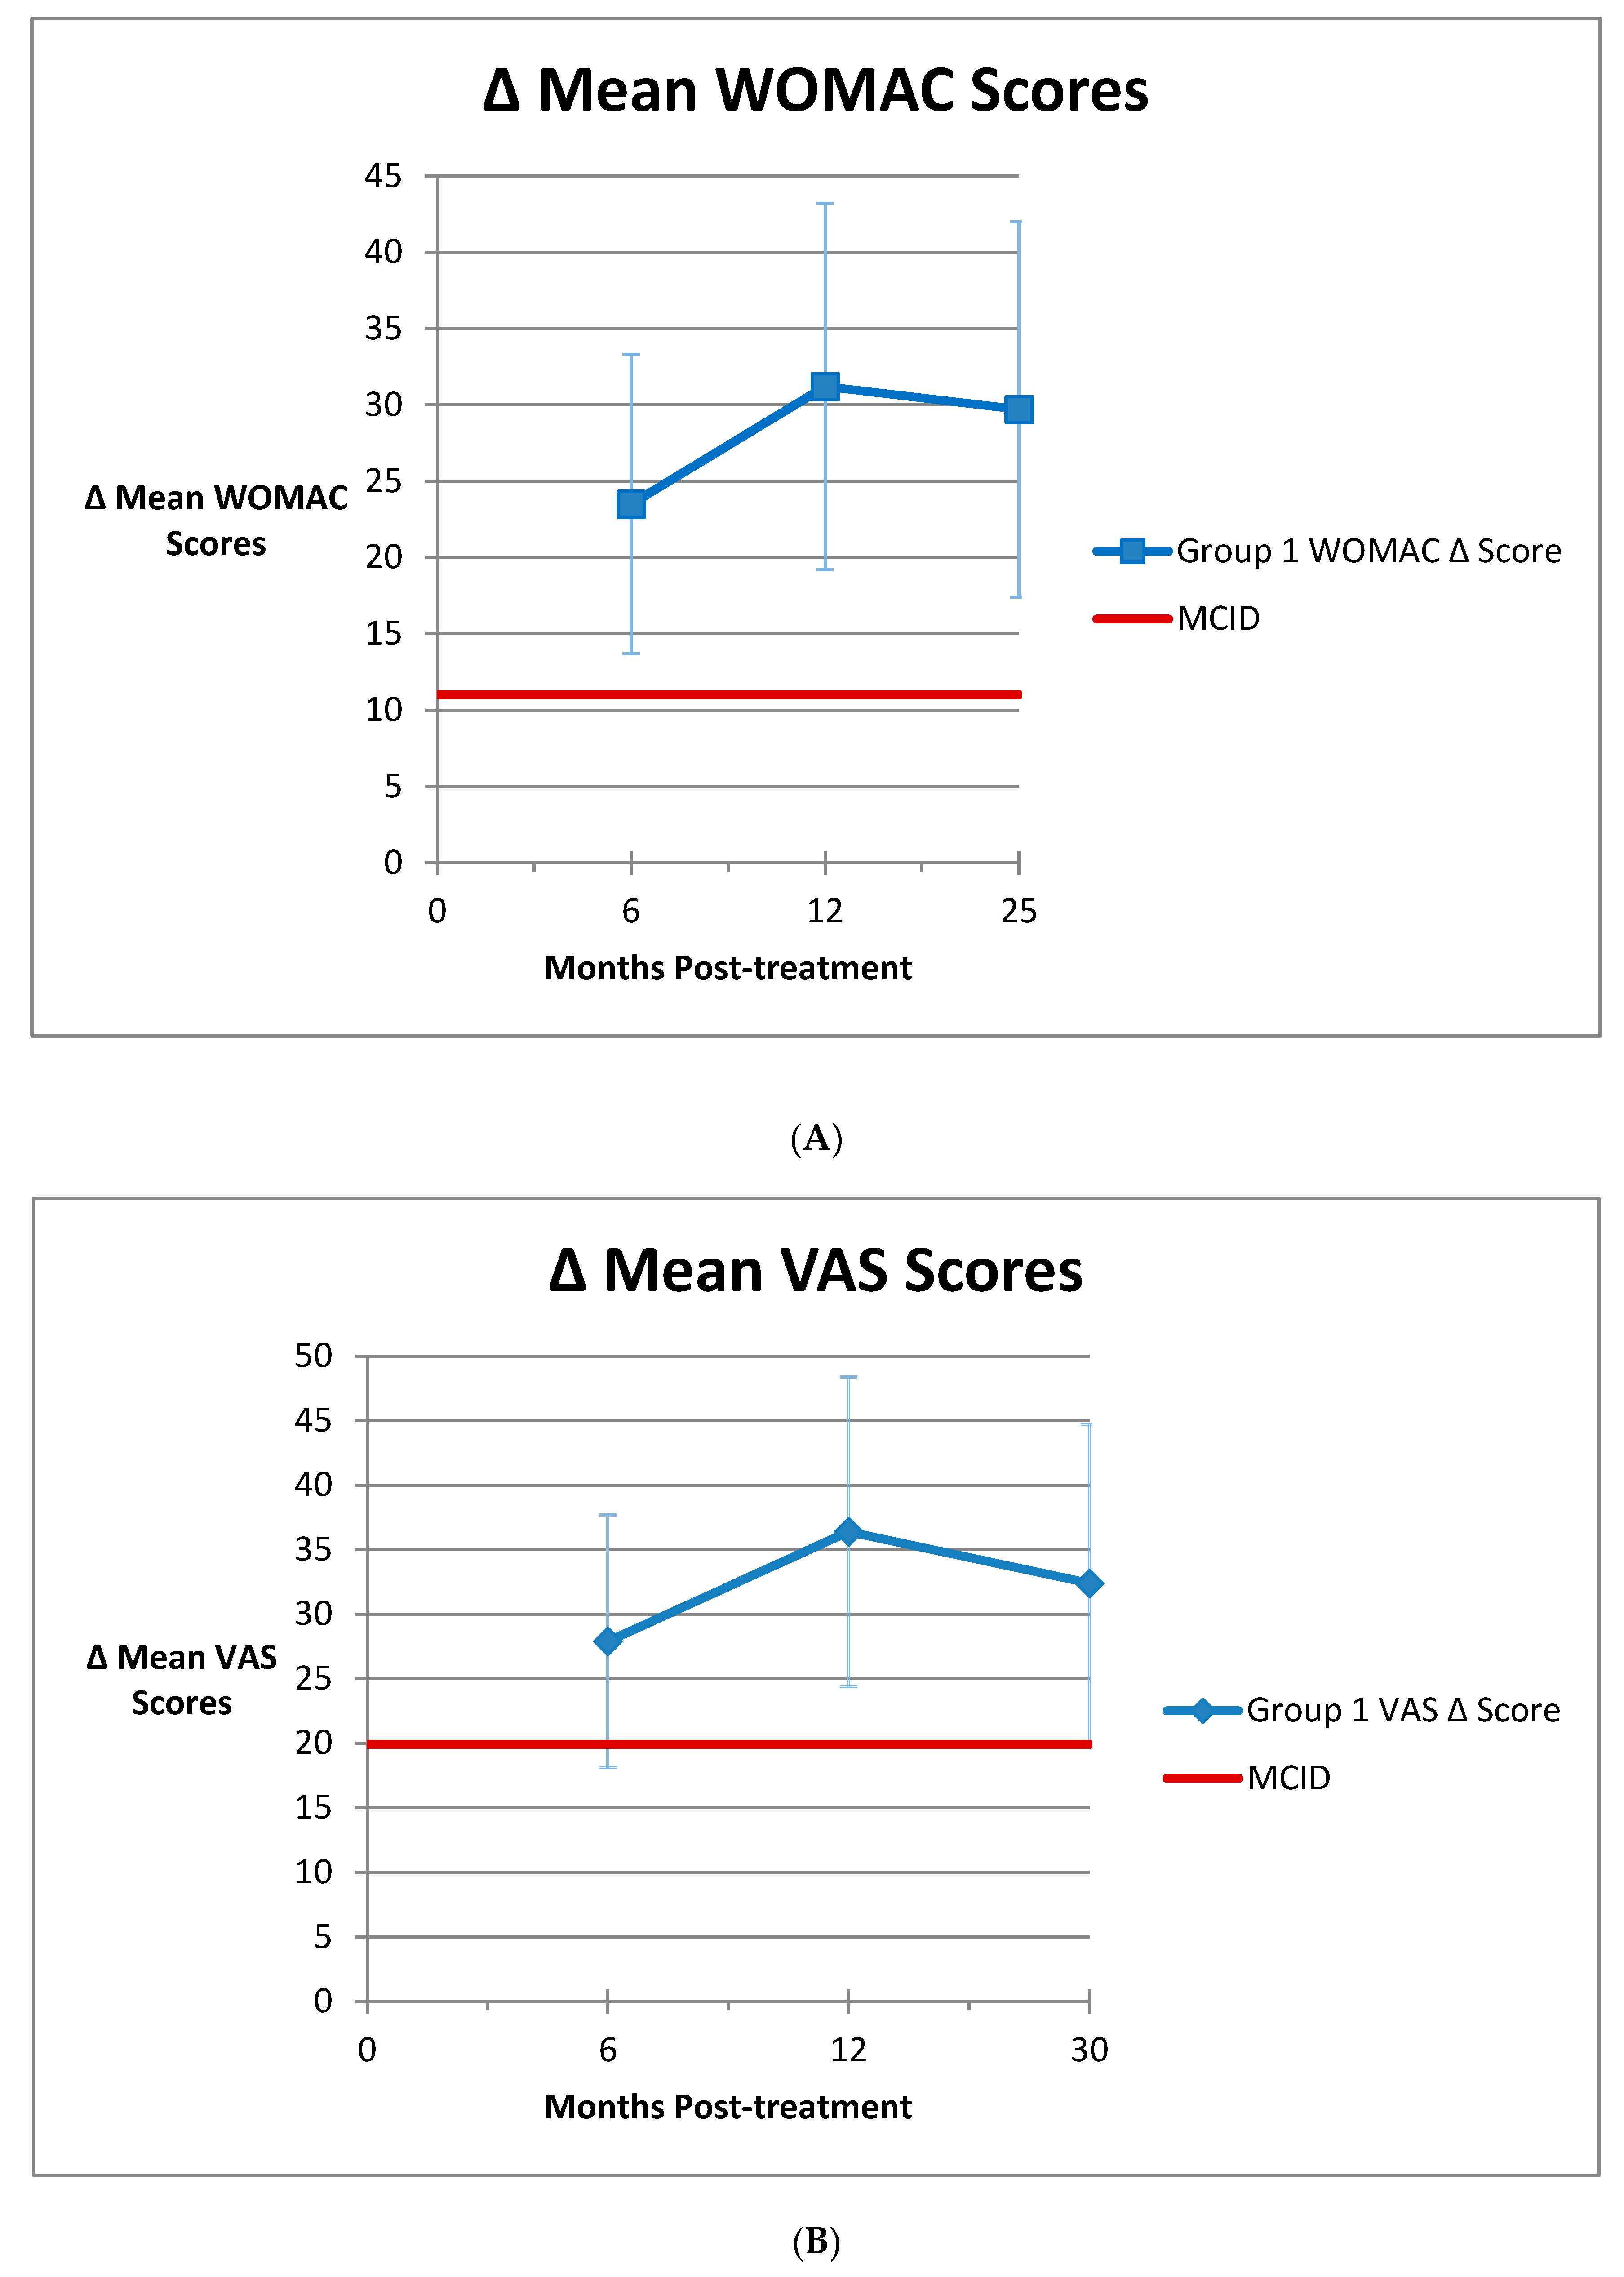
3.1. Group 1
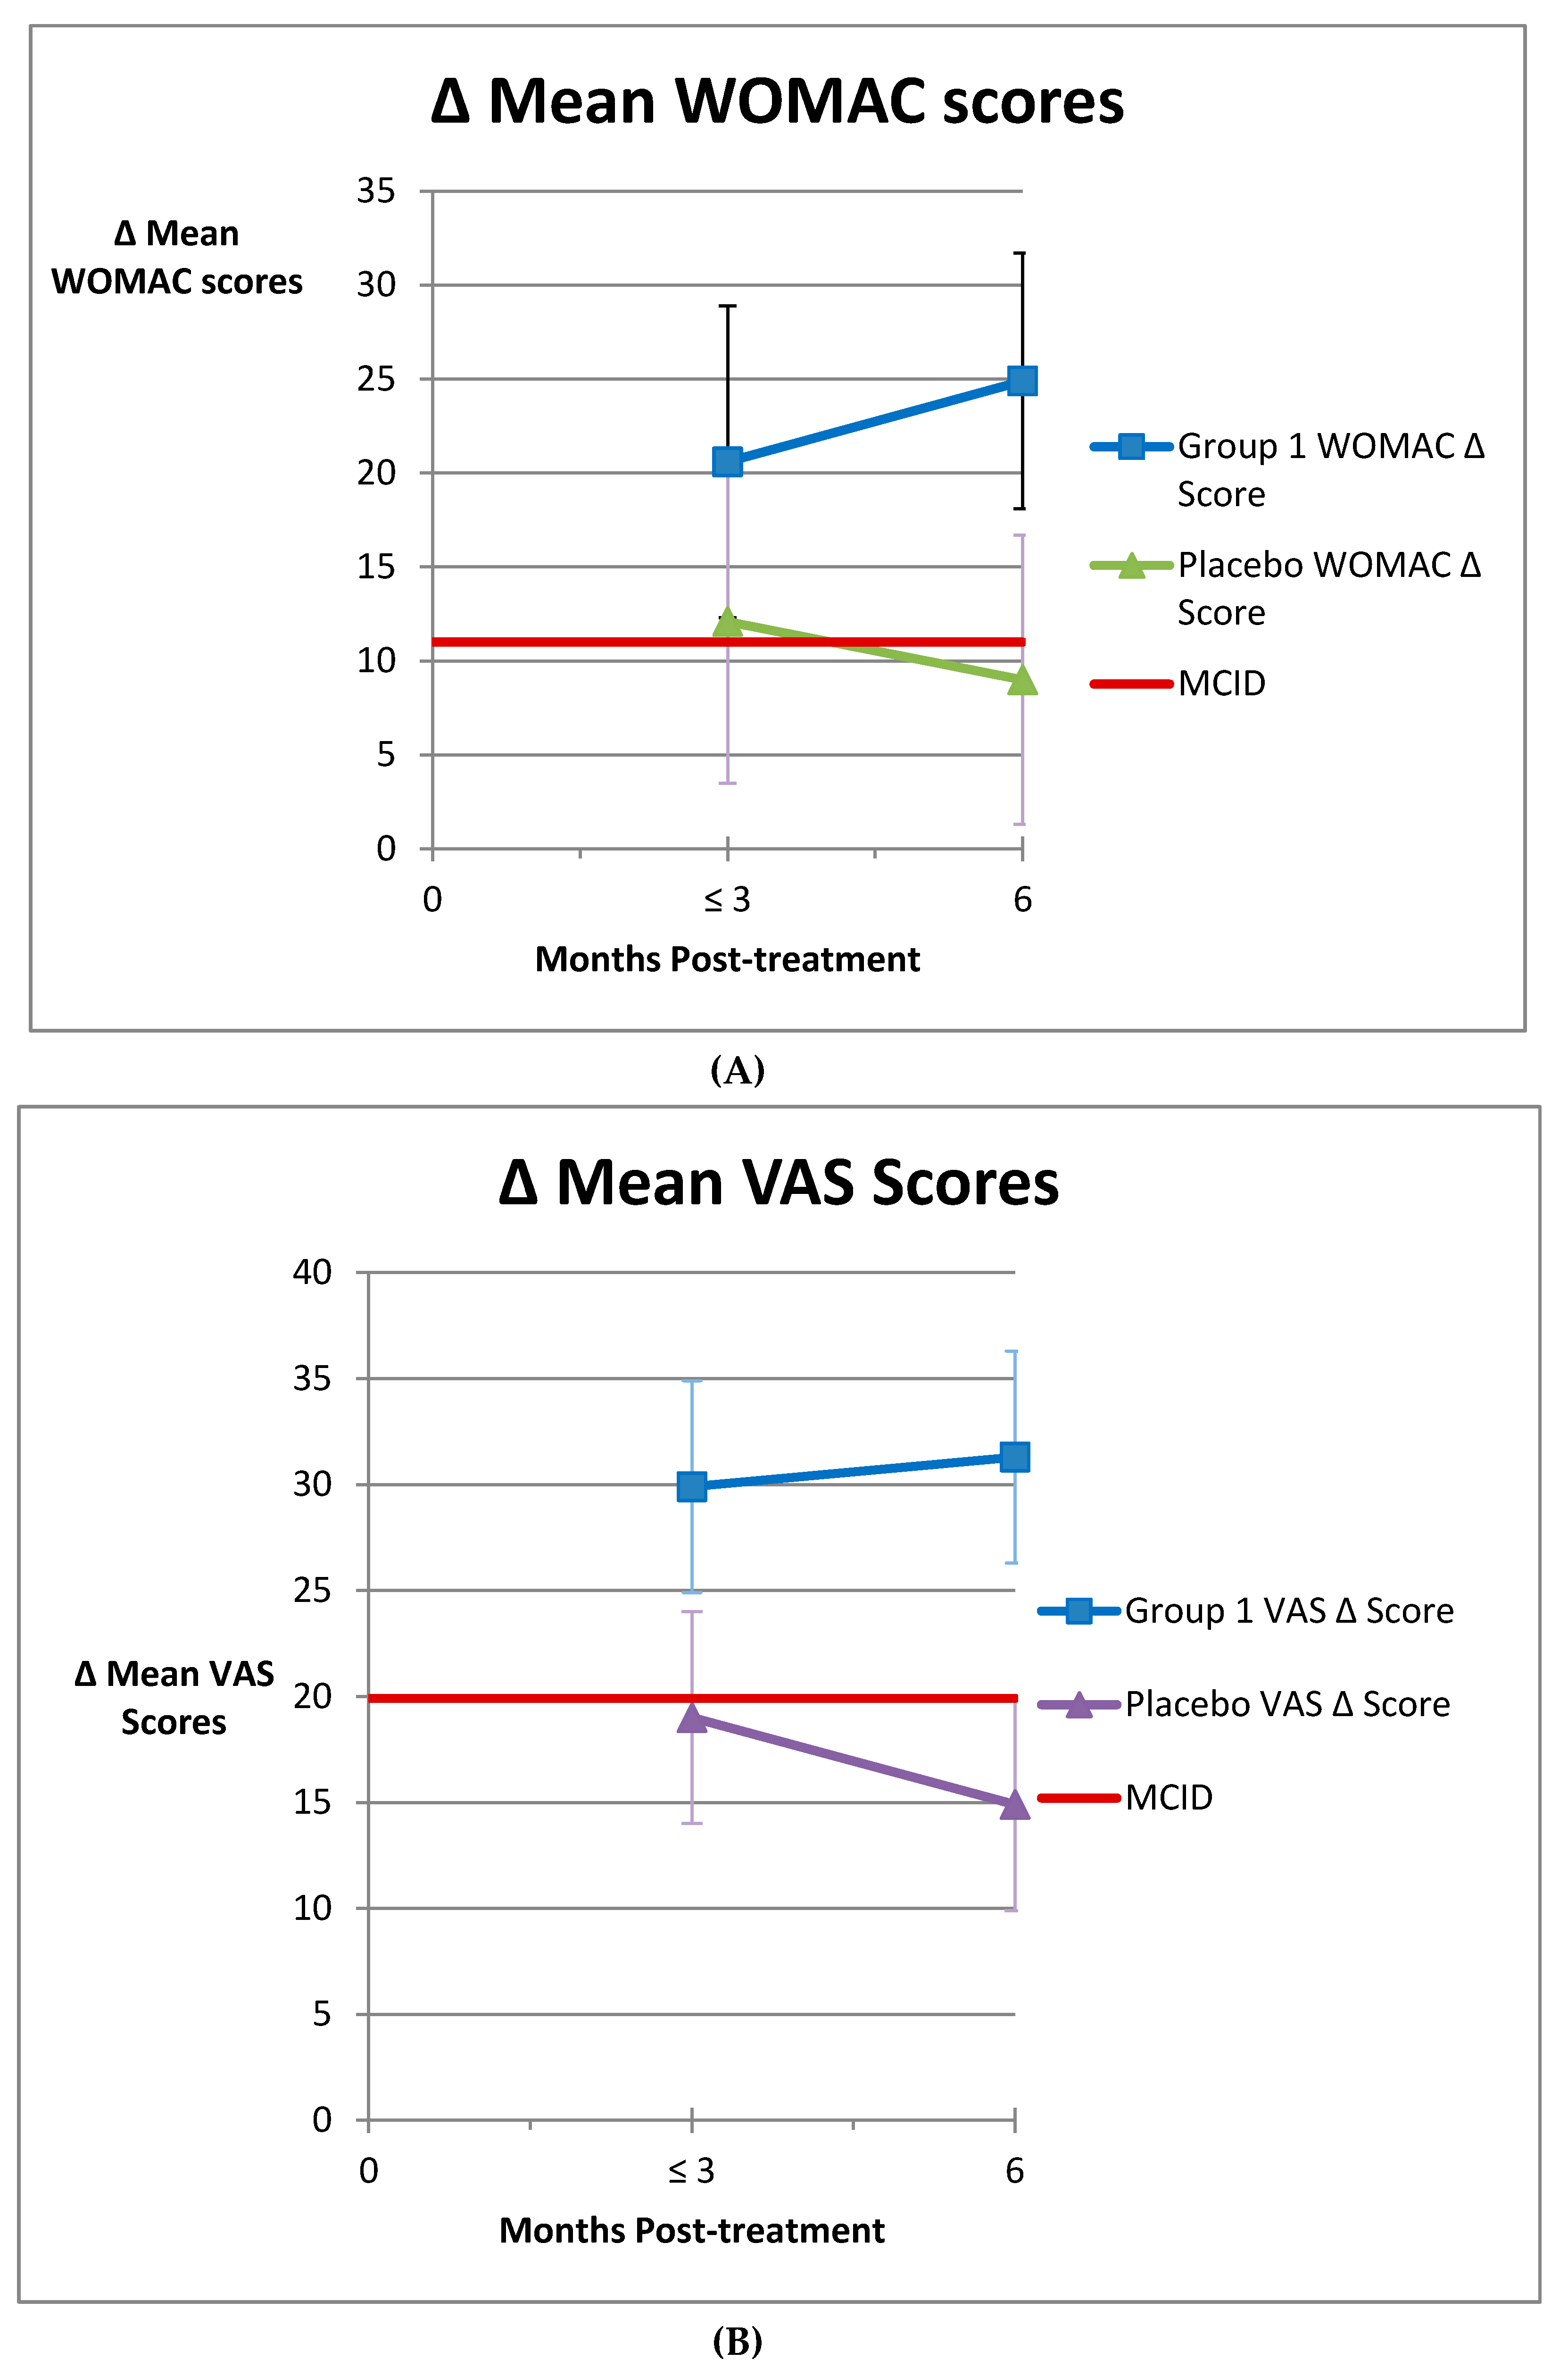
3.2. Group 2
3.3. Group 3
4. Discussion
5. Conclusions
Author Contributions
Funding
Conflicts of Interest
References
- Cross, M.; Smith, E.; Hoy, D.; Nolte, S.; Ackerman, I.; Fransen, M.; Bridgett, L.; Williams, S.; Guillemin, F.; Hill, C.L.; et al. The global burden of hip and knee osteoarthritis: Estimates from the global burden of disease 2010 study. Ann. Rheum. Dis. 2014, 73, 1323–1330. [Google Scholar] [CrossRef]
- Wolfe, M.M.; Lichtenstein, D.R.; Singh, G. Gastrointestinal toxicity of nonsteroidal antiinflammatory drugs. N. Engl. J. Med. 1999, 340, 1888–1899. [Google Scholar] [CrossRef]
- Wang, C.T.; Lin, J.; Chang, C.J.; Lin, Y.T.; Hou, S.M. Therapeutic effects of hyaluronic acid on osteoarthritis of the knee. A meta-analysis of randomized controlled trials. J. Bone Joint Surg. 2004, 86, 538–545. [Google Scholar] [CrossRef]
- Hess, S.R.; O’Connell, R.S.; Bednarz, C.P.; Waligora, A.C., IV; Golladay, G.J.; Jiranek, W.A. Association of rapidly destructive osteoarthritis of the hip with intra-articular steroid injections. Arthroplast. Today 2018, 4, 205–209. [Google Scholar] [CrossRef]
- McAlindon, T.E.; LaValley, M.P.; Harvey, W.F.; Price, L.L.; Driban, J.B.; Zhang, M.; Ward, R.J. Effect of Intra-articular Triamcinolone vs Saline on Knee Cartilage Volume and Pain in Patients with Knee Osteoarthritis: A Randomized Clinical Trial. JAMA 2017, 317, 1967–1975. [Google Scholar] [CrossRef] [PubMed]
- Al-Omari, A.A.; Aleshawi, A.J.; Marei, O.A.; Younes, H.M.B.; Alawneh, K.Z.; ALQuran, E.; Mohaidat, Z.M. Avascular necrosis of the femoral head after single steroid intra-articular injection. Eur. J. Orthop. Surg. Traumatol. 2020, 30, 193–197. [Google Scholar] [CrossRef] [PubMed]
- Bali, K.; Meena, D.; Krishnan, V.; Chana, R.; Rawall, S.; Aggarwal, S. Steroid-induced stress fracture of medial tibial condyle: A case report. J. Knee Surg. 2013, 26 (Suppl. S1), S25–S29. [Google Scholar] [PubMed]
- Kontovazenitis, P.I.; Starantzis, K.A.; Soucacos, P.N. Major complication following minor outpatient procedure: Osteonecrosis of the knee after intraarticular injection of cortisone for treatment of knee arthritis. J. Surg. Orthop. Adv. 2009, 18, 42–44. [Google Scholar]
- Schairer, W.W.; Nwachukwu, B.U.; Mayman, D.J.; Lyman, S.; Jerabek, S.A. Preoperative Hip Injections Increase the Rate of Periprosthetic Infection After Total Hip Arthroplasty. J Arthroplasty 2016, 31 (Suppl. S9), 166–169.e161. [Google Scholar] [CrossRef]
- Simeone, F.J.; Vicentini, J.R.T.; Bredella, M.A.; Chang, C.Y. Are patients more likely to have hip osteoarthritis progression and femoral head collapse after hip steroid/anesthetic injections? A retrospective observational study. Skelet. Radiol. 2019, 48, 1417–1426. [Google Scholar] [CrossRef]
- Werner, B.C.; Cancienne, J.M.; Browne, J.A. The Timing of Total Hip Arthroplasty After Intraarticular Hip Injection Affects Postoperative Infection Risk. J. Arthroplast. 2016, 31, 820–823. [Google Scholar] [CrossRef] [PubMed]
- Prodromos, C.; Rumschlag, T. Injection of Autologous Mesenchymal Cells for the Treatment of Arthritis Has So Far Been Found to Be Completely Safe. Medicines 2020. submitted for publication. [Google Scholar]
- Anz, A.; Hubbard, R. Bone Marrow Aspirate Concentrate Is Equivalent to Platelet-Rich Plasma for the Treatment of Knee Osteoarthritis at 1 Year: A Prospective, Randomized Trial. Orthrop. J. Sports Med. 2020, 8. [Google Scholar] [CrossRef] [PubMed]
- Centeno, C.; Pitts, J.; Al-Sayegh, H.; Freeman, M. Efficacy of autologous bone marrow concentrate for knee osteoarthritis with and without adipose graft. Biomed Res. Int. 2014, 2014, 370621. [Google Scholar] [CrossRef]
- Centeno, C.J.; Al-Sayegh, H.; Bashir, J.; Goodyear, S.; Freeman, M.D. A dose response analysis of a specific bone marrow concentrate treatment protocol for knee osteoarthritis. BMC Musculoskelet. Disord. 2015, 16, 258. [Google Scholar] [CrossRef]
- Garay-Mendoza, D.; Villarreal-Martinez, L.; Garza-Bedolla, A.; Perez-Garza, D.M.; Acosta-Olivo, C.; Vilchez-Cavazos, F.; Diaz-Hutchinson, C.; Gomez-Almaguer, D.; Jaime-Perez, J.C.; Mancias-Guerra, C. The effect of intra-articular injection of autologous bone marrow stem cells on pain and knee function in patients with osteoarthritis. Int. J. Rheum. Dis. 2018, 21, 140–147. [Google Scholar] [CrossRef]
- Mautner, K.; Bowers, R.; Easley, K.; Fausel, Z.; Robinson, R. Functional Outcomes Following Microfragmented Adipose Tissue Versus Bone Marrow Aspirate Concentrate Injections for Symptomatic Knee Osteoarthritis. Stem Cells Transl. Med. 2019, 8, 1149–1156. [Google Scholar] [CrossRef]
- Shapiro, S.A.; Kazmerchak, S.E.; Heckman, M.G.; Zubair, A.C.; O’Connor, M.I. A Prospective, Single-Blind, Placebo-Controlled Trial of Bone Marrow Aspirate Concentrate for Knee Osteoarthritis. Am. J. Sports Med. 2016, 45, 82–90. [Google Scholar] [CrossRef]
- Kim, J.D.; Lee, G.W.; Jung, G.H.; Kim, C.K.; Kim, T.; Park, J.H.; Cha, S.S.; You, Y.B. Clinical outcome of autologous bone marrow aspirates concentrate (BMAC) injection in degenerative arthritis of the knee. Eur. J. Orthop. Surg. Traumatol. 2014, 24, 1505–1511. [Google Scholar] [CrossRef]
- Dall’Oca, C.; Breda, S.; Elena, N.; Valentini, R.; Samaila, E.M.; Magnan, B. Mesenchymal Stem Cells injection in hip osteoarthritis: Preliminary results. Acta Biomed. 2019, 90 (Suppl. S1), 75–80. [Google Scholar]
- Hudetz, D.; Boric, I.; Rod, E.; Jelec, Z.; Radic, A.; Vrdoljak, T.; Skelin, A.; Lauc, G.; Trbojevic-Akmacic, I.; Plecko, M.; et al. The Effect of Intra-articular Injection of Autologous Microfragmented Fat Tissue on Proteoglycan Synthesis in Patients with Knee Osteoarthritis. Genes 2017, 8, 270. [Google Scholar] [CrossRef] [PubMed]
- Boric, I.; Hudetz, D.; Rod, E.; Jelec, Z.; Vrdoljak, T.; Skelin, A.; Polasek, O.; Plecko, M.; Trbojevic-Akmacic, I.; Lauc, G.; et al. A 24-Month Follow-Up Study of the Effect of Intra-Articular Injection of Autologous Microfragmented Fat Tissue on Proteoglycan Synthesis in Patients with Knee Osteoarthritis. Genes 2019, 10, 51. [Google Scholar] [CrossRef] [PubMed]
- Pintat, J.; Silvestre, A.; Magalon, G.; Gadeau, A.P.; Pesquer, L.; Perozziello, A.; Peuchant, A.; Mounayer, C.; Dallaudiere, B. Intra-articular Injection of Mesenchymal Stem Cells and Platelet-Rich Plasma to Treat Patellofemoral Osteoarthritis: Preliminary Results of a Long-Term Pilot Study. J. Vasc. Interv. Radiol. 2017, 28, 1708–1713. [Google Scholar] [CrossRef] [PubMed]
- Roato, I.; Belisario, D.C.; Compagno, M.; Lena, A.; Bistolfi, A.; Maccari, L.; Mussano, F.; Genova, T.; Godio, L.; Perale, G.; et al. Concentrated adipose tissue infusion for the treatment of knee osteoarthritis: Clinical and histological observations. Int. Orthop. 2018, 43, 15–23. [Google Scholar] [CrossRef]
- Freitag, J.; Bates, D.; Wickham, J.; Shah, K.; Huguenin, L.; Tenen, A.; Paterson, K.; Boyd, R. Adipose-derived mesenchymal stem cell therapy in the treatment of knee osteoarthritis: A randomized controlled trial. Regen Med. 2019, 14, 213–230. [Google Scholar] [CrossRef]
- Jo, C.H.; Chai, J.W.; Jeong, E.C.; Oh, S.; Shin, J.S.; Shim, H.; Yoon, K.S. Intra-articular Injection of Mesenchymal Stem Cells for the Treatment of Osteoarthritis of the Knee: A 2-Year Follow-up Study. Am. J. Sports Med. 2017, 45, 2774–2783. [Google Scholar] [CrossRef]
- Lee, W.S.; Kim, H.J.; Kim, K.I.; Kim, G.B.; Jin, W. Intra-Articular Injection of Autologous Adipose Tissue-Derived Mesenchymal Stem Cells for the Treatment of Knee Osteoarthritis: A Phase IIb, Randomized, Placebo-Controlled Clinical Trial. Stem Cells Transl. Med. 2019, 8, 504–511. [Google Scholar] [CrossRef]
- Lu, L.; Dai, C.; Zhang, Z.; Du, H.; Li, S.; Ye, P.; Fu, Q.; Zhang, L.; Wu, X.; Dong, Y.; et al. Treatment of knee osteoarthritis with intra-articular injection of autologous adipose-derived mesenchymal progenitor cells: A prospective, randomized, double-blind, active-controlled, phase IIb clinical trial. Stem Cell Res. Ther. 2019, 10, 143. [Google Scholar] [CrossRef]
- Pers, Y.M.; Rackwitz, L.; Ferreira, R.; Pullig, O.; Delfour, C.; Barry, F.; Sensebe, L.; Casteilla, L.; Fleury, S.; Bourin, P.; et al. Adipose Mesenchymal Stromal Cell-Based Therapy for Severe Osteoarthritis of the Knee: A Phase I Dose-Escalation Trial. Stem Cells Transl. Med. 2016, 5, 847–856. [Google Scholar] [CrossRef]
- Song, Y.; Du, H.; Dai, C.; Zhang, L.; Li, S.; Hunter, D.J.; Lu, L.; Bao, C. Human adipose-derived mesenchymal stem cells for osteoarthritis: A pilot study with long-term follow-up and repeated injections. Regen Med. 2018, 13, 295–307. [Google Scholar] [CrossRef]
- Spasovski, D.; Spasovski, V.; Bascarevic, Z.; Stojiljkovic, M.; Vreca, M.; Andelkovic, M.; Pavlovic, P. Intra-articular Injection of Autologous Adipose-Derived Mesenchymal Stem Cells in the Treatment of Knee Osteoarthritis. J. Gene Med. 2018, 20. [Google Scholar] [CrossRef] [PubMed]
- Al-Najar, M.; Khalil, H.; Al-Aljouni, J.; Al-Antary, E.; Hamdan, M.; Rahmeh, R.; Alhttab, D.; Samara, O.; Yasin, M.; Al Abjullah, A.; et al. Intra-articular injection of expanded autologous bone marrow mesenchymal cells in moderate and severe knee osteoarthritis is safe: A phase I/II study. J. Orthop. Surg. Res. 2017, 12, 190–196. [Google Scholar] [CrossRef] [PubMed]
- Bastos, R.; Mathias, M.; Andrade, R.; Bastos, R.; Balduino, A.; Schott, V.; Rodeo, S.; Espregueira-Mendes, J. Intra-articular injections of expanded mesenchymal stem cells with and without addition of platelet-rich plasma are safe and effective for knee osteoarthritis. Knee Surg. Sports Traumatol. Arthrosc. 2018, 26, 3342–3350. [Google Scholar] [CrossRef] [PubMed]
- Centeno, C.J.; Schultz, J.R.; Cheever, M.; Freeman, M.; Faulkner, S.; Robinson, B.; Hanson, R. Safety and complications reporting update on the re-implantation of culture-expanded mesenchymal stem cells using autologous platelet lysate technique. Curr. Stem Cell Res. Ther. 2011, 6, 368–378. [Google Scholar] [CrossRef]
- Davatchi, F.; Sadeghi Abdollahi, B.; Mohyeddin, M.; Nikbin, B. Mesenchymal stem cell therapy for knee osteoarthritis: 5 years follow-up of three patients. Int. J. Rheum. Dis. 2016, 19, 219–225. [Google Scholar] [CrossRef]
- Emadedin, M.; Aghdami, N.; Taghiyar, L.; Fazeli, R.; Moghadasali, R.; Jahangir, S.; Farjad, R.; Baghaban Eslaminejad, M. Intra-articular injection of autologous mesenchymal stem cells in six patients with knee osteoarthritis. Arch. Iran. Med. 2012, 15, 422–428. [Google Scholar]
- Emadedin, M.; Ghorbani Liastani, M.; Fazeli, R.; Mohseni, F.; Moghadasali, R.; Mardpour, S.; Hosseini, S.E.; Niknejadi, M.; Moeininia, F.; Aghahossein Fanni, A.; et al. Long-Term Follow-up of Intra-articular Injection of Autologous Mesenchymal Stem Cells in Patients with Knee, Ankle, or Hip Osteoarthritis. Arch. Iran. Med. 2015, 18, 336–344. [Google Scholar]
- Emadedin, M.; Labibzadeh, N.; Liastani, M.G.; Karimi, A.; Jaroughi, N.; Bolurieh, T.; Hosseini, S.E.; Baharvand, H.; Aghdami, N. Intra-articular implantation of autologous bone marrow-derived mesenchymal stromal cells to treat knee osteoarthritis: A randomized, triple-blind, placebo-controlled phase 1/2 clinical trial. Cytotherapy 2018, 20, 1238–1246. [Google Scholar] [CrossRef]
- Lamo-Espinosa, J.M.; Mora, G.; Blanco, J.F.; Granero-Molto, F.; Nunez-Cordoba, J.M.; Lopez-Elio, S.; Andreu, E.; Sanchez-Guijo, F.; Aquerreta, J.D.; Bondia, J.M.; et al. Intra-articular injection of two different doses of autologous bone marrow mesenchymal stem cells versus hyaluronic acid in the treatment of knee osteoarthritis: Long-term follow up of a multicenter randomized controlled clinical trial (phase I/II). J. Transl. Med. 2018, 16, 213. [Google Scholar] [CrossRef]
- Orozco, L.; Munar, A.; Soler, R.; Alberca, M.; Soler, F.; Huguet, M.; Sentis, J.; Sanchez, A.; Garcia-Sancho, J. Treatment of Knee Osteoarthritis with Autologous Mesenchymal Stem Cells: A Pilot Study. Transplantation 2013, 95, 1535–1541. [Google Scholar] [CrossRef]
- Orozco, L.; Munar, A.; Soler, R.; Alberca, M.; Soler, F.; Huguet, M.; Sentis, J.; Sanchez, A.; Garcia-Sancho, J. Treatment of knee osteoarthritis with autologous mesenchymal stem cells: Two-year follow-up results. Transplantation 2014, 97, e66–e68. [Google Scholar] [CrossRef] [PubMed]
- Soler, R.; Orozco, L.; Munar, A.; Huguet, M.; Lopez, R.; Vives, J.; Coll, R.; Codinach, M.; Garcia-Lopez, J. Final results of a phase I-II trial using ex vivo expanded autologous Mesenchymal Stromal Cells for the treatment of osteoarthritis of the knee confirming safety and suggesting cartilage regeneration. Knee 2016, 23, 647–654. [Google Scholar] [CrossRef] [PubMed]
- Bansal, H.; Comella, K.; Leon, J.; Verma, P.; Agrawal, D.; Koka, P.; Ichim, T. Intra-articular injection in the knee of adipose derived stromal cells (stromal vascular fraction) and platelet rich plasma for osteoarthritis. J. Transl. Med. 2017, 15, 141. [Google Scholar] [CrossRef] [PubMed]
- Fodor, P.B.; Paulseth, S.G. Adipose Derived Stromal Cell (ADSC) Injections for Pain Management of Osteoarthritis in the Human Knee Joint. Aesthet. Surg. J. 2016, 36, 229–236. [Google Scholar] [CrossRef] [PubMed]
- Garza, J.; Campbell, R.; Tjoumakaris, F.; Freedman, K.B.; Miller, L.S.; Santa Maria, D.; Tucker, B.S. Clinical Efficacy of Intra-articular Mesenchymal Stromal Cells for the Treatment of Knee Osteoarthritis: A Double-Blinded Prospective Randomized Controlled Clinical Trial. Am. J. Sports Med. 2020, 48, 588–598. [Google Scholar] [CrossRef] [PubMed]
- Gibbs, N.; Diamond, R.; Sekyere, E.O.; Thomas, W.D. Management of knee osteoarthritis by combined stromal vascular fraction cell therapy, platelet-rich plasma, and musculoskeletal exercises: A case series. J. Pain Res. 2015, 8, 799–806. [Google Scholar] [CrossRef]
- Hong, Z.; Chen, J.; Zhang, S.; Zhao, C.; Bi, M.; Chen, X.; Bi, Q. Intra-articular injection of autologous adipose-derived stromal vascular fractions for knee osteoarthritis: A double-blind randomized self-controlled trial. Int. Orthop. 2019, 43, 1123–1134. [Google Scholar] [CrossRef]
- Yokota, N.; Yamakawa, M.; Shirata, T.; Kimura, T.; Kaneshima, H. Clinical results following intra-articular injection of adipose-derived stromal vascular fraction cells in patients with osteoarthritis of the knee. Regen Ther. 2017, 6, 108–112. [Google Scholar] [CrossRef]
- Irrgang, J.; Anderson, A.; Dunn, W. Summary of Clinical Outcome Measures for Sports-Related Knee Injuries; AOSSM Outcomes Task Force: Baltimore, MD, USA, 2012. [Google Scholar]
- Tubach, F.; Ravaud, P.; Baron, G.; Falissard, B.; Logeart, I.; Bellamy, N.; Bombardier, C.; Felson, D.; Hochberg, M.; van der Heijde, D. Evaluation of clinically relevant changes in patient reported outcomes in knee and hip osteoarthritis: The minimal clinically important improvement. Ann. Rheum. Dis. 2005, 64, 29–33. [Google Scholar] [CrossRef]
- Roos, E.M.; Lohmander, L.S. The Knee Injury and Osteoarthritis Outcome Score (KOOS): From Joint Injury to Osteoarthritis. Health Qual. Life Outcomes 2003, 1, 64. [Google Scholar] [CrossRef]
- Smith, P. Intra-articular Autologous Conditioned Plasma Injections Provide Safe and Efficacious Treatment for Knee Osteoarthritis: An FDA-Sanctioned, Randomized, Double-blind, Placebo-controlled Clinical Trial. Am. J. Sports Med. 2016, 44, 884–891. [Google Scholar] [CrossRef] [PubMed]
- Chao, J.; Wu, C.; Sun, B.; Hose, M.K.; Quan, A.; Hughes, T.H.; Boyle, D.; Kalunian, K.C. Inflammatory characteristics on ultrasound predict poorer longterm response to intraarticular corticosteroid injections in knee osteoarthritis. J. Rheumatol. 2010, 37, 650–655. [Google Scholar] [CrossRef] [PubMed]
- Patel, S.; Dhillon, M.S.; Aggarwal, S.; Marwaha, N.; Jain, A. Treatment with platelet-rich plasma is more effective than placebo for knee osteoarthritis: A prospective, double-blind, randomized trial. Am. J. Sports Med. 2013, 41, 356–364. [Google Scholar] [CrossRef] [PubMed]
- Altman, R.D.; Akermark, C.; Beaulieu, A.D.; Schnitzer, T. Efficacy and safety of a single intra-articular injection of non-animal stabilized hyaluronic acid (NASHA) in patients with osteoarthritis of the knee. Osteoarthr. Cartil. 2004, 12, 642–649. [Google Scholar] [CrossRef]
- Altman, R.D.; Rosen, J.E.; Bloch, D.A.; Hatoum, H.T.; Korner, P. A double-blind, randomized, saline-controlled study of the efficacy and safety of EUFLEXXA for treatment of painful osteoarthritis of the knee, with an open-label safety extension (the FLEXX trial). Semin. Arthritis Rheum. 2009, 39, 1–9. [Google Scholar] [CrossRef]
- Baltzer, A.W.; Moser, C.; Jansen, S.A.; Krauspe, R. Autologous conditioned serum (Orthokine) is an effective treatment for knee osteoarthritis. Osteoarthr. Cartil. 2009, 17, 152–160. [Google Scholar] [CrossRef]
- Bar-Or, D.; Salottolo, K.M.; Loose, H.; Phillips, M.J.; McGrath, B.; Wei, N.; Borders, J.L.; Ervin, J.E.; Kivitz, A.; Hermann, M. A randomized clinical trial to evaluate two doses of an intra-articular injection of LMWF-5A in adults with pain due to osteoarthritis of the knee. PLoS ONE 2014, 9, e87910. [Google Scholar] [CrossRef]
- Chevalier, X.; Jerosch, J.; Goupille, P.; van Dijk, N.; Luyten, F.P.; Scott, D.L.; Bailleul, F.; Pavelka, K. Single, intra-articular treatment with.hylan G-F 20 in patients with symptomatic primary osteoarthritis of the knee: A randomised, multicentre, double-blind, placebo controlled trial. Ann. Rheum. Dis. 2010, 69, 113–119. [Google Scholar] [CrossRef]
- Henrotin, Y.; Berenbaum, F.; Chevalier, X.; Marty, M.; Richette, P.; Rannou, F. Reduction of the Serum Levels of a Specific Biomarker of Cartilage Degradation (Coll2-1) by Hyaluronic Acid (KARTILAGE(R) CROSS) Compared to Placebo in Painful Knee Osteoarthritis Patients: The EPIKART Study, a Pilot Prospective Comparative Randomized Double Blind Trial. BMC Musculoskelet. Disord. 2017, 18, 222. [Google Scholar]
- Karlsson, J.; Sjogren, L.S.; Lohmander, L.S. Comparison of two hyaluronan drugs and placebo in patients with knee osteoarthritis. A controlled, randomized, double-blind, parallel-design multicentre study. Rheumatology 2002, 41, 1240–1248. [Google Scholar] [CrossRef]
- Kul-Panza, E.; Berker, N. Is hyaluronate sodium effective in the management of knee osteoarthritis? A placebo-controlled double-blind study. Minerva Med. 2010, 101, 63–72. [Google Scholar] [PubMed]
- Lee, M.C.; Ha, C.W.; Elmallah, R.K.; Cherian, J.J.; Cho, J.J.; Kim, T.W.; Bin, S.I.; Mont, M.A. A placebo-controlled randomised trial to assess the effect of TGF-ss1-expressing chondrocytes in patients with arthritis of the knee. Bone Joint J. 2015, 97-B, 924–932. [Google Scholar] [CrossRef] [PubMed]
- Ravaud, P.; Moulinier, L.; Giraudeau, B.; Ayral, X.; Guerin, C.; Noel, E.; Thomas, P.; Fautrel, B.; Mazieres, B.; Dougados, M. Effects of joint lavage and steroid injection in patients with osteoarthritis of the knee: Results of a multicenter, randomized, controlled trial. Arthritis Rheum. 1999, 42, 475–482. [Google Scholar] [CrossRef]
- Shrestha, R.; Shrestha, R.; Thapa, S.; Khadka, S.K.; Shrestha, D. Clinical Outcome following Intra-articular Triamcinolone Injection in Osteoarthritic Knee at the Community: A Randomized Double Blind Placebo Controlled Trial. Kathmandu Univ. Med. J. 2018, 16, 175–180. [Google Scholar]
- Takamura, J.; Seo, T.; Strand, V. A Pooled Analysis of Two Multicenter, Randomized Controlled Trials of a Single Intra-articular Injection of Gel-200 for Treatment of Osteoarthritis of the Knee. Clin. Med. Insights Arthritis Musculoskelet. Disord. 2018, 11. [Google Scholar] [CrossRef]
- Van der Weegen, W.; Wullems, J.A.; Bos, E.; Noten, H.; van Drumpt, R.A. No difference between intra-articular injection of hyaluronic acid and placebo for mild to moderate knee osteoarthritis: A randomized, controlled, double-blind trial. J. Arthroplast. 2015, 30, 754–757. [Google Scholar] [CrossRef]
- Wu, Y.T.; Hsu, K.C.; Li, T.Y.; Chang, C.K.; Chen, L.C. Effects of Platelet-Rich Plasma on Pain and Muscle Strength in Patients with Knee Osteoarthritis. Am. J. Phys. Med. Rehabil. 2018, 97, 248–254. [Google Scholar] [CrossRef]
- Yavuz, U.; Sokucu, S.; Albayrak, A.; Ozturk, K. Efficacy comparisons of the intraarticular steroidal agents in the patients with knee osteoarthritis. Rheumatol. Int. 2012, 32, 3391–3396. [Google Scholar] [CrossRef]
- Robb-Nicholson, C. By the Way Doctor. I’ve been getting cortisone injections in my knee for osteoarthritis every four months. What are the possible side effects, and how long can I continue this? I’m a strong 81-year-old. Harv. Womens Health Watch 2008, 15, 8. [Google Scholar]
- Prodromos, C.; Finkle, S. Autologous Biologic Treatment with Fat, Bone Marrow Aspirate and Platelet Rich Plasma Is an Effective Alternative to Total Knee Arthroplasty for Patients with Moderate Knee Arthrosis. Medicines 2020, 7, 37. [Google Scholar] [CrossRef]
- Cui, G.; Wang, Y.; Li, C.; Shi, C.; Wang, W. Efficacy of mesenchymal stem cells in treating patients with osteoarthritis of the knee: A meta-analysis. Exp. Ther. Med. 2016, 12, 3390–3400. [Google Scholar] [CrossRef] [PubMed]
- Tompkins, B.; DiFede, D.; Khan, A.; Landin, A.M.; Schulman, I.H.; Pujol, M.V.; Heldman, A.W.; Miki, R.; Goldschmidt-Clermont, P.J.; Goldstein, B.J.; et al. Allogeneic Mesenchymal Stem Cells Ameliorate Aging Frailty: A Phase II Randomized, Double-Blind, Placebo-Controlled Clinical Trial. J. Gerontol. A Biol. Sci. Med. Sci. 2017, 72, 1513–1522. [Google Scholar] [CrossRef] [PubMed]
- Lostak, J.; Gallo, J.; Zapletalova, J. Patient Satisfaction after Total Knee Arthroplasty. Analysis of Pre-Operative and Peri-Operative Parameters Influencing Results in 826 Patients. Acta Chir. Orthop. Traumatol. Cechoslov. 2016, 83, 94–101. [Google Scholar]
- Hsu, W.Y.; Lin, C.L.; Kao, C.H. Association between opioid use disorder and fractures: A population-based study. Addiction 2019, 114, 2008–2015. [Google Scholar] [CrossRef]
- Solomon, D.H.; Rassen, J.A.; Glynn, R.J.; Lee, J.; Levin, R.; Schneeweiss, S. The comparative safety of analgesics in older adults with arthritis. Arch. Intern. Med. 2010, 170, 1968–1976. [Google Scholar] [CrossRef]
- Wei, W.; Gandhi, K.; Blauer-Peterson, C.; Johnson, J. Impact of Pain Severity and Opioid Use on Health Care Resource Utilization and Costs among Patients with Knee and Hip Osteoarthritis. J. Manag. Care Spec. Pharm. 2019, 25, 957–965. [Google Scholar] [CrossRef]
- Tompkins, B.; DiFede, D.; Khan, A.; Landin, A.M.; Schulman, I.H.; Pujol, M.V.; Heldman, A.W.; Miki, R.; Goldschmidt-Clermont, P.J.; Goldstein, B.J.; et al. Association of Tramadol with All-Cause Mortality Among Patients With Osteoarthritis. JAMA 2019, 321, 969–982. [Google Scholar]
- Kompel, A.J.; Roemer, F.W.; Murakami, A.M.; Diaz, L.E.; Crema, M.D.; Guermazi, A. Intra-articular corticosteroid injections in the hip and knee: Perhaps not as safe as we thought? Radiology 2019, 293, 656–663. [Google Scholar] [CrossRef]


| WOMAC Scores | VAS Scores | |||||||||||||
|---|---|---|---|---|---|---|---|---|---|---|---|---|---|---|
| Author/Year/ Cohort | Cell Type | Dosage | Study FU Length (Mo) | # of Joints | Pre-treatment | 6 mo | Δ 6 mo | Final FU | Δ Final FU | Pre- treatment | 6 mo | Δ 6 mo | Final FU | Δ Final FU |
| Anz 2020 [13] | BMAC | 7 mL BMAC | 12 | 45 | 35.3 | 19.4 | 15.9 | 19.4 | 15.9 | NA | NA | NA | NA | NA |
| Centeno 2014 BMAC [14] | BMAC | 90 mL BMAC | 10 | 220 | NA | NA | NA | NA | NA | 40.0 | NA | NA | 26.0 | 14.0 |
| Centeno 2015 low dose [15] | BMAC | <4E8 TNC | 11 | 67 | NA | NA | NA | NA | NA | 40.0 | NA | NA | 31.0 | 9.0 |
| Centeno 2015 high dose [15] | BMAC | >4E8 TNC | 11 | 49 | NA | NA | NA | NA | NA | 31.0 | NA | NA | 17.0 | 14.0 |
| Garay-Mendoa 2018 [16] | BMAC | 670E6 BM mononuclear cells | 6 | 26 | 35.9 | 7.9 | 28.0 | 7.9 | 28.0 | 52.7 | 9.2 | 42.8 | 9.2 | 42.8 |
| Mautner 2018 BMAC [17] | BMAC | 8ml BMAC | 6 | 58 | NA | NA | NA | NA | NA | 39 | 25 | 14 | 25 | 14 |
| Shapiro 2016 [18] | BMAC | 34E3 MSCs | 6 | 25 | NA | NA | NA | NA | NA | 31.0 | 15.0 | 11.0 | 15.0 | 11.0 |
| BMAC Means | 8.3 | 35.6 | 13.7 | 22.0 | 13.7 | 22.0 | 39.0 | 16.4 | 22.6 | 20.5 | 17.5 | |||
| Total # of Studies 6/Subgroups 7 | Total # of Joints | 490 | ||||||||||||
| Centeno 2014 BMAC/Fat [14] | BMAC & MM Fat | 90 mL BMAC, 10 mL MM fat | 11 | 103 | NA | NA | NA | NA | NA | 43.0 | NA | NA | 30.0 | 13.0 |
| Kim 2014 [19] | BMAC & MM Fat | 7 mL BMAC, 10 mL MM fat | 12 | 75 | NA | NA | NA | NA | NA | 70.0 | 35.0 | 35.0 | 33.0 | 37.0 |
| BMAC & MM Fat Means | 9.0 | NA | NA | NA | NA | NA | 56.5 | 35.0 | 35.0 | 31.5 | 25.0 | |||
| Total # of Studies 2/Subgroups 2 | Total # of Joints | 178 | ||||||||||||
| Dall’Oca 2019 [20] | MM Fat | 5–10 mL microfragmented fat | 6 | 6 | 36.3 | 19.8 | 16.5 | 19.8 | 16.5 | 46.0 | 15.0 | 31.0 | 15.0 | 31.0 |
| Hudetz 2017 [21,22] | MM Fat | 4–15 mL MM fat | 24 | 17 | NA | NA | NA | NA | NA | 39.4 | 11.7 | 27.7 | 5.5 | 33.9 |
| Mautner 2018 MM Fat [17] | MM Fat | 9 mL MM Fat | 6 | 48 | NA | NA | NA | NA | NA | 43.0 | 28.0 | 15.0 | 28.0 | 15.0 |
| Pintat 2017 [23] | MM Fat | 12 mL lipoaspirate | 12 | 18 | 34.3 | 15.7 | 18.6 | 14.1 | 20.2 | NA | NA | NA | NA | NA |
| Roato 2018 [24] | MM Fat | 35 mL MM fat | 18 | 20 | 45.9 | 15.8 | 30.1 | 13.0 | 32.9 | 70.5 | 30.1 | 40.4 | 33.4 | 37.1 |
| MM fat Means | 13.2 | 38.81 | 17.1 | 21.7 | 15.6 | 23.2 | 49.7 | 21.2 | 28.5 | 20.5 | 29.3 | |||
| Total # of Studies 5/Subgroups 5 | Total # of Joints | 109 | ||||||||||||
| Freitag 2019 1 inj [25] | ASCs | 100E6 MSC × 1inj | 12 | 9 | 38.8 | 16.3 | 22.5 | 15.4 | 23.4 | 67.0 | 29.0 | 38.0 | 26.0 | 41.0 |
| Freitag 2019 2 inj [25] | ASCs | 100E6 MSC × 2 inj | 12 | 10 | 43.8 | 26.7 | 17.1 | 12.2 | 31.6 | 65.0 | 43.0 | 22.0 | 23.0 | 42.0 |
| Jo 2017 low dose [26] | ASCs | 10E6 MSCs | 24 | 3 | 43.3 | 25.3 | 18.0 | 17.0 | 26.3 | 70.0 | 48.3 | 21.7 | 40.0 | 30.0 |
| Jo 2017 medium dose [26] | ASCs | 50E6 MSCs | 24 | 3 | 69.0 | 48.5 | 20.5 | 25.1 | 43.9 | 78.3 | 67.0 | 11.3 | 66.0 | 12.3 |
| Jo 2017 high dose [26] | ASCs | 100E6 MSCs | 24 | 12 | 54.2 | 32.8 | 21.4 | 19.0 | 35.2 | 79.6 | 44.2 | 35.4 | 45.8 | 33.8 |
| Lee 2019 [27] | ASCs | 100E6 MSCs | 6 | 12 | 60.0 | 26.7 | 33.3 | 26.7 | 33.3 | 68.0 | 34.0 | 34.0 | 34.0 | 34.0 |
| Lu 2019 [28] | ASCs | 50E6 MSCs × 2inj | 12 | 46 | 30.8 | 21.7 | 9.1 | 21.4 | 9.5 | 53.9 | 29.3 | 24.6 | 28.1 | 25.8 |
| Pers 2016 low dose [29] | ASCs | 2E6 MSCs | 6 | 6 | 60.4 | 27.2 | 33.2 | 27.2 | 33.2 | 77.0 | 35.8 | 41.2 | 35.8 | 41.2 |
| Pers 2016 medium dose [29] | ASCs | 10E6 MSCs | 6 | 6 | 41.9 | 22.8 | 19.1 | 22.8 | 19.1 | 63.7 | 36.7 | 27.0 | 36.7 | 27.0 |
| Pers 2016 high dose [29] | ASCs | 50E6 MSCs | 6 | 6 | 35.8 | 14.8 | 21.0 | 14.8 | 21.0 | 43.7 | 24.0 | 19.7 | 24.0 | 19.7 |
| Song 2018 [30] | ASCs | 20E6 MSCs | 24 | 14 | 34.8 | 20.4 | 36.8 | 12.4 | 22.4 | 49.4 | 26.2 | 23.2 | 31.7 | 17.7 |
| Spasovski 2017 [31] | ASCs | 0.5–1E7 MSCs | 18 | 11 | NA | NA | NA | NA | NA | 54.5 | 9.3 | 45.2 | 9.1 | 45.4 |
| ASCs Means | 14.5 | 46.6 | 25.7 | 22.9 | 19.5 | 27.2 | 64.2 | 35.6 | 28.6 | 33.3 | 30.8 | |||
| Total # of Studies 7/Subgroups 12 | Total # of Joints | 138 | ||||||||||||
| Al-Najar 2017 [32] | BMSCs | 30.5E6 MSCs | 6 | 13 | see Table 2 | |||||||||
| Bastos 2018 MSCs [33] | BMSCs | 40E6 MSCs | 12 | 9 | see Table 2 | |||||||||
| Bastos 2018 MSCs + PRP [33] | BMSCs + PRP | 40E6 MSCs + PRP | 12 | 9 | see Table 2 | |||||||||
| Centeno 2011 [34] | BMSCs | MSCs cultured to 2-7th passage | 11.3 | 135 | see Table 2 | |||||||||
| Davatchi 2016 [35] | BMSCs | 8–9E6 MSC | 60 | 4 | NA | NA | NA | NA | NA | 86.3 | 52.5 | 33.8 | 34.0 | 52.3 |
| Emadedin 2012 [36] | BMSCs | 20–24E6 MSC | 12 | 6 | 67.1 | 41.9 | 25.1 | 43.6 | 23.5 | 57.0 | 10.0 | 47.0 | 11.6 | 45.4 |
| Emadedin 2015 [37] | BMSCs | 0.5E6 MSCs/kg bodyweight | 30 | 6 | 69.8 | 43.7 | 26.1 | 41.7 | 28.1 | NA | NA | NA | NA | NA |
| Emadedin 2018 [38] | BMSCs | 40E6 MSCs | 6 | 19 | NA | NA | 25.7 | NA | 25.7 | NA | NA | 20.8 | NA | 20.8 |
| Lamo-Espinosa 2018 low dose [39] | BMSCs | 10E6 MSC | 48 | 10 | see Table 2 | |||||||||
| Lamo-Espinosa 2018 high dose [39] | BMSCs | 100E6 MSC | 48 | 10 | see Table 2 | |||||||||
| Orozco 2013/14 [40,41] | BMSCs | 40E6 MSCs | 24 | 12 | 18.7 | NA | NA | 7.2 | 11.5 | 46.9 | 24.8 | 22.1 | 17.0 | 29.9 |
| Soler 2016 [42] | BMSCs | 40E6 MSCs | 12 | 15 | 26.5 | NA | NA | 9.0 | 17.5 | 51.3 | 21.0 | 30.3 | 19.0 | 32.3 |
| Cultured BMD- MESC Means | 23.4 | 45.5 | 42.8 | 25.6 | 25.4 | 21.3 | 60.4 | 27.1 | 30.8 | 20.4 | 36.1 | |||
| Total # of Studies 10/Subgroups 12 | Total # of Joints | 248 | ||||||||||||
| Bansal 2017 [43] | SVF | 100E6 TNC | 24 | 10 | 64.0 | 46.0 | 18.0 | 41.0 | 23.0 | NA | NA | NA | NA | NA |
| Fodor 2016 [44] | SVF | 14.1E6 TNC | 12 | 8 | 32.9 | NA | NA | 9.4 | 32.5 | 59.0 | NA | NA | 20.0 | 39.0 |
| Garza 2020 low dose [45] | SVF | 15E6 TNC | 12 | 13 | 54.0 | 22.8 | 31.2 | 20.9 | 33.1 | NA | NA | NA | NA | NA |
| Garza 2020 high dose [45] | SVF | 30E6 TNC | 12 | 13 | 45.2 | 19.2 | 26.0 | 12.7 | 32.5 | NA | NA | NA | NA | NA |
| Gibbs 2015 [46] | SVF | 11.5E6–50E6 TNC | 12 | 7 | see Table 2 | |||||||||
| Hong 2019 [47] | SVF | 7.45E6 TNC | 12 | 16 | NA | NA | NA | NA | NA | 53.8 | 16.9 | 36.9 | 21.9 | 31.9 |
| Yokota 2017 [48] | SVF | 30E6 TNC | 6 | 26 | 49.6 | 33.8 | 15.8 | 33.8 | 15.8 | 72.7 | 49.2 | 23.5 | 49.2 | 23.5 |
| SVF Means | 12.9 | 49.1 | 30.5 | 22.8 | 23.6 | 27.4 | 61.8 | 33.1 | 30.2 | 30.4 | 31.5 | |||
| Total # of Studies 6/Subgroups 7 | Total # of Joints | 93 | ||||||||||||
| Group 1 Total Means | 14.4 | 45.1 | 25.9 | 23.0 | 20.3 | 25.2 | 56.2 | 29.6 | 28.7 | 27.1 | 28.7 | |||
| Total # of Studies 34/Subgroups 45 | Total Joints Group 1 & 2 | 1256 | ||||||||||||
| Study | Cell Type | Study FU Length (Mo) | # of Joints | Clinical Outcome Tool Used | Improvement Scores | Results Summary |
|---|---|---|---|---|---|---|
| Al-Najar 2017 [32] | BMSCs | 6 | 13 | KOOS | Mean Subgroup improvements: Symptoms = 23.9, Pain = 26.49, ADLs = 26.61, Sport = 39.73, QoL = 41.33 | Significant Improvement above MCID for all subgroups |
| Bastos 2018 [33] | BMSCs | 12 | 9 | KOOS | Mean Subgroup improvements: Symptoms = 19.2, Pain = 21.6, ADLs = 28.6, Sport = 24.3, QoL = 24.3 | Significant Improvement above MCID for all subgroups |
| Bastos 2018 [33] | BMSCs + PRP | 12 | 9 | KOOS | Mean Subgroup improvements: Symptoms = 22.1, Pain = 32..9, ADLs = 31.4, Sport = 33.9, QoL = 25.9 | Significant Improvement above MCID for all subgroups |
| Centeno 2011 [34] | BMSCs | 11.3 | 135 | Likert scale % improvement | Likert scale showed 62% of patients had over 50% relief, and 41% of patients had over 75 % relief. | Significant improvement in majority of patients |
| Gibbs 2015 [46] | SVF | 12 | 7 | KOOS | Mean Subgroup improvements (6 mo): Symptoms = 40.9, Pain = 37.4, ADLs = 33.9, Sports = 57.9, QOL = 49.1; (12 mo) Symptoms = 51.4, Pain = 43.0, ADL = 37.9, Sports = 64.3, QoL = 70.6 | Significant Improvement above MCID for all subgroups out to 1 yr |
| Lamo-Espinosa 2018 low dose [39] | BMSCs | 48 | 10 | Median WOMAC & VAS | Median Improvement WOMAC 20 pts & VAS 50 pts | Significant improvement in WOMAC and VAS above MCID |
| Lamo-Espinosa 2018 high dose [39] | BMSCs | 48 | 10 | Median WOMAC & VAS | Median Improvement WOMAC 12.5 pts & VAS 30 pts | Significant improvement in WOMAC and VAS above MCID |
| WOMAC Peak Effect # | VAS Peak Effect # | WOMAC Scores | VAS Scores | ||||||||||||||
|---|---|---|---|---|---|---|---|---|---|---|---|---|---|---|---|---|---|
| Author/Year/Cohort | Time (Wks) | Δ Score | Exceeds MCID? | Time (Wks) | Δ Score | Exceeds MCID? | # of Joints | Pre-treatment | 3 MO | Δ 3 MO | 6 MO | Δ 6 Mo | Pre-treatment | 3 Mo | Δ 3 MO | 6 MO | Δ 6 Mo |
| Altman 2004 [55] | 12 | 13.2 | Y | NA | NA | NA | 174 | 46.9 | 33.7 | 13.2 | 35.8 | 11.1 | NA | NA | NA | NA | NA |
| Altman 2009 [56] | * | * | Y | NA | NA | NA | 259 | NA | NA | NA | NA | 14.4 | NA | NA | NA | NA | NA |
| Baltzer 2009 [57] | 7 | 13.0 | Y | 7 | 19.6 | N | 99 | 49.6 | 38.2 | 11.3 | 37.8 | 11.8 | 66.3 | 48.8 | 17.5 | 48.2 | 18.1 |
| Bar-Or 2014–10 mL [58] | * | * | Y | NA | NA | NA | 81 | 44.3 | 30.4 | 13.9 | NA | NA | NA | NA | NA | NA | NA |
| Bar-Or 2014–4 mL [58] | * | * | Y | NA | NA | NA | 83 | 42.6 | 29.0 | 13.6 | NA | NA | NA | NA | NA | NA | NA |
| Chao 2010 [53] | 4 | 1.0 | N | NA | NA | NA | 29 | 45.3 | 45.9 | −0.6 | NA | NA | NA | NA | NA | NA | NA |
| Chevalier 2010 [59] | * | * | Y | NA | NA | NA | 129 | 54.6 | NA | NA | 42.4 | 12.2 | NA | NA | NA | NA | NA |
| Henrotin 2017 [60] | NA | NA | NA | 26 | 35.6 | Y | 41 | NA | NA | NA | NA | NA | 66.4 | 36.2 | 30.2 | 30.8 | 35.6 |
| Karlsson 2002 [61] | 12 | 18.2 | Y | 3 | 21.0 | N | 57 | 48.9 | 30.7 | 18.2 | 32.1 | 16.8 | 65.0 | 46.0 | 19.0 | 44.0 | 21.0 |
| Kul-Panza 2010 [62] | 5 | 7.9 | N | 14 | 23.0 | Y | 22 | 70.6 | 63.6 | 7.0 | NA | NA | 65.0 | 42.0 | 23.0 | NA | NA |
| Lee 2015 [63] | 12 | 7.0 | N | 12 | 14.0 | N | 27 | 37.0 | 30.0 | 7.0 | 30.0 | 7.0 | 64.0 | 50.0 | 14.0 | 52.0 | 12.0 |
| Patel 2013 [54] | 6 | −1.2 | N | 6 | 0.0 | N | 46 | 45.5 | 50.7 | −5.2 | 53.1 | −7.6 | 45.7 | NA | NA | 46.1 | −0.4 |
| Ravaud 1999 [64] | NA | NA | NA | 1 | 10.7 | N | 28 | NA | NA | NA | NA | NA | 63.7 | 61.2 | 2.5 | 58.2 | 5.5 |
| Shrestha 2018 [65] | 6 | 14.8 | Y | 2 | 10.3 | N | 58 | 56.5 | 56.1 | 0.4 | NA | NA | 67.3 | 69.0 | -1.7 | NA | NA |
| Smith 2016 [52] | 8 | 15 | Y | NA | NA | NA | 15 | 46 | 37 | 9 | 44 | 2 | NA | NA | NA | NA | NA |
| Takamura 2018 [66] | * | * | Y | NA | NA | NA | 535 | NA | NA | NA | NA | 19.6 | NA | NA | NA | NA | NA |
| Van der Weegen 2015 [67] | 12 | 16.5 | Y | 12 | 9.8 | N | 97 | 40.8 | 22.5 | 16.5 | 28.8 | 12.0 | 24.6 | 14.8 | 9.8 | 21.5 | 3.1 |
| Wu 2018 [68] | 26 | 16.1 | Y | NA | NA | NA | 20 | 28.8 | 13.4 | 14.8 | 12.2 | 16.1 | NA | NA | NA | NA | NA |
| Yavuz 2011 [69] | NA | NA | NA | 1 | 15.0 | N | 30 | NA | NA | NA | NA | NA | 76.0 | 74.0 | 2.0 | NA | NA |
| Mean Scores | 10.0 | 11.0 | 8.4 | 15.9 | 47.0 | 37.0 | 9.2 | 35.1 | 10.5 | 60.4 | 49.1 | 12.9 | 43.0 | 13.6 | |||
| Total # Studies 18/Arms 19 | # of Patients | 1793 | |||||||||||||||
| Author/Year/Cohort | Cell Type | Total MSC/TNC Dosage (Millions) # | Study FU Length (Mo) | # of Joints | Δ 6 mo | MCID Ratio 6 mo | Δ Final FU | MCID Ratio Final |
|---|---|---|---|---|---|---|---|---|
| Freitag 2019 1 inj [25] | ASCs | 100 | 12 | 9 | 22.5 | 2.0 | 23.4 | 2.1 |
| Freitag 2019 2 inj [25] | ASCs | 200 | 12 | 10 | 17.1 | 1.6 | 31.6 | 2.9 |
| Jo 2017 low dose [26] | ASCs | 100 | 24 | 3 | 18.0 | 1.6 | 26.3 | 2.4 |
| Jo 2017 medium dose [26] | ASCs | 50 | 24 | 3 | 20.5 | 1.9 | 43.9 | 4.0 |
| Jo 2017 high dose [26] | ASCs | 10 | 24 | 12 | 21.4 | 1.9 | 35.2 | 3.2 |
| Lee-2019 [27] | ASCs | 100 | 6 | 12 | 33.3 | 3.0 | 33.3 | 3.0 |
| Lu-2019 [28] | ASCs | 100 | 12 | 46 | 9.1 | 0.8 | 9.5 | 0.9 |
| Pers 2016 low dose [29] | ASCs | 2 | 6 | 6 | 33.2 | 3.0 | 33.2 | 3.0 |
| Pers 2016 medium dose [29] | ASCs | 10 | 6 | 6 | 19.1 | 1.7 | 19.1 | 1.7 |
| Pers 2016 high dose [29] | ASCs | 50 | 6 | 6 | 21.0 | 1.9 | 21.0 | 1.9 |
| Song 2018 [30] | ASCs | 20 | 24 | 14 | 36.8 | 3.3 | 22.4 | 2.0 |
| ASCs Means | 14.2 | 22.9 | 2.1 | 27.2 | 2.5 | |||
| Total # of Joints | 127 | |||||||
| Al-Najar 2017 * [32] | BMSCs | 30.5 | 6 | 13 | 31.6 | 3.2 | 31.6 | 3.2 |
| Bastos 2018 MSCs * [33] | BMSCs | 40 | 12 | 9 | NA | NA | 23.6 | 2.4 |
| Bastos 2018 MSCs + PRP * [33] | BMSCs + PRP | 40 | 12 | 9 | NA | NA | 29.2 | 2.9 |
| Emadedin 2012 [36] | BMSCs | 22 | 12 | 6 | 25.1 | 2.3 | 23.5 | 2.1 |
| Emadedin 2015 [37] | BMSCs | 31 | 30 | 6 | 26.1 | 2.4 | 28.1 | 2.6 |
| Emadedin 2018 [38] | BMSCs | 40 | 6 | 19 | 25.7 | 2.3 | 25.7 | 2.3 |
| Lamo-Espinosa 2018 low dose [39] | BMSCs | 10 | 48 | 10 | NA | NA | 20.0 | 1.8 |
| Lamo-Espinosa 2018 high dose [39] | BMSCs | 100 | 48 | 10 | NA | NA | 12.5 | 1.1 |
| Orozco 2013/14 [40,41] | BMSCs | 40 | 24 | 12 | NA | NA | 11.5 | 1.0 |
| Soler 2016 [42] | BMSCs | 40 | 12 | 15 | NA | NA | 17.5 | 1.6 |
| BMSCs Means | 21.0 | 27.1 | 2.5 | 22.3 | 2.1 | |||
| Total # of Joints | 109 | |||||||
| Bansal 2017 | SVF | 100 | 24 | 10 | 18.0 | 1.6 | 23.0 | 2.1 |
| Fodor 2016 | SVF | 14.1 | 12 | 8 | NA | NA | 32.5 | 3.0 |
| Garza 2020 low dose | SVF | 15 | 12 | 13 | 31.2 | 2.8 | 33.1 | 3.0 |
| Garza 2020 high dose | SVF | 30 | 12 | 13 | 26.0 | 2.4 | 32.5 | 3.0 |
| Gibbs 2015 * | SVF | 30.8 | 12 | 7 | 43.8 | 4.4 | 53.4 | 5.3 |
| Yokota 2017 | SVF | 30 | 6 | 26 | 15.8 | 1.4 | 15.8 | 1.4 |
| SVF Means | 12.9 | 27.0 | 2.5 | 31.7 | 3.0 | |||
| Total # of Joints | 93 | |||||||
| Total Means | 15.5 | 24.2 | 2.2 | 25.4 | 2.4 | |||
| Total | 1256 | |||||||
© 2020 by the authors. Licensee MDPI, Basel, Switzerland. This article is an open access article distributed under the terms and conditions of the Creative Commons Attribution (CC BY) license (http://creativecommons.org/licenses/by/4.0/).
Share and Cite
Prodromos, C.; Finkle, S.; Rumschlag, T.; Lotus, J. Autologous Mesenchymal Stem Cell Treatment is Consistently Effective for the Treatment of Knee Osteoarthritis: The Results of a Systematic Review of Treatment and Comparison to a Placebo Group. Medicines 2020, 7, 42. https://doi.org/10.3390/medicines7080042
Prodromos C, Finkle S, Rumschlag T, Lotus J. Autologous Mesenchymal Stem Cell Treatment is Consistently Effective for the Treatment of Knee Osteoarthritis: The Results of a Systematic Review of Treatment and Comparison to a Placebo Group. Medicines. 2020; 7(8):42. https://doi.org/10.3390/medicines7080042
Chicago/Turabian StyleProdromos, Chadwick, Susan Finkle, Tobias Rumschlag, and John Lotus. 2020. "Autologous Mesenchymal Stem Cell Treatment is Consistently Effective for the Treatment of Knee Osteoarthritis: The Results of a Systematic Review of Treatment and Comparison to a Placebo Group" Medicines 7, no. 8: 42. https://doi.org/10.3390/medicines7080042
APA StyleProdromos, C., Finkle, S., Rumschlag, T., & Lotus, J. (2020). Autologous Mesenchymal Stem Cell Treatment is Consistently Effective for the Treatment of Knee Osteoarthritis: The Results of a Systematic Review of Treatment and Comparison to a Placebo Group. Medicines, 7(8), 42. https://doi.org/10.3390/medicines7080042