Figure 1.
Photodocumentation of treatment modalities over time in the pilot part of the study. The figure shows representative images captured on Days 1, 5, 9, 13, 17, and 20 for each treatment modality in the pilot part of the study. The treatments include: no treatment, excipient gel, silkworm body extract gels at concentrations of 20%, 40%, and 60% w/w, silkworm gland extract gels at concentrations of 20%, 40%, and 60% w/w, and cocoon application.
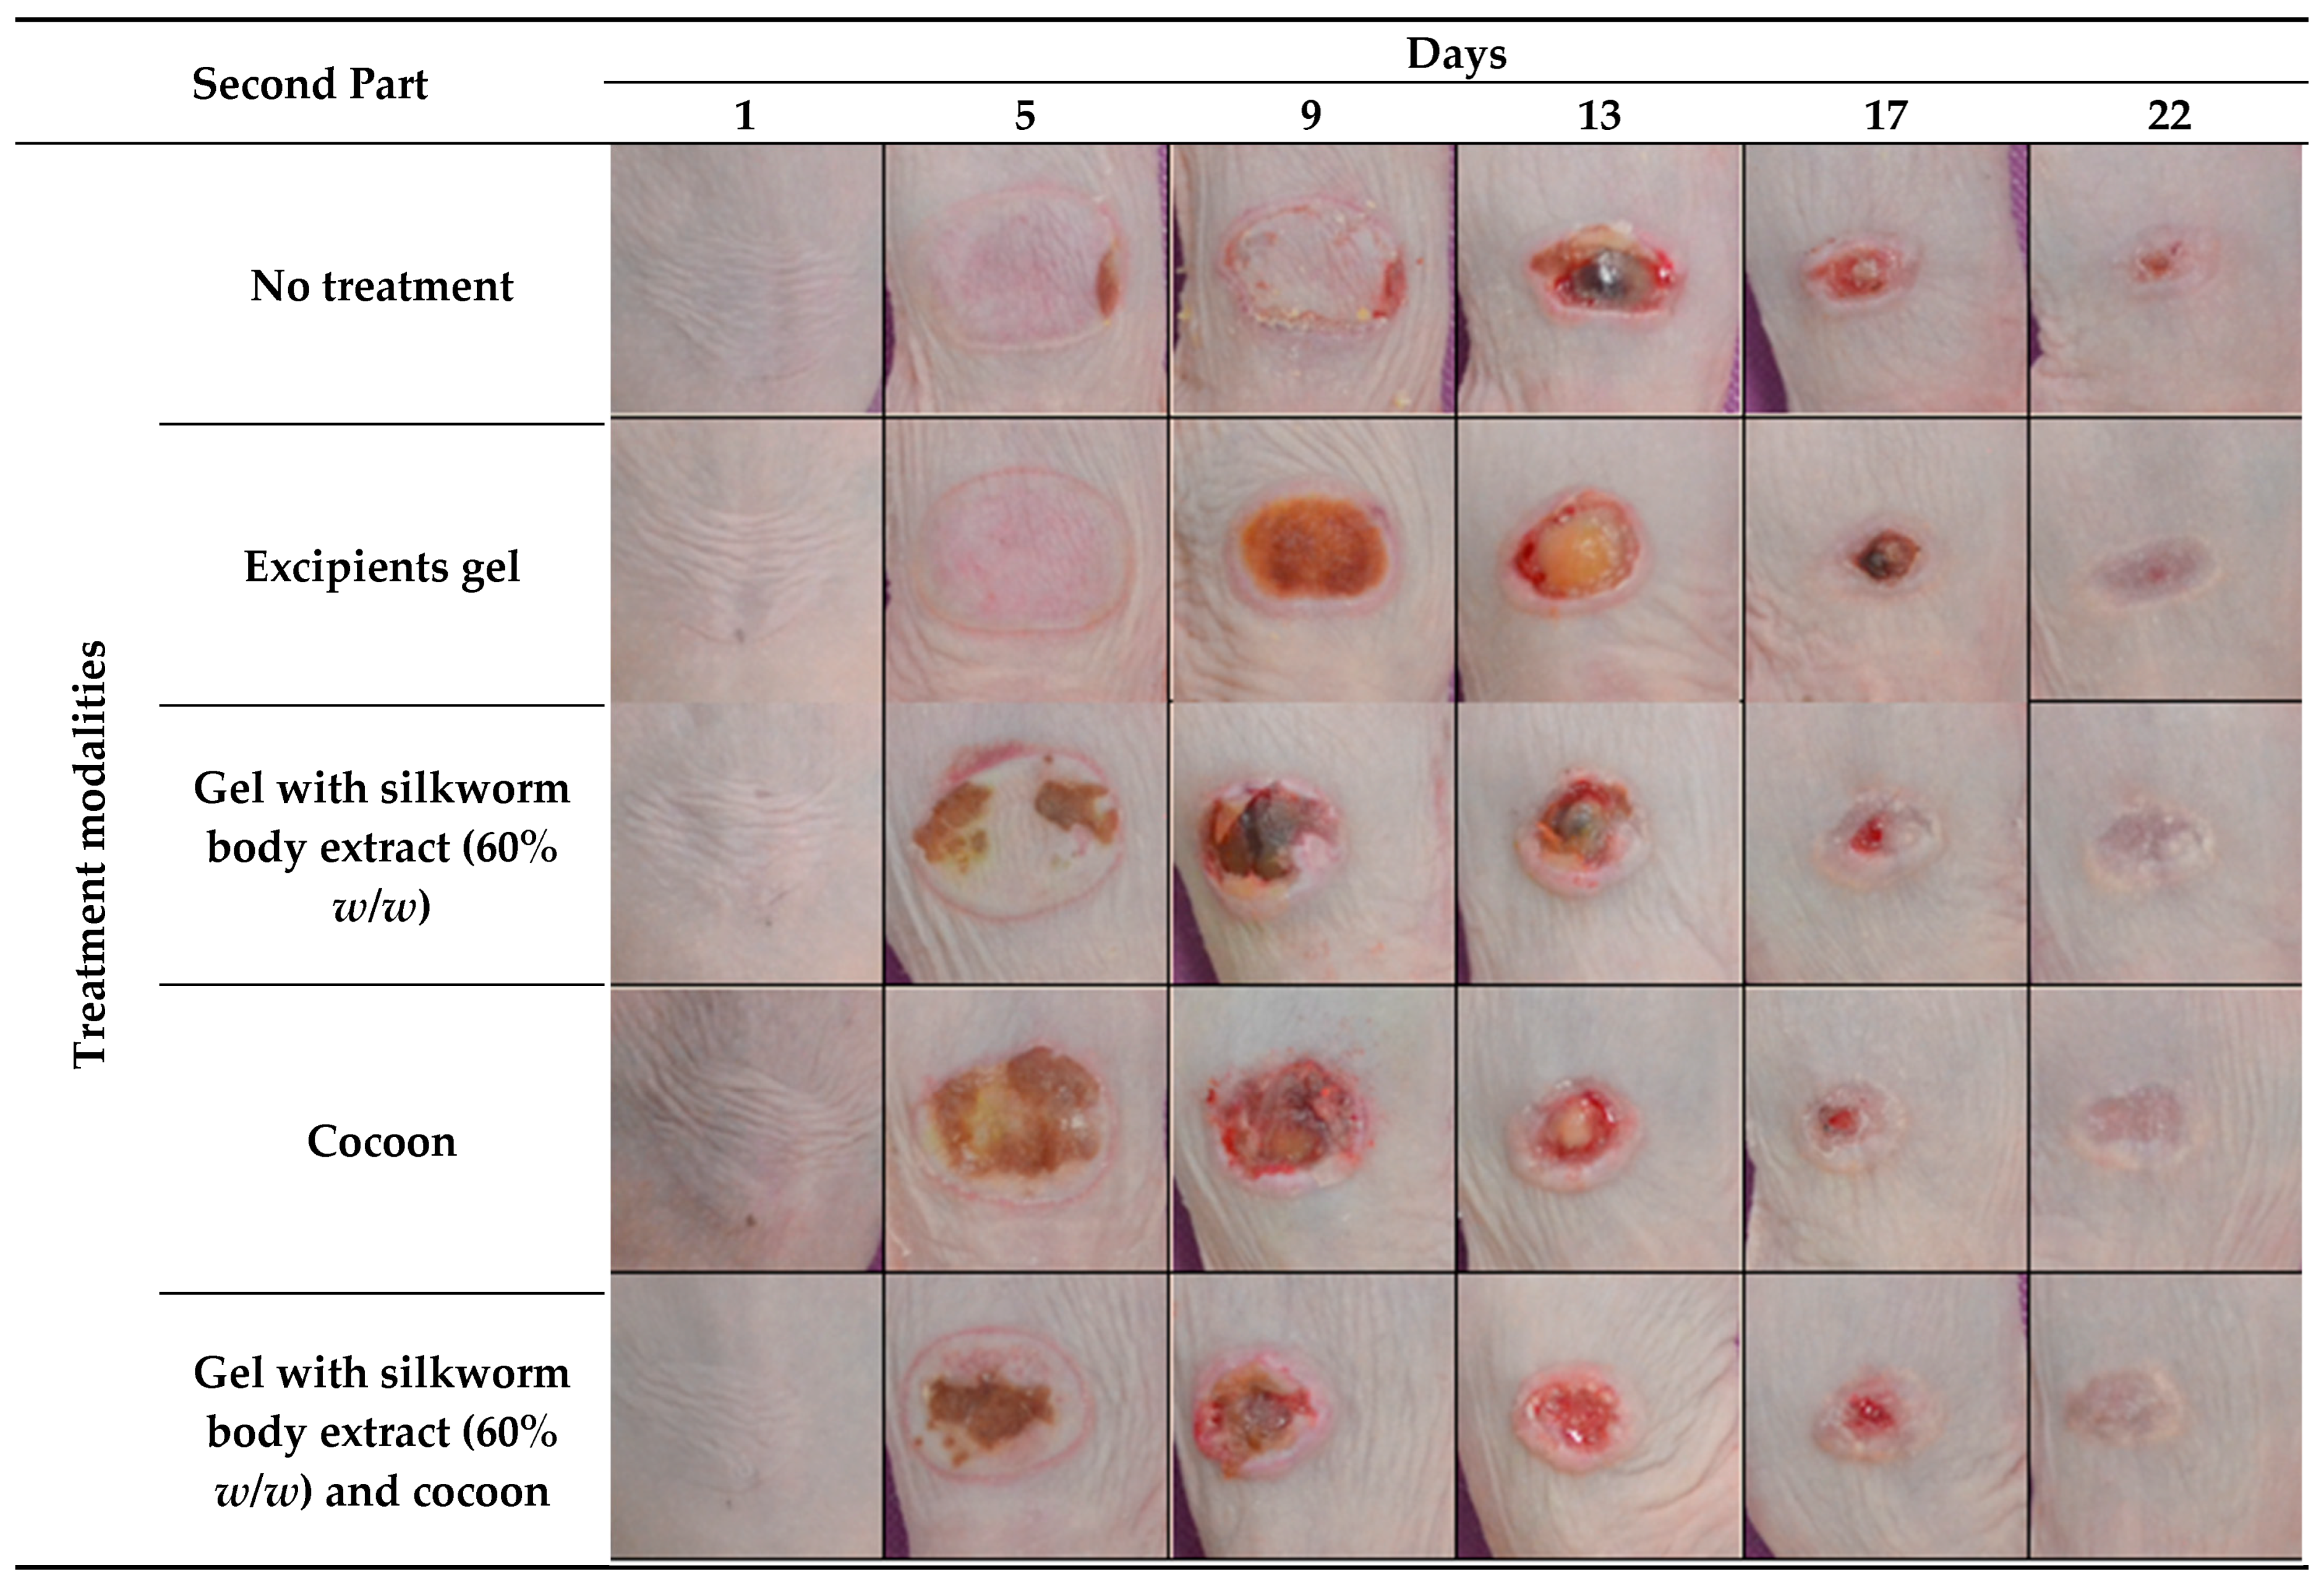
Figure 2.
Photodocumentation of treatment modalities over time in the second part of the study. The figure displays representative images captured on Days 1, 5, 9, 13, 17, and 22 for each treatment modality in the study part of the experiment. The treatment modalities include: no treatment, excipient gel, gel with silkworm body extract (60% w/w), cocoon application, and a combination treatment of gel with silkworm body extract (60% w/w) and cocoon.
Figure 3.
Percentage of completely healed animals over time in the pilot part of the study. The bar graph illustrates the percentage of animals that achieved complete wound healing across different treatment groups over time, specifically on Days 15, 17, 19, and 20. Treatment groups include Control, Excipients, and various formulations of silkworm body and gland extracts (20%, 40%, and 60% w/w) as well as cocoon application (n = 5).
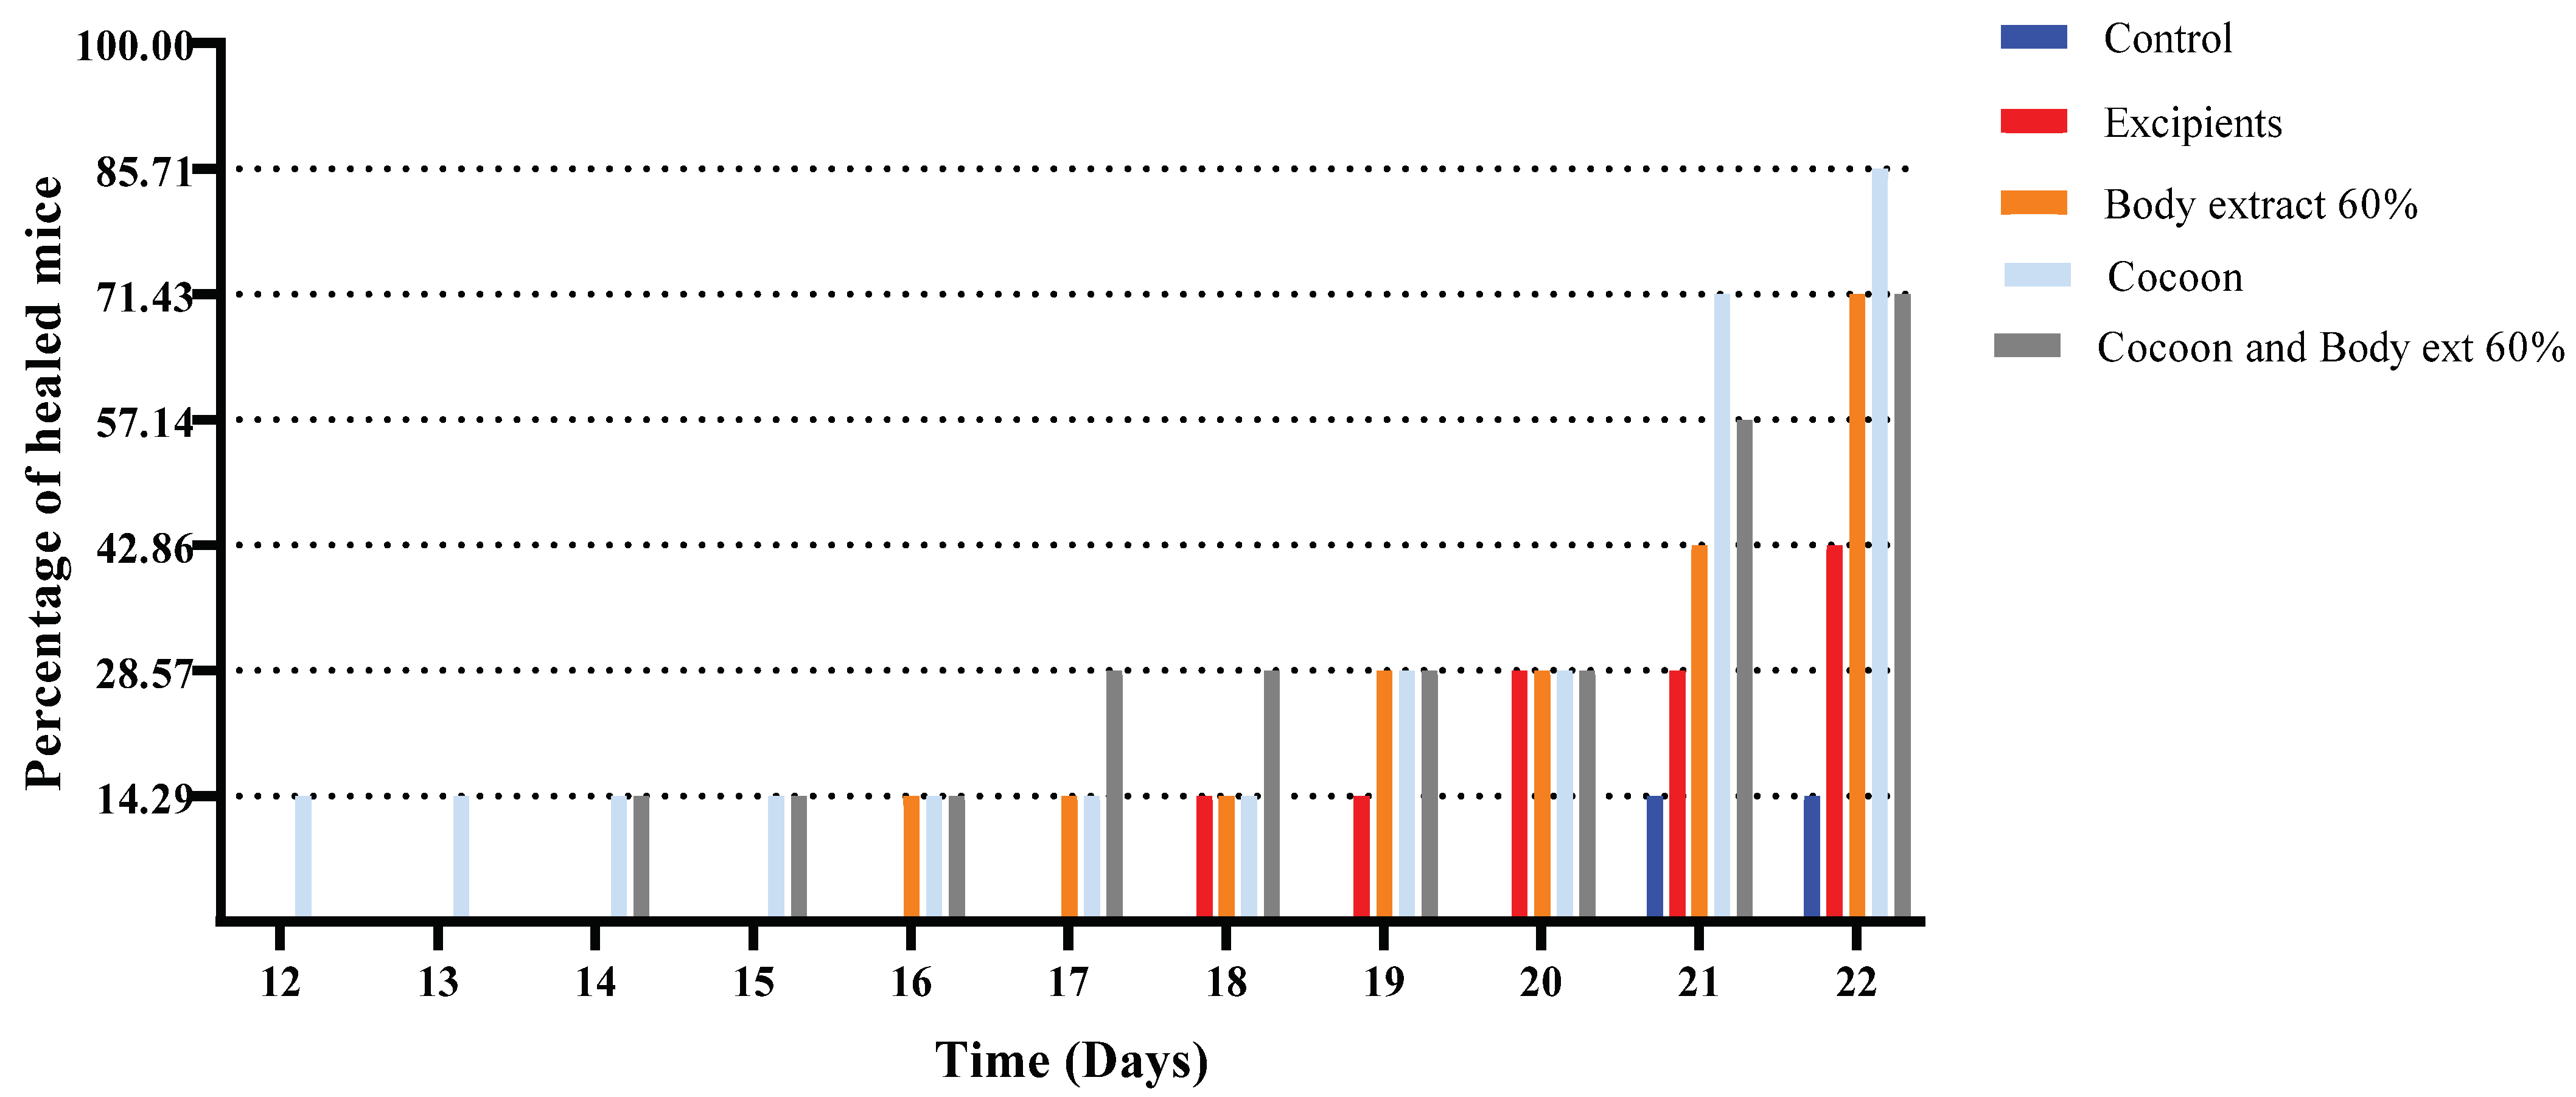
Figure 4.
Percentage of completely healed animals over time in the study part of the experiment. The bar graph depicts the percentage of animals that achieved complete wound healing across different treatment groups over time, specifically on Days 12 to 22. Treatment groups include control, excipients, silkworm body extract gel (60% w/w), cocoon application, and a combination of cocoon and silkworm body extract gel (60% w/w) (n = 7).
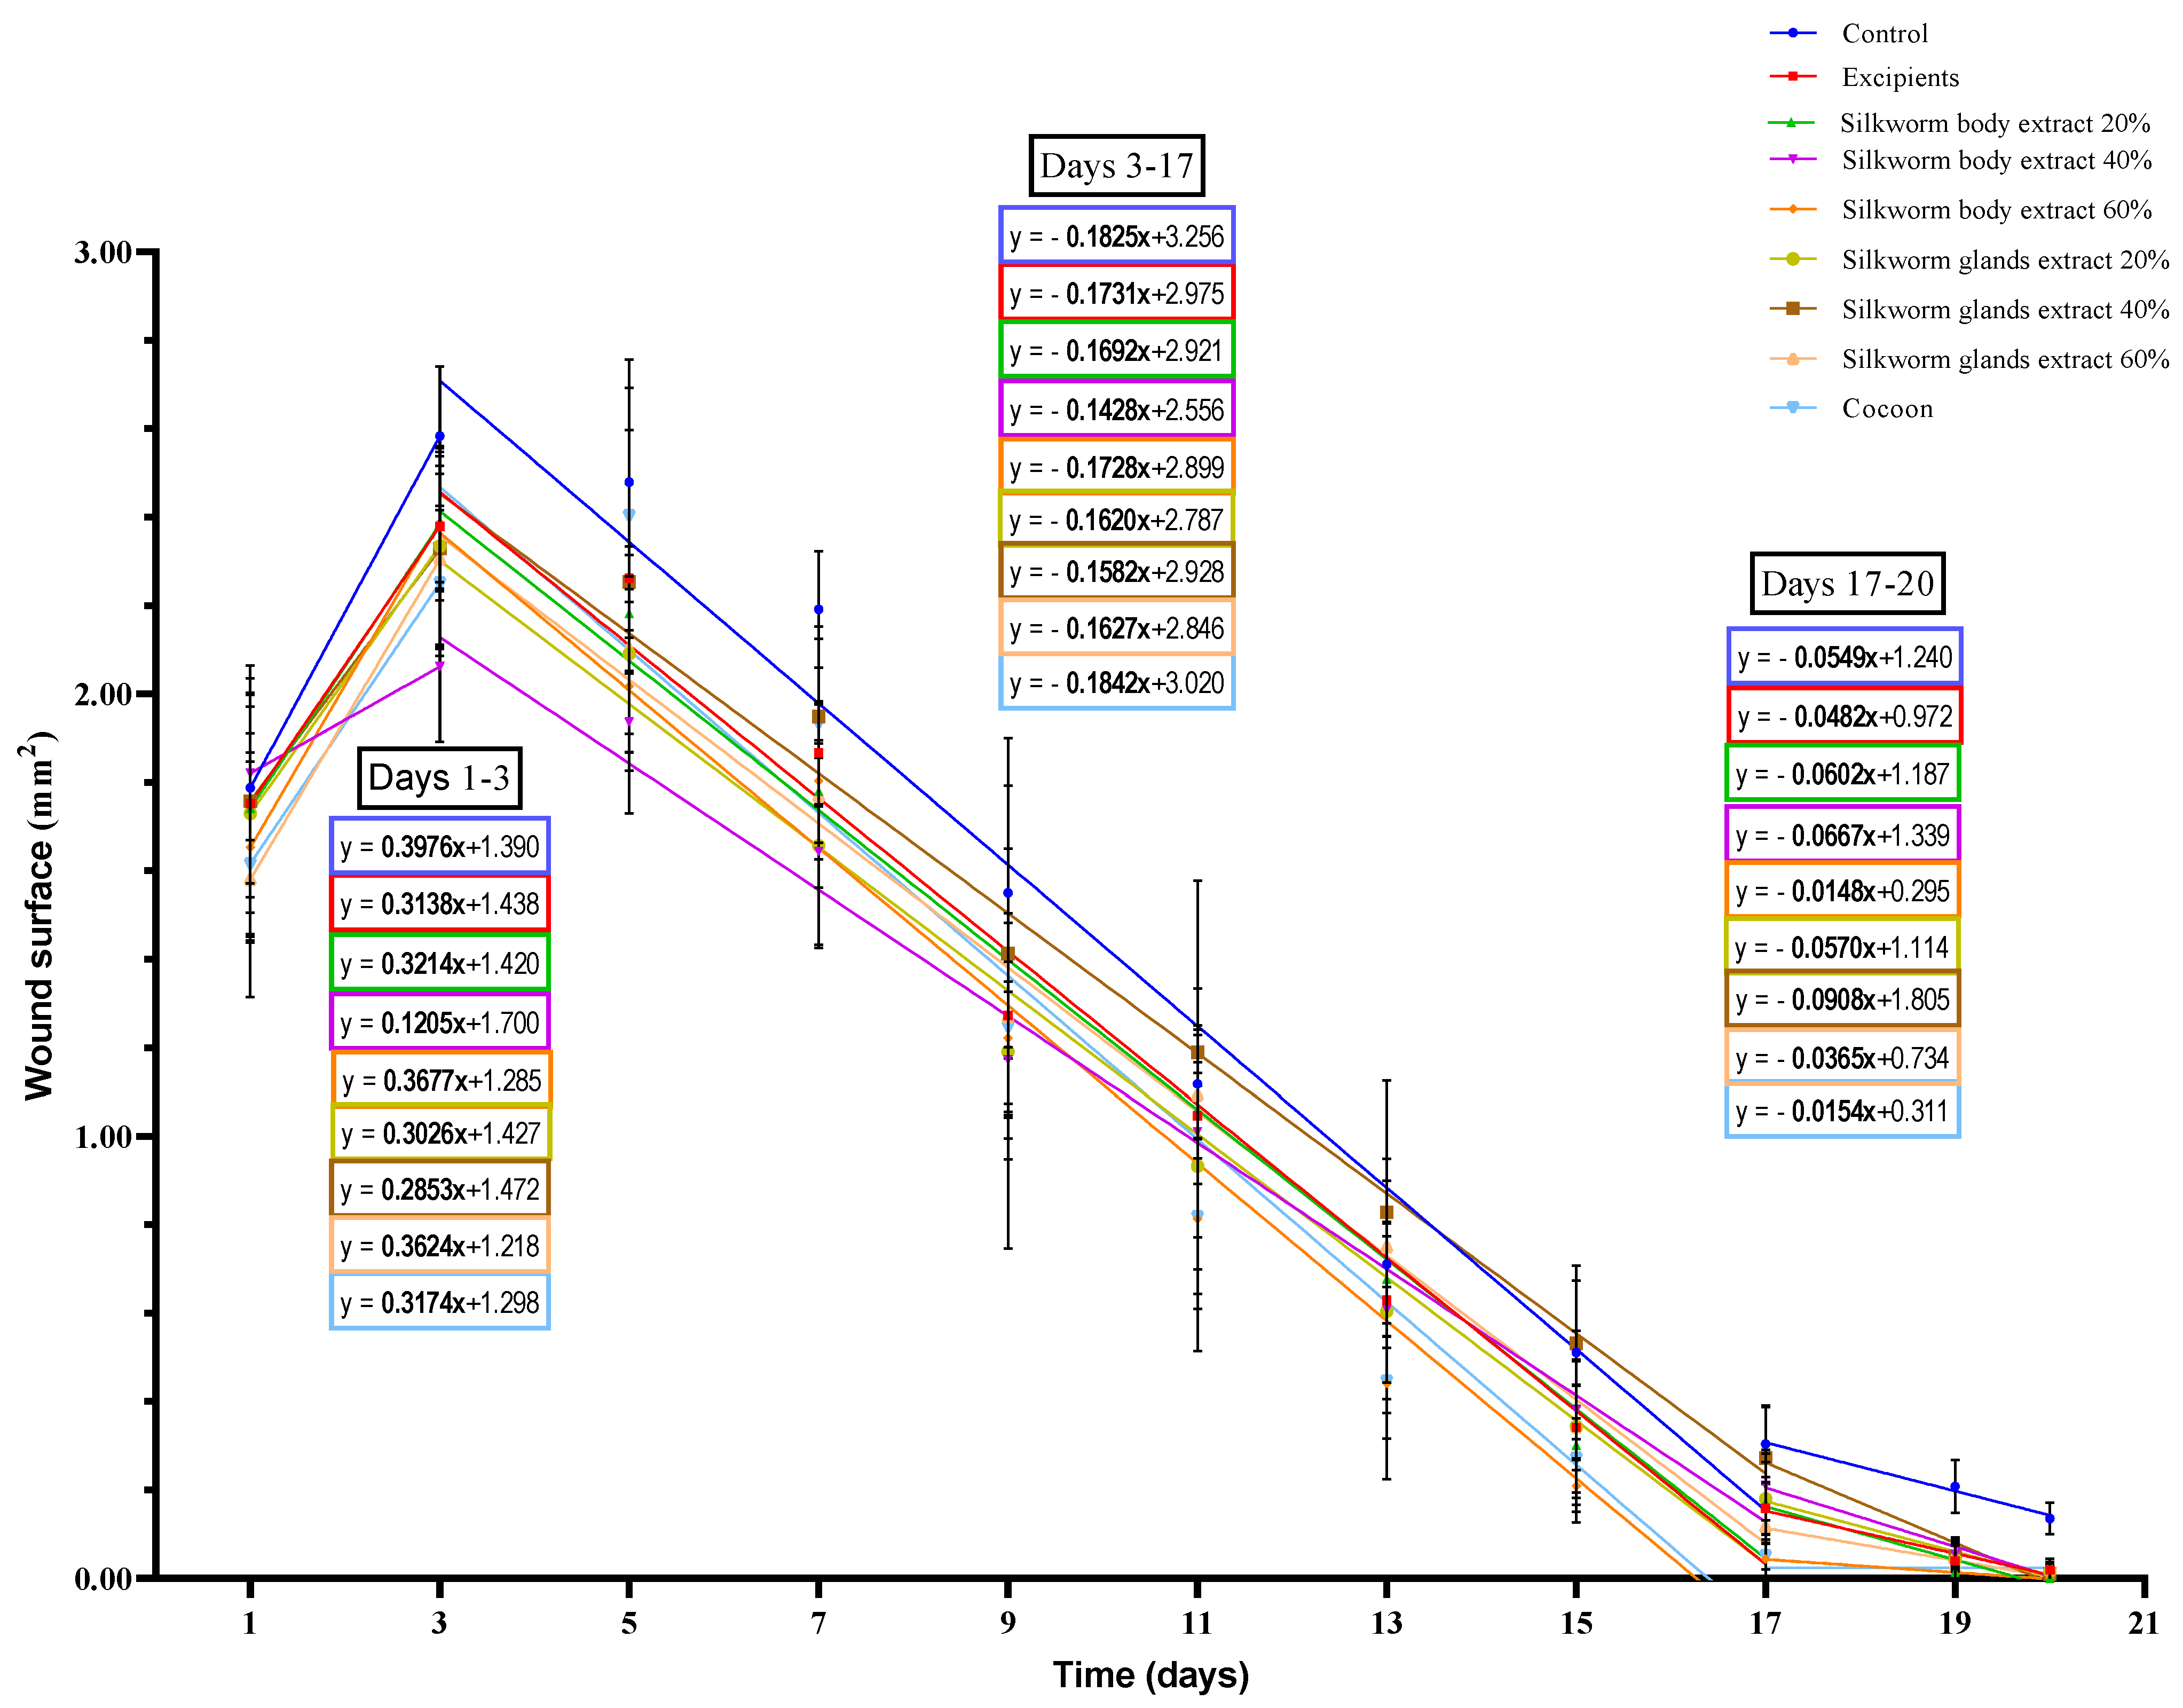
Figure 5.
Linear regression analysis of wound surface change over time in the pilot part of the study (n = 5). The graph displays wound surface area (in mm2) over time (in days) for different treatment groups in the pilot study, including control, excipients, silkworm body and gland extract gels at various concentrations, and cocoon. Linear regression lines are shown for three distinct phases of healing: Days 1–3, Days 3–17, and Days 17–20. The slope of each regression line represents the rate of wound healing (surface area reduction) for each treatment within each phase.
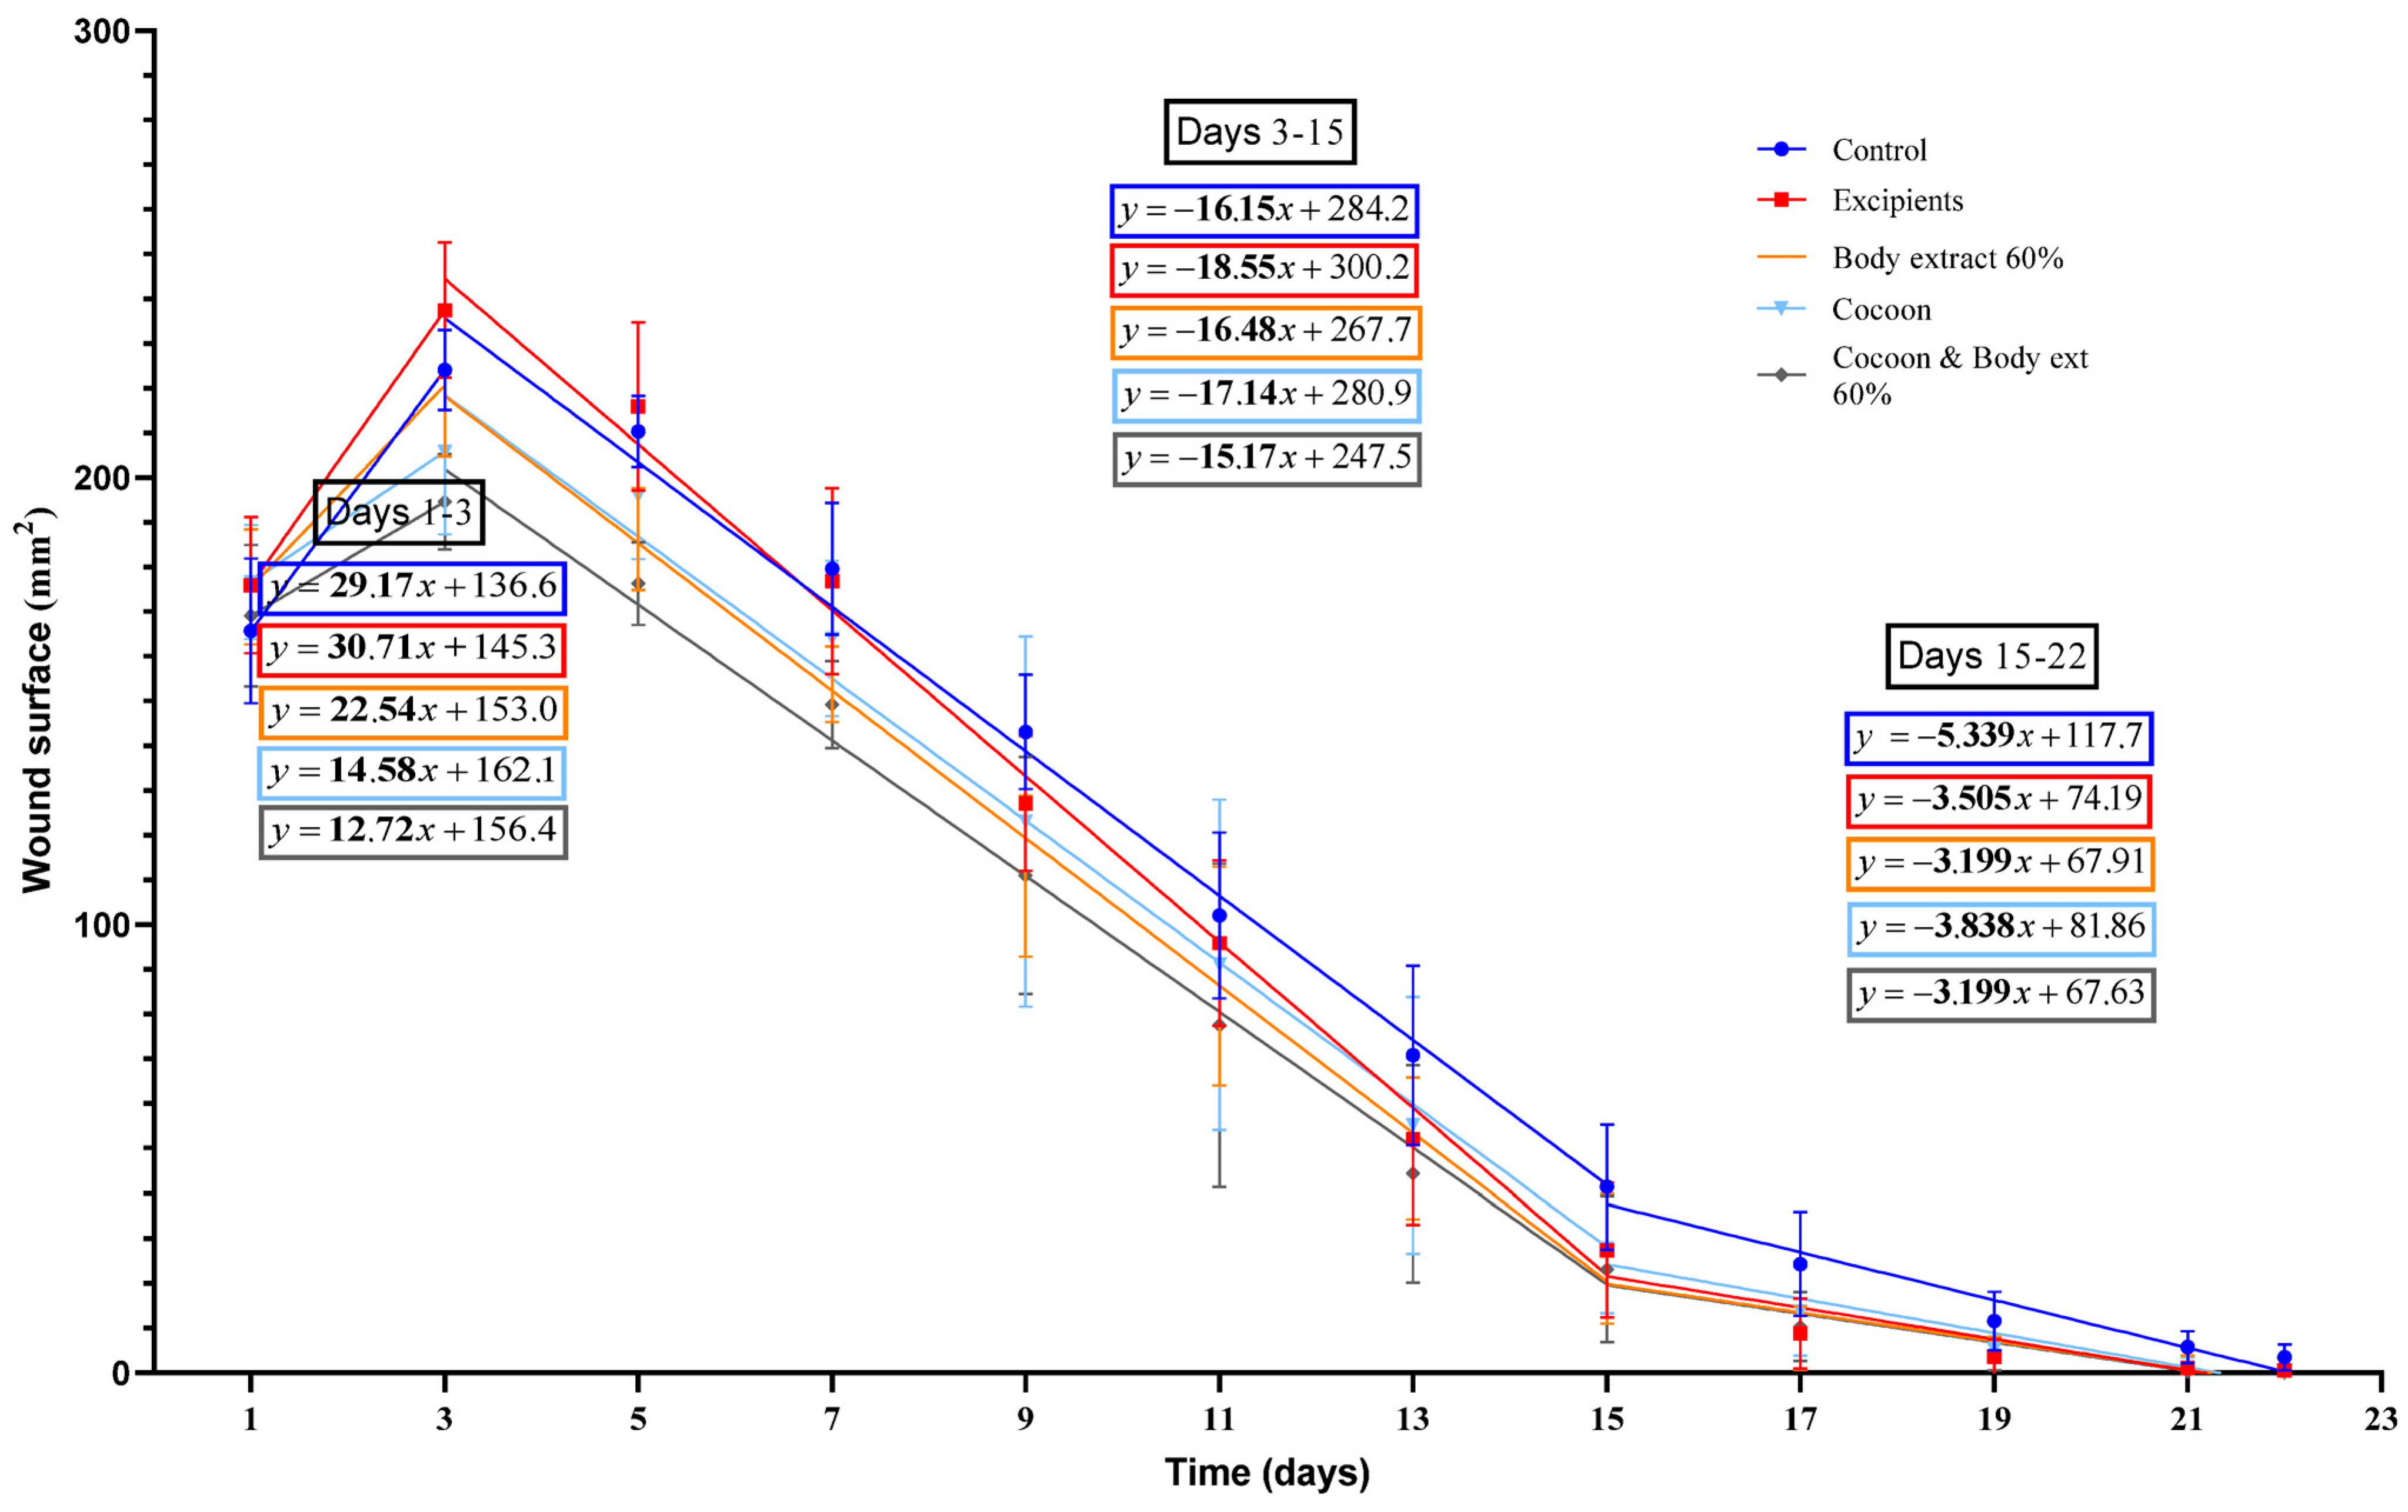
Figure 6.
Linear regression analysis of wound surface change over time in the study part of the experiment (n = 7). The graph illustrates the wound surface area (in mm2) over time (in days) for different treatment groups in the study part of the experiment, including control, excipients, silkworm body extract gel (60% w/w), cocoon, and a combination of cocoon and silkworm body extract (60% w/w). Linear regression lines are presented for three phases: Days 1–3 (wound surface increase phase), Days 3–15 (initial healing phase), and Days 15–22 (final healing phase).
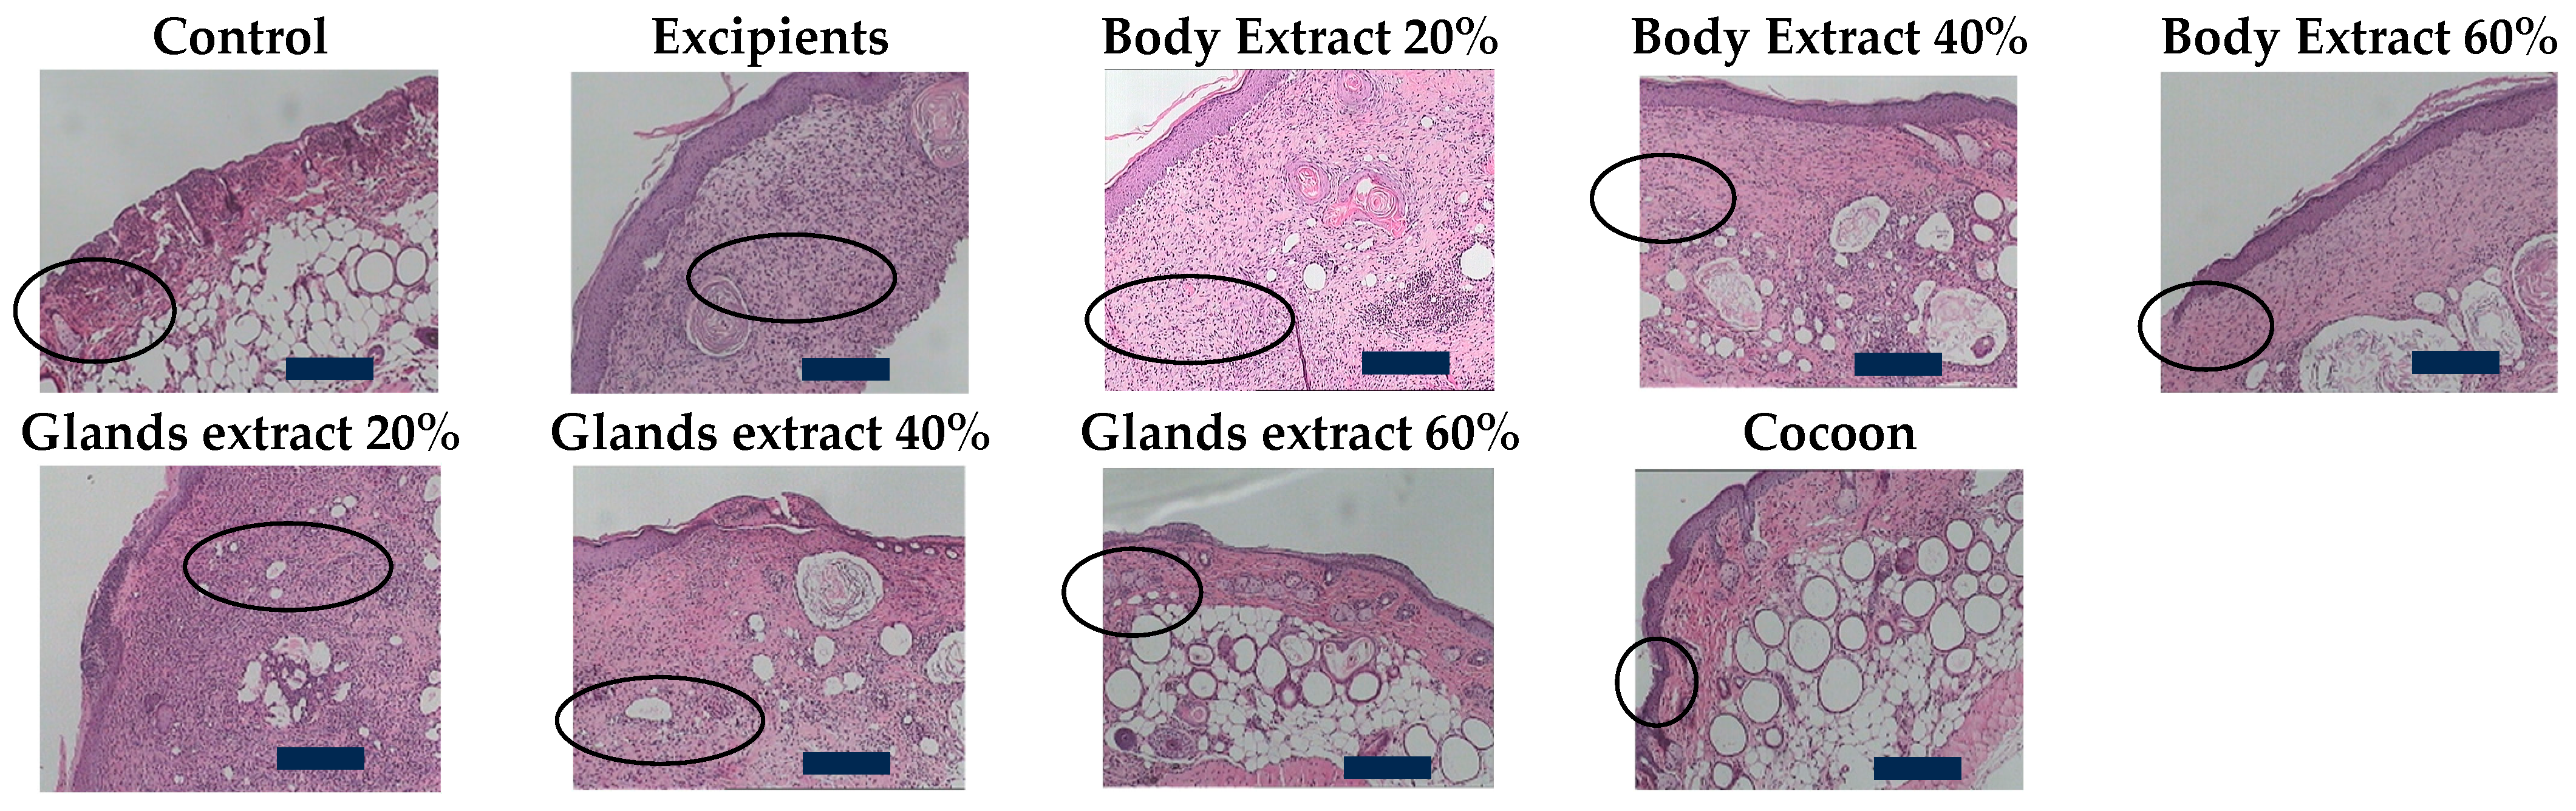
Figure 7.
Histopathological assessment of burn wounds at 20 days post-burn (pilot part) at 100× magnification (scale bar = 100 µm)
. The figure displays representative histological images of hematoxylin and eosin-stained sections (5 μm thickness) of burn wounds from the pilot study, captured at 100× magnification. These images correspond to different treatment groups and provide a detailed view of the inflammatory response, edema, hyperkeratosis, ulceration, and other tissue characteristics at 20 days post-burn. The control and excipient groups exhibit severe inflammation with dense polymorphonuclear leukocyte infiltration, while the cocoon group shows mild inflammation with limited tissue damage. The histopathological assessment revealed that treatment with silkworm extracts, particularly in the cocoon group, led to reduced inflammation and edema compared to the control. The areas of inflammation are indicated by ‘
![Medicines 12 00011 i001]()
’.
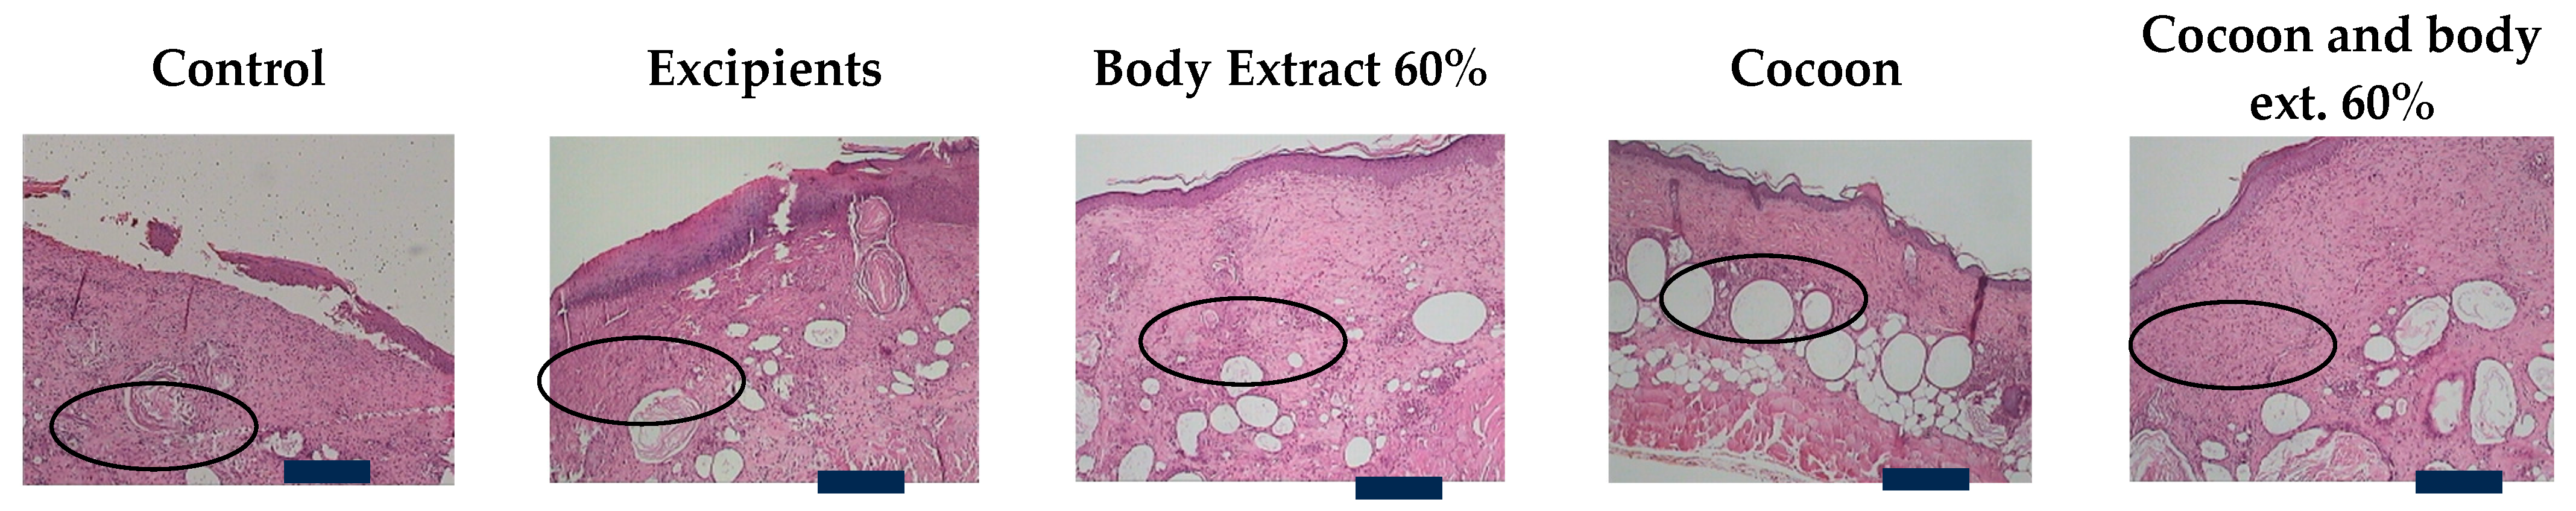
Figure 8.
Histopathological assessment of burn wounds at 20 days post-burn (second study part) at 100× magnification (Scale bar 100 μm). The figure presents representative histological images of hematoxylin and eosin-stained sections (5 μm thickness) of burn wounds from the study part of the experiment, captured at 100× magnification. These images correspond to different treatment groups and reveal details of inflammatory response, edema, hyperkeratosis, ulceration, and other tissue characteristics at 20 days post-burn. The control and excipient groups demonstrate severe inflammation and edema, with extensive tissue damage across the entire dermal thickness. In contrast, the cocoon and combination treatment groups show moderate inflammation and edema with limited tissue damage. The areas of inflammation are indicated by ‘
![Medicines 12 00011 i001]()
’.
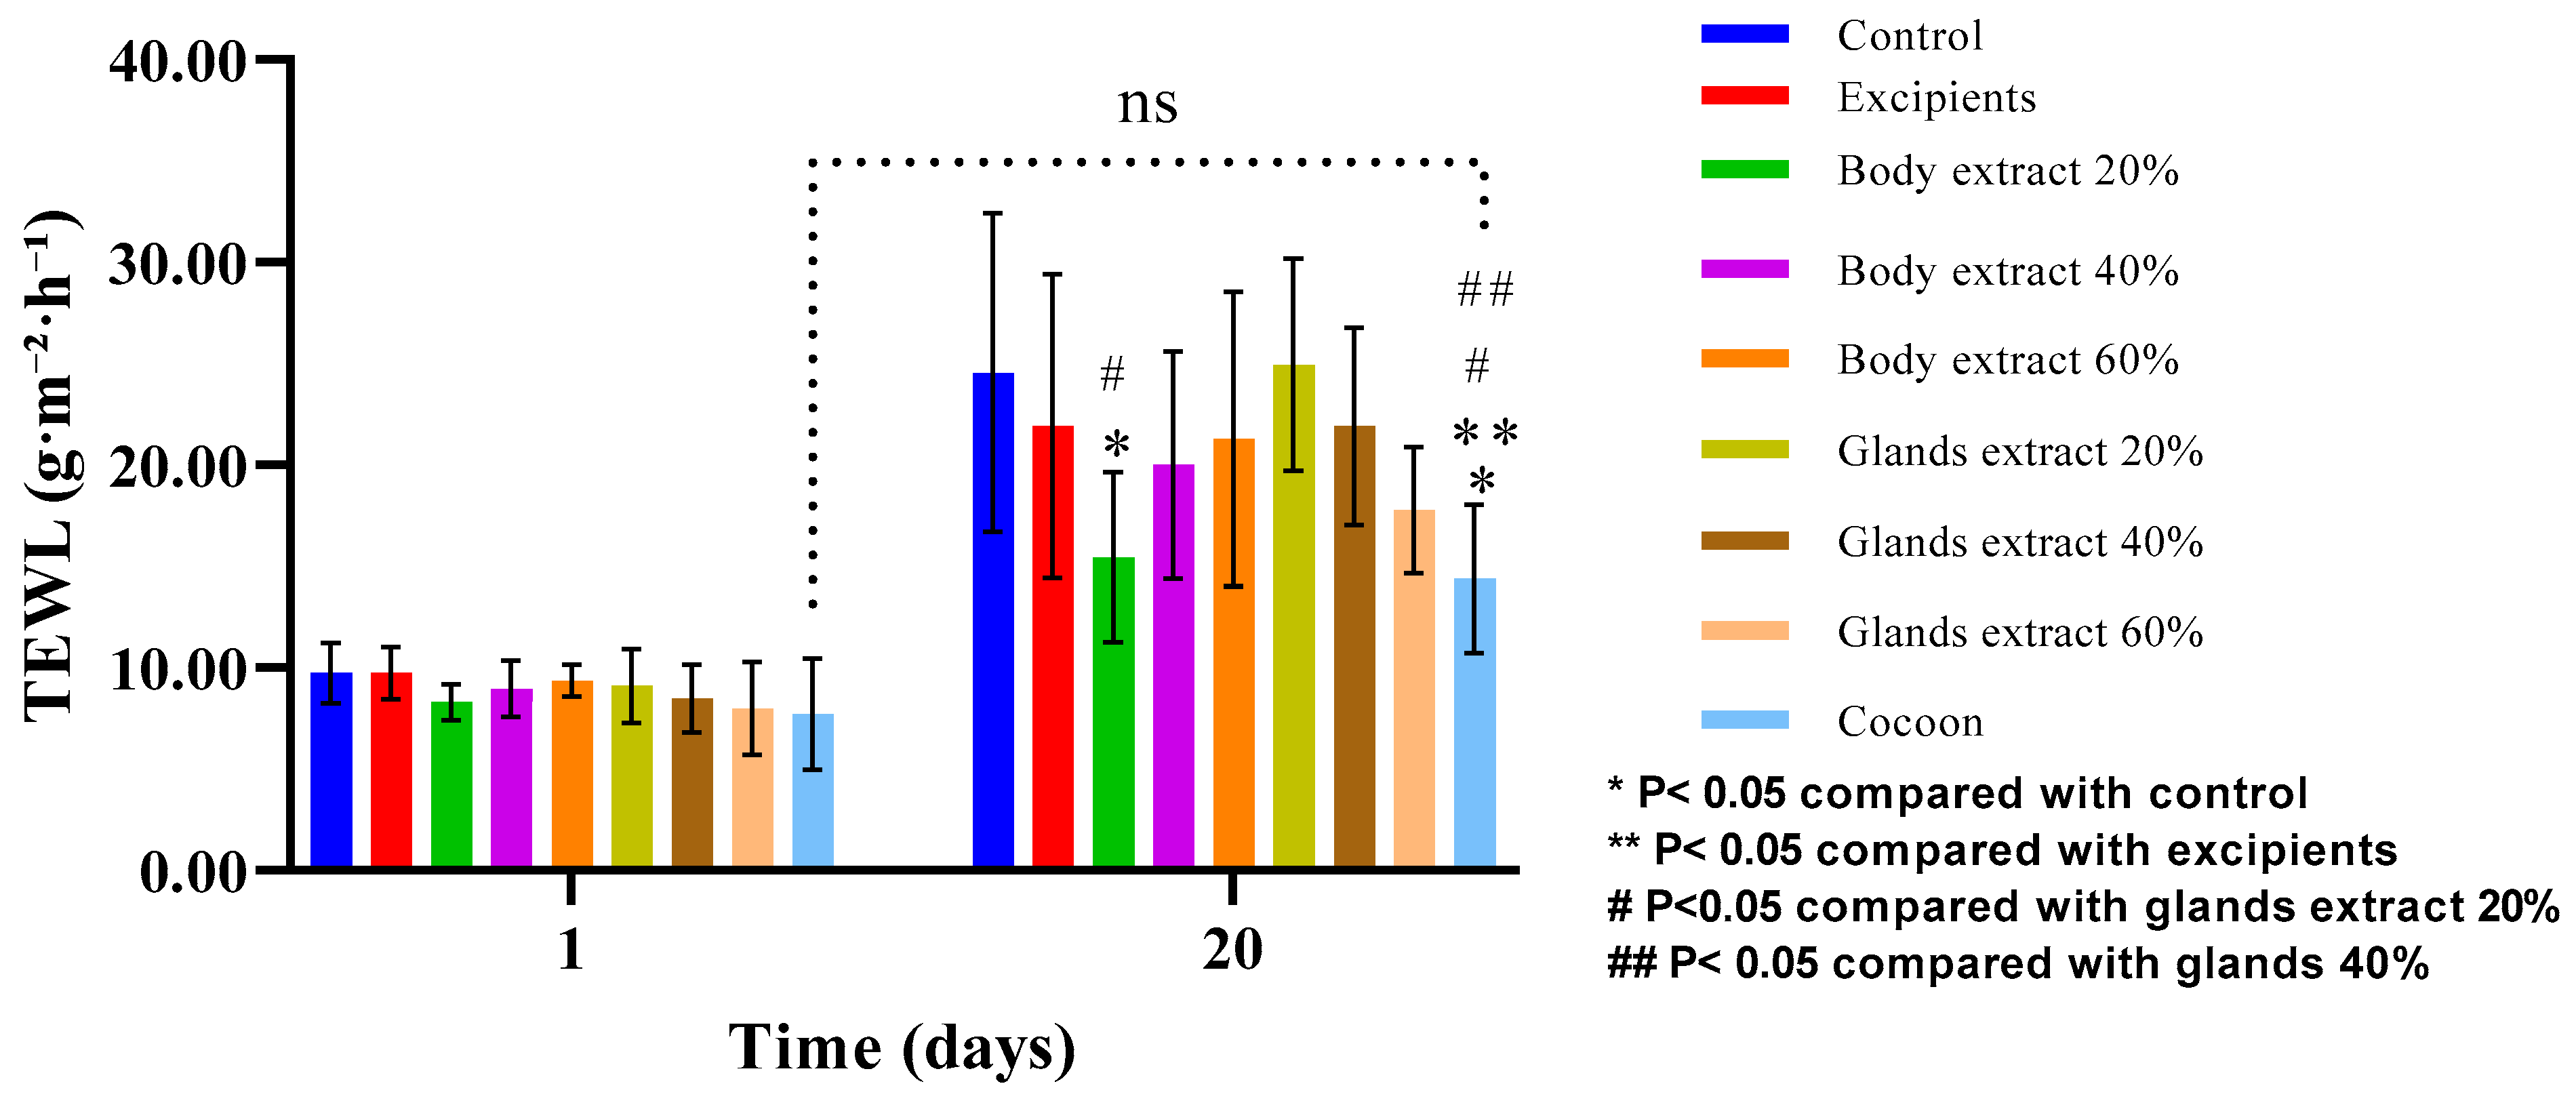
Figure 9.
Transepidermal water loss (TEWL) measurements over time across different treatment modalities within the pilot part of the study. The bar graph shows transepidermal water loss (TEWL) measurements (g/m2/h) at Days 1 and 20 for various treatment groups (n = 5), including control, excipients, silkworm body extracts (20%, 40%, and 60% w/w), silkworm gland extracts (20%, 40%, and 60% w/w), and cocoon. Statistically significant differences are indicated: * p < 0.05 compared with control, ** p < 0.05 compared with excipients, # p < 0.05 compared with glands extract 20%, and ## p < 0.05 compared with glands extract 40%. The “ns” label indicates no significant difference between certain groups over time. Error bars represent standard deviations.
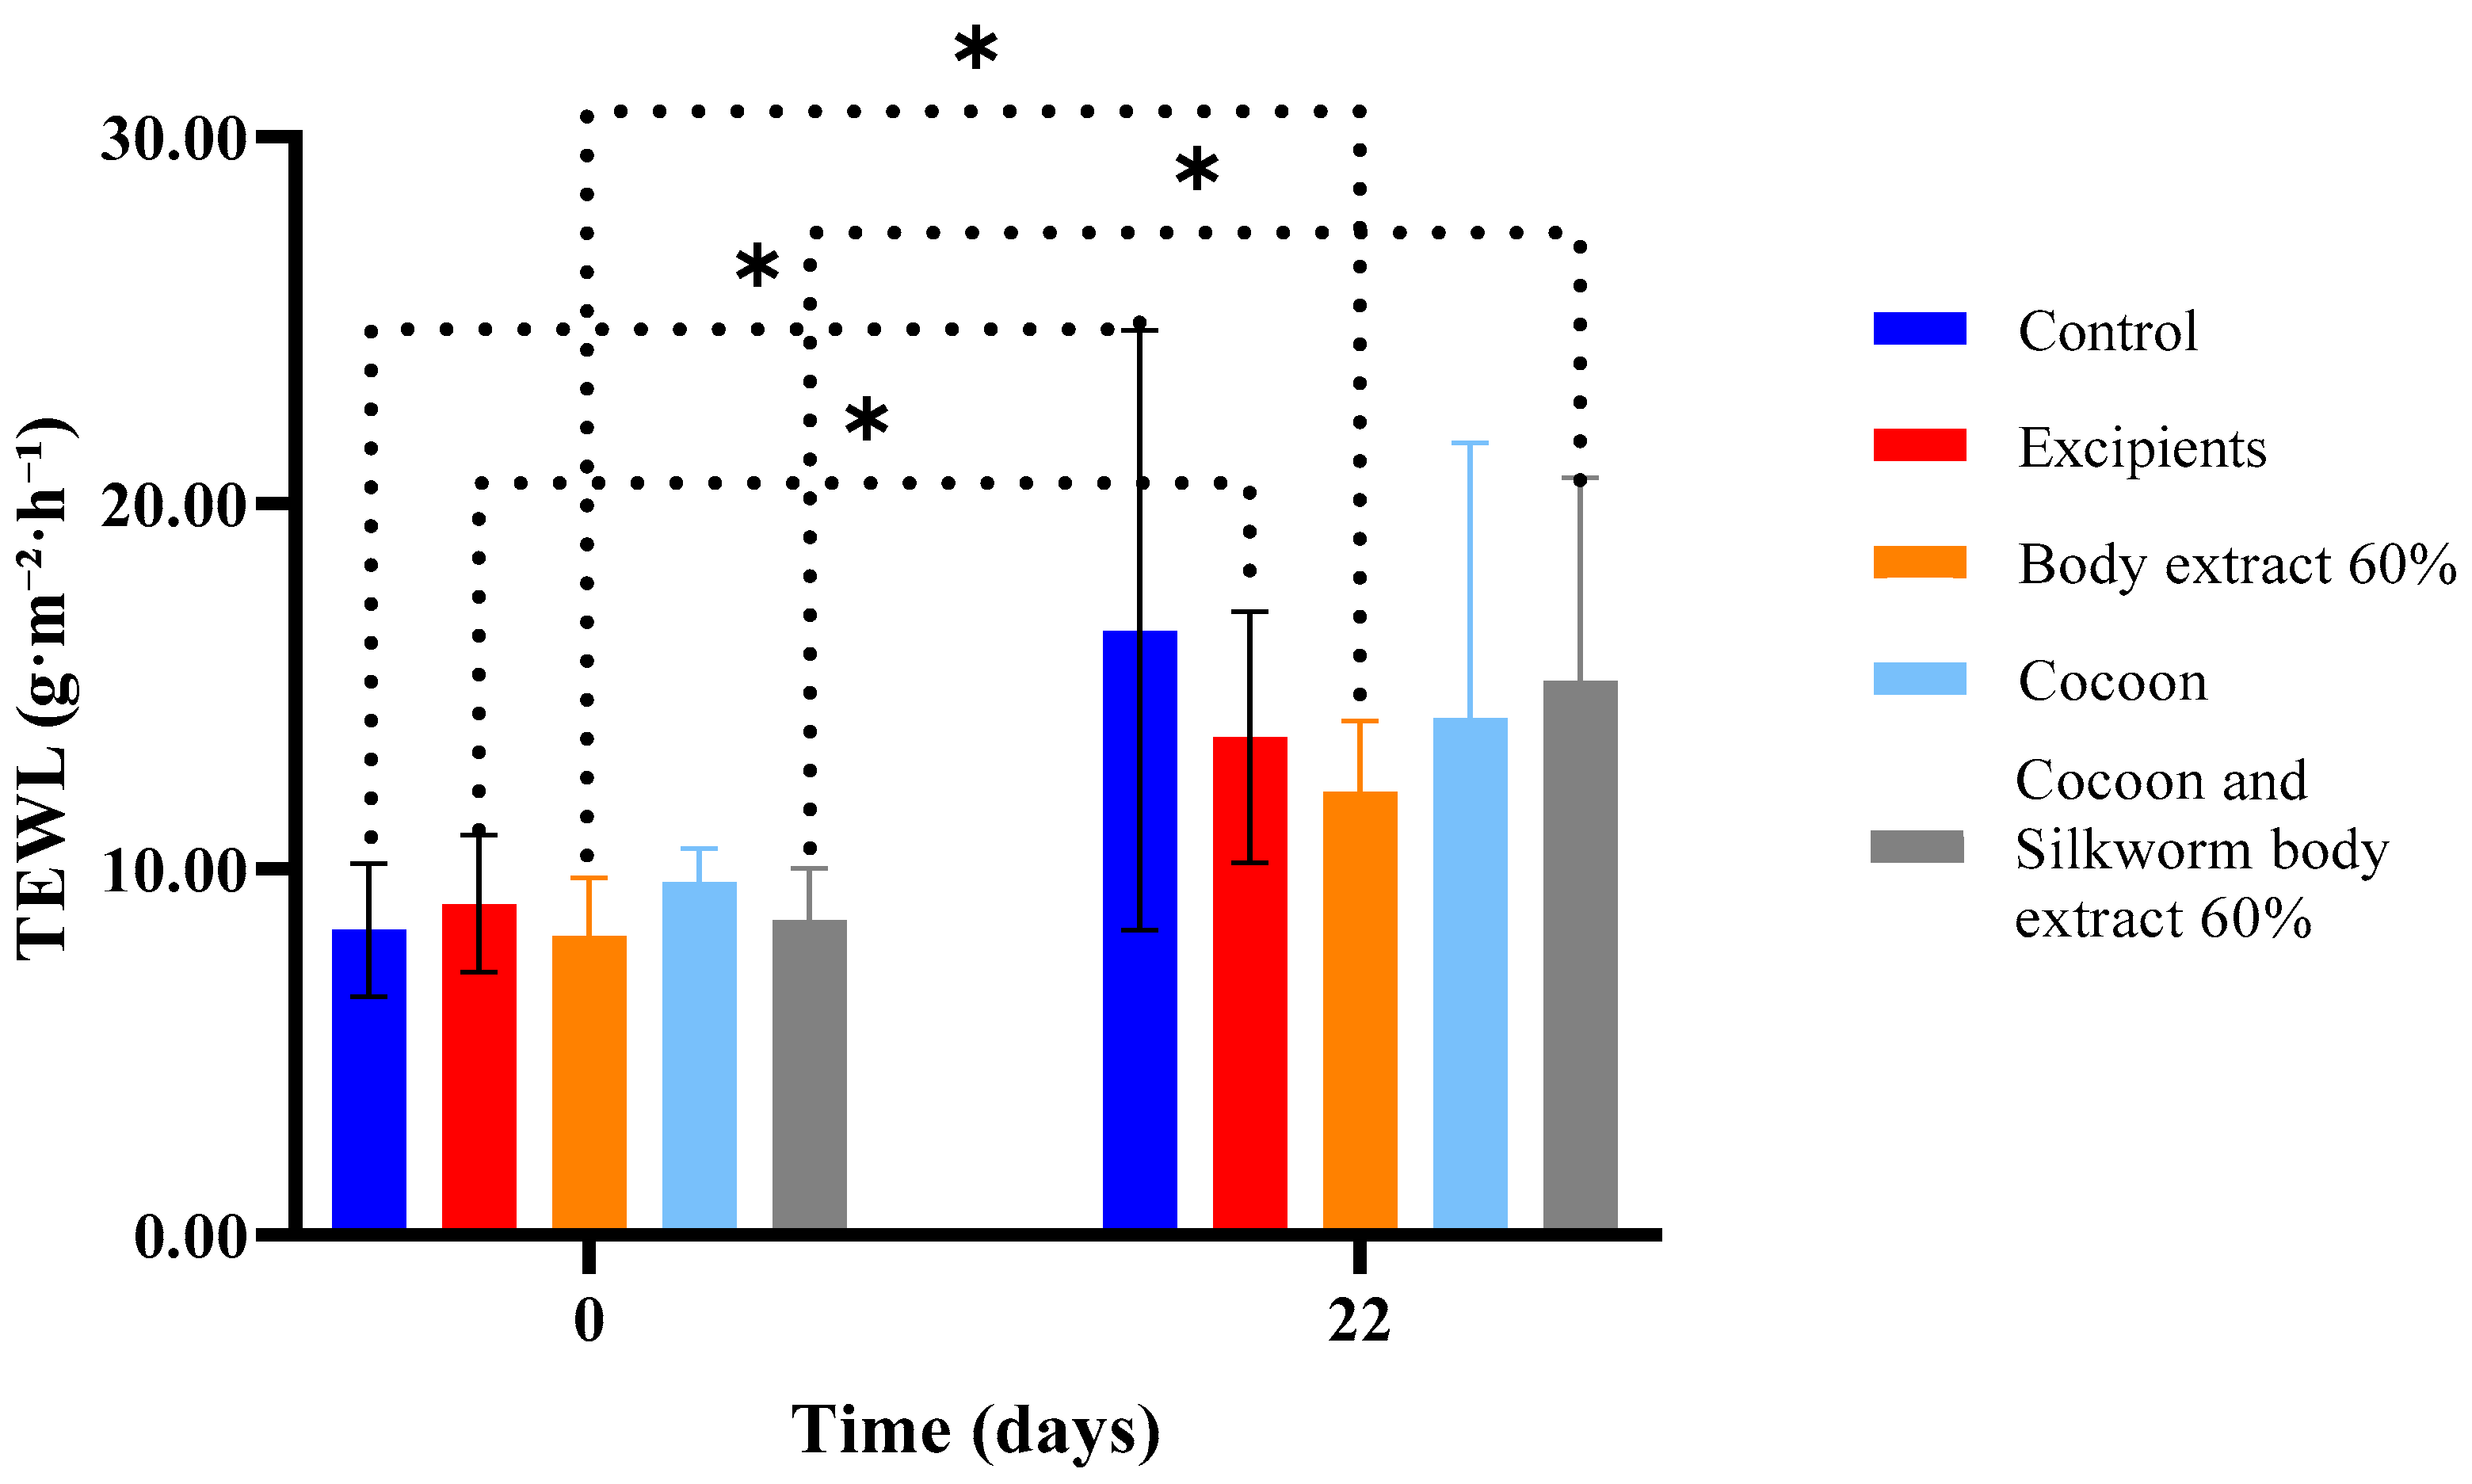
Figure 10.
Transepidermal water loss (TEWL) measurements over time across different treatment groups in the study part of the experiment (n = 7). The bar graph illustrates transepidermal water loss (TEWL) measurements (g/m2/h) at Days 0 and 22 for various treatment groups, including control, excipients, silkworm body extract (60% w/w), cocoon, and a combination of cocoon and silkworm body extract (60% w/w). Statistically significant differences between groups are marked with an asterisk (* p < 0.05). The dotted lines indicate significant comparisons across time points and treatment groups, reflecting the impact of treatments on skin barrier function. Error bars represent standard deviations.
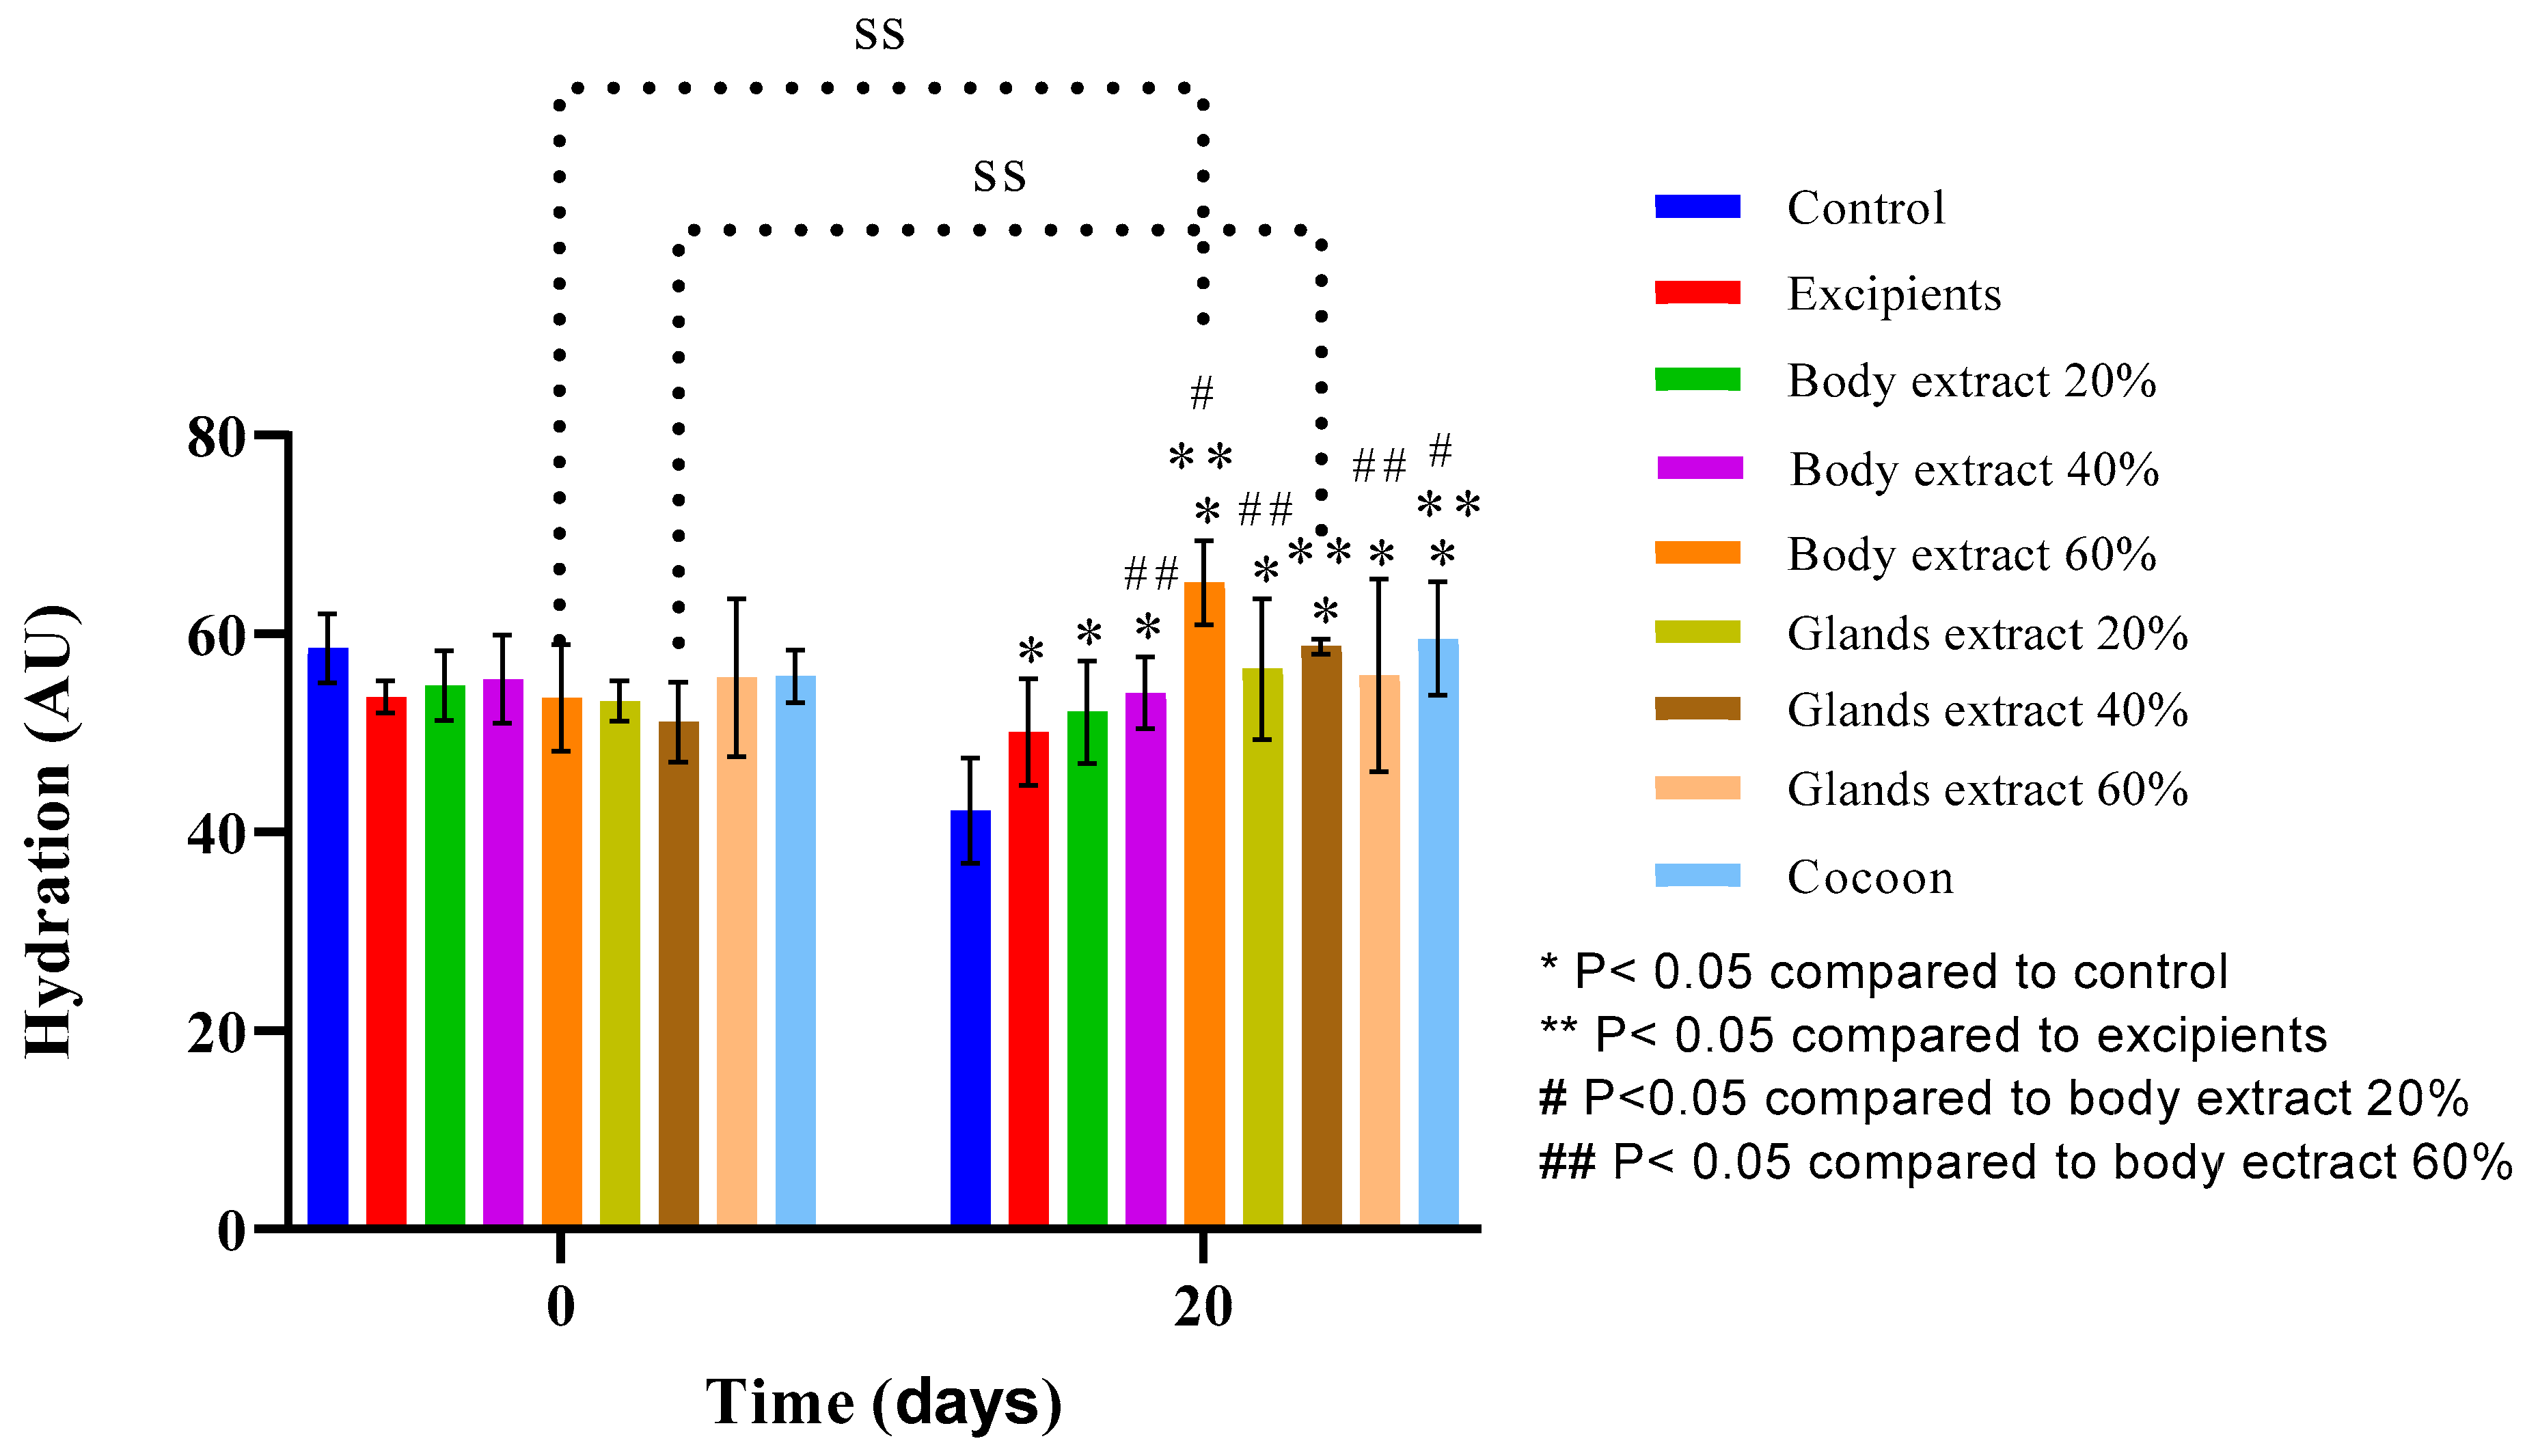
Figure 11.
Skin hydration measurements over time across different treatment groups in the pilot part of the study (n = 5). The bar graph presents skin hydration levels (AU) at Days 0 and 20 for various treatment groups, including control, excipients, silkworm body extracts (20%, 40%, and 60% w/w), silkworm gland extracts (20%, 40%, and 60% w/w), and cocoon. Statistically significant differences are indicated: * p < 0.05 compared with control, ** p < 0.05 compared with excipients, # p < 0.05 compared with body extract 20%, and ## p < 0.05 compared with body extract 60%. “SS” denotes significant differences over time within groups. Error bars represent standard deviations, showing variations in hydration levels between treatment groups.
Figure 12.
Skin hydration measurements over time across different treatment groups in the study part of the experiment (n = 7). The bar graph shows skin hydration levels (AU) at Days 0 and 22 for various treatment groups, including control, excipients, silkworm body extract (60% w/w), cocoon, and a combination of cocoon and silkworm body extract (60% w/w). A statistically significant difference is marked with an asterisk (* p < 0.05), while “ns” indicates no significant difference between certain groups over time. Error bars represent standard deviations, illustrating hydration variability within each group.
Figure 13.
Sebum measurements over time across different treatment groups in the pilot part of the study (n = 5). The bar graph presents sebum levels (µg/cm2) at Days 0 and 20 for various treatment groups, including control, excipients, silkworm body extracts (20%, 40%, and 60% w/w), silkworm gland extracts (20%, 40%, and 60% w/w), and cocoon. Statistically significant differences are marked as follows: * p < 0.05 compared with the glands extract 20%, and # p < 0.05 compared with the glands extract 60%. “SS” indicates significant differences over time within specific groups. Error bars represent standard deviations, showing variability in sebum levels between treatment groups.
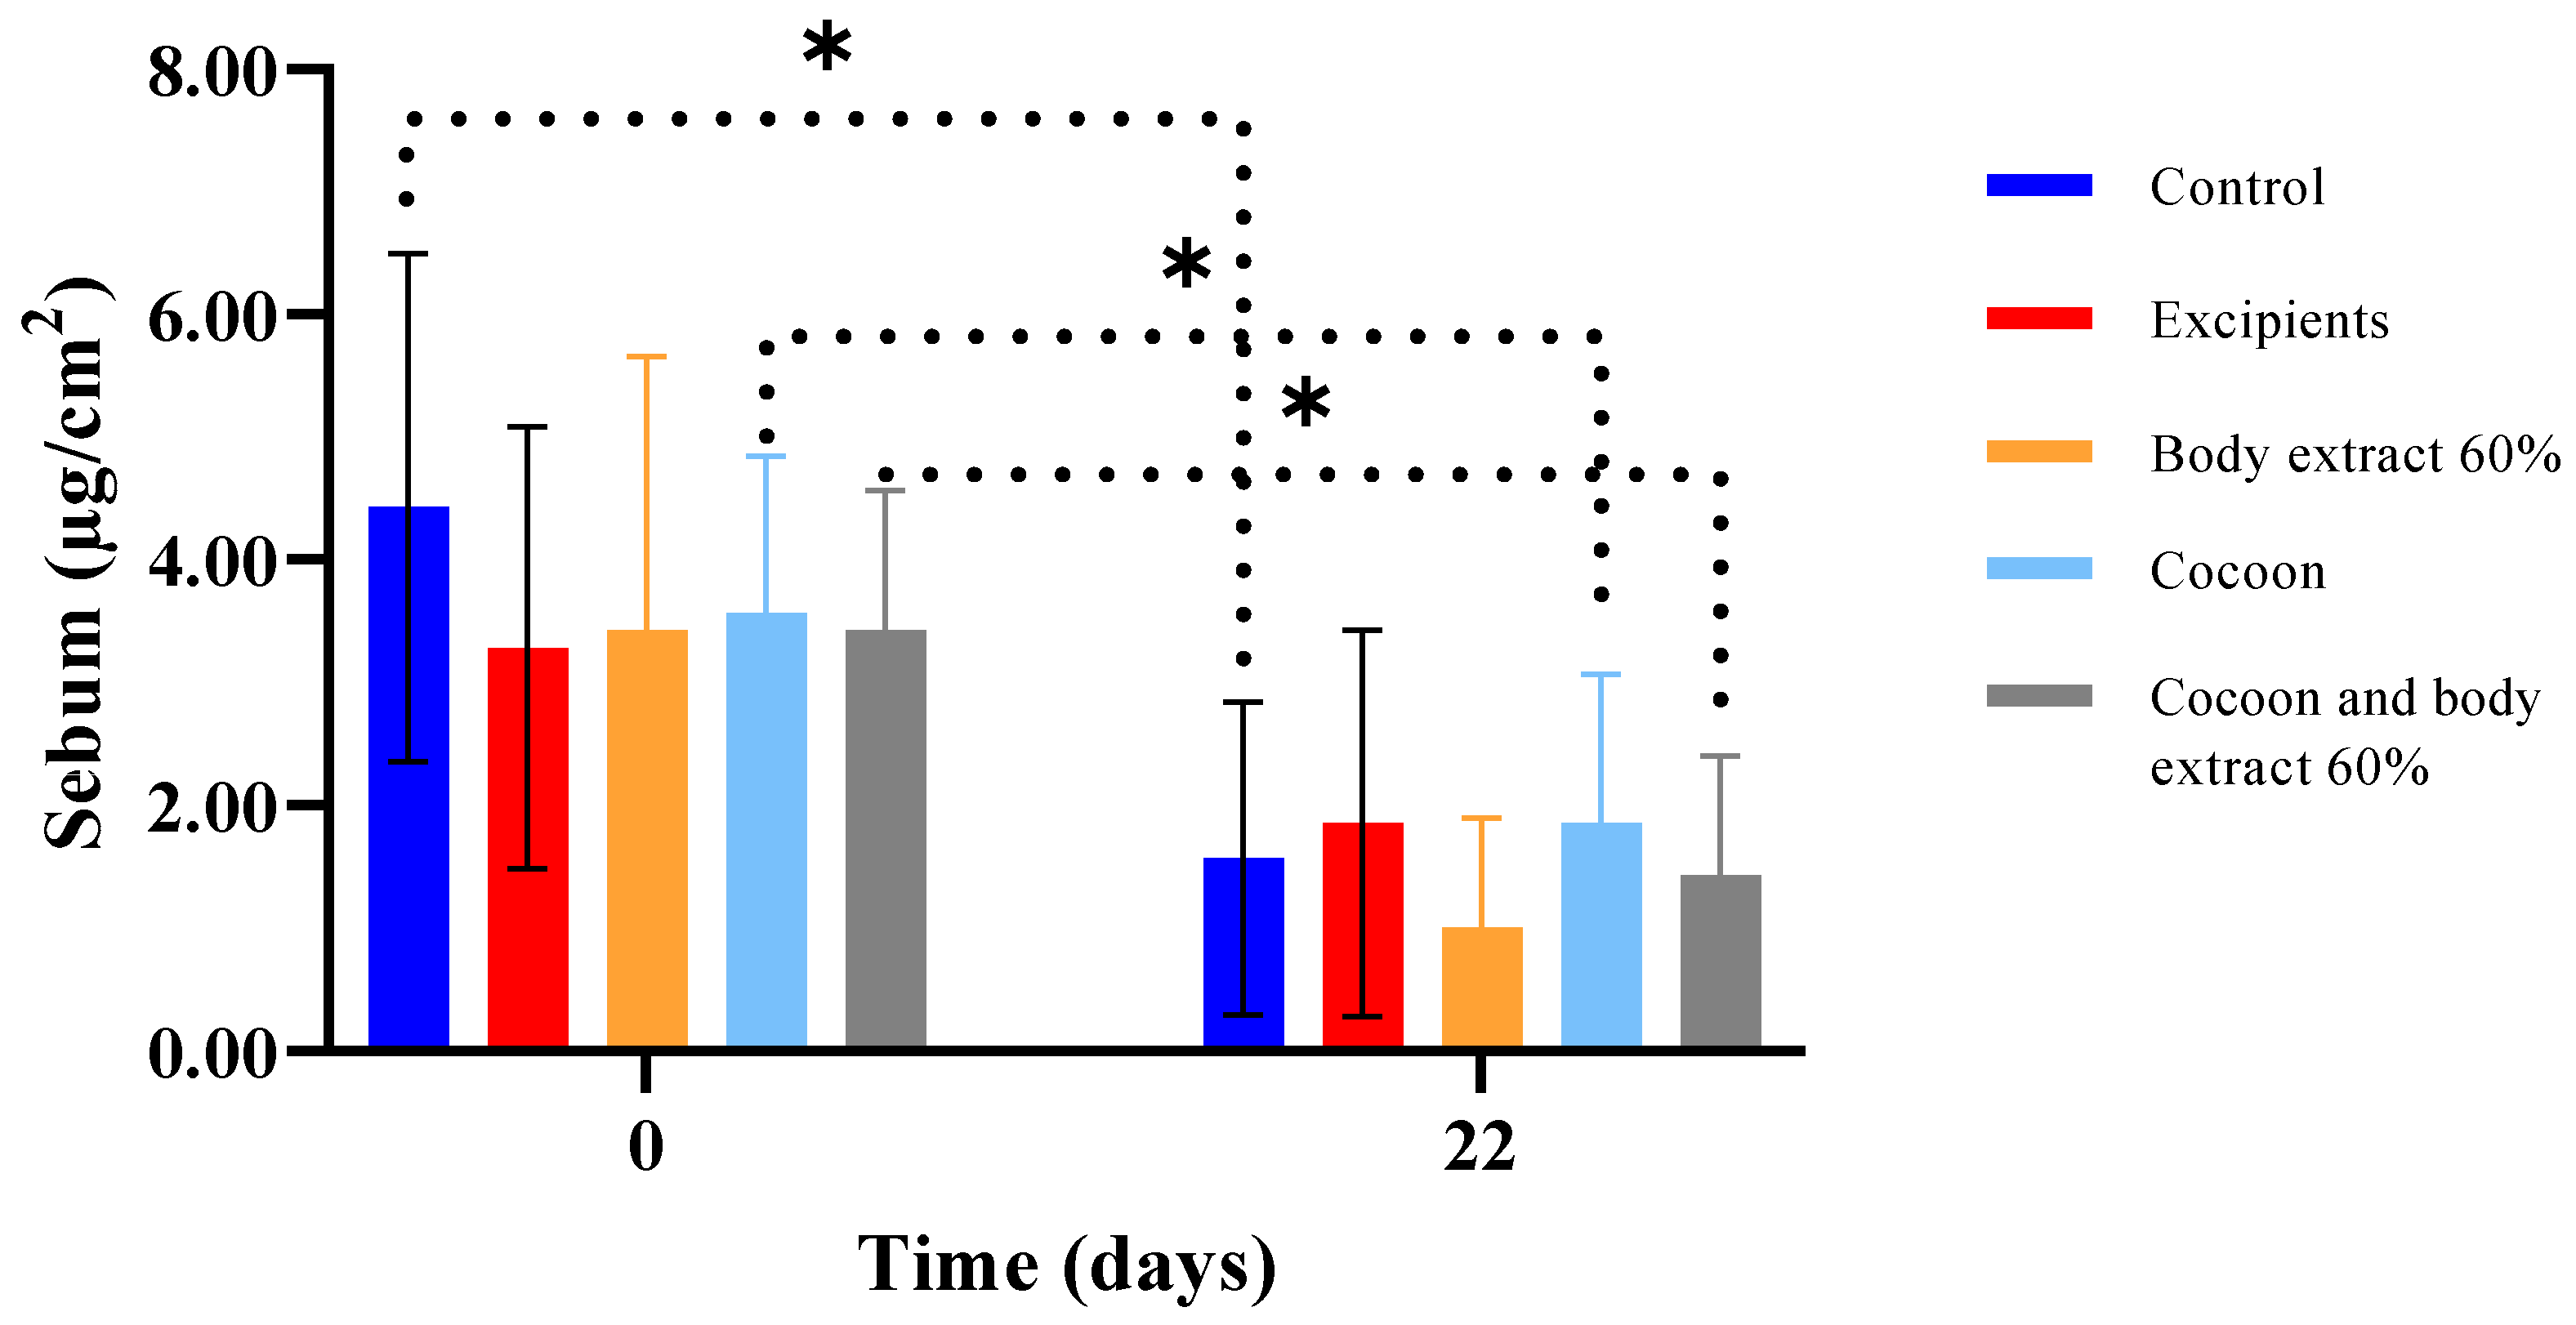
Figure 14.
Sebum measurements over time across different treatment groups in the study part of the experiment (n = 7). The bar graph displays sebum levels (µg/cm2) at Days 0 and 22 for various treatment groups, including control, excipients, silkworm body extract (60% w/w), cocoon, and a combination of cocoon and silkworm body extract (60% w/w). Statistically significant differences are indicated by an asterisk (* p < 0.05). Dotted lines represent significant comparisons between groups and time points. Error bars denote standard deviations, illustrating the variability in sebum levels within each group.
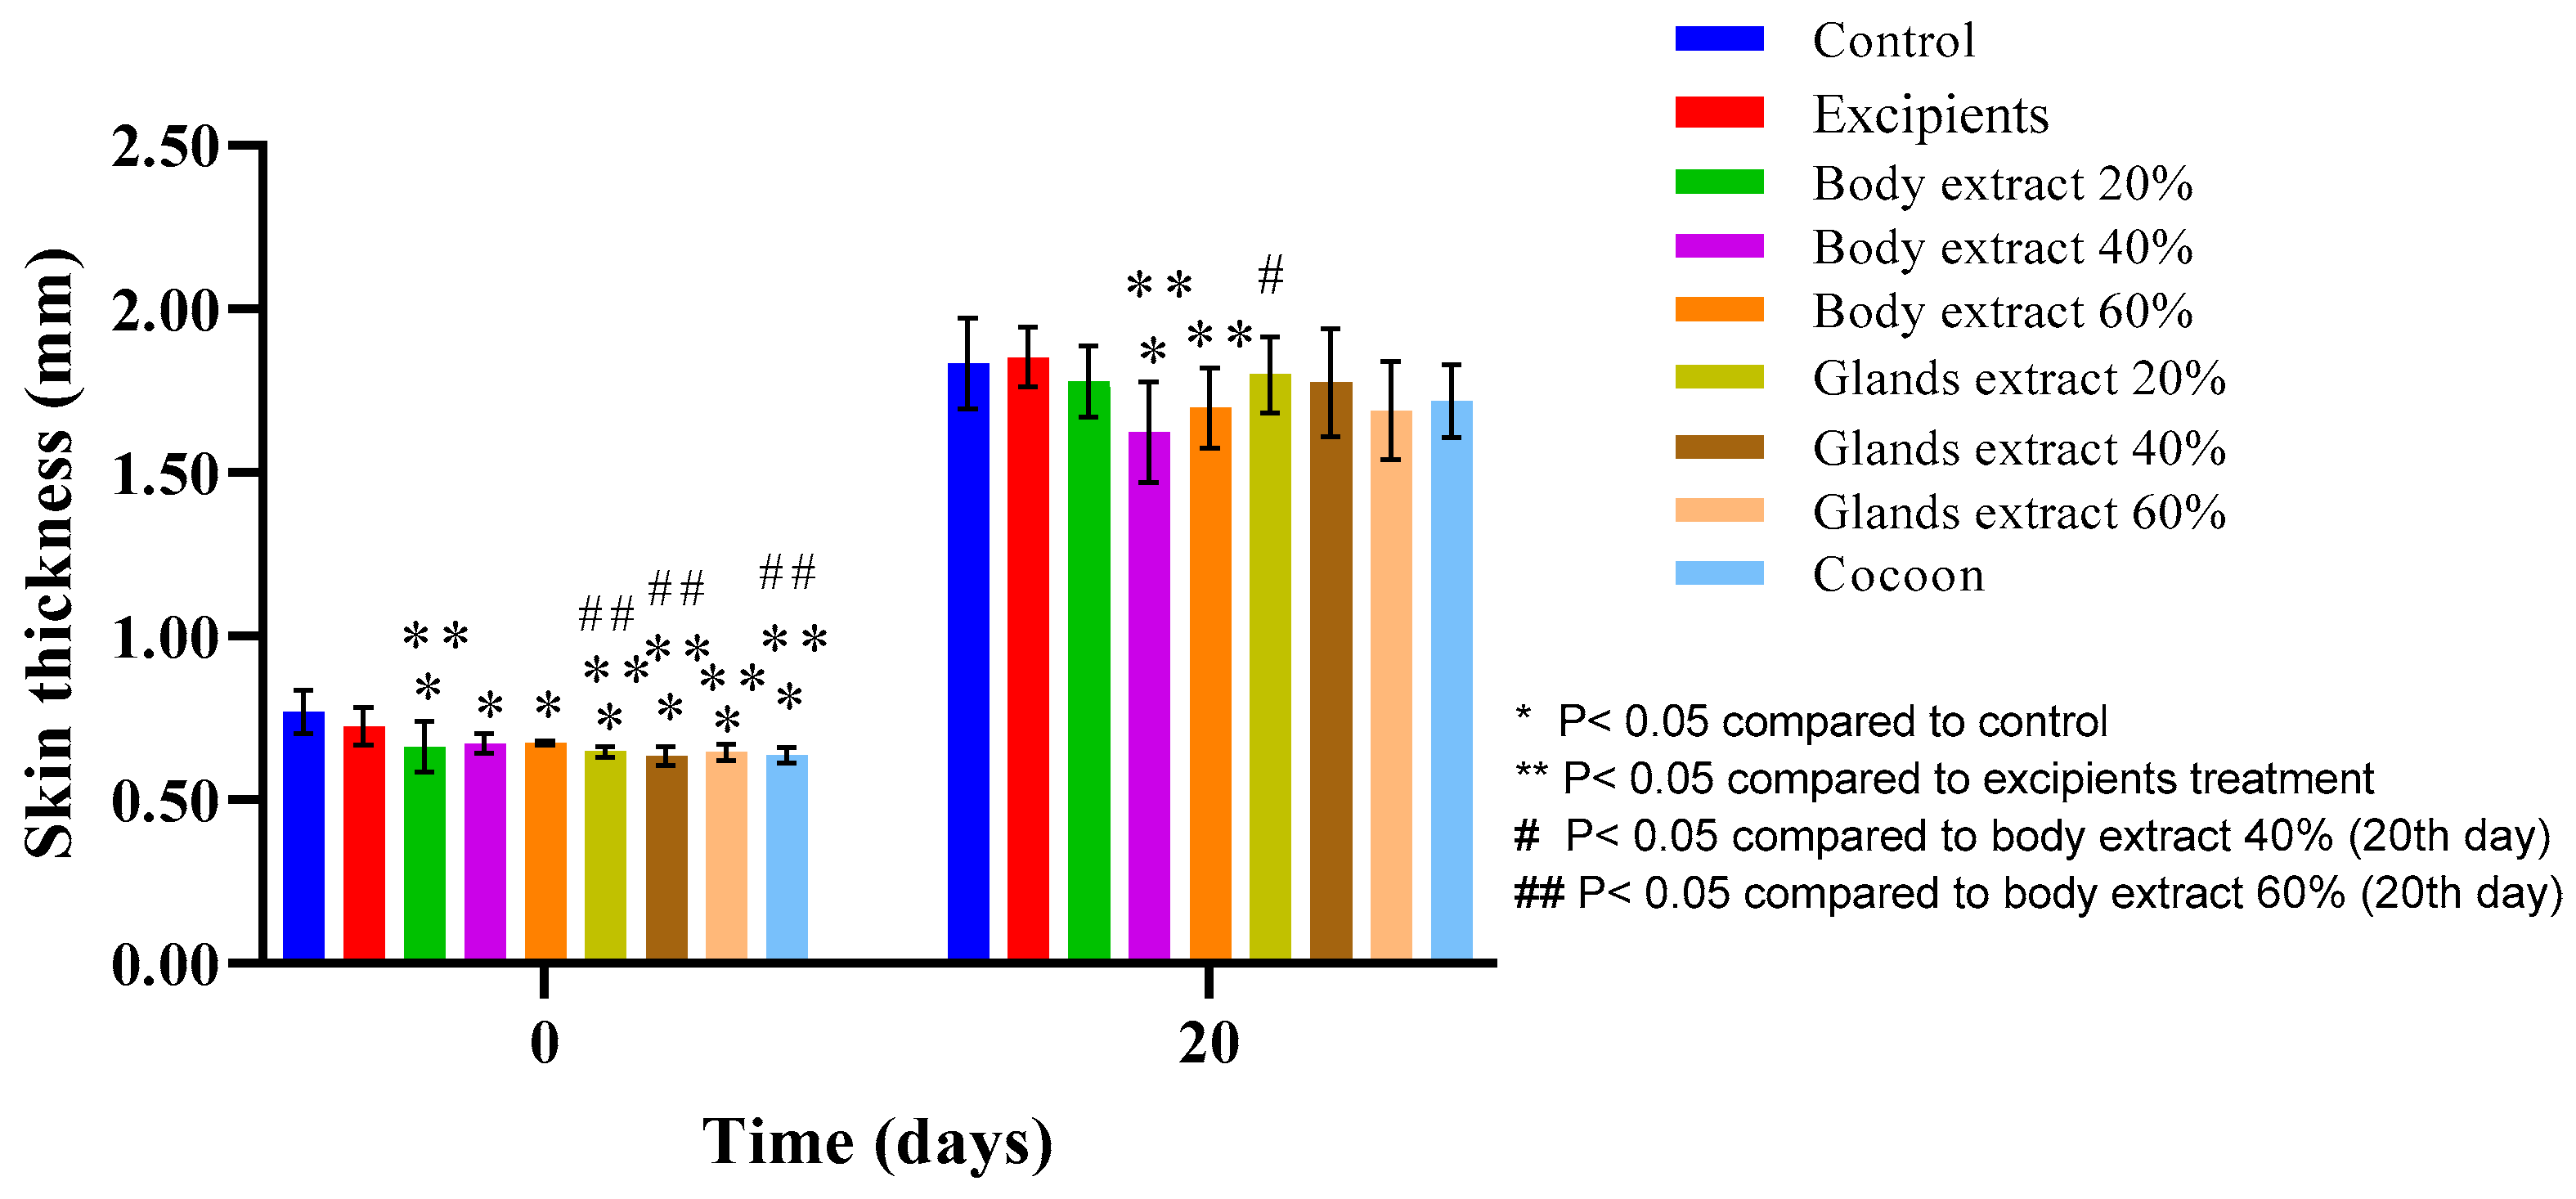
Figure 15.
Skin thickness measurements over time across different treatment groups in the pilot part of the study (n = 5). The bar graph illustrates skin thickness (mm) at Days 0 and 20 for various treatment groups, including control, excipients, silkworm body extracts (20%, 40%, and 60% w/w), silkworm gland extracts (20%, 40%, and 60% w/w), and cocoon. Statistically significant differences are denoted as follows: * p < 0.05 compared with control, ** p < 0.05 compared with excipients, # p < 0.05 compared with body extract 40% (20th day), and ## p < 0.05 compared with body extract 60% (Day 20). The measurements capture variations in skin thickness between groups, with error bars representing standard deviations.
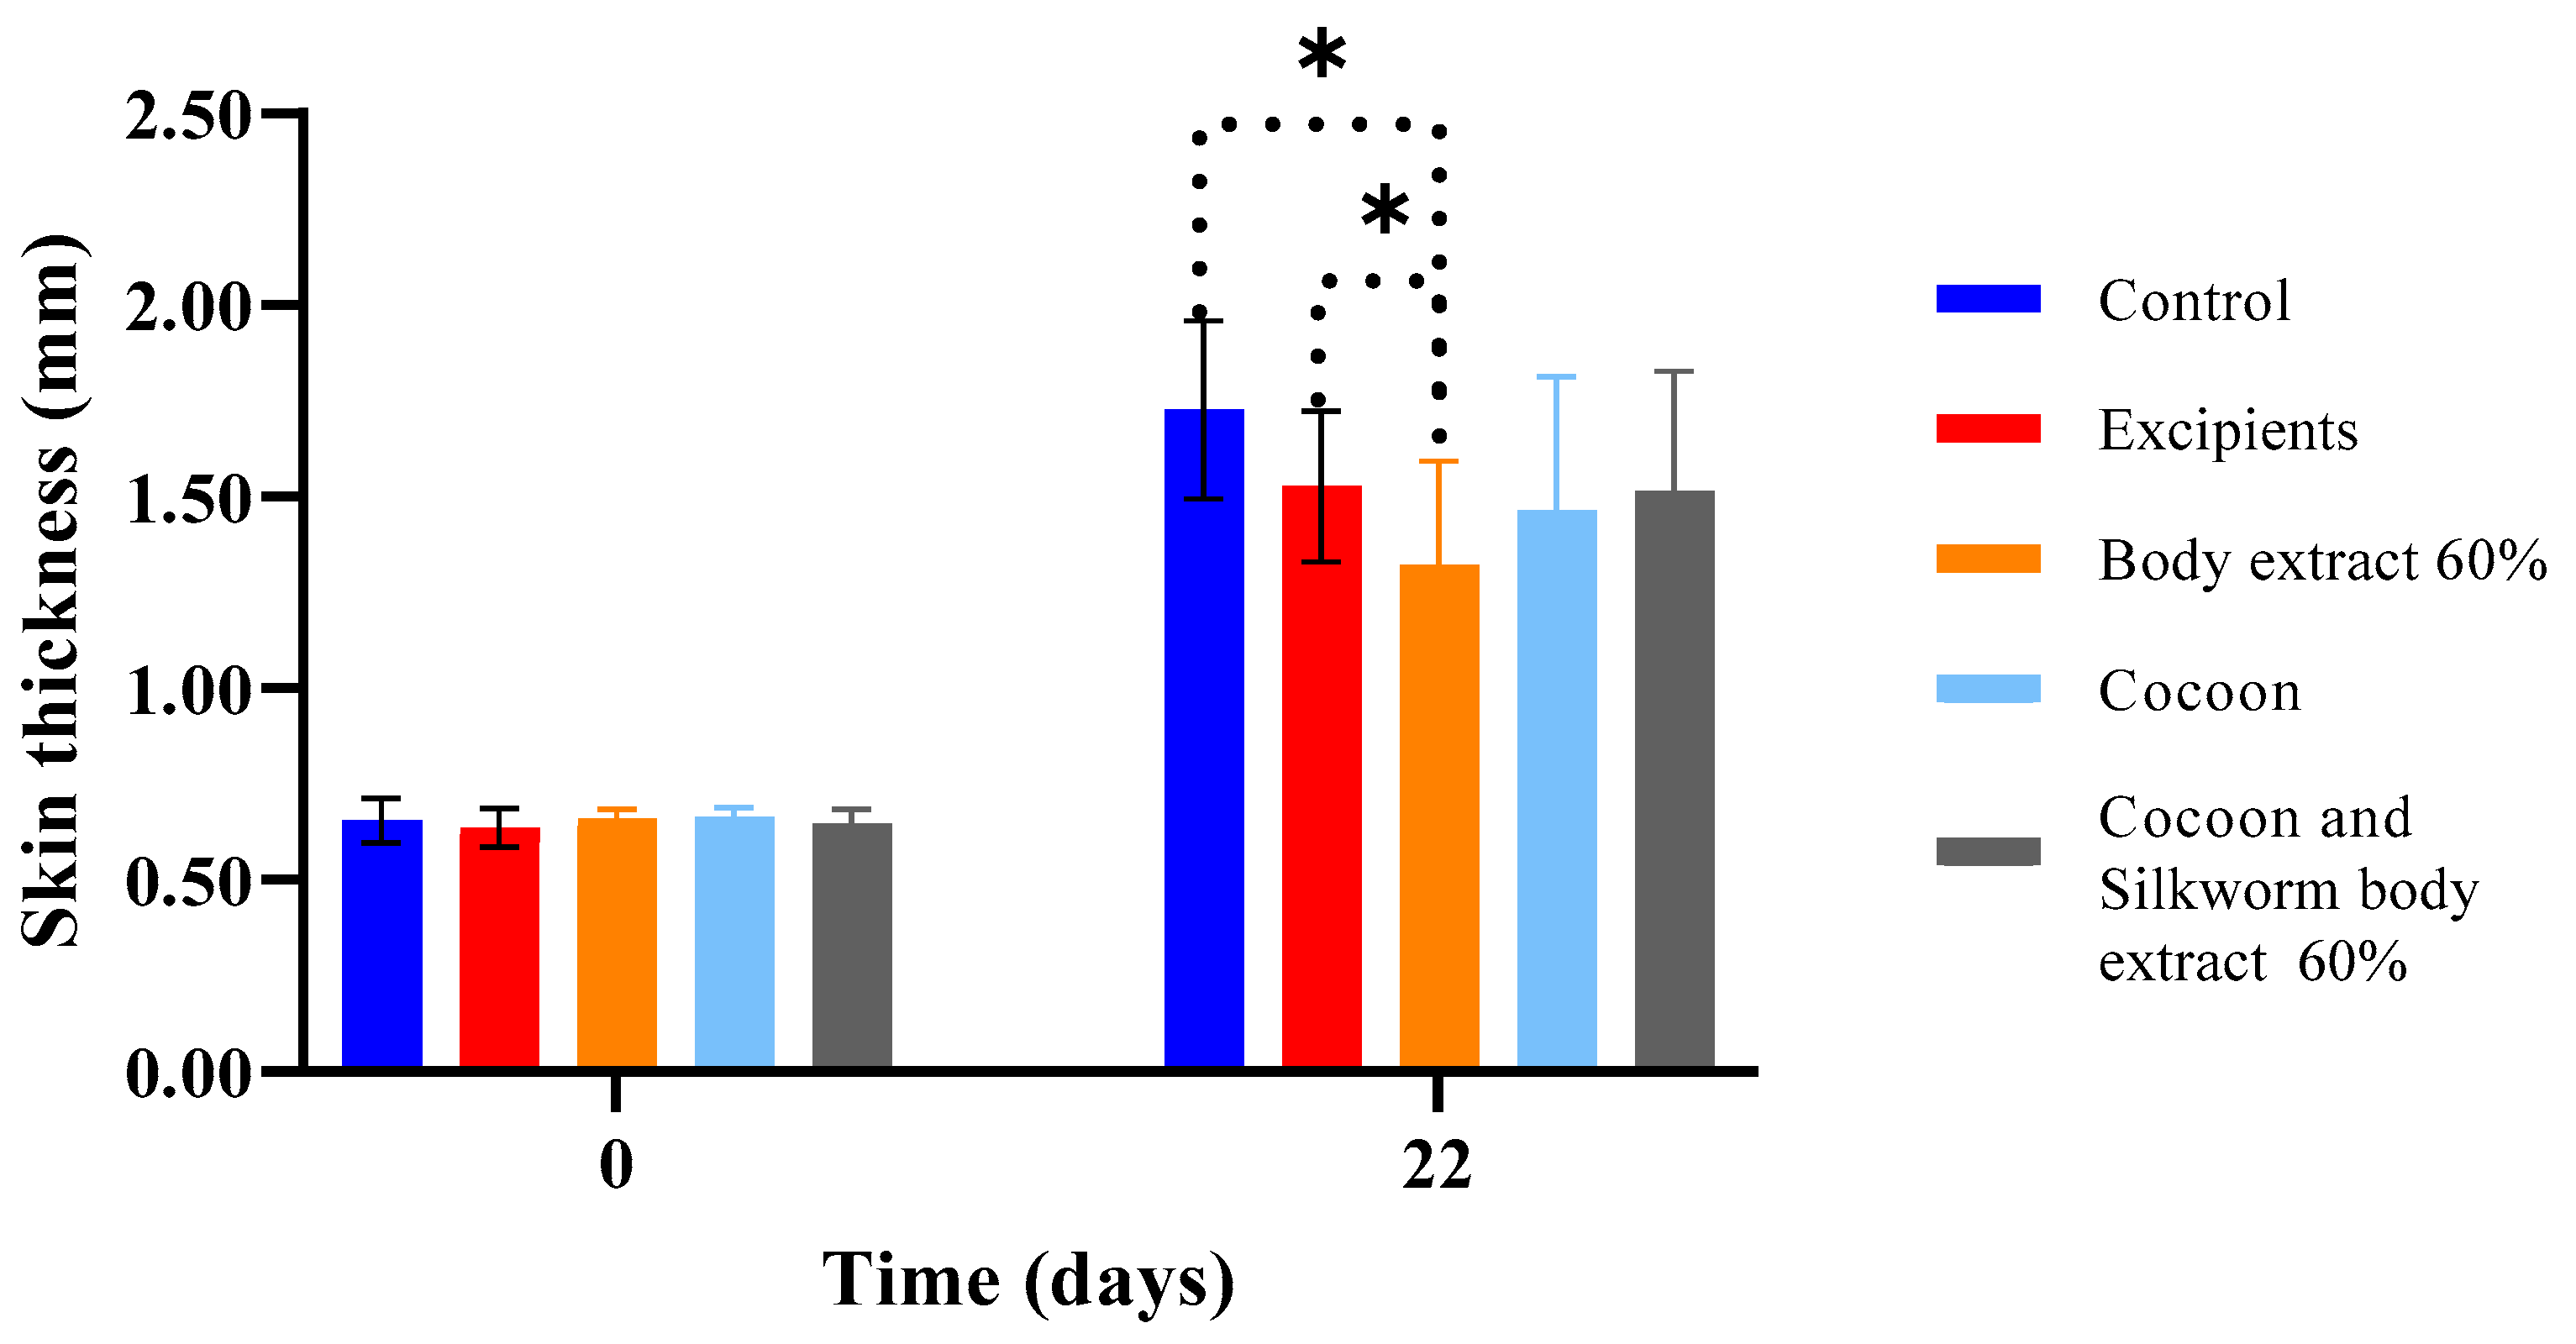
Figure 16.
Skin thickness measurements over time across different treatment groups in the study part of the experiment (n = 7). The bar graph shows skin thickness (mm) at Days 0 and 22 for various treatment groups, including control, excipients, silkworm body extract (60% w/w), cocoon, and a combination of cocoon and silkworm body extract (60% w/w). Statistically significant differences are marked with an asterisk (* p < 0.05), indicating notable comparisons between groups. Error bars represent standard deviations, highlighting variability in skin thickness within each group.
Table 1.
Treatment modalities and formulations for pilot and study parts of the experiment. The table presents the treatment groups and corresponding formulations used in the pilot and study parts of the experiment, with sample sizes of n = 5 for the pilot part and n = 7 for the study part. The treatments include a control (no treatment), an excipients gel, various concentrations of silkworm body and gland extract gels, and cocoon application. In the study part, an additional combination treatment of silkworm body extract (60% w/w) gel with cocoon is included.
| Pilot Part | Second Part |
|---|
| Treatment | Formulation | Treatment | Formulation |
|---|
| Treatment 1 | No treatment | Treatment 10 | No treatment |
| Treatment 2 | Excipients gel | Treatment 11 | Excipients gel |
| Treatment 3 | Gel with silkworm body extract (20% w/w) | Treatment 12 | Gel with silkworm body extract (60% w/w) |
| Treatment 4 | Gel with silkworm body extract (40% w/w) | Treatment 13 | Cocoon |
| Treatment 5 | Gel with silkworm body extract (60% w/w) | Treatment 14 | Gel with silkworm body extract (60% w/w) and cocoon |
| Treatment 6 | Gel with silkworm gland extract (20% w/w) | | |
| Treatment 7 | Gel with silkworm gland extract (40% w/w) | | |
| Treatment 8 | Gel with silkworm gland extract (60% w/w) | | |
| Treatment 9 | Cocoon | | |
Table 2.
Scoring criteria for histopathological evaluation of tissue samples. Each parameter was scored based on the degree or presence of specific histopathological features observed during evaluation. Inflammation, oedema, hyperkeratosis, and wound thickness are rated on a scale from 0 to 3, indicating absence, mild, moderate, or heavy/total involvement, respectively. Ulceration, necrosis, and parakeratosis are evaluated as either absent (0) or present (1).
| Scoring Criteria for Histopathological Evaluation |
|---|
| Inflammation | 0 (absence) | 1 (mild) | 2 (moderate) | 3 (heavy) |
| Oedema | 0 (absence) | 1 (mild) | 2 (moderate) | 3 (heavy) |
| Hyperkeratosis | 0 (absence) | 1 (mild) | 2 (moderate) | 3 (heavy) |
| Wound thickness | 0 (absence) | 1 (superficial) | 2 (moderate) | 3 (total) |
| Ulceration | 0 (absence) | 1 (presence) | |
| Necrosis | 0 (absence) | 1 (presence) |
| Parakeratosis | 0 (absence) | 1 (presence) |
Table 3.
Histopathological assessment scoring for burn wounds in the pilot part of the study. The table summarizes the histopathological scores for burn wounds in various treatment groups from the pilot part of the study. Each treatment was evaluated for inflammation, edema, hyperkeratosis, wound depth, ulceration, necrosis, and parakeratosis, with an overall score representing the extent of tissue damage. The control group showed severe inflammation, edema, and moderate hyperkeratosis, scoring a total of 13 points. In contrast, the cocoon group demonstrated mild inflammation and superficial tissue damage, with a total score of 5 points, indicating the least tissue damage.
| Pilot Part | Inflammation | Oedema | Hyperkeratosis | Wound Depth | Ulceration | Necrosis | Parakeratosis | Score |
|---|
| Control | 3 | 3 | 2 | 3 | 1 | 1 | 0 | 13 |
| Excipients | 3 | 3 | 3 | 3 | 0 | 0 | 0 | 12 |
| Body extract 20% | 2 | 2 | 2 | 3 | 0 | 0 | 0 | 9 |
| Body extract 40% | 2 | 2 | 1 | 3 | 0 | 0 | 0 | 8 |
| Body extract 60% | 2 | 2 | 1 | 3 | 0 | 0 | 0 | 8 |
| Glands extract 20% | 3 | 3 | 3 | 3 | 1 | 1 | 0 | 14 |
| Glands extract 40% | 3 | 3 | 3 | 3 | 1 | 1 | 0 | 14 |
| Grands extract 60% | 3 | 3 | 2 | 3 | 1 | 1 | 0 | 13 |
| Cocoon | 1 | 1 | 2 | 1 | 0 | 0 | 0 | 5 |
Table 4.
Histopathological assessment scoring for burn wounds in the study part of the experiment. The table provides a summary of histopathological scores for burn wounds in various treatment groups from the study part of the experiment. Each group was evaluated based on inflammation, edema, hyperkeratosis, wound depth, ulceration, necrosis, and parakeratosis, with an overall score representing the extent of tissue damage. The control group displayed severe inflammation and moderate edema, scoring a total of 10 points. The excipient group exhibited severe edema and extensive inflammation, with a notable presence of inflammatory exudate and hemorrhagic blistering, resulting in a score of 12 points. The combination of cocoon and body extract showed the least tissue damage with a score of 7 points.
| Second Part | Inflammation | Oedema | Hyperkeratosis | Wound Depth | Ulceration | Necrosis | Parakeratosis | Score |
|---|
| Control | 3 | 2 | 1 | 3 | 1 | 0 | 0 | 10 |
| Excipients | 3 | 3 | 1 | 3 | 1 | 0 | 1 | 12 |
| Body extract 60% | 2 | 2 | 1 | 3 | 0 | 0 | 0 | 8 |
| Cocoon | 2 | 2 | 1 | 3 | 0 | 0 | 0 | 8 |
| Cocoon and body extract 60% | 2 | 2 | 1 | 2 | 0 | 0 | 0 | 7 |


 ,
, 


 ’.
’.


