Article

Deriving Soil Quality Criteria of Chromium Based on Species Sensitivity Distribution Methodology

1
Beijing Key Laboratory of Oil and Gas Pollution Control, China University of Petroleum, Beijing 102249, China
2
Key Laboratory of Pollution Processes and Environmental Criteria (Ministry of Education), College of Environmental Science and Engineering, Nankai University, Tianjin 300071, China
3
School of Chemistry and Environmental Engineering, Wuhan Polytechnic University, Wuhan 430023, China
4
Department of Earth and Atmospheric Sciences, University of Alberta, Edmonton, AB T6G 2E3, Canada
*
Author to whom correspondence should be addressed.
Toxics 2021, 9(3), 58; https://doi.org/10.3390/toxics9030058
Submission received: 8 February 2021 / Revised: 25 February 2021 / Accepted: 26 February 2021 / Published: 16 March 2021

Abstract

:
Chromium (Cr) is one of the most severe heavy metal contaminants in soil, and it seriously threatens ecosystems and human health through the food chain. It is fundamental to collect toxicity data of Cr before developing soil quality criteria/standards in order to efficiently prevent health risks. In this work, the short-term toxic effects of Cr(VI) and Cr(III) on the root growth of eleven terrestrial plants were investigated. The corresponding fifth percentile hazardous concentrations (HC5) by the best fitting species sensitivity distribution (SSD) curves based on the tenth percentile effect concentrations (EC10) were determined to be 0.60 and 4.51 mg/kg for Cr (VI) and Cr (III), respectively. Compared to the screening level values worldwide, the HC5 values in this study were higher for Cr(VI) and lower for Cr(III) to some extent. The results provide useful toxicity data for deriving national or local soil quality criteria for trivalent and hexavalent Cr.

1. Introduction

Chromium (Cr) is one of the most common heavy metal contaminants in soil, sediments, and groundwater. It occurs in several oxidation states ranging from Cr2− to Cr6+, with trivalent (Cr3+) and hexavalent (Cr6+) states being the most common and stable in terrestrial environments. Both oxidation states are excessively released into the environment due to a variety of industrial applications and anthropogenic activities, such as mining, metallurgy, tanneries, pigment-producing plants, fossil fuel combustion, and chemical fertilizers [1,2,3,4,5,6,7,8]. Chromium can be either beneficial or toxic to plants, animals and humans, depending on its oxidation state and concentrations. At low concentrations, Cr(III) is considered to be an essential component in the metabolism of plants, e.g., the synthesis of amino and nucleic acids [3,9]. For example, Yu and Gu (2007) indicated that 2–5 mg/L Cr(III) increased the transpiration rate and chlorophyll contents of hybrid willow [10]. However, Cr(III) at increased concentrations may prohibit metabolic processes and metalloenzyme systems in living organisms [10,11,12,13]. For example, do Nascimento et al. (2018) reported that 200 mg/kg of Cr(III) in soil increased the expression of psbA and psbO genes, which were responsible for electron transfer and oxygen evolution and directly influenced the photosynthesis and growth of young cocoa plants [12]. Compared to Cr(III), Cr(VI) compounds have higher solubility and oxidizing potential, and are known as extremely toxic carcinogens that may cause death to animals and humans [11]. Hexavalent Cr complexes can easily cross cellular membranes by means of sulfate ionic channels, and undergo immediate reduction reactions leading to the formation of reactive intermediates, which are harmful to cell organelles, proteins and nucleic acids [13,14,15].
Heavy metal pollutants, such as Cr, have been paid considerable attention because of their toxicity, persistence and biological accumulation, which can generate a serious threat to ecosystems and human health through the food chain. Soil quality criteria are derived based on an upper-limit concentration that shows no undesirable or harmful effects [16,17,18]. It is generally considered that contamination below the soil quality criteria in soil or sediments leads to tolerable or minimal human health and ecological risks in the long-term [16,18,19]. However, countries in the world generally derived the screening level values without distinguishing the chemical valence and fractionation of contaminants. It is not enough for predicting the toxicity of pollutants such as As, Cr, Se and V since these trace metals have different valences with different Eh and pH, and can exist as either cations or anions in the soil environment [4,20,21]. It is obvious that metals existing as cationic species have a greater propensity to associate with the solid and are less bioavailable, while anionic metals enter into the pore-water easily and are more soluble [22].
The species sensitivity distribution (SSD) method is widely used in ecological risk assessment and the development of soil quality criteria. The SSD analysis is based on the statistically cumulative probability distribution of toxicity data for multiple species [23,24]. One function of SSD analysis is to calculate the concentration of a contaminant at which a specified proportion of species will be affected, referred to as the hazardous concentration (HC) for p% of species (HCp) [25]. For example, HC5 means a point estimation of the hazardous concentration for 5% of species or the 95% protection level [26,27]. The SSD is dependent upon available datasets and can differ in the type of distribution, taxonomic diversity, and sample size.
Vegetables and wheats are an essential part of a healthy and balanced ecosystem, and their phytotoxicity tests are required for risk assessment and environmental monitoring. Phytotoxicity tests include the effects of a contaminant on seed germination, seedling (shoot and root) development, biomass production or other physiological functions [28,29]. It was previously reported that root biomass was the most sensitive tissue to Cr, and Cr predominantly accumulated in plant root tissue, with very limited translocation to the shoot [21,28]. Wong and Bradshaw (1982) indicated that the root growth of Lolium Perenne can be ceased due to metal pollution (e.g., Cu, Ni, Mn, Pb, Cd and Cr) [30]. As a result, root growth may be the most rapid and sensitive response to Cr contamination in soil since the root is the first and most direct plant tissue to contact Cr contamination [30]. The aim of this work was: (1) to enrich the database of Cr toxicity and determine the effect of Cr(VI) and Cr(III) on a variety of widely cultured vegetables and crops; (2) to derive the soil quality criteria value of Cr(VI) and Cr(III) based on the SSD method; and (3) to compare the criteria values with other countries worldwide and provide a scientific base for the development of soil quality standards.

2. Materials and Methods

2.1. Soils and Chemicals

The soil sample was collected from Jixian, Tianjin city, without prehistory of Cr contamination. This region was originally developed from the parental material basalt (Alfisol). In the laboratory, samples were air-dried, sieved through a 5-mm mesh, homogenized using a scoop, and then stored in a glass bottle until their use. Basic soil properties were characterized using standard methods [31] and are shown in Table 1.
Analytical grade CrCl3·6H2O and K2Cr2O7 (>99% purity) were used as Cr(III) and Cr(VI) sources.

2.2. Short-Term Toxicity Tests

Chromium toxicity tests were performed for 11 different crops, including: pakchoi cabbage (Brassica rapa chinensis), tomato (Solanum lycopersicum), wheat (Triticum aestivum L.), chili (Capsicum annuum L.), eggplant (Solanum melongena L.), celery (Apium graveolens L.), chive (Allium schoenoprasum L.), lettuce (Lactuca sativa L.), cucumber (Cucumis sativus L.), radish (Raphanus sativus L.), and spinach (Spinacia oleracea L.). Among these plants, pakchoi cabbage, lettuce, spinach and chive are leafy vegetables, tomato, chili and eggplant are solanaceous vegetables, celery is a stem vegetable, and cucumber is a gourd vegetable. All plant seeds were purchased from the Chinese Academy of Agricultural Sciences (located in Tianjin city). Before planting, the plant seeds were pre-treated by sterilizing in 3% H2O2 for 20 min to prevent fungal contamination, washing with sterilized deionized water several times, and then drying softly with tissue (KIMTECH-Clark).
The initial concentrations of Cr(III) and Cr(VI) for test plants are presented in Table 2. The initial concentrations of Cr(III) and Cr(VI) were in accordance with current situations and levels of soil contamination [5,6], and fell into the range to ensure 65% of germination rate for the test plant according to a pilot experiment. About 50 g of soil was weighed and transferred into a culture dish (diameter: 90 mm). Each treatment was performed in triplicate to minimize experimental errors. Each culture dish was planted with 15 sterilized seeds and cultured in an incubator (LRH-250-Gb, made in Guangdong, China). The plants were illuminated with a light/dark cycle of approximately 15/9 h and the temperature was kept around 25 ± 1 °C. All culture dishes were watered and adjusted to 60% of maximal holding capacity with distilled water. Soil without Cr supply was used as a control treatment. When the length of plant roots in the control reached 20 mm and germination rate >65% for each species, the Cr exposure experiment was finished. For each seed, the elongation of both root and seedling exceeding 3 mm was considered to be a successful germination. Generally, the plants need around 2 weeks to meet the standard of successful germination before harvesting. The plants were then removed and rinsed with distilled water. The root elongation of all treatments was measured and calculated. Root architectural traits were analyzed using the software WinRHIZO (WinRHIZO PRP2012, Regents Instruments Inc., Quebec, QC, Canada).

2.3. Species Sensitivity Distribution (SSD)

Species sensitivity distribution (SSD) curves were constructed based on short-term toxicity data for 11 terrestrial species. The resulting data were ranked, and the rank percentiles were determined for each data point. Data points with the same concentration were recommended to be assigned separate, sequential ranks, rather than calculating tied ranks [32]. Rank percentiles were calculated using the following equation:
j = i ( n + 1 ) × 100
where j = rank percentile; i = rank of the data point in the data set; n = total number of data points in the data set.
Toxicity data such as EC10, NOEC (no observed effect concentration), LOEC (lowest observed effect concentration) or MATC (maximum acceptable toxic concentration) were required and fitted to SSD curves. In this study, we determined the SSD curves by both the Slogistic and the Exponential model using software of Origin8.6. The distribution model was fitted to toxicity data points and evaluated with the adjusted coefficient of determination R2; the higher the R2, the better the goodness of fit.

2.4. Statistic Analysis and Data Integration

All statistical analyses were performed by SPSS20.0. Graphs were prepared using Origin8.6. The treatment means were compared using Duncan’s multiple range test (DMRT) and taking p < 0.05 as significant. EC values and their confidence intervals were calculated by a log concentration-logit effect regression model, as described previously [33].

3. Results

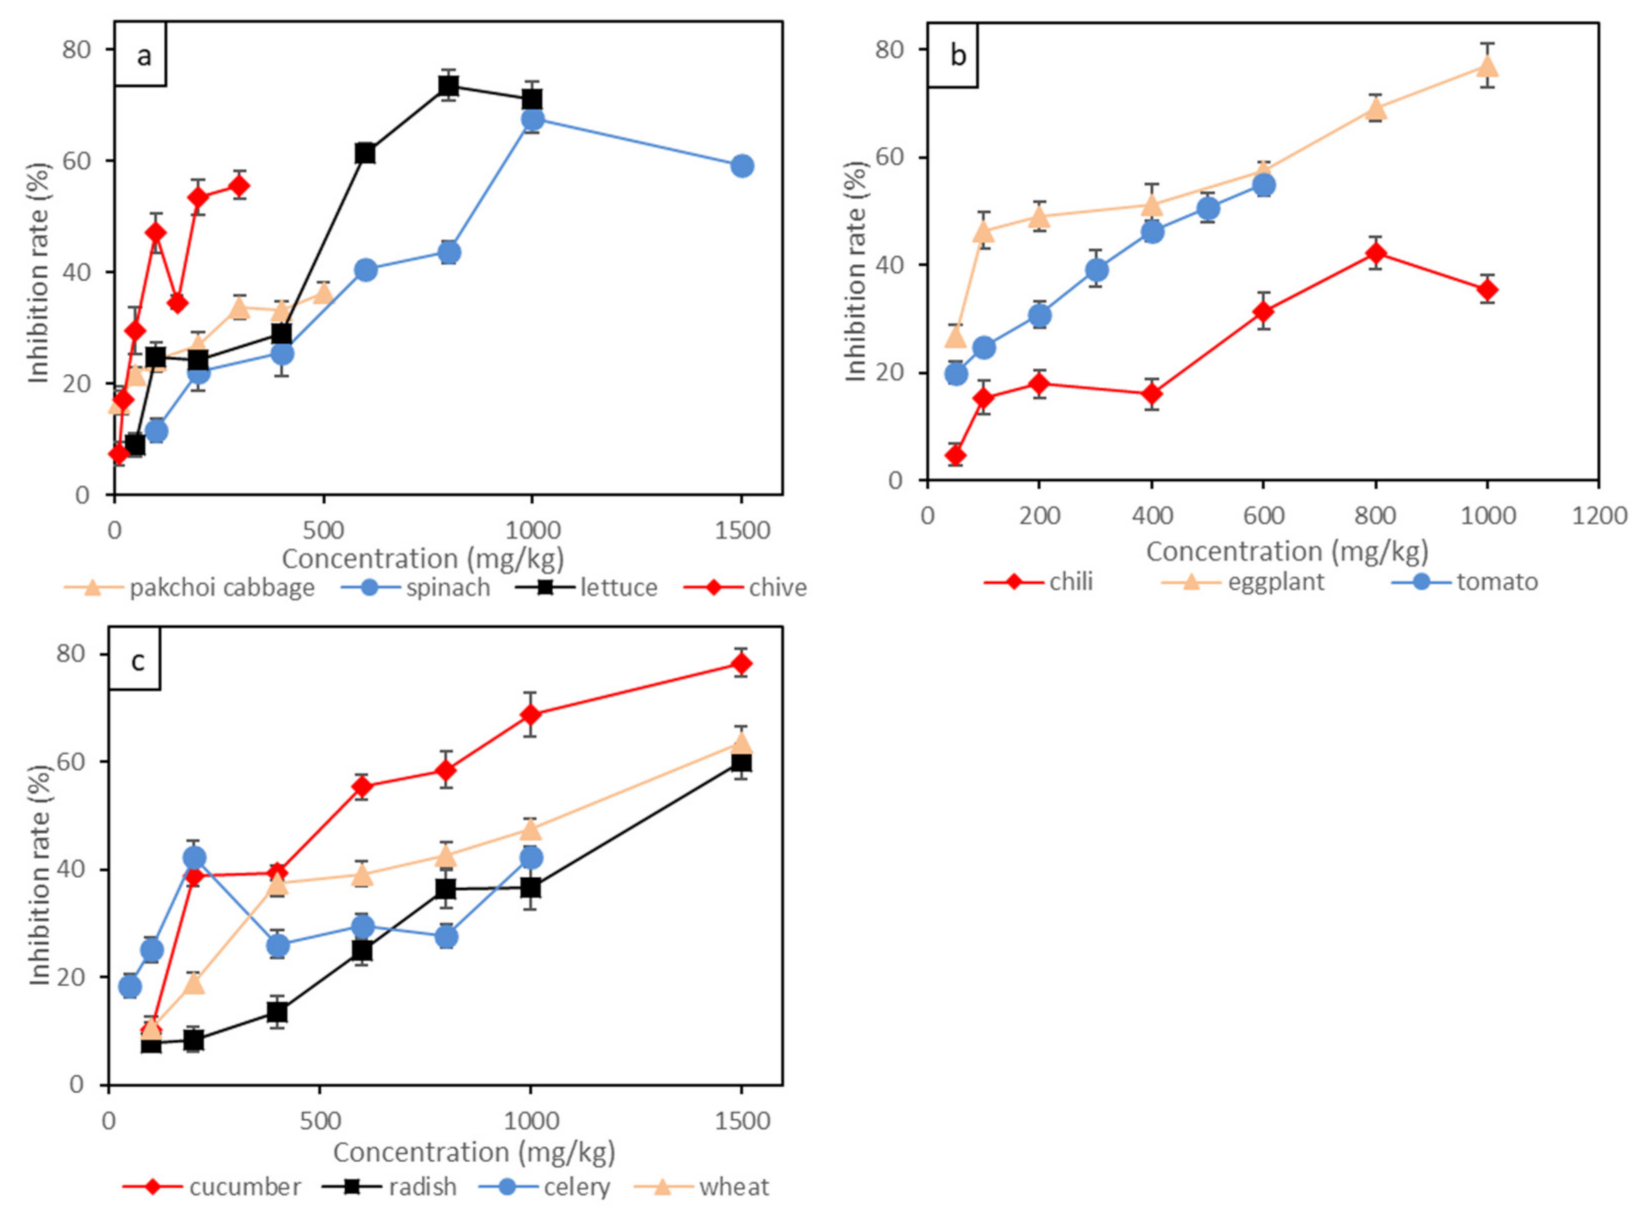
3.1. Species Sensitivity to Short-Term Toxicity of Cr

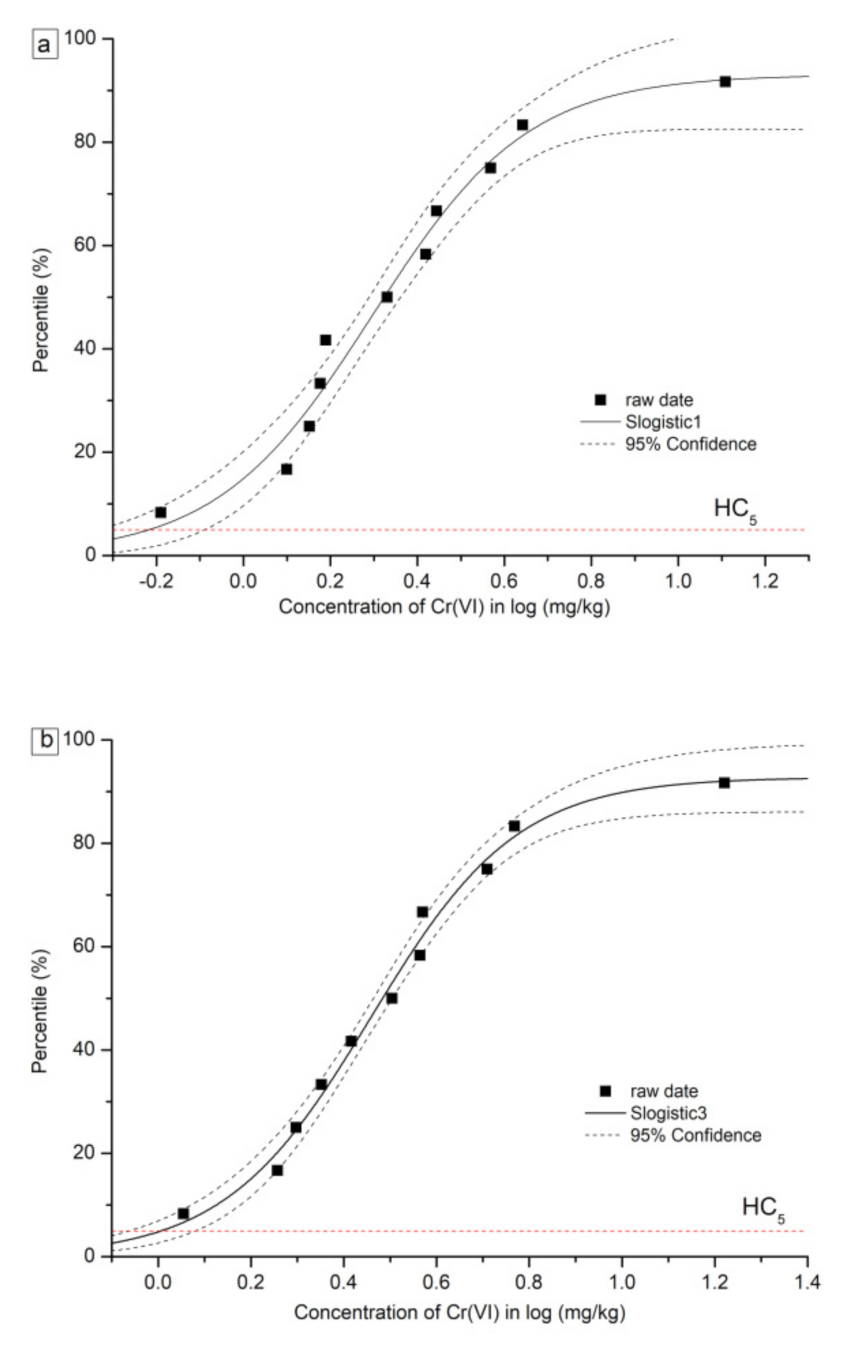
3.1.1. Short-Term Toxicity Tests of Cr(VI)

Short-term toxicity tests of Cr(VI) to eleven terrestrial plants indicated by root growth inhibition are shown in Figure 1 and Table 3. Different plants displayed variable toxic responses to Cr(VI). The leafy vegetables, such as pakchoi cabbage, lettuce and chive, were the most sensitive species to Cr(VI), and the root inhibition rates were positively correlated with the concentration of Cr(VI). Specifically, the root inhibition rate of pakchoi cabbage reached as high as 30% under 2 mg/kg of Cr(VI) treatment, and the root inhibition rate exceeded 50% under 6 mg/kg of Cr(VI) treatment. The EC10 and EC20 for pakchoi cabbage were lower than 0.65 mg/kg and 1.13 mg/kg, respectively. For spinach, 10 mg/kg of Cr(VI) led to around 60% root inhibition rate, then the inhibition rate fluctuated when the concentration of Cr(VI) increased further. Wheat had relatively lower sensitivity to Cr(VI) compared to leafy vegetables, and the EC10 and EC20 for wheat were 1.50 mg/kg and 2.25 mg/kg, respectively. By contrast, the solanaceous vegetables, such as chili, tomato and eggplant, showed less sensitivity to Cr(VI), and the root inhibition rate was linearly correlated to Cr(VI) concentration. For example, the Cr(VI) concentration which resulted in a 30% root inhibition rate was lower than 5 mg/kg for all three solanaceous vegetables, and the Cr(VI) concentration which led to a 50% root inhibition rate was around 10 mg/kg. The EC10 and EC20 for solanaceous vegetables ranged around 1.55–2.78 mg/kg and 2.61–3.71 mg/kg, respectively. Stem vegetables (celery) and gourd vegetables (cucumber) showed the least sensitivity to Cr(VI). The root inhibition rate for celery was not obvious at Cr(VI) concentrations lower than 10 mg/kg. Intrudingly, 10 mg/kg of Cr(VI) supply seemed to enhance the growth of cucumber root. The EC10 and EC20 for cucumber even exceeded 12.83 mg/kg and 16.62 mg/kg, respectively. The effect of Cr(VI) on the root growth of the above plants generally followed the order of pakchoi cabbage > lettuce > chive > wheat > tomato > radish > chili > eggplant > spinach > celery > cucumber. Leafy vegetables (e.g., pakchoi cabbage, lettuce and chive) might be the primary affected plants under Cr(VI) contamination, while the root growth of stem vegetables (celery) and gourd vegetables (cucumber) might be insensitive to Cr(VI) contamination.

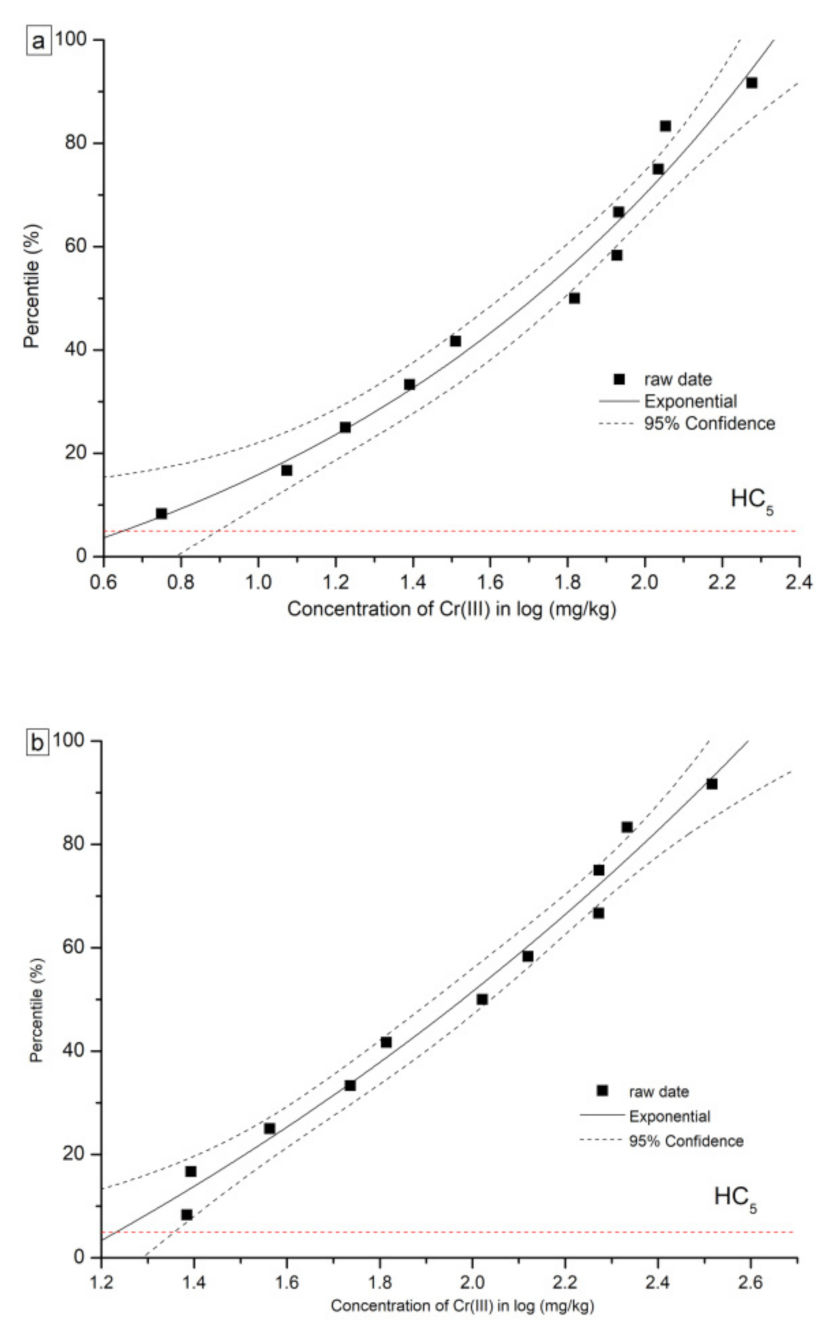
3.1.2. Short-Term Toxicity Tests of Cr(III)

As indicated by our experimental results, the root inhibition rate was positively correlated to Cr(III) concentration, as shown in Figure 2 and Table 4. Pakchoi cabbage and chive showed the most significant responses to Cr(III) toxins, and 50 mg/kg of Cr(III) led to more than 20% root inhibition. A total of 300 mg/kg of Cr(III) led to more than 50% root inhibition for chive and 35% root inhibition for pakchoi cabbage. The EC10 and EC20 for pakchoi cabbage and chive ranged around 5.62–11.84 mg/kg and 24.21–36.56 mg/kg, respectively. By contrast, solanaceous vegetables were less sensitive to Cr(III) compared to other studied species. For example, eggplant was only sensitive to Cr(III) at concentrations lower than 100 mg/kg, and the root growth was less affected above 100 mg/kg of Cr(III). The EC10 and EC20 for eggplant were 16.78 mg/kg and 24.71 mg/kg, respectively. The root inhibition rate of tomato was linearly correlated to Cr(III) concentration, with 200 mg/kg of Cr(III) leading to 30% root inhibition and 500 mg/kg of Cr(III) leading to 50% root inhibition. Among the vegetables studied, the root growth of the gourd vegetable (cucumber) and the root vegetable (radish) showed the least sensitivity to Cr(III). For example, 500 mg/kg of Cr(III) supply led to less than 50% root growing inhibition for cucumber, and 500 mg/kg of Cr(III) supply only led to less than 30% root inhibition for radish. The EC10 and EC20 for radish were 189.10 mg/kg and 328.60 mg/kg, respectively. It is interesting that Cr(III) posed an insignificant impact on the growth of leafy vegetables such as spinach, with 500 mg/kg of Cr(III) supply leading to less than 30% root inhibition, and the EC10 and EC20 were as high as 113.10 mg/kg and 187.20 mg/kg, respectively. Wheat was also insensitive to Cr(III), with 1000 mg/kg of Cr(III) supply leading to less than 50% root inhibition. The effect of Cr(VI) on the root growth of the above plants generally followed the order of pakchoi cabbage > chive > eggplant > celery > tomato > lettuce > chili > cucumber > wheat > spinach> radish. The root growth of leafy vegetables (e.g., pakchoi cabbage and chive) was easily affected by Cr(III) contamination, while root vegetables (e.g., radish) endured high concentrations of Cr(III) contamination.

3.2. Ecological Risk Assessment Based on Species Sensitivity Distributions (SSD)

The details of formulas and parameters for SSD curves based on the Slogistic and the Exponential model are shown in Table 5. The fitted SSD curves for Cr(VI) and Cr(III) are shown in Figure 3 and Figure 4, respectively. For Cr(VI) and Cr(III), two types of SSD curves were fitted: SSD-EC10 and SSD-EC20. From each SSD-ECx curve, HC5 and HC10 were numerically derived. The HC5 values based on the EC10 of the eleven plants were 0.60 mg/kg and 4.51 mg/kg for Cr(VI) and Cr(III), respectively. Furthermore, the HC10 values based on the eleven plants were 0.83 mg/kg and 16.98 mg/kg for Cr(VI) and Cr(III), respectively. The HC values for Cr(VI) were far less than Cr(III), indicating the higher toxicity of Cr(VI) to tested plants than Cr(III).

4. Discussion

Irrespective of Cr valence, the root growth of leafy vegetables, such as pakchoi cabbage and chive, was easily affected by Cr contamination. By contrast, the root growth of stem vegetables (e.g., celery) and root vegetables (e.g., radish) was less affected by Cr contamination. Cr contaminants generally damaged the root architecture of plants by limiting water and nutrient uptake efficiency [34], and induced a negative impact on the functioning of leaf photosynthetic machinery by reducing Fe and Mg uptake, which are essential for chlorophyll biosynthesis [35,36]. Photosynthesis was the physiological foundation for crop growth and was considered to be one of the most stress-sensitive processes [37]. Furthermore, Cr was found to be stable in roots and poorly translocated from roots to upper tissues. It is reported that the maximum amount of Cr is accumulated in the roots, followed by leaves and then fruits [38]. For radish, the root is the edible part and might accumulate a large amount of Cr by growing under highly Cr-contaminated soil, which will result in a health risk though the food chain.
With respect to the Cr valence, the plant root growth was preferably impacted by Cr(VI) than Cr(III), since Cr(VI) produced lower EC10 and EC20 than Cr(III) did (Table 3 and Table 4). Accordingly, the HC5 value derived from EC10 for Cr(VI) was 0.60 mg/kg, which was lower than that for Cr(III) (4.51 mg/kg), demonstrating that hexavalent Cr compounds were more hazardous than trivalent Cr compounds. It was reported that the uptake mechanisms of Cr(III) and Cr(VI) were quite different, Cr(VI) was immediately converted to Cr(III) in roots by Fe(III)-reductase enzymes [11,39,40], and plant tissues endured higher Cr(III) than Cr(VI) [13,40]. Thus, the total Cr contents in soil do not necessarily reflect the biogeochemical behavior of Cr since the biogeochemical behavior of Cr differs with chemical speciation [21].
Cr speciation and its bio-organism transfer were governed by soil physico-chemical properties and microbial activity. From the southeast coast to northwest inland in China, the major soil types cover red soil, brown soil and cinnamon soil, which are quite different in terms of pH, redox conditions, cation exchange capacity, biological and microbial conditions and co-existing competing cations. These soil types will differ significantly in Cr dynamic reactions and behaviors, including hydrolysis, oxidation, reduction and precipitation [20,21], which lead to various Cr speciation and distribution. Shahid et al. (2017) indicated that toxic Cr(VI) might transform to less toxic Cr(III) in the presence of dissolved organic carbon originating from the solubilization of soil organic matter [21]. As a result, organic carbon can reduce Cr bioavailability and detoxify its negative effect on plant growth [40]. It is reported that the soil microbial community played a key role in governing Cr speciation [41], and Cr(VI) was able to interact with microorganisms via enzymatic biosorption, reduction and bioaccumulation [42]. The rate and extent of microbial-mediated Cr(VI) reduction greatly varied with bacterial strain, Cr concentration, as well as soil physio-chemical properties and co-existing contaminants [21,43]. As a result, soil screening values should be directly related to soil properties and conditions.
However, the Soil Environmental Quality Standards of China set the screening level values of Cr as 300 mg/kg for paddy fields and 200 mg/kg for dry land in the pH range of 6.5–7.5. These values are comparable to the values for the total Cr of Australia, the Netherlands and Thailand. A total of 200–300 mg/kg of Cr(III) in soil might not poison terrestrial plants, but 200–300 mg/kg of Cr(VI) exposure will pose a harmful impact on bio-organisms. Therefore, it is necessary to derive and formulate screening level values for different Cr oxidation states. Table 6 lists the soil quality standard values for Cr from different countries, and only a few countries (e.g., the United States, Japan, and Canada) have separated standard values for Cr(VI) and total Cr [22,32,44]. Swedish, German, and Dutch soil quality standards are stringent and trying to minimize the impact on humans and surrounding ecosystems [45,46,47]. Therefore, there is no urgent need to revise existing limit values for these countries. The HC5 values of Cr(VI) based on the SSD-EC10 and HC10 of Cr(VI) based on SSD-EC10 in our experiments were higher than the screening level values in Japan, Canada and the United States [22,32,44]. However, the HC5 values of Cr(III) based on the SSD-EC10 and HC10 of Cr(III) based on SSD-EC10 were far less than the standard values of Cr in the other countries [45,46,47,48,49]. This may because the EC10 was close to acute NOECs or the tested species may be too sensitive to Cr(III). Moreover, the difference in the HC5 values between China and other countries might be attributed to the distribution of different resident species [50,51]. The unique taxonomic composition and complexity of ecosystems could lead to the over-protection or under-protection of terrestrial biorganisms therein. This suggests that the development of local soil quality criteria characterizing the sensitive species and potential risk acceptors in China is necessary.
Soil heavy metal pollution has become a severe global problem. In light of a nationwide soil quality and pollution survey launched between 2006 and 2010 in China, overall 16.1% of soil was polluted, of which 82.2% was inorganic pollution, and Cr exceeding rates were 1.1% [52]. In order to enact scientific and practical soil quality standards, comprehensive soil surveys and advanced monitoring techniques are required, and it is essential to acquire the background concentration of elements, environmental quality, nutrient status, and physical and chemical properties of soils in the future. It is also highly practical to monitor the magnitude of the risks involved with the consumption of vegetables cultivated in contaminated soils. In order to have a better protection of the terrestrial ecosystem, it is essential to take the local geological and natural conditions of different land used into consideration. To meet the goals of protecting and conserving soil for sustainable use, a systematic soil quality standard, including national, regional and industrial soil quality, is advised to be developed. Studies on the regionalization of terrestrial ecological functions and potential risk acceptors and the collection of toxicity data will be ongoing.

5. Conclusions

The root inhibition rates of tested plants were positively correlated with either Cr(VI) or Cr(III) concentrations. Generally, leafy vegetables were the most sensitive plants to Cr contamination in soils, followed by solanaceous and stem vegetables. Gourd vegetables were the least sensitive plants. The HC5 values based on EC10 were 0.60 mg/kg for Cr(VI) and 4.51 mg/kg for Cr(III), and the HC10 values based on EC10 were 0.83 mg/kg for Cr(VI) and 16.98 mg/kg for Cr(III). Compared to the screening level values worldwide, the HC5 and HC10 values were higher for Cr(VI) and lower for Cr(III) to some extent. It is recommended that a scientific and practical soil quality standard should be developed to characterize the sensitive species and potential risk acceptors, considering chemical valence and species of target contaminants as well.

Author Contributions

Conceptualization, Y.L. and Q.Z.; methodology, Y.W. and S.C.; software, Y.L. and Y.W.; validation, Y.W.; formal analysis, Y.L. and Y.W.; investigation, Y.W. and S.C.; data curation, Y.W.; writing—original draft preparation, Y.L.; writing—review and editing, Y.L. and W.H.; visualization, Y.L. and Y.W.; supervision, Q.Z.; project administration, Q.Z.; funding acquisition, Y.L. and Q.Z. All authors have read and agreed to the published version of the manuscript.

Funding

This research was funded by the National Natural Science Foundation of China, grant numbers 42007336 and 21677080.

Institutional Review Board Statement

Not applicable.

Informed Consent Statement

Not applicable.

Data Availability Statement

Data is contained within the article.

Conflicts of Interest

The authors declare no conflict of interest. The funders had no role in the design of the study; in the collection, analyses, or interpretation of data; in the writing of the manuscript, or in the decision to publish the results.

References

  1. Kotaś, J.; Stasicka, Z. Chromium occurrence in the environment and methods of its speciation. Environ. Pollut. 2000, 107, 263–283. [Google Scholar] [CrossRef]
  2. Turner, R.D.R.; Warne, M.S.J.; Dawes, L.A.; Vardy, S.; Will, G.D. Irrigated greywater in an urban sub-division as a potential source of metals to soil, groundwater and surface water. J. Environ. Manag. 2016, 183, 806–817. [Google Scholar] [CrossRef] [PubMed]
  3. Srivastava, V.; Sarkar, A.; Singh, S.; Singh, P.; De Araujo, A.S.F.; Singh, R.P. Agroecological responses of heavy metal pollution with special emphasis on soil health and plant performances. Front. Environ. Sci. 2017, 5, 64. [Google Scholar] [CrossRef] [Green Version]
  4. Gabarron, M.; Faz, A.; Martinez-Martinez, S.; Acosta, J. Change in metals and arsenic distribution in soil and their bioavailability beside old tailing ponds. J. Environ. Manag. 2018, 212, 292–300. [Google Scholar] [CrossRef]
  5. Wang, M.; Liu, R.; Lu, X.; Zhu, Z.; Wang, H.; Jiang, L.; Liu, J.; Wu, Z. Heavy metal contamination and ecological risk assessment of swine manure irrigated vegetable soils in Jiangxi Province, China. Bull. Environ. Contam. Toxicol. 2018, 100, 634–640. [Google Scholar] [CrossRef]
  6. Chen, C.W.; Lim, Y.C.; Chen, C.F.; Ju, Y.R.; Dong, C.D. Spatial distribution and ecological risk assessment of sediment metals in a highly industrialized coastal zone southwestern Taiwan. Environ. Sci. Pollut. Res. 2019, 26, 14717–14731. [Google Scholar] [CrossRef]
  7. Ramos-Miras, J.J.; Gil, C.; Rodriguez, M.J.A.; Bech, J.; Boluda, R. Ecological risk assessment of mercury and chromium in greenhouse soils. Environ. Geochem. Health 2020, 42, 313–324. [Google Scholar] [CrossRef]
  8. Rastmanesh, F.; Shalbaf, F.; Moradi, R.; Prinzhofer, A. Health risk assessment of heavy metals in Ahvaz oilfield using environmental indicators. Int. J. Environ. Sci. Technol. 2020, 17, 4669–4678. [Google Scholar] [CrossRef]
  9. Richard, F.C.; Bourg, A.C.M. Aqueous geochemistry of chromium: A review. Water Res. 1991, 25, 807–816. [Google Scholar] [CrossRef]
  10. Yu, X.Z.; Gu, J.D. Accumulation and distribution of trivalent chromium and effects on hybrid willow (Salix matsudana Koidz × alba L.). Metabolism. Arch. Environ. Contam. Toxicol. 2007, 52, 503–511. [Google Scholar] [CrossRef]
  11. Zayed, A.; Lytle, C.M.; Terry, Q.N. Chromium accumulation, translocation and chemical speciation in vegetable crops. Planta 1998, 206, 293–299. [Google Scholar] [CrossRef]
  12. do Nascimento, J.L.; de Almeida, A.A.F.; Barroso, J.P.; Mangabeira, P.A.; Ahnert, D.; Sousa, A.G.; Silva, J.V.S.; Baligar, V.C. Physiological, ultrastructural, biochemical and molecular responses of young cocoa plants to the toxicity of Cr (III) in soil. Ecotox. Environ. Saf. 2018, 159, 272–283. [Google Scholar] [CrossRef]
  13. Sinha, V.; Pakshirajan, K.; Chaturvedi, R. Chromium tolerance, bioaccumulation and localization in plants: An overview. J. Environ. Manag. 2018, 206, 715–730. [Google Scholar] [CrossRef] [PubMed]
  14. Wang, Y.T.; Shen, H. Bacterial reduction of hexavalent chromium. J. Ind. Microbiol. 1995, 14, 159–163. [Google Scholar] [CrossRef] [PubMed]
  15. Montes, M.O.; Peralta-Videa, J.R.; Parsons, J.G.; Diaz, B.C.; Gardea-Torresdey, J.L. Spectroscopic determination of the toxicity, absorption, reduction, and translocation of Cr(VI) in two Magnoliopsida species. Int. J. Phytorem. 2013, 15, 168–187. [Google Scholar] [CrossRef] [PubMed]
  16. Zhou, Q.X.; Huang, G.H. Environmental Biogeochemistry and Global Environmental Changes; Science Press: Beijing, China, 2001. [Google Scholar]
  17. Fernandez, M.D.; Vega, M.M.; Tarazona, J.V. Risk-based ecological soil quality criteria for the characterization of contaminated soils. Combination of chemical and biological tools. Sci. Total Environ. 2006, 366, 466–484. [Google Scholar] [CrossRef]
  18. Zhou, Q.X.; Teng, Y.; Liu, Y. A study on soil-environmental quality criteria and standards of arsenic. Appl. Geochem. 2017, 77, 158–166. [Google Scholar] [CrossRef]
  19. Zhou, Q.X.; Luo, Y.; Zhu, L.Y. Scientific research on environmental benchmark values and rivision of national environmental standards in China. J. Agro-Environ. Sci. 2007, 26, 1–5. (In Chinese) [Google Scholar] [CrossRef]
  20. Taghipour, M.; Jalali, M. Influence of organic acids on kinetic release of chromium in soil contaminated with leather factory waste in the presence of some adsorbents. Chemosphere 2016, 155, 395–404. [Google Scholar] [CrossRef] [PubMed]
  21. Shahid, M.; Shamshad, S.; Rafiq, M.; Khalid, S.; Bibi, I.; Niazi, N.K.; Dumat, C.; Rashid, M.I. Chromium speciation, bioavailability, uptake, toxicity and detoxification in soil-plant system: A review. Chemosphere 2017, 178, 513–533. [Google Scholar] [CrossRef]
  22. EPA, U.S. Regional Screening Levels for Chemical Contaminants at Superfund Sites; United States Environmental Protection Agency: Washington, DC, USA, 2010.
  23. Hose, G.C.; Van den Brink, P.J. Confirming the species-sensitivity distribution concept for endosulfan using laboratory, mesocosm, and field data. Arch. Environ. Contam. Toxicol. 2004, 47, 511–520. [Google Scholar] [CrossRef]
  24. Xin, Z.; Wenchao, Z.; Zhenguang, Y.; Yiguo, H.; Zhengtao, L.; Xianliang, Y.; Xiaonan, W.; Tingting, L.; Liming, Z. Species sensitivity analysis of heavy metals to freshwater organisms. Ecotoxicology 2015, 24, 1621–1631. [Google Scholar] [CrossRef]
  25. Wang, X.N.; Yan, Z.G.; Liu, Z.T.; Zhang, C.; Wang, W.; Li, H. Comparison of species sensitivity distributions for species from China and the USA. Environ. Sci. Pollut. Res. 2014, 21, 168–176. [Google Scholar] [CrossRef] [PubMed]
  26. van Straalen, N.M. Threshold models for species sensitivity distributions applied to aquatic risk assessment for zinc. Environ. Toxicol. Pharmacol. 2002, 11, 167–172. [Google Scholar] [CrossRef]
  27. Nagai, T.; Taya, K. Estimation of herbicide species sensitivity distribution using single-species algal toxicity data and information on the mode of action. Environ. Toxicol. Chem. 2015, 34, 677–684. [Google Scholar] [CrossRef] [PubMed]
  28. Ali, N.A.; Ater, M.; Sunahara, G.I.; Robidoux, P.Y. Phytotoxicity and bioaccumulation of copper and chromium using barley (Hordeum vulgare L.) in spiked artificial and natural forest soils. Ecotox. Environ. Saf. 2004, 57, 363–374. [Google Scholar] [CrossRef]
  29. López-Luna, J.; González-Chávez, M.C.; Esparza-García, F.J.; Rodríguez-Vázquez, R. Toxicity assessment of soil amended with tannery sludge, trivalent chromium and hexavalent chromium, using wheat, oat and sorghum plants. J. Hazard. Mater. 2009, 163, 829–834. [Google Scholar] [CrossRef] [PubMed]
  30. Wong, M.H.; Bradshaw, A.D. A comparison of the toxicity of heavy metals, using root elongation of rye grass, Lolium perenne. New Phytol. 1982, 91, 255–261. [Google Scholar] [CrossRef]
  31. Lu, R. Analytical Methods for Soils and Agricultural Chemistry; China Agricultural Science and Technology Press: Beijing, China, 1999. [Google Scholar]
  32. CCME. A Protocol for the Derivation of Environmental and Human Health Soil Quality Guidelines; Canadian Council of Ministers of the Environment: Winnipeg, MB, Canada, 2006.
  33. Schroer, A.F.W.; Belgers, J.D.M.; Brock, C.M.; Matser, A.M.; Maund, S.J.; Brink, P.J.V.D. Comparison of laboratory single species and field population-level effects of the pyrethroid insecticide λ-cyhalothrin on freshwater invertebrates. Arch. Environ. Contam. Toxicol. 2004, 46, 324–335. [Google Scholar] [CrossRef]
  34. Kamran, M.; Wang, D.; Alhaithloul, H.A.S.; Alghanem, S.M.; Aftab, T.; Xie, K.; Lu, Y.; Shi, C.; Sun, J.; Gu, W.; et al. Jasmonic acid-mediated enhanced regulation of oxidative, glyoxalase defense system and reduced chromium uptake contributes to alleviation of chromium (VI) toxicity in choysum (Brassica parachinensis L.). Ecotox. Environ. Saf. 2021, 208, 111758. [Google Scholar] [CrossRef]
  35. Kumar, P.; Tokas, J.; Singal, H.R. Amelioration of chromium(VI) toxicity in Sorghum (Sorghum bicolor L.) using glycine betaine. Sci. Rep. 2019, 9, 16020. [Google Scholar] [CrossRef] [Green Version]
  36. Ulhassan, Z.; Gill, R.A.; Huang, H.; Ali, S.; Mwamba, T.M.; Ali, B.; Huang, Q.; Hamid, Y.; Khan, A.R.; Wang, J.; et al. Selenium mitigates the chromium toxicity in Brassicca napus L. by ameliorating nutrients uptake, amino acids metabolism and antioxidant defense system. Plant Physiol. Biochem. 2019, 145, 142–152. [Google Scholar] [CrossRef] [PubMed]
  37. Huang, M.; Ai, H.; Xu, X.; Chen, K.; Niu, H.; Zhu, H.; Sun, J.; Du, D.; Chen, L. Nitric oxide alleviates toxicity of hexavalent chromium on tall fescue and improves performance of photosystem II. Ecotox. Environ. Saf. 2018, 164, 32–40. [Google Scholar] [CrossRef] [PubMed]
  38. Singh, H.P.; Mahajan, P.; Kaur, S.; Batish, D.R.; Kohli, R.K. Chromium toxicity and tolerance in plants. Environ. Chem. Lett. 2013, 11, 229–254. [Google Scholar] [CrossRef]
  39. Depault, F.; Cojocaru, M.; Fortin, F.; Chakrabarti, S.; Lemieux, N. Genotoxic effects of chromium(VI) and cadmium(II) in human blood lymphocytes using the electron microscopy in situ end-labeling (EM-ISEL) assay. Toxicol. Vitro 2006, 20, 513–518. [Google Scholar] [CrossRef] [PubMed]
  40. Riaz, M.; Yasmeen, T.; Arif, M.S.; Ashraf, M.A.; Hussain, Q.; Shahzad, S.M.; Rizwan, M.; Mehmood, M.W.; Zia, A.; Mian, I.A.; et al. Variations in morphological and physiological traits of wheat regulated by chromium species in long-term tannery effluent irrigated soils. Chemosphere 2019, 222, 891–903. [Google Scholar] [CrossRef]
  41. Ma, Y.; Rajkumar, M.; Zhang, C.; Freitas, H. Beneficial role of bacterial endophytes in heavy metal phytoremediation. J. Environ. Manag. 2016, 174, 14–25. [Google Scholar] [CrossRef]
  42. Tekerlekopoulou, A.G.; Tsiflikiotou, M.; Akritidou, L.; Viennas, A.; Tsiamis, G.; Pavlou, S.; Bourtzis, K.; Vayenas, D.V. Modelling of biological Cr(VI) removal in draw-fill reactors using microorganisms in suspended and attached growth systems. Water Res. 2013, 47, 623–636. [Google Scholar] [CrossRef]
  43. Otitoloju, A.A. Relevance of joint action toxicity evaluations in setting realistic environmental safe limits of heavy metals. J. Environ. Manag. 2003, 67, 121–128. [Google Scholar] [CrossRef]
  44. MEGJ. Environmental Quality Standards for Soil Pollution; Ministry of the Environment, Government of Japan (MEGJ): Tokyo, Japan, 2001.
  45. RIVM. Maximum Permissible Concentrations and Negligible Concentrations for Metals, Taking Background Concentrations into Account; National Institute of Public Health and Environment: Bilthoven, The Netherlands, 1997. [Google Scholar]
  46. FSPR. Precaution Values for Soils Pursuant to 8 Paragraph Ederal Soil Protection Law; Federal Soil Protection and Contaminated Sites Ordiance (BBodSchV): Hannover, Germany, 1999. [Google Scholar]
  47. Naturvårdsverket. Nya Generella Riktvärden för Förorenad Mark. 2009. Available online: www.naturvardsverket.se/ebh (accessed on 12 October 2020).
  48. NEPC. Guidelines on Healthbased Investigation Levels; National Environmental Protection Council (NEPC): Sydney, Australia, 1999.
  49. PCD. Soil Quality Standard for Habitat and Agriculture. Pollution Control Department of Thailand (PCD). Notification of National Environmental Board No. 25. 2004. Available online: http://www.pcd.go.th/info_serv/en_reg_std_soil01.html#s1 (accessed on 12 October 2020).
  50. He, J.; He, H.; Yan, Z.; Gao, F.; Zheng, X.; Fan, J.; Wang, Y. Comparative analysis of freshwater species sensitivity distributions and ecotoxicity for priority pesticides: Implications for water quality criteria. Ecotox. Environ. Saf. 2019, 176, 119–124. [Google Scholar] [CrossRef]
  51. Sorgog, K.; Kamo, M. Quantifying the precision of ecological risk: Conventional assessment factor method vs. species sensitivity distribution method. Ecotox. Environ. Saf. 2019, 183, 109494. [Google Scholar] [CrossRef] [PubMed]
  52. China. The National Soil Pollution Survey Bulletin. Ministry of Environmental Protection and Ministry of Land and Resources of P. R. China. 2014. Available online: http://www.sdpc.gov.cn/fzgggz/ncjj/zhdt/201404/t20140418_607888.html (accessed on 12 October 2020). (In Chinese)
Figure 1. The inhibition rate of Cr(VI) on root elongation of 11 plants: (a) leafy vegetables; (b) solanaceous vegetables; (c) wheat, gourd vegetable and stem vegetable. Bars represent standard error (n = 3).
Toxics 09 00058 g001
Figure 2. The inhibition rate of Cr(III) on root elongation of 11 plants: (a) leafy vegetables; (b) solanaceous vegetables; (c) wheat, gourd vegetable and stem vegetable. Bars represent standard error (n = 3).
Toxics 09 00058 g002
Figure 3. Curves of species sensitivity distribution for Cr (VI) based on (a) EC10, (b) EC20.
Toxics 09 00058 g003
Figure 4. Curves of species sensitivity distribution for Cr (III) based on (a) EC10, (b) EC20.
Toxics 09 00058 g004
Table 1. Basic properties of the tested soil.
pHOrganic Matter (g/kg)Cation Exchange Capacity (cmol/kg)Total Nitrogen (g/kg)Total Phosphorus (%)
7.116.7729.51.481.48
Table 2. Initial concentration of Cr(III) and Cr(VI) for test plants.
SpeciesCr(III) mg/kgCr(VI) mg/kg
Brassica rapa chinensis0, 10, 50, 100, 200, 300, 400, 5000, 1, 2, 4, 6, 8, 10, 20
Lactuca sativa L.0, 50, 100, 200, 400, 600, 800, 10000, 1, 2, 4, 6, 8, 10, 20
Allium schoenoprasum L.0, 10, 20, 50, 100, 150, 200, 3000, 1, 2, 4, 6, 8, 10, 20
Triticum aestivum L.0, 100, 200, 400, 600, 800, 1000, 15000, 1, 2.5, 5, 10, 20, 40, 60, 80
Solanum lycopersicum0, 50, 100, 200, 300, 400, 500, 6000, 1, 2, 4, 6, 8, 10, 20
Raphanus sativus L.0, 100, 200, 400, 600, 800, 1000, 15000, 1, 2.5, 5, 10, 15, 20, 40
Capsicum annuum L.0, 50, 100, 200, 400, 600, 800, 10000, 2.5, 5, 10, 15, 20, 30, 40
Solanum melongena L.0, 50, 100, 200, 400, 600, 800, 10000, 2, 4, 6, 8, 10, 15, 20
Spinacia oleracea L.0, 100, 200, 400, 600, 800, 1000, 15000, 1, 2, 5, 10, 15, 20, 30
Apium graveolens L.0, 50, 100, 200, 400, 600, 800, 10000, 2.5, 5, 7.5, 10, 15, 30
Cucumis sativus0, 100, 200, 400, 600, 800, 1000, 15000, 5, 10, 15, 20, 30, 40, 80
Table 3. Inhibition effects of Cr(VI) on root elongation of 11 terrestrial plants.
SpeciesRankEC10 mg/kgRankEC20 mg/kg
Brassica rapa chinensis10.65 (0.55~0.76)11.13 (0.97~1.33)
Lactuca sativa L.21.26 (1.10~1.44)21.81 (1.58~2.07)
Allium schoenoprasum L.31.42 (1.01~2.00)31.98 (1.41~2.80)
Triticum aestivum L.41.50 (1.18~1.91)42.25 (1.77~2.86)
Solanum lycopersicum51.55 (1.10~2.18)52.61 (1.85~3.67)
Raphanus sativus L.62.14 (1.62~2.83)63.19 (2.41~4.22)
Capsicum annuum L.72.63 (1.99~3.46)73.67 (2.78~4.83)
Solanum melongena L.82.78 (2.26~3.42)83.71 (3.02~4.57)
Spinacia oleracea L.93.71 (2.83~4.86)95.13 (3.91~6.71)
Apium graveolens L.104.39 (2.30~8.38)105.87 (3.07~11.22)
Cucumis sativus1112.83 (10.88~15.13)1116.62 (14.09~19.61)
Note: Values are given as means with 95% confidence limits.
Table 4. Inhibition effects of Cr(III) on root elongation of 11 terrestrial plants.
SpeciesRankEC10 mg/kgRankEC20 mg/kg
Brassica rapa chinensis15.62 (4.62~6.98)336.56 (29.12~46.63)
Allium schoenoprasum L.211.84 (8.53~16.45)124.21 (17.44~33.62)
Solanum melongena L.316.78 (13.05~22.21)224.71 (16.97~35.98)
Apium graveolens L.424.59 (21.02~29.54)454.52 (39.31~75.63)
Solanum lycopersicum532.35 (25.00~41.86)565.16 (50.36~84.32)
Lactuca sativa L.665.72 (41.86~103.20)6105.10 (66.96~165.10)
Capsicum annuum L.784.68 (51.90~138.20)10215.60 (132.10~351.70)
Cucumis sativus885.58 (67.52~108.50)7131.70 (103.90~166.90)
Triticum aestivum L.9108.30 (87.17~134.70)9187.40 (150.80~232.90)
Spinacia oleracea L.10113.10 (74.35~171.90)8187.20 (123.00~284.70)
Raphanus sativus L.11189.10 (115.90~308.30)11328.60 (201.50~535.80)
Note: Values are given as means with 95% confidence limits.
Table 5. The models and parameters of curve fitting and the values of HC5 and HC10 for chromium.
ContaminantsCr(VI)Cr(III)
EC10EC20EC10EC20
ModelSlogistic1Slogistic3ExponentialExponential
Formulay = a/(1 + exp (−k × (x − xc)))y = a/(1 + b × exp (−k × x))y = y0 + A × exp (R0 × x)y = y0 + A × exp (R0 × x)
Parametera = 93.04a = 92.75y0 = −29.50y0 = −110.64
xc = 0.30b = 18.30A = 20.69A = 67.19
k = 5.59k = 6.33R0 = 0.79R0 = 0.44
R20.970.990.970.98
HC50.601.014.516.65
HC100.831.3416.9821.33
Note: y is the cumulative probability of species, x is the mean of the log10 EC10 or log10 EC20.
Table 6. Risk-based screening levels of Cr in some countries (mg/kg).
CountryCr(VI)Total CrReference
Australia 100NEPC, 1999
Canada0.4 CCME, 2006
Germany 30 (sand), 60 (loam), 100 (clay) 1FSPR, 1999
Sweden 80Naturvårdsverket, 2009
Netherlands 100RIVM, 1997
United States0.29 U.S. EPA, 2010
Japan0.05 2 MEGJ
Thailand 300PCD, 2004
Belgium2.534Carlon, 2007
Note: 1 Germany differentiates metal limits according to soil properties; 2 The unit is mg/L.
Publisher’s Note: MDPI stays neutral with regard to jurisdictional claims in published maps and institutional affiliations.

