

Effects of PM10 Airborne Particles from Different Regions of a Megacity on In Vitro Secretion of Cytokines by a Monocyte Line during Different Seasons

 , , , ,
  , and
, and
Abstract
1. Introduction
2. Materials and Methods
3. Results
4. Discussion
5. Conclusions
Author Contributions
Funding
Institutional Review Board Statement
Informed Consent Statement
Data Availability Statement
Conflicts of Interest
References
- Almetwally, A.; Bin-Jumah, A. Ambient air pollution and its influence on human health and welfare: An overview. Environ. Sci. Pollut. Res. Int. 2020, 27, 24815–24830. [Google Scholar] [CrossRef]
- Valverde, M.; Granados, A.; Milić, M.; Ceppi, M.; Sollano, L.; Bonassi, S.; Rojas, E. Effect of Air Pollution on the Basal DNA Damage of Mother–Newborn Couples of México City. Toxics 2023, 11, 766. [Google Scholar] [CrossRef]
- Glinianaia, S.V.R.J.; Bell, R.; Pless-Mulloli, T.; Howel, D. Particulate air pollution and fetal health: A systematic review of the epidemiologic evidence. Epidemiology 2004, 15, 36–45. [Google Scholar] [CrossRef] [PubMed]
- Maisonet, M.C.A.; Misra, D.; Jaakkola, J.J.K. A review of the literature on the effects of ambient air pollution on fetal growth. Environ. Res. 2004, 95, 106–115. [Google Scholar] [CrossRef] [PubMed]
- O’Neill, M.; Osornio-Vargas, A.R.; Buxton, M.; Sanchez, B.; Rojas-Bracho, L.; Castillo-Castrejon, M.; Mordhukovich, I.; Brown, D.; Vadillo-Ortega, F. Air pollution, inflammation and preterm birth in Mexico City: Study design and methods. Sci. Total Environ. 2013, 448, 79–83. [Google Scholar] [CrossRef] [PubMed]
- Ritz, B.W.M.; Hoggatt, K.J.; Ghosh, J.K.C. Ambient air pollution and preterm birth in the Environment and Pregnancy Outcomes Study at the University of California, Los Angeles. Am. J. Epidemiol. 2007, 166, 1045–1052. [Google Scholar] [CrossRef] [PubMed]
- Naclerio, R.; Ansotegui, I.; Bousquet, J.; Canonica, W.; D’Amato, G.; Rosario, N.; Pawankar, R.; Peden, D.; Bergmann, K.; Bielory, L.; et al. International expert consensus on the management of allergic rhinitis (AR) aggravated by air pollutants: Impact of air pollution on patients with AR: Current knowledge and future strategies. World Allergy Organ. J. 2020, 13, 100106. [Google Scholar] [CrossRef]
- Nel, A.E.; Diaz-Sanchez, D.; Li, N. The role of particulate pollutants in pulmonary inflammation and asthma: Evidence for the involvement of organic chemicals and oxidative stress. Curr. Opin. Pulm. Med. 2001, 7, 20–26. [Google Scholar] [CrossRef] [PubMed]
- Saldiva, P.H.; Clarke, R.W.; Coull, B.A.; Stearns, R.C.; Lawrence, J.; Murthy, G.G.; Diaz, E.; Koutrakis, P.; Suh, H.; Tsuda, A.; et al. Lung inflammation induced by concentrated ambient air particles is related to particle composition. Am. J. Respir. Crit. Care Med. 2002, 165, 1610–1617. [Google Scholar] [CrossRef] [PubMed]
- Contiero, P.; Boffi, R.; Tagliabue, G.; Scaburri, A.; Tittarelli, A.; Bertoldi, M.; Borgini, A.; Favia, I.; Ruprecht, A.; Maiorino, A.; et al. A case-crossover study to investigate the effects of atmospheric particulate matter concentrations, season, and air temperature on accident and emergency presentations for cardiovascular events in Northern Italy. Int. J. Environ. Res. Public Health 2019, 16, 4627. [Google Scholar] [CrossRef]
- Delfino, R.; Sioutas, C.; Malik, S. Potential role of ultrafine particles in association between airborne particle mass and cardiovascular health. Environ. Health Perspect. 2005, 113, 934–946. [Google Scholar] [CrossRef] [PubMed]
- Mann, J.; Tager, I.; Lurmann, F.; Segal, M.; Quesenberry, C.; Lugg, M.M.; Shan, J.; Van Den Eeden, S.K. Air pollution and hospital admissions for ischemic heart disease: A prospective study and metanalysis. Environ. Health Perspect. 2002, 110, 1247–1252. [Google Scholar] [CrossRef] [PubMed]
- Pope, C.; Burnet, R.; Thurston, G.; Thun, M.; Calle, E.; Krewski, D. Cardiovascular mortality and long-term exposure to particulate air pollution: Epidemiological evidence of general pathophysiological pathways of disease. Circulation 2004, 109, 71–77. [Google Scholar] [CrossRef] [PubMed]
- Alfaro-Moreno, E.; Ponce de Leon, S.; Osornio-Vargas, A.; Garcia-Cuellar, C.; Martinez, L.; Rosas, I. Potential toxic effects associated to metals and endotoxin present in PM10: An ancillary study using multivariate analysis. Inhal. Toxicol. 2007, 19, 49–53. [Google Scholar] [CrossRef]
- Peters, A.; Fröhlich, M.; Doring, A.; Immervoll, T.; Wichmann, H.E.; Hutchinson, W.L.; Pepys, M.B.; Koenig, W. Particulate air pollution is associated with an acute phase response in men; results from the MONICA-Augsburg Study. Eur. Heart J. 2001, 22, 1198–1204. [Google Scholar] [CrossRef]
- Risom, L.; Møller, P.; Loft, S. Oxidative stress-induced DNA damage by particulate air pollution. Mutat. Res. 2005, 592, 119–137. [Google Scholar] [CrossRef]
- Bello-Medina, P.; Rodríguez-Martínez, E.; Prado-Alcalá, R.; Rivas-Arancibia, S. Ozone pollution, oxidative stress, synaptic plasticity, and neurodegeneration. Neurologia 2022, 37, 277–286. [Google Scholar] [CrossRef]
- Ovrevik, J.; Refsnes, M.; Lag, M.; Holme, J.; Schwarze, P. Activation of pro-inflammatory responses in the airway mucosa cells by particulate matter. Oxid.—Non-Oxid.-Mediat. Triggering Mech. Biomol. 2015, 5, 1399–1440. [Google Scholar]
- Rouadi, P.; Idriss, S.; Naclerio, R.; Peden, D.; Ansotegui, I.; Canonica, G.; Gonzalez-Diaz, S.; Rosario Filho, N.; Ivancevich, J.; Hellings, P.; et al. Immunopathological features of air pollution and its impact on inflammatory airways diseases (IAD). World Allergy Organ. J. 2020, 13, 100467. [Google Scholar] [CrossRef]
- Li, N.; Georas, S.; Alexis, N.; Fritz, P.; Xia, T. A work report on ultrafine particles (American Academy of Allergy, Asthma and Immunology): Why ambient ultrafine and engineered nanoparticles should receive special attention for possible adverse health outcomes in human subjects. J. Allergy Clin. Immunol. 2016, 138, 386–396. [Google Scholar] [CrossRef]
- Lowther, S.; Jones, K.; Wang, X.; Whyatt, J.; Wild, O.; Booker, D. Particulate matter measurement indoors: A review of metrics, sensors, needs, and applications. Environ. Sci. Technol. 2019, 53, 11644–11656. [Google Scholar] [CrossRef]
- Kutralam-Muniasamy, G.; Perez-Guevara, F.; Roy, P.; Elizalde-Martinez, I.; Shruti, V. Impacts of the COVID-19 lockdown on air quality and its association with human mortality trends in megalopolis Mexico City. Air Qual. Atmos. Health 2021, 14, 553–562. [Google Scholar] [CrossRef]
- Lopez-Feldman, A.; Heres, D.; Marquez-Padilla, F. Air pollution exposure and COVID-19: A look at mortality in Mexico City using individual-level data. Sci. Total Environ. 2021, 756, 143929. [Google Scholar] [CrossRef] [PubMed]
- Lin, Y.; Lai, C.; Chu, C. Air pollution diffusion simulation and seasonal spatial risk analysis for industrial areas. Environ. Res. 2020, 194, 110693. [Google Scholar] [CrossRef] [PubMed]
- Sarkar, S.; Rivas-Santiago, C.; Ibironke, O.; Carranza, C.; Meng, Q.; Osornio-Vargas, A.; Zhang, J.; Torres, M.; Chow, J.; Watson, J.; et al. Season and size of urban particulate matter differentially affect cytotoxicity and human immune responses to Mycobacterium tuberculosis. PLoS ONE 2019, 14, e0219122. [Google Scholar] [CrossRef] [PubMed]
- Lyu, Y.; Su, S.; Wang, B.; Zhu, X.; Wang, X.; Zeng, E.; Xing, B.; Tao, S. Seasonal and spatial variations in the chemical components and the cellular effects of particulate matter collected in Northern China. Sci. Total Environ. 2018, 627, 1627–1637. [Google Scholar] [CrossRef] [PubMed]
- Manzano-León, N.; Quintana, R.; Sánchez, B.; Serrano, J.; Vega, E.; Osornio, A. Variation in the composition and in vitro pro-inflammatory effect of urban particulate matter from different sites. J. Biochem. Mol. Toxicol. 2013, 27, 87–97. [Google Scholar] [CrossRef]
- Mirowsky, J.; Hickey, C.; Horton, L.; Blaustein, M.K.G. The effect of particle size, location, and season on urban and rural particulate matter toxicity. Inhal. Toxicol. 2013, 25, 747–757. [Google Scholar] [CrossRef] [PubMed]
- Mamkhezri, J.; Bohara, A.K.; Islas Camargo, A. Air pollution and daily mortality in the Mexico City Metropolitan Area. Atmósfera 2020, 33, 249–267. [Google Scholar] [CrossRef]
- World Health Organization. WHO Ambient (Outdoor) Air Quality Database; WHO: Geneva, Switzerland, 2013. [Google Scholar]
- Astudillo-García, C.; Rodriguez-Villamizar, L.; Cortez-Lugo, M.; Cruz-De la Cruz, J.; Fernandez -Niño, J. Air pollution and suicide in Mexico City: A time series analysis, 2000–2016. Int. Environ. Res. Public Health 2019, 16, 2971. [Google Scholar] [CrossRef]
- SMA-GDF. Inventario de emisiones de la Zona Metropolitana del Valle de Mexico 2010. In Secretaría del Medio Ambiente; del Gobierno, D.F., Ed.; Secretaría del Medio Ambiente: Ciudad de México, Mexico, 2012. [Google Scholar]
- Manzano-Leon, N.; Serrano-Lomelín, J.; Sanchez, B.; Quintana-Belmares, R.; Vega, E.; Osornio-Vargas, A. TNF-alpha and IL-6 responses to particulate matter in vitro: Variation according to PM size, season, and polycyclic aromatic hydrocarbon and soil content. Environ. Health Perspect. 2016, 124, 406–412. [Google Scholar] [CrossRef]
- Zeb, B.; Alam, K.; Sorooshian, A.; Blaschke, T.; Ahmad, I.; Shahid, I. On the morphology and composition of particulate matter in an urban environment. Aerosol Air Qual. Res. 2018, 18, 1431–1447. [Google Scholar]
- INE Instituto Nacional de Ecología. Cuarto Almanaque de Datos y Tendencias de la Calidad del Aire en 20 Ciudades Mexicanas (2000–2009), 1st ed.; Gobierno Federal, SEMARNAT: Ciudad de México, Mexico, 2011. [Google Scholar]
- Palacio, F.; Apodaca, M.; Crisci, J. Análisis Multivariado para datos Biológicos, Teoría y su Aplicación Utilizando el Lenguaje R; Vázquez Mazzini Editores: Mexico City, Mexico, 2020. [Google Scholar]
- Bosshart, H.; Heizelmann, M. THP-1 cells as a model for human monocytes. Ann. Transl. Med. 2016, 4, 438. [Google Scholar] [CrossRef]
- Chanput, W.; Mess, J.; Wichers, H. THP-1 cell line: An in vitro cell model for immune modulation approach. Int. Immunopharmacol. 2014, 23, 37–45. [Google Scholar] [CrossRef] [PubMed]
- Kimura, A.; Naka, T.; Nakahama, T.; Chinen, I.; Masuda, K.; Nohara, K.; Fuji-Kuriyama, Y.; Kishimoto, T. Aryl hydrocarbon receptor in combination with Stat1 regulates LPS-induced inflammatory responses. J. Exp. Med. 2009, 206, 2027–2035. [Google Scholar] [CrossRef] [PubMed]
- Kelley, N.; Jeltema, D.; Duan, Y.; He, Y. The NLRP3 inflammasome: An overview of mechanisms of activation and regulation. Int. J. Mol. Sci. 2019, 20, 3328. [Google Scholar] [CrossRef]
- Aguirre-Salado, A.; Vaquera-Huerta, H.; Aguirre-Salado, C.; Reyes-Mora, S.; Olvera-Cervantes, A. Developing a hierarchical model for the spatial analysis of PM10 pollution extremes in the Mexico City metropolitan area. Int. J. Environ. Res. Public Health 2017, 14, 734. [Google Scholar] [CrossRef] [PubMed]
- Becker, S.; Dailey, L.; Soukup, J.; Grambow, S.; Devlin, R.; Huang, Y. Seasonal variations in air pollution particle-induced inflammatory mediator release and oxidative stress. Environ. Health Perspect. 2005, 113, 1032–1038. [Google Scholar] [CrossRef]
- Corona-Vazquez, T.; Flores, R.; Rodríguez, V.; Cervantes-Arriaga, A. Air pollution, multiple sclerosis and its relevance to Mexico City. Arch. Med. Res. 2019, 50, 111–112. [Google Scholar] [CrossRef]
- Gutierrez, I.; Calderon Nepomuceno, D.; Gutierrez Cruz, D.; Aquina Verga, E. Correlación entre diferentes contaminantes atmosféricos de la Ciudad de México y el área metropolitana. Cienc. Ergo Sum Rev. Cient. Multidiscip. Prospect. 2020, 27, 1. [Google Scholar]
- Secretaría del Medio Ambiente, Gobierno del Distrito Federal. Informe Climatológico Ambiental del Valle de México; Secretaría del Medio Ambiente, Gobierno del Distrito Federal: Ciudad de México, Mexico, 2005. [Google Scholar]
- Januszek, R.; Staszczak, B.; Siudak, Z.; Bartus, J.; Plens, K.; Bartus, S.; Dudek, D. The relationship between increased air pollution expressed as PM10 concentration and the frequency of percutaneous coronary. Environ. Sci. Pollut. Res. 2020, 27, 21320–21330. [Google Scholar] [CrossRef] [PubMed]
- Bonner, J.; Rice, A.; Lindroos, P.; O’Brien, P.; Dreher, K.; Rosas, I.; Alfaro-Moreno, E.; Osornio-Vargas, A. Induction of the lung myofibroblast PDGF receptor system by urban ambient particles from Mexico City. Am. J. Respir. Cell Mol. Biol. 1998, 19, 672–680. [Google Scholar] [CrossRef] [PubMed]
- Rosas Perez, I.S.J.; Alfaro-Moreno, E.; Baumgardner, D.; Garcia-Cuellar, C.; Martin Del Campo, J.M.; Raga, G.B.; Castillejos, M.; Colin, R.D.; Osornio Vargas, A.R. Relations between PM10 composition and cell toxicity: A multivariate and graphical approach. Chemosphere 2007, 67, 1218–1228. [Google Scholar] [CrossRef] [PubMed]
- Chirino, Y.; Sánchez-Perez, Y.; Osornio-Vargas, A.; Rosas, I.; García-Cuellar, C. Sampling and composition of airborne particulate matter (PM10) from two locations of Mexico City. Data Brief 2015, 4, 353–356. [Google Scholar] [CrossRef] [PubMed]
- Alfaro-Moreno, E.; Martínez, L.; García-Cuellar, C.; Bonner, J.; Murray, J.; Rosas, I.; Rosales, S.; Osornio-Vargas, A. Biologic effects induced in vitro by PM10 from three zones of Mexico City. Environ. Health Perspect. 2002, 110, 715–720. [Google Scholar] [CrossRef] [PubMed]
- Tian, Y.; Ke, S.; Denison, M.S.; Rabson, A.B.; Gallo, M.A. Ah receptor and NF-kappaB interactions, a potential mechanism for dioxin toxicity. J. Biol Chem. 1999, 274, 510–515. [Google Scholar] [CrossRef]
- Fardel, O. Cytokines as molecular targets for aryl hydrocarbon receptor ligands: Implications for toxicity and xenobiotic detoxification. Expert Opin. Drug Metab. Toxicol. 2013, 9, 141–152. [Google Scholar] [CrossRef]
- Guarnieri, T.; Abruzzo, P.M.; Bolotta, A. More than a cell biosensor: Aryl hydrocarbon receptor at the intersection of physiology and inflammation. Am. J. Physiol. Cell Physiol. 2020, 318, C1078–C1082. [Google Scholar] [CrossRef]
- Huai, W.; Zhao, R.; Song, H.; Zhao, J.; Zhang, L.; Gao, C.; Han, L.; Zhao, W. Aryl hydrocarbon receptor negatively regulates NLRP3 inflammasome activity by inhibiting NLRP3 transcription. Nat. Commun. 2014, 5, 4738. [Google Scholar] [CrossRef]
- Ke, S.; Rabson, A.B.; Germino, J.F.; Gallo, M.A.; Tian, Y. Mechanism of suppression of cytochrome P-450 1A1 expression by tumor necrosis factor-alpha and lipopolysaccharide. J. Biol. Chem. 2001, 276, 39638–39644. [Google Scholar] [CrossRef]
- Guarneros, M.; López-Rivera, C.; Gonsebatt, M.E.; Alcaraz-Zubeldia, M.; Hummel, H.; Schriever, V.A.; Valdez, B.; Hudson, R. Metal-containing particulate matter and associated reduced olfatory identification ability in children from an area of high atmospheric exposure in Mexico City. Chem. Senses 2020, 45, 59–67. [Google Scholar] [CrossRef]
- Maciel-Ruiz, J.A.; López-Rivera, C.; Robles-Morales, R.; Veloz-Martínez, M.G.; López-Arellano, R.; Rodríguez-Patiño, G.; Petrosyan, P.; Govezensky, T.; Salazar, A.M.; Ostrosky-Wegman, P.; et al. Prenatal exposure to particulate matter and ozone: Bulky DNA adducts, plasma isoprostanes, allele risk variants, and neonate susceptibility in the Mexico City Metropolitan Area. Environ. Mol. Mutagen. 2019, 60, 428–442. [Google Scholar] [CrossRef]
- Jeaniean, M.; Bind, M.; Roux, J. Ozone, NO2 and PM10 are associated with the occurrence of multiple sclerosis relapses. Evidence from seasonal multi-pollutant analyses. Environ. Res. 2018, 163, 43–52. [Google Scholar] [CrossRef]
- Roux, J.; Bard, D.; LePabic, E. Air pollution by particulate matter PM10 may trigger multiple sclerosis relapses. Environ. Res. 2017, 156, 404–410. [Google Scholar] [CrossRef] [PubMed]
- Buxton, M.A.; Perng, W.; Tellez-Rojo, M.M.; Rodríguez-Carmona, Y.; Cantoral, A.; Sánchez, B.N.; Rivera-González, L.O.; Gronlund, C.J.; Shivappa, N.; Hébert, J.R.; et al. Particulate matter exposure, dietary inflammatory index and preterm birth in Mexico city, Mexico. Environ. Res. 2020, 189, 109852. [Google Scholar] [CrossRef] [PubMed]
- Oliva-Sánchez, P.; Landeros-López, S.; Velazquez-Trejo, D.; Martínez-Kobeh, J.P.; Vadillo-Ortega, F. COVID-19 epidemiological indicators and exposition to airborne particle matter in Mexico City. Environ. Res. 2021; submitted. [Google Scholar]
- Antonio-Villa, N.E.; Bello-Chavolla, O.Y.; Fermín-Martínez, C.A.; Aburto, J.M.; Fernández-Chirino, L.; Ramírez-García, D.; Pisanty-Alatorre, J.; González-Díaz, A.; Vargas-Vázquez, A.; Barquera, S.; et al. Socio-demographic inequalities and excess non-COVID-19 mortality during the COVID-19 pandemic: A data-driven analysis of 1 069 174 death certificates in Mexico. Int. J. Epidemiol. 2022, 51, 1711–1721. [Google Scholar] [CrossRef] [PubMed]
- Carlsten, C.; Salvi, S.; Wong, G.W.K.; Chung, K.F. Personal strategies to minimize effects of air pollution on respiratory health: Advice for providers, patients and the public. Eur. Respir J. 2020, 55, 902056. [Google Scholar] [CrossRef] [PubMed]


| Sector | |||||
|---|---|---|---|---|---|
| Residential-East (n = 24) | Industrial-North (n = 24) | Residential-South (n = 24) | Business-Center (n = 24) | Residential-West (n = 24) | |
| Cytokine | Mean (95% CI a) | Mean (95% CI a) | Mean (95% CI a) | Mean (95% CI a) | Mean (95% CI a) |
| Chemotactic | |||||
| MIP-1α | 3753.16 (2558.64, 4947.68) | 7208.64 (5737.58, 8679.70) | 3731.48 (1933.75, 5529.22) | 6687.41 (5671.14, 7703.68) | 5371.56 (3996.32, 6746.81) |
| IP-10 | 401.28 (305.08, 497.48) | 314.71 (249.20, 380.22) | 251.75 (193.87, 309.63) | 360.32 (278.25, 442.39) | 341.20 (273.55, 408.85) |
| MCP-1 | 170.07 (78.26, 261.89) | 155.29 (92.50, 218.08) | 98.79 (52.01, 145.57) | 74.78 (51.14, 98.43) | 175.82 (128.74, 222.89) |
| Pro-inflammatory | |||||
| IL-1α | 2.93 (2.78, 3.07) | 7.11 (5.10, 9.12) | 3.57 (2.10, 5.05) | 3.57 (2.53, 4.60) | 5.62 (4.55, 6.69) |
| IL-1β | 13.96 (7.11, 20.81) | 17.65 (10.94, 24.37) | 52.41 (19.31, 85.52) | 26.38 (20.29, 32.48) | 21.14 (11.94, 30.34) |
| TNF-α | 266.62 (160.49, 372.76) | 323.55 (197.03, 450.06) | 318.79 (152.66, 484.91) | 652.74 (525, 780.47) | 301.23 (164.04, 438.43) |
| IL-6 | 0.71 (0.35, 1.06) | 0.64 (0.33, 0.96) | 2.79 (2.26, 3.31) | 2.37 (1.97, 2.77) | 0.49 (0.26, 0.72) |
| Anti-inflammatory | |||||
| IL-1RA | 30.59 (23.32, 37.86) | 9.13 (7.26, 11.01) | 33.46 (12.26, 54.67) | 24.50 (20.01, 28.98) | 15.68 (12.36, 18.99) |
| IL-10 | 5.58 (4.48, 6.68) | 4.55 (3.81, 5.29) | 6.46 (4.82, 8.11) | 8.95 (6.17, 11.73) | 4.01 (3.40, 4.62) |
| Growth factor | |||||
| VEGF | 551.93 (405.15, 698.70) | 566.49 (110.62, 1022.35) | 283.30 (193.44, 373.16) | 324.72 (259.72, 389.73) | 569.17 (353.70, 784.64) |
| Sector | |||||||||||
|---|---|---|---|---|---|---|---|---|---|---|---|
| R-E, I-N | R-E, R-S | R-E, B-C | R-E, R-W | I-N, R-S | I-N, B-C | I-N, R-W | R-S, B-C | R-S, R-W | B-C, R-W | ||
| Chemotactic | |||||||||||
| MIP-1α | DBM (95% CI) | 0.87 (0.09, 1.64) | −0.32 (−1.10, 0.45) | 0.96 (0.19, 1.74) | 0.53 ((−0.25,1.30) | −1.19 (−1.96, −0.42) | 0.10 (−0.68, 0.87) | −0.34 (−1.11, 0.43) | 1.29 (0.51, 2.06) | 0.85 (0.08, 1.62) | −0.44 (−1.21, 0.34) |
| p-value | 1.97 × 10⁻² * | 7.75 × 10⁻¹ | 6.76 × 10⁻³ ** | 3.28 × 10⁻¹ | 3.92 × 10⁻⁴ *** | 9.97 × 10⁻¹ | 7.42 × 10⁻¹ | 9.99 × 10⁻⁵ **** | 2.35 × 10⁻² * | 5.22 × 10⁻¹ | |
| IP-10 | DBM (95% CI) | −0.18 (−0.64, 0.29) | −0.48 (−0.95, −0.02) | −0.06 (−0.53, 0.41) | −0.11 (0.57, 0.36) | −0.31 (−0.77, 0.16) | 0.12 (−0.35, 0.58) | 0.07 (−0.39, 0.54) | 0.42 (−0.04, 0.89) | 0.38 (−0.09, 0.85) | −0.05 (−0.51, 0.42) |
| p-value | 8.29 × 10⁻¹ | 3.83 × 10⁻² * | 9.97 × 10⁻¹ | 9.71 × 10⁻¹ | 3.68 × 10⁻¹ | 9.56 × 10⁻¹ | 9.93 × 10⁻¹ | 9.37 × 10⁻² | 1.70 × 10⁻¹ | 9.99 × 10⁻¹ | |
| MCP-1 | DBM (95% CI) | −0.18 (−0.75, 0.40) | −0.57 (−1.15, 0.01) | −0.66 (−1.23, −0.08) | 0.13 (−0.45, 0.71) | −0.39 (−0.97, 0.19) | −0.48 (−1.06, 0.10) | 0.31 (−0.27, 0.88) | −0.09 (−0.66, 0.49) | 0.70 (0.12, 1.28) | 0.79 (0.21, 1.36) |
| p-value | 9.15 × 10⁻¹ | 5.58 × 10⁻² * | 1.75 × 10⁻² * | 9.71 × 10⁻¹ | 3.33 × 10⁻¹ | 1.52 × 10⁻¹ | 5.83 × 10⁻¹ | 9.93 × 10⁻¹ | 9.41 × 10⁻³ ** | 2.36 × 10⁻³ ** | |
| Pro-inflammatory | |||||||||||
| IL-1α | DBM (95% CI) | 0.70 (0.24, 1.16) | −0.14 (−0.60, 0.32) | 0.03 (−0.43, 0.49) | 0.57 (0.12, 1.03) | −0.84 (−1.30, −0.38) | −0.67 (−1.13, −0.21) | −0.13 (−0.59, 0.33) | 0.17 (−0.29, 0.63) | 0.71 (0.25, 1.17) | 0.54 (0.08, 1.00) |
| p-value | 4.30 × 10⁻⁴ *** | 9.18 × 10⁻¹ | 1.00 | 6.44 × 10⁻³ ** | 1.44 × 10⁻⁵ **** | 9.02 × 10⁻⁴ *** | 9.39 × 10⁻¹ | 8.37 × 10⁻¹ | 3.28 × 10⁻⁴ *** | 1.20 × 10⁻² * | |
| IL-1β | DBM (95% CI) | 0.42 (−0.34, 1.19) | 1.02 (0.26, 1.78) | 1.07 (0.30, 1.83) | 0.44 (−0.32, 1.20) | 0.60 (−0.16, 1.36) | 0.64 (−0.12, 1.41) | 0.02 (−0.74, 0.78) | 0.04 (−0.72, 0.81) | −0.58 (−1.34, 0.18) | −0.62 (−1.39, 0.14) |
| p-value | 5.45 × 10⁻¹ | 2.94 × 10⁻³ ** | 1.69 × 10⁻³ ** | 4.99 × 10⁻¹ | 1.96 × 10⁻¹ | 1.41 × 10⁻¹ | 1.00 | 1.00 | 2.25 × 10⁻¹ | 1.64 × 10⁻¹ | |
| TNF-α | DBM (95% CI) | 0.29 (−0.35, 0.94) | 0.02 (−0.62, 0.67) | 1.18 (0.53, 1.83) | 0.07 (−0.58, 0.71) | −0.27 (−0.92, 0.38) | 0.88 (0.24, 1.53) | −0.23 (−0.87, 0.42) | 1.16 (0.51, 1.80) | 0.04 (−0.60, 0.69) | −1.11 (−1.76, −0.46) |
| p-value | 7.18 × 10⁻¹ | 1.00 | 1.7 × 10⁻⁵ **** | 9.99 × 10⁻¹ | 7.75 × 10⁻¹ | 2.25 × 10⁻³ ** | 8.68 × 10⁻¹ | 2.57 × 10⁻⁵ **** | 1.00 | 5.62 × 10⁻⁵ **** | |
| IL-6 | DBM (95% CI) | −0.02 (−0.55, 0.51) | 1.55 (1.02, 2.09) | 1.48 (0.95, 2.01) | −0.28 (−0.81, 0.25) | 1.58 (1.04, 2.11) | 1.50 (0.97, 2.03) | −0.26 (−0.79, 0.27) | −0.08 (−0.61, 0.45) | −1.84 (−2.37, −1.31) | −1.76 (−2.29, −1.23) |
| p-value | 1.00 | 5.88 × 10⁻¹² **** | 4.7 × 10⁻¹¹ **** | 5.80 × 10⁻¹ | 3.34 × 10⁻¹² **** | 2.6 × 10⁻¹¹ **** | 6.49 × 10⁻¹ | 9.95 × 10⁻¹ | 4.79 × 10⁻¹⁴ **** | 6.59 × 10⁻¹⁴ **** | |
| Anti-inflammatory | |||||||||||
| IL-1RA | DBM (95% CI) | −1.17 (−1.63, −0.71) | −0.11 (−0.57, 0.35) | −0.13 (−0.59, 0.32) | −0.59 (−1.05, −0.13) | 1.06 (0.60, 1.52) | 1.03 (0.57, 1.49) | 0.58 (0.12, 1.04) | −0.03 (−0.49, 0.43) | −0.48 (−0.94, −0.02) | −0.46 (−0.92, 0.00) |
| p-value | 1.46 × 10⁻⁹ **** | 9.66 × 10⁻¹ | 9.26 × 10⁻¹ | 4.73 × 10⁻³ ** | 3.57 × 10⁻⁸ **** | 7.8 × 10⁻⁸ **** | 6.30 × 10⁻³ ** | 1.00 | 3.39 × 10⁻² * | 5.26 × 10⁻² * | |
| IL-10 | DBM (95% CI) | −0.20 (−0.58, 0.18) | 0.11 (−0.27, 0.50) | 0.36 (−0.02, 0.75) | −0.30 (−0.68, 0.08) | 0.31 (−0.07, 0.70) | 0.56 (0.18, 0.95) | −0.10 (−0.48, 0.28) | 0.25 (−0.14, 0.63) | −0.41 (−0.80, −0.03) | −0.66 (−1.05, −0.28) |
| p-value | 5.97 × 10⁻¹ | 9.25 × 10⁻¹ | 7.52 × 10⁻² * | 2.00 × 10⁻¹ | 1.64 × 10⁻¹ | 8.45 × 10⁻⁴ *** | 9.52 × 10⁻¹ | 3.83 × 10⁻¹ | 2.82 × 10⁻² * | 5.17 × 10⁻⁵ **** | |
| Growth factor | |||||||||||
| VEGF | DBM (95% CI) | −0.48 (−1.12, 0.17) | −0.69 (−1.34, −0.05) | −0.47 (−1.12, 0.17) | −0.11 (−0.76, 0.53) | −0.21 (−0.86, 0.43) | 0.00 (−0.64, 0.65) | 0.37 (−0.28, 1.01) | 0.22 (−0.43, 0.86) | 0.58 (−0.06, 1.23) | 0.36 (−0.28, 1.01) |
| p-value | 2.47 × 10⁻¹ | 2.89 × 10⁻² * | 2.56 × 10⁻¹ | 9.89 × 10⁻¹ | 8.88 × 10⁻¹ | 1.00 | 5.18 × 10⁻¹ | 8.81 × 10⁻¹ | 9.93 × 10⁻² * | 5.30 × 10⁻¹ | |
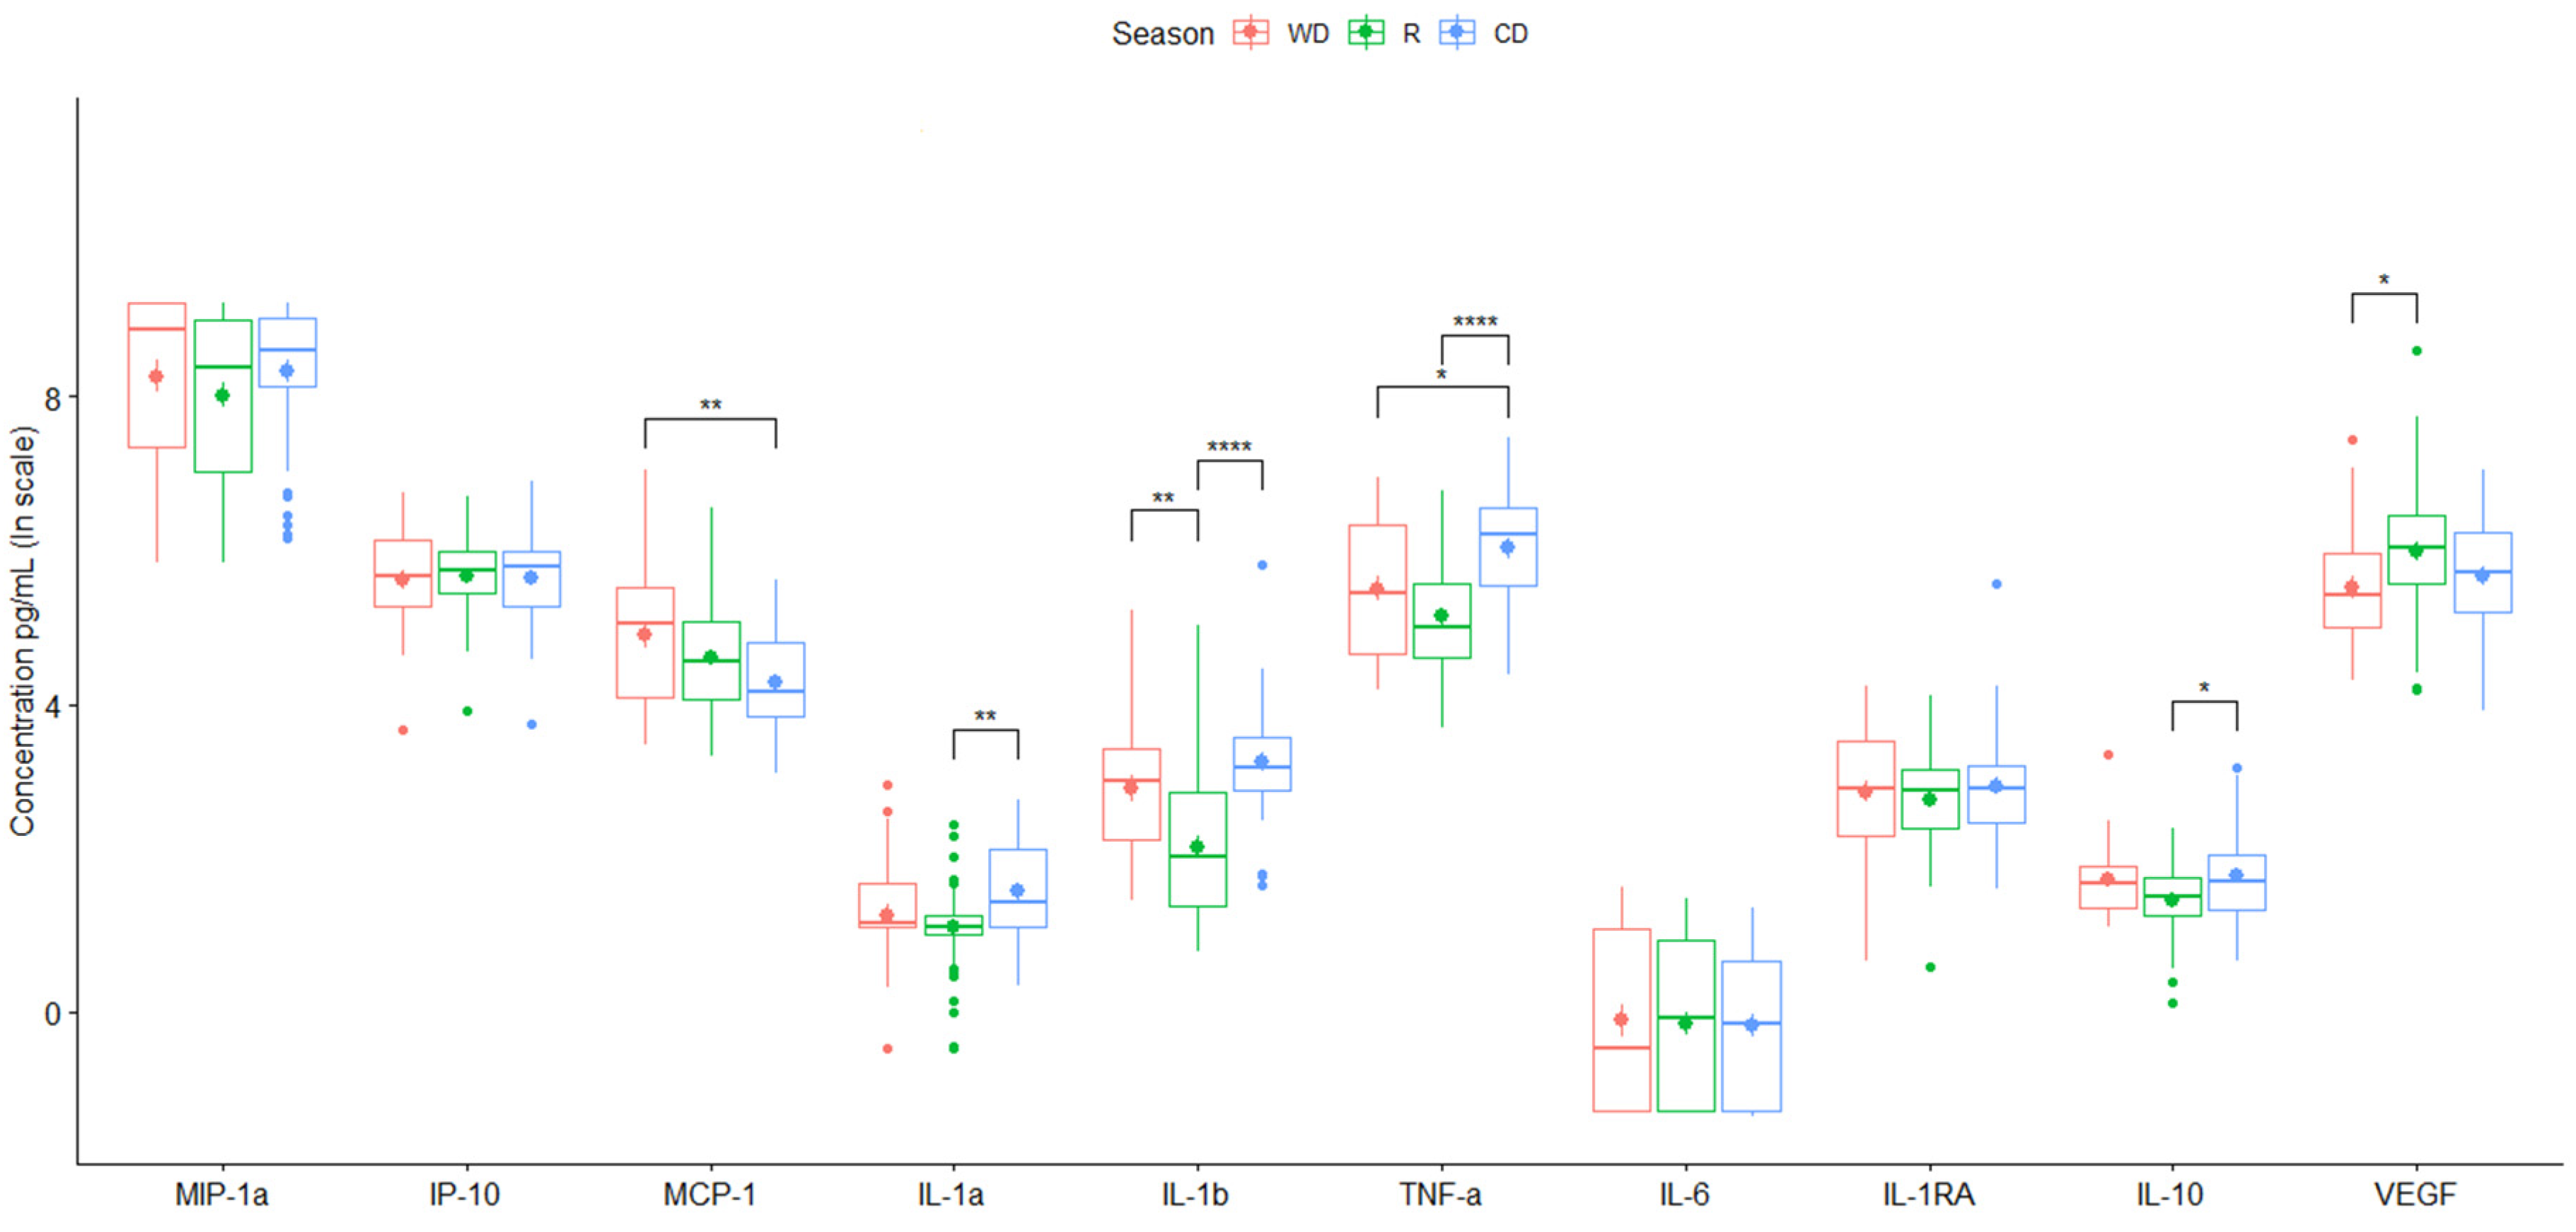
| Season | |||
|---|---|---|---|
| Warm-Dry (n = 30) | Rainy (n = 50) | Cold-Dry (n = 40) | |
| Cytokine | Mean (95% CI a) | Mean (95% CI a) | Mean (95% CI a) |
| Chemotactic | |||
| MIP-1α | 5918.32 (4339.06, 7497.59) | 4817.26 (3320.05, 6314.48) | 5591.04 (4231.61, 6950.47) |
| IP-10 | 337.36 (250.81, 423.91) | 329.24 (265.28, 393.19) | 336.99 (255.69, 418.30) |
| MCP-1 | 197.98 (109.46, 286.51) | 135.27 (83.42, 187.13) | 87.27 (63.10, 111.44) |
| Pro-inflammatory | |||
| IL-1α | 4.55 (2.89, 6.21) | 3.51 (2.68, 4.33) | 5.88 (4.26, 7.51) |
| IL-1β | 28.93 (14.02, 43.83) | 15.65 (4.03, 27.26) | 37.67 (16.24, 59.10) |
| TNF-α | 348.83 (230.86, 466.81) | 236.71 (148.80, 324.63) | 560.24 (383.38, 737.10) |
| IL-6 | 1.60 (0.93, 2.27) | 1.40 (0.87, 1.93) | 1.25 (0.79, 1.72) |
| Anti-inflammatory | |||
| IL-1RA | 22.80 (16.19, 29.41) | 18.79 (14.09, 23.49) | 27.43 (10.66, 44.20) |
| IL-10 | 6.35 (4.39, 8.31) | 4.70 (3.86, 5.54) | 7.09 (4.99, 9.19) |
| Growth factor | |||
| VEGF | 358.02 (203.39, 512.65) | 590.60 (261.16, 920.03) | 370.60 (263.45, 477.76) |
| Season | ||||
|---|---|---|---|---|
| WD, R | WD, CD | R, CD | ||
| Chemotactic | ||||
| MIP-1α | DBM (95% CI) | −0.25 (−0.84, 0.34) | 0.06 (−0.56, 0.67) | 0.31 (−0.23, 0.85) |
| p-value | 5.78 × 10⁻¹ | 9.72 × 10⁻¹ | 3.71 × 10⁻¹ | |
| IP-10 | DBM (95% CI) | 0.06 (−0.27, 0.39) | 0.03 (−0.32, 0.38) | −0.03 (−0.33, 0.27) |
| p-value | 9.03 × 10⁻¹ | 9.76 × 10⁻¹ | 9.71 × 10⁻¹ | |
| MCP-1 | DBM (95% CI) | −0.29 (−0.69, 0.12) | −0.61 (−1.04, −0.19) | −0.33 (−0.70, 0.05) |
| p-value | 2.21 × 10⁻¹ | 2.46 × 10⁻³ ** | 9.91 × 10⁻² * | |
| Pro-inflammatory | ||||
| IL-1α | DBM (95% CI) | −0.15 (−0.50, 0.20) | 0.30 (−0.06, 0.67) | 0.45 (0.13, 0.77) |
| p-value | 5.68 × 10⁻¹ | 1.18 × 10⁻¹ | 2.83 × 10⁻³ ** | |
| IL-1β | DBM (95% CI) | −0.76 (−1.26, −0.27) | 0.34 (−0.17, 0.86) | 1.11 (0.65, 1.56) |
| p-value | 1.12 × 10⁻³ ** | 2.61 × 10⁻¹ | 1.98 × 10⁻⁷ **** | |
| TNF-α | DBM (95% CI) | −0.36 (−0.82, 0.09) | 0.52 (0.05, 1.00) | 0.89 (0.47, 1.31) |
| p-value | 1.46 × 10⁻¹ | 2.82 × 10⁻² * | 5.62 × 10⁻⁶ **** | |
| IL-6 | DBM (95% CI) | −0.04 (−0.62, 0.53) | −0.07 (−0.67, 0.53) | −0.03 (−0.55, 0.50) |
| p-value | 9.82 × 10⁻¹ | 9.59 × 10⁻¹ | 9.93 × 10⁻¹ | |
| Anti-inflammatory | ||||
| IL-1RA | DBM (95% CI) | −0.11 (−0.50, 0.28) | 0.07 (−0.34, 0.48) | 0.19 (−0.17, 0.55) |
| p-value | 7.79 × 10⁻¹ | 9.04 × 10⁻¹ | 4.42 × 10⁻¹ | |
| IL-10 | DBM (95% CI) | −0.26 (−0.54, 0.02) | 0.06 (−0.23, 0.35) | 0.32 (0.06, 0.58) |
| p-value | 7.67 × 10⁻² * | 8.79 × 10⁻¹ | 1.11 × 10⁻² * | |
| Growth factor | ||||
| VEGF | DBM (95% CI) | 0.46 (0.02, 0.91) | 0.14 (−0.33, 0.61) | −0.32 (−0.73, 0.09) |
| p-value | 4.08 × 10⁻² * | 7.52 × 10⁻¹ | 1.57 × 10⁻¹ | |
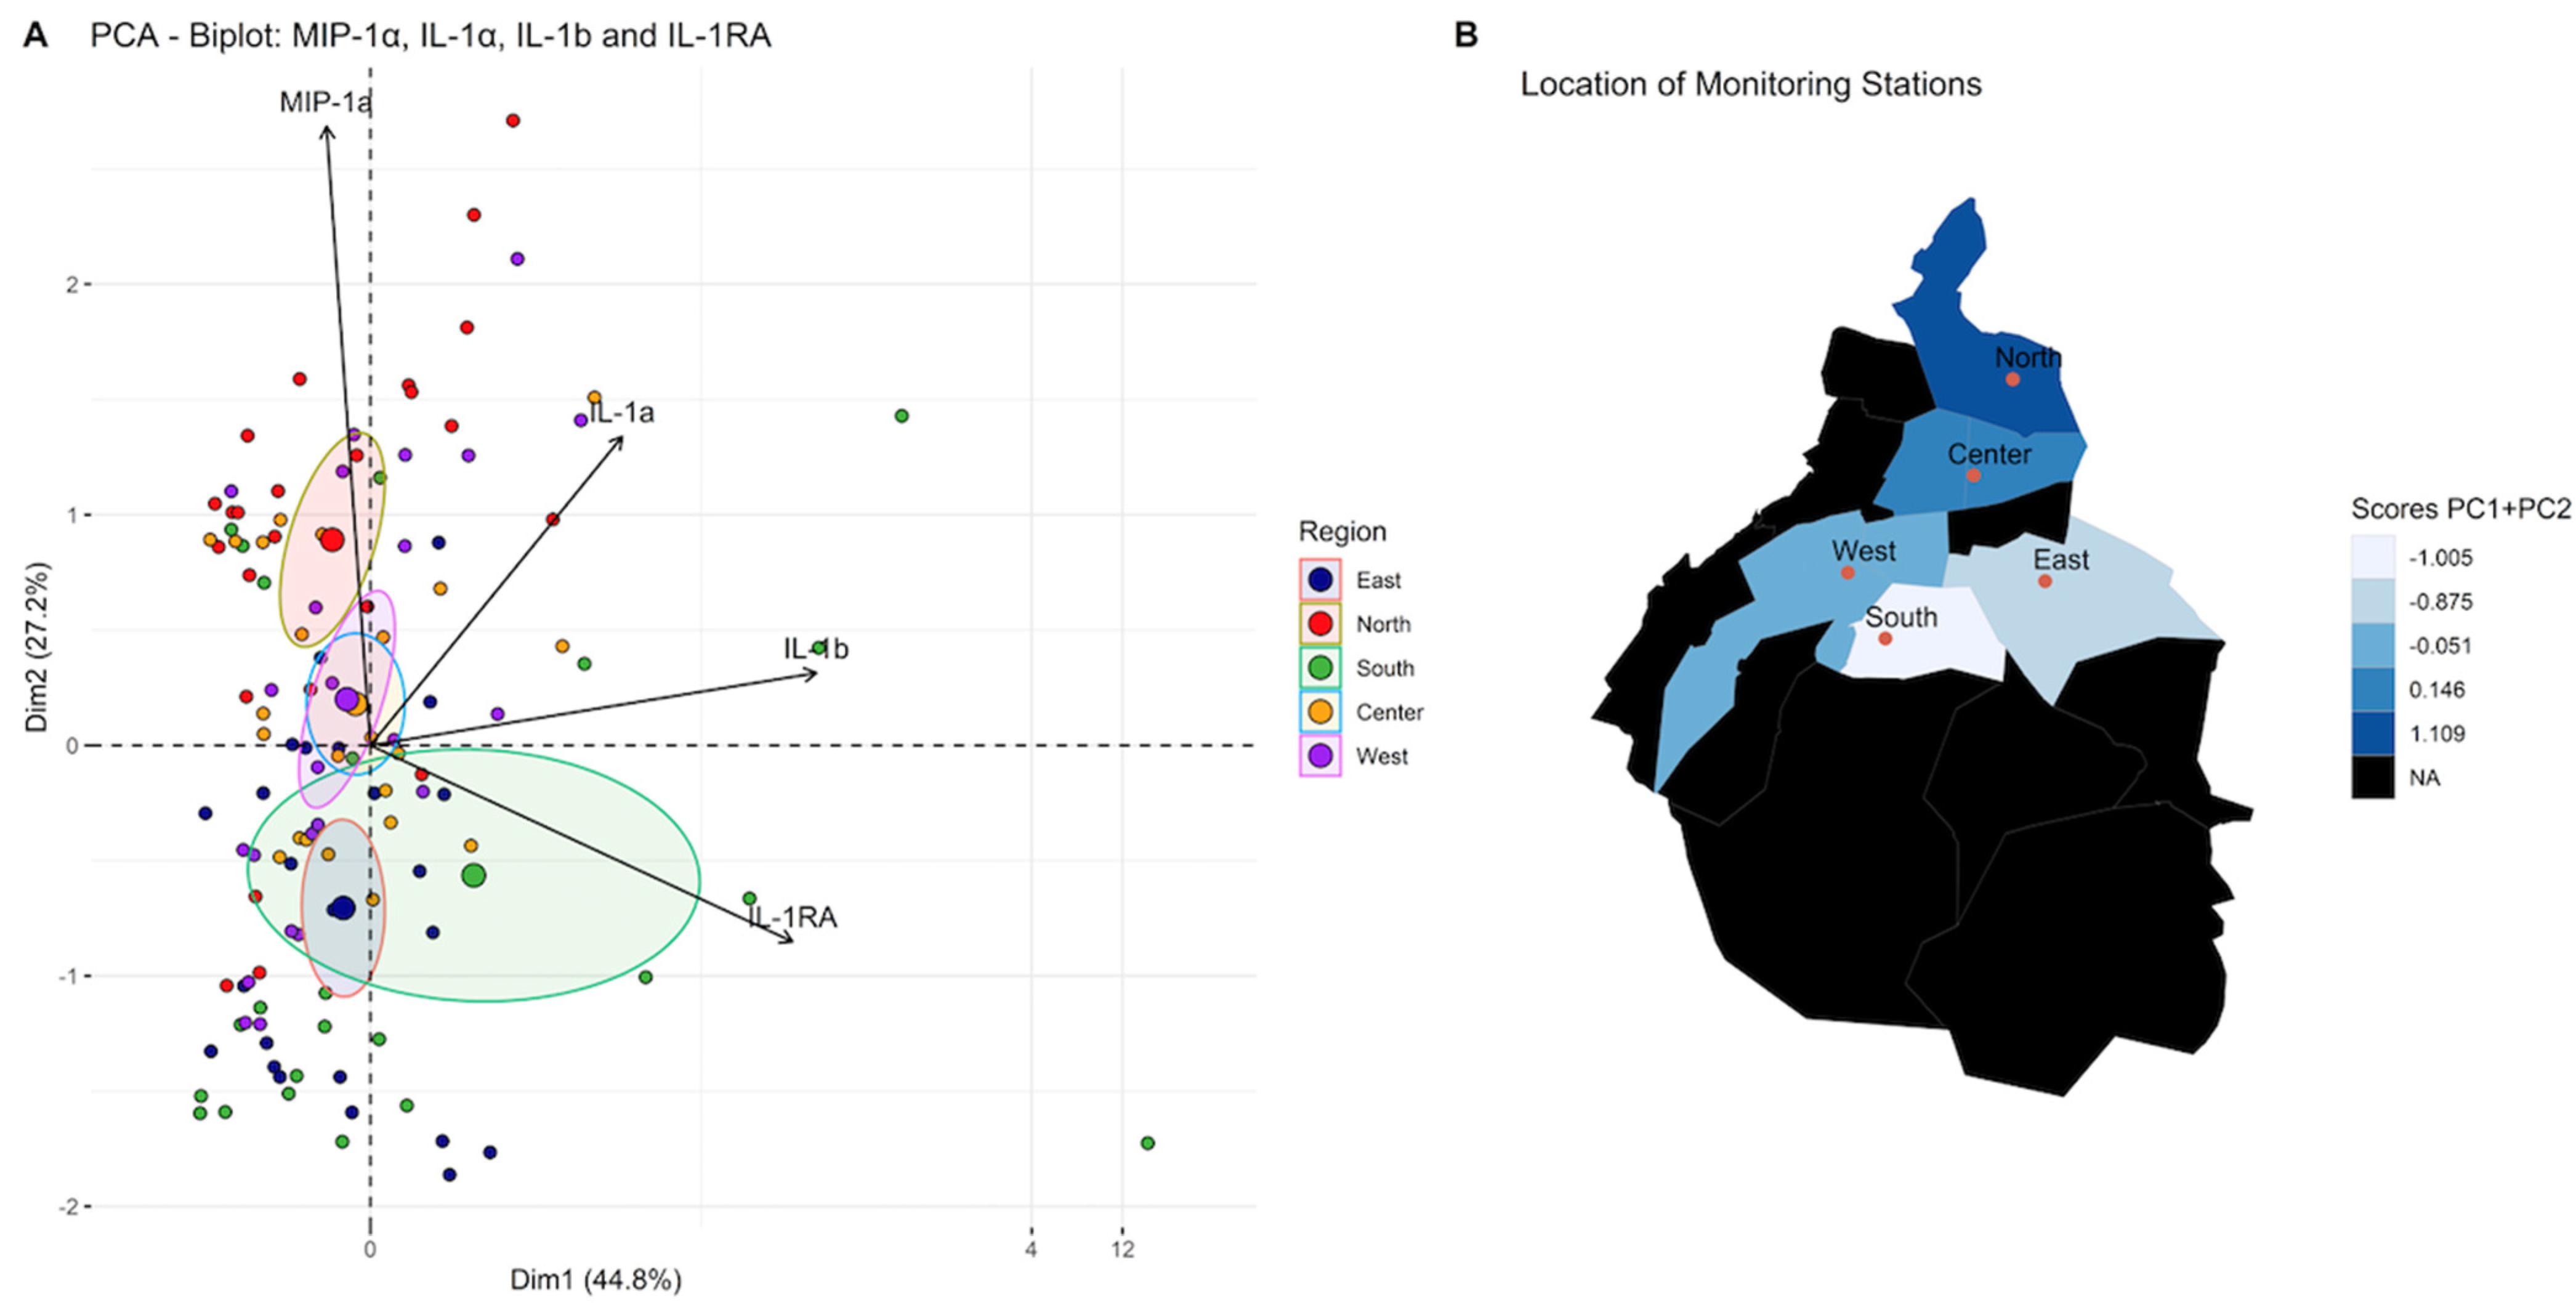
| Eigenvalue | Percentage of Variance | Cumulative Percentage of Variance | |
|---|---|---|---|
| MIP-1α | 1.7923532 | 44.808831 | 44.80883 |
| IL-1α | 1.0874345 | 27.185863 | 71.99469 |
| IL-1β | 0.8309943 | 20.774857 | 92.76955 |
| IL-1RA | 0.2892180 | 7.230449 | 100.00000 |
| Dim.1 | Dim.2 | Dim.3 | Dim.4 | |
|---|---|---|---|---|
| IL-1a | 0.50658333 | 0.4456352 | −0.7324773 | 0.09088234 |
| IL-1b | 0.89789048 | 0.1045237 | 0.2021667 | −0.37682372 |
| MIP-1a | −0.08845469 | 0.8931446 | 0.4266453 | 0.11154469 |
| IL-1RA | 0.84952635 | −0.2832159 | 0.2675326 | 0.35569656 |
Disclaimer/Publisher’s Note: The statements, opinions and data contained in all publications are solely those of the individual author(s) and contributor(s) and not of MDPI and/or the editor(s). MDPI and/or the editor(s) disclaim responsibility for any injury to people or property resulting from any ideas, methods, instructions or products referred to in the content. |
© 2024 by the authors. Licensee MDPI, Basel, Switzerland. This article is an open access article distributed under the terms and conditions of the Creative Commons Attribution (CC BY) license (https://creativecommons.org/licenses/by/4.0/).
Share and Cite
Meraz-Cruz, N.; Manzano-León, N.; Sandoval-Colin, D.E.; García de León Méndez, M.d.C.; Quintana-Belmares, R.; Tapia, L.S.; Osornio-Vargas, A.R.; Buxton, M.A.; O’Neill, M.S.; Vadillo-Ortega, F. Effects of PM10 Airborne Particles from Different Regions of a Megacity on In Vitro Secretion of Cytokines by a Monocyte Line during Different Seasons. Toxics 2024, 12, 149. https://doi.org/10.3390/toxics12020149
Meraz-Cruz N, Manzano-León N, Sandoval-Colin DE, García de León Méndez MdC, Quintana-Belmares R, Tapia LS, Osornio-Vargas AR, Buxton MA, O’Neill MS, Vadillo-Ortega F. Effects of PM10 Airborne Particles from Different Regions of a Megacity on In Vitro Secretion of Cytokines by a Monocyte Line during Different Seasons. Toxics. 2024; 12(2):149. https://doi.org/10.3390/toxics12020149
Chicago/Turabian StyleMeraz-Cruz, Noemi, Natalia Manzano-León, Daniel Eduardo Sandoval-Colin, María del Carmen García de León Méndez, Raúl Quintana-Belmares, Laura Sevilla Tapia, Alvaro R. Osornio-Vargas, Miatta A. Buxton, Marie S. O’Neill, and Felipe Vadillo-Ortega. 2024. "Effects of PM10 Airborne Particles from Different Regions of a Megacity on In Vitro Secretion of Cytokines by a Monocyte Line during Different Seasons" Toxics 12, no. 2: 149. https://doi.org/10.3390/toxics12020149
APA StyleMeraz-Cruz, N., Manzano-León, N., Sandoval-Colin, D. E., García de León Méndez, M. d. C., Quintana-Belmares, R., Tapia, L. S., Osornio-Vargas, A. R., Buxton, M. A., O’Neill, M. S., & Vadillo-Ortega, F. (2024). Effects of PM10 Airborne Particles from Different Regions of a Megacity on In Vitro Secretion of Cytokines by a Monocyte Line during Different Seasons. Toxics, 12(2), 149. https://doi.org/10.3390/toxics12020149